Abstract
SLC19A2 and SLC19A3, also known as thiamine transporters (THTR) 1 and 2, respectively, transport the positively charged thiamine (vitamin B1) into cells to enable its efficient utilization. SLC19A2 and SLC19A3 are also known to transport structurally unrelated cationic drugs, such as metformin, but whether this charge selectivity extends to other molecules, such as pyridoxine (vitamin B6), is unknown. We tested this possibility using Madin-Darby canine kidney II (MDCKII) cells and human embryonic kidney 293 (HEK293) cells for transfection experiments, and also using Caco-2 cells as human intestinal epithelial model cells. The stable expression of SLC19A2 and SLC19A3 in MDCKII cells (as well as their transient expression in HEK293 cells) led to a significant induction in pyridoxine uptake at pH 5.5 compared with control cells. The induced uptake was pH-dependent, favoring acidic conditions over neutral to basic conditions, and protonophore-sensitive. It was saturable as a function of pyridoxine concentration, with an apparent Km of 37.8 and 18.5 μm, for SLC19A2 and SLC19A3, respectively, and inhibited by the pyridoxine analogs pyridoxal and pyridoxamine as well as thiamine. We also found that silencing the endogenous SLC19A3, but not SLC19A2, of Caco-2 cells with gene-specific siRNAs lead to a significant reduction in carrier-mediated pyridoxine uptake. These results show that SLC19A2 and SLC19A3 are capable of recognizing/transporting pyridoxine, favoring acidic conditions for operation, and suggest a possible role for these transporters in pyridoxine transport mainly in tissues with an acidic environment like the small intestine, which has an acidic surface microclimate.
Keywords: SLC19A2, SLC19A3, transporter, membrane transport, pyridoxine, thiamine, vitamin, Caco-2 cell, intestine, absorption, membrane transport, pyridoxine
Pyridoxine is one of the vitamin B6 compounds, which include the structurally analogous pyridoxal and pyridoxamine. Because of its hydrophilic nature as a water-soluble vitamin, it cannot easily permeate across the cellular membrane by simple diffusion and, hence, is required for intestinal absorption a specialized carrier-mediated transport system (1). Indeed, carrier-mediated transport of pyridoxine has been observed in the Caco-2 cell line, a human intestinal epithelial cell model (2). Although transporters have been identified for a variety of water-soluble vitamins (1), none have been identified as yet for pyridoxine, although transport properties consistent with a carrier-mediated mechanism have been noted in many different cell types (3–5). In the current study, we explored whether SLC19A2 and SLC19A3, known thiamine transporter 1 (THTR1) and THTR2 (6, 7), respectively, can also transport pyridoxine, based upon the fact that both pyridoxine and thiamine (vitamin B1) have cationic charge and that other structurally unrelated cationic drugs, such as metformin, fedratinib, and trimethoprim, are substrates for these transporters (8, 9). The data indicate that pyridoxine is indeed also their substrate.
Results
Uptake of pyridoxine in transient transfectant HEK293 cells
We first examined the uptake of pyridoxine at its trace concentration of 5 nm in transient transfectant human embryonic kidney 293 (HEK293) cells expressing each of SLC19A2 and SLC19A3. The trace concentration was used so that the potential transport activities could be detected most effectively, as transporters generally operate more efficiently at lower concentrations. This low concentration is also physiologically relevant, as pyridoxin concentration can be in the nanomolar range at the lowest end in body fluids, typically in plasma (10). As shown in Fig. 1, the uptake of pyridoxine was found to be much greater in cells expressing those SLC19As than in mock cells at an acidic pH of 5.5, suggesting that those SLC19As can transport pyridoxine efficiently. On the other hand, pyridoxine uptake was not altered by transient introduction of SLC19A1, suggesting that this transporter, which is another member of SLC19A family and known as reduced folate carrier 1, does not have such a capability for pyridoxine transport.
Figure 1.
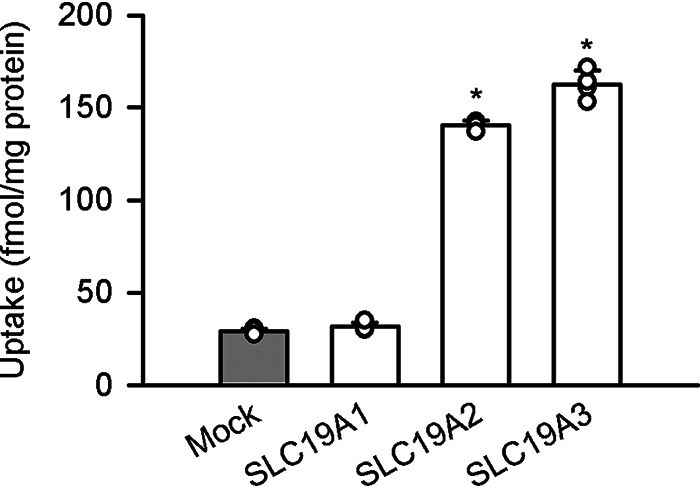
Pyridoxine uptake in HEK293 cells transiently expressing SLC19A transporters. The uptake of [3H]pyridoxine (5 nm) was evaluated for 3 min at pH 5.5 and 37 °C. Data are presented as the mean ± S.D. (n = 4). *, p < 0.05 compared with mock cells, as assessed by ANOVA followed by Dunnett's test.
Time course of pyridoxine uptake in stable transfectant MDCKII cells
For detailed characterization of pyridoxine transport by SLC19A2 and SLC19A3, we prepared stable transfectant Madin-Darby canine kidney II (MDCKII) cells expressing each of them. As shown in Fig. 2, the uptake of pyridoxine (5 nm) was much greater in cells expressing those SLC19As than in mock cells at pH 5.5, further demonstrating the pyridoxine transport capability of both transporters, which was initially found in the transient transfectant HEK293 cells. As pyridoxine uptake increased in proportion to time up to 3 min in all the transfectant and mock cells, the uptake period was set to be 3 min in subsequent experiments for the evaluation of pyridoxine transport by those SLC19As in the initial uptake phase.
Figure 2.
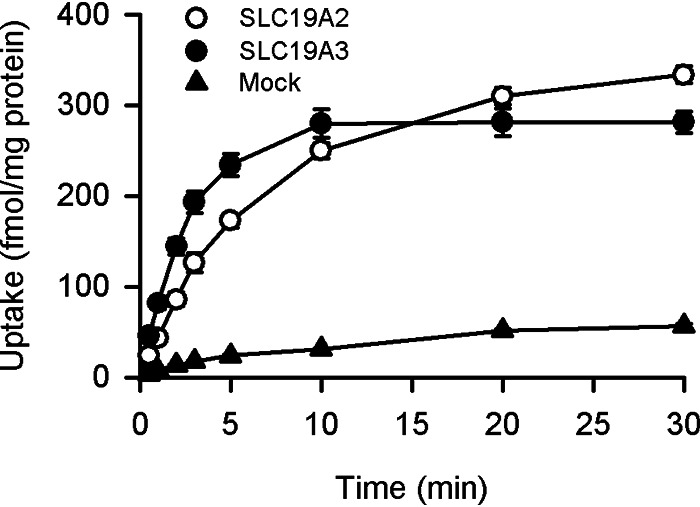
Time course of pyridoxine uptake in MDCKII cells stably expressing SLC19A2 and SLC19A3. The uptake of [3H]pyridoxine (5 nm) was evaluated at pH 5.5 and 37 °C. Data are presented as the mean ± S.E. (n = 4).
The uptake of pyridoxine was almost equilibrated at 30 min in both SLC19A2-transfected and SLC19A3-transfected cells. Using the cellular volumes of 6.5 ± 1.1 and 6.4 ± 1.1 μl/mg of protein (mean ± S.E., n = 3), respectively, estimated from the equilibrium uptake of 3-O-methyl-d-glucose (3-O-MG) in those cells, the apparent intracellular concentrations of pyridoxine were estimated to be 43 and 52 nm, respectively. They were about 10 times higher than the pyridoxine concentration in the extracellular solution, suggesting that those SLC19As could possibly operate in an active transport mode that enables pyridoxine to be concentrated in the cells. In this analysis, the cellular volume was estimated as the uptake/concentration ratio of 3-O-MG (11), as the uptake of this unmetabolizable analog of d-glucose could be quickly equilibrated in MDCKII cells at the intracellular concentration equal to the concentration in the extracellular solution by nonconcentrative transport, in which facilitative glucose transporters have been suggested to be involved (12, 13). Consistent with that suggestion, 3-O-MG uptake was confirmed to be Na+-independent and quite rapid, being equilibrated within 10 min, in those transfectant MDCKII cells.
Effect of pH and ionic conditions on pyridoxine transport by SLC19A2 and SLC19A3
Both SLC19A2 and SLC19A3 have been reported to operate in a pH-dependent manner, favoring neutral to basic conditions over acidic conditions, for thiamine transport (6, 7). However, for pyridoxine transport, they were both found to operate in an opposite manner of pH dependence, favoring acidic conditions over neutral to basic conditions, as indicated by an increase in the specific uptake of pyridoxine (5 nm) by each transporter with a decrease in pH in stable transfectant MDCKII cells (Fig. 3). Moreover, the specific uptake by SLC19A2 and SLC19A3 were both extensively reduced by protonophores of carbonyl cyanide p-trifluoromethoxyphenylhydrazone (FCCP) and carbonyl cyanide m-chlorophenylhydrazone (CCCP), suggesting that they may operate for pyridoxine transport in a manner coupled with proton or, at least, facilitated by an inward proton gradient (Fig. 4). Supporting these additionally, the specific uptakes by both SLC19As were, as assessed using uptake solution in which NaCl was replaced with KCl, reduced by intracellular acidification for dissipation of H+ gradient by nigericin (10 μm), a K+/H+-exchanging protonophore, and also by an NH4Cl prepulse method, in which the cells were pretreated with substrate-free uptake solution containing NH4Cl (20 mm) and subsequently with the one free of NH4Cl (14). The values of specific uptake rate were 42.9 ± 2.0% of control (39.5 ± 2.3 fmol/min/mg of protein) and 38.6 ± 3.3% of control (71.6 ± 3.8 fmol/min/mg of protein), respectively, for SLC19A2 and SLC19A3 in the experiments using nigericin, and 62.9 ± 7.7% (47.6 ± 5.2 fmol/min/mg of protein) and 43.7 ± 6.6% of control (65.9 ± 11.2 fmol/min/mg of protein), respectively, in those by NH4Cl prepulse, where the values are presented as the mean ± S.E. (n = 4) and all the differences are significant at p < 0.05 compared with respective control values. It should also be noted in addition that pyridoxine, which is a basic compound with the pKa of 5.1 (15), becomes progressively cationized with a decrease in pH in the near neutral to acidic pH range, coinciding to the pH-dependent increase in the specific uptake of pyridoxine. Hence, the increase in the cationized fraction of pyridoxine may also be involved in that, implicating the preferential transport of its cationized form by those SLC19As as a possibility. Thus, those SLC19As were suggested to operate in a different mode for pyridoxine than for thiamine, discriminating them. Although the mechanism of the substrate-dependent difference in pH dependence is unknown at this time, we conducted all the other experiments in this study at pH 5.5 as an acidic pH where both SLC19As can operate efficiently.
Figure 3.
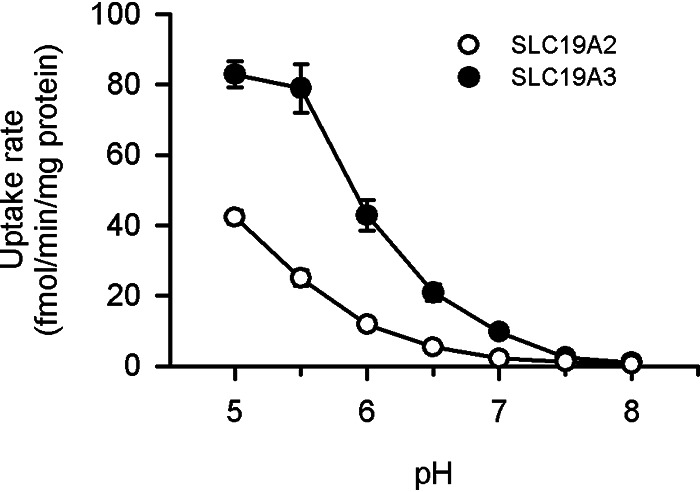
Effect of pH on pyridoxine uptake by SLC19A2 and SLC19A3 stably expressed in MDCKII cells. The specific uptake of [3H]pyridoxine (5 nm) by SLC19A2 and SLC19A3 was evaluated for 3 min at 37 °C. Data are presented as the mean ± S.E. (n = 4).
Figure 4.
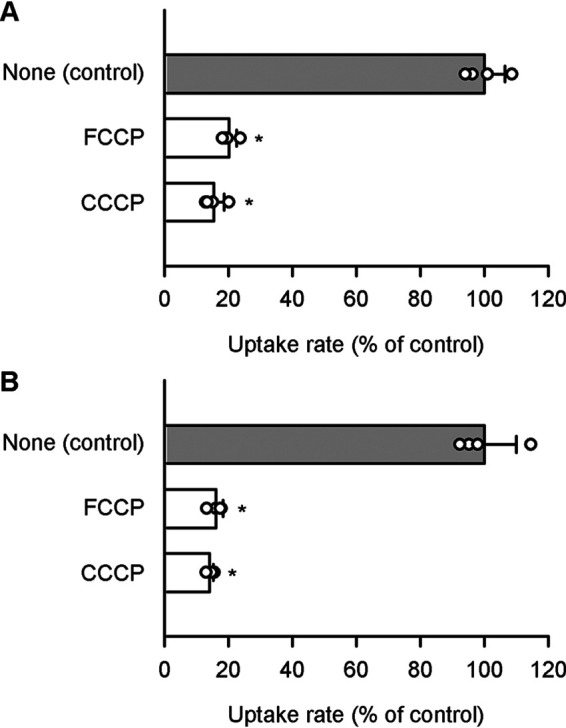
Effect of protonophores on pyridoxine uptake by SLC19A2 and SLC19A3 stably expressed in MDCKII cells. The specific uptake of [3H]pyridoxine (5 nm) by SLC19A2 (A) and SLC19A3 (B) was evaluated for 3 min at pH 5.5 and 37 °C in the presence of a protonophore (100 μm), or in its absence (control), after pretreatment for 5 min with, or without, the protonophore under the same condition. The control values were 47.5 and 87.8 fmol/min/mg of protein, for SLC19A2 and SLC19A3, respectively. Data are presented as the mean ± S.D. (n = 4). *, p < 0.05 compared with control, as assessed by ANOVA followed by Dunnett's test.
The replacement of NaCl in the medium with various salts (KCl, Na-gluconate, K-gluconate, and mannitol) had insignificant or only modest impacts on the specific uptake of pyridoxine (5 nm) by SLC19A2 (Fig. 5A) and SLC19A3 (Fig. 5B). The specific uptake by SLC19A2 was reduced slightly by replacement of NaCl with KCl and, to a comparable extent, by replacement with mannitol, suggesting that Na+ may be slightly involved in the SLC19A2 operation but Cl− may not. The specific uptake by SLC19A3 was reduced modestly by replacement of NaCl with mannitol, but not by replacement with KCl, suggesting that Cl− may be slightly involved in the SLC19A3 operation but Na+ may not. However, overall, such effects of those ions seemed to be only modest, suggesting at least that both SLC19A2 and SLC19A3 are unlikely to operate in a manner coupled with Na+ or Cl− for pyridoxine transport.
Figure 5.
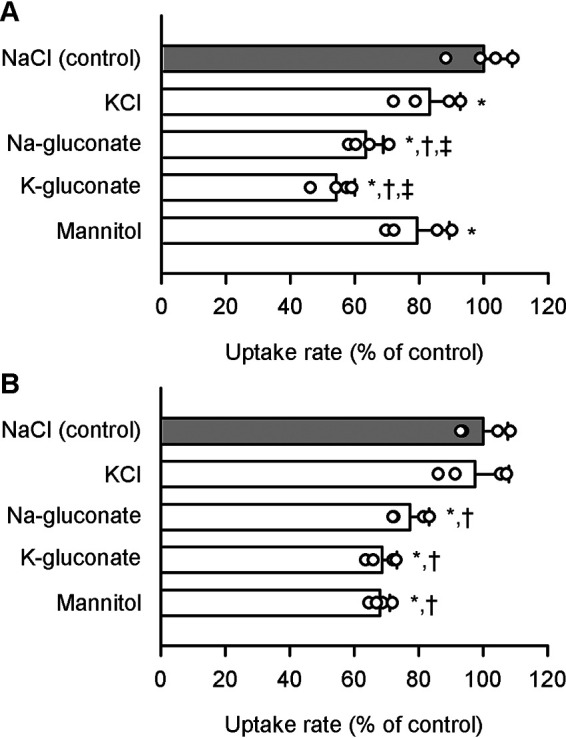
Effect of ionic conditions on pyridoxine uptake by SLC19A2 and SLC19A3 stably expressed in MDCKII cells. The specific uptake of [3H]pyridoxine (5 nm) by SLC19A2 (A) and SLC19A3 (B) was evaluated for 3 min at pH 5.5 and 37 °C. NaCl in the uptake solution for control was replaced as indicated. The control values were 47.5 and 73.4 fmol/min/mg of protein, for SLC19A2 and SLC19A3, respectively. Data are presented as the mean ± S.D. (n = 4). *, p < 0.05 compared with NaCl (control); †, p < 0.05 compared with KCl; ‡, p < 0.05 compared with mannitol. Statistical differences were assessed by ANOVA followed by Dunnett's test.
Effect of pyridoxine-related compounds and water-soluble vitamins on pyridoxine transport by SLC19A2 and SLC19A3
To examine a possibility that some other pyridoxine-related compounds may also be recognized by SLC19A2 and SLC19A3, we here assessed the effect of such compounds (200 μm) on the specific uptake of pyridoxine (5 nm) by those SLC19As in stable transfectant MDCKII cells. As shown in Fig. 6A, the specific uptake by SLC19A2 was extensively inhibited by pyridoxamine and, to a lesser extent, by 4-deoxypyridoxine. Pyridoxal, pyridoxal 5-phosphate (PLP), and 4-pyridoxic acid were, however, found not to inhibit the specific uptake. SLC19A3 exhibited almost the same characteristics, although pyridoxal exhibited a slight inhibitory effect as a minor difference (Fig. 6B). These results suggested the potential interaction of pyridoxamine and 4-deoxypyridoxine with both SLC19As and of pyridoxal with SLC19A3 to elicit the inhibitory effects.
Figure 6.
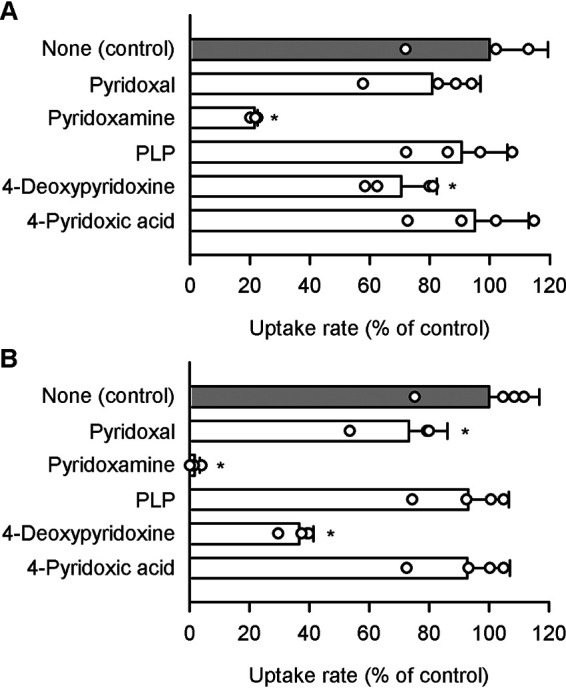
Effect of pyridoxine-related compounds on pyridoxine uptake by SLC19A2 and SLC19A3 stably expressed in MDCKII cells. The specific uptake of [3H]pyridoxine (5 nm) by SLC19A2 (A) and SLC19A3 (B) was evaluated for 3 min at pH 5.5 and 37 °C in the presence of a test compound (200 μm) or in its absence (control). The control values were 79.5 and 95.0 fmol/min/mg of protein, for SLC19A2 and SLC19A3, respectively. Data are presented as the mean ± S.D. (n = 4). *, p < 0.05 compared with control, as assessed by ANOVA followed by Dunnett's test.
Among water-soluble vitamins, the SLC19A2/3 substrate of thiamine was an only and potent inhibitor for both SLC19A2 and SLC19A3 (Fig. 7). All the other vitamins were confirmed not to inhibit the specific uptake by either of those SLC19As. As a note, specific transporters have already been identified for almost all of them, with the only exception being nicotinamide.
Figure 7.
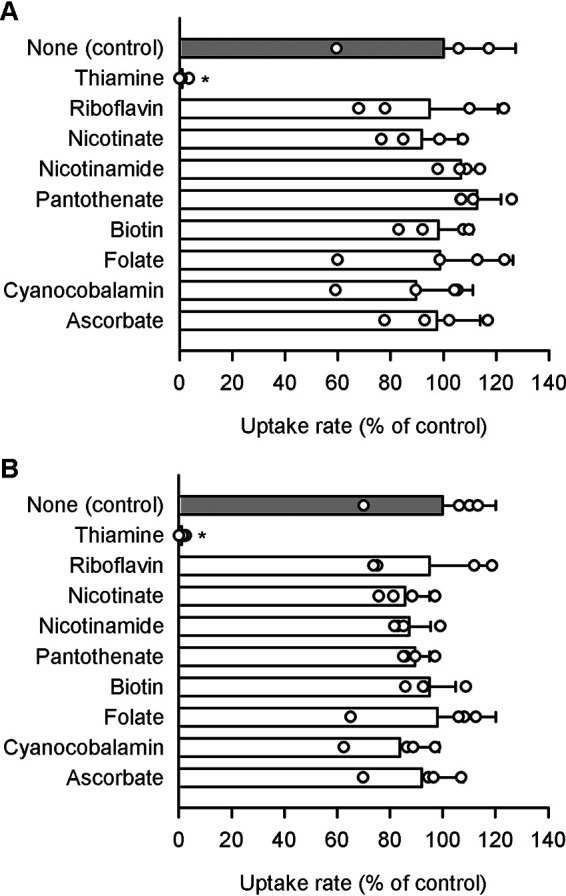
Effect of water-soluble vitamins on pyridoxine uptake by SLC19A2 and SLC19A3 stably expressed in MDCKII cells. The specific uptake of [3H]pyridoxine (5 nm) by SLC19A2 (A) and SLC19A3 (B) was evaluated for 3 min at pH 5.5 and 37 °C in the presence of a test compound (200 μm) or in its absence (control). The control values were 76.6 and 93.5 fmol/min/mg of protein, for SLC19A2 and SLC19A3, respectively. Data are presented as the mean ± S.D. (n = 4). *, p < 0.05 compared with control, as assessed by ANOVA followed by Dunnett's test.
Focusing on thiamine and the vitamin B6 compounds of pyridoxal and pyridoxamine, analyses were conducted for detailed characterization of their concentration-dependent inhibitory effects on the specific uptake of pyridoxine (5 nm) by SLC19A2 and SLC19A3, as shown in Fig. 8 and Table 1. The IC50 values of thiamine, the most potent inhibitor for the both, were comparable, being 0.71 and 0.99 μm, respectively, for SLC19A2 and SLC19A3. Those of pyridoxamine, the second most potent of the two, were quite different, being much higher for SLC19A2 (55.16 μm) than for SLC19A3 (2.97 μm). Those of pyridoxal, the least potent of the two, were relatively close, although being somewhat higher for SLC19A2 (1.49 mm) than for SLC19A3 (0.52 mm). The IC50 of pyridoxal for SLC19A2 was high enough not to elicit detectable inhibition at its concentration of 200 μm, whereas that for SLC19A3 was at a level sufficient to elicit a modest inhibition, consistent with the results in Fig. 6. All the Hill coefficient (n) values were comparable with unity, suggesting the competitive or noncompetitive type of inhibition conforming to the Michaelis-Menten model.
Figure 8.
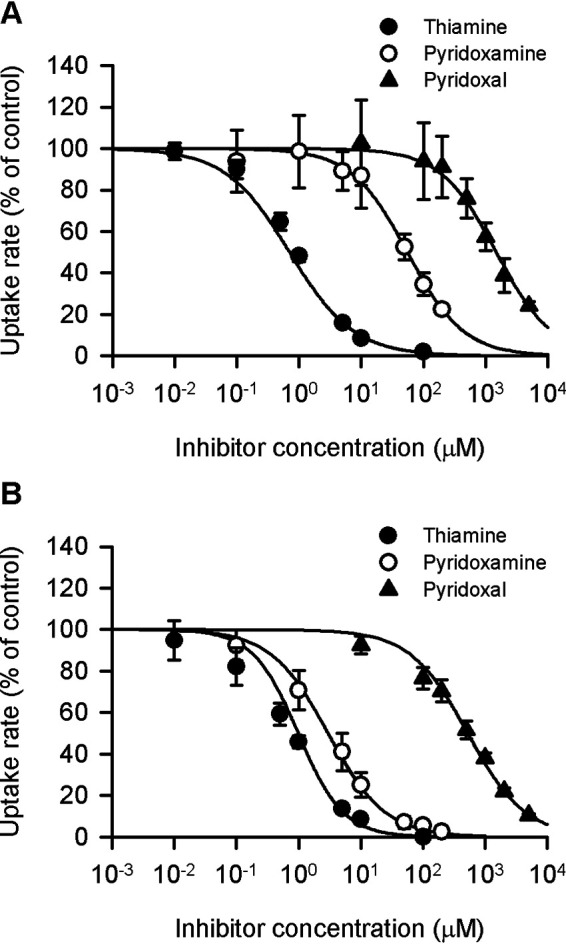
Concentration-dependent inhibition of SLC19A2- and SCL19A3-mediated pyridoxine uptake by selected compounds in stable transfectant MDCKII cells. The specific uptake of [3H]pyridoxine (5 nm) by SLC19A2 (A) and SLC19A3 (B) was evaluated for 3 min at pH 5.5 and 37 °C in the presence of a test compound at varied concentrations or in its absence for control. The control values were 58.2, 74.4, and 70.2 fmol/min/mg of protein, for thiamine, pyridoxamine, and pyridoxal, respectively, in experiments for SLC19A2, and 91.6, 98.0, and 98.3 fmol/min/mg of protein, respectively, in those for SLC19A3. The estimated parameters of IC50 and the Hill coefficient (n) are presented in Table 1. Data are presented as the mean ± S.E. (n = 3).
Table 1.
Parameters for the inhibition of SLC19A2- and SLC19A3-mediated pyridoxine transport by selected compounds in stable transfectant MDCKII cells
The values of the Hill coefficient (n) and IC50 were determined for the inhibition profiles shown in Fig. 8 and those of the inhibition constant (Ki) were determined for those shown in Fig. 9. The parameter values are presented as the mean ± S.E. (n = 3).
| Compound | Transporter | n | IC50 | Ki |
|---|---|---|---|---|
| Thiamine | SLC19A2 | 0.84 ± 0.07 | 0.71 ± 0.08 µm | 1.11 ± 0.12 µm |
| SLC19A3 | 1.20 ± 0.12 | 0.99 ± 0.14 µm | 0.86 ± 0.12 µm | |
| Pyridoxamine | SLC19A2 | 0.96 ± 0.01 | 55.16 ± 5.64 µm | 90.08 ± 7.77 µm |
| SLC19A3 | 0.94 ± 0.12 | 2.97 ± 0.85 µm | 1.57 ± 0.32 µm | |
| Pyridoxal | SLC19A2 | 0.97 ± 0.03 | 1.49 ± 0.22 mm | 2.63 ± 0.50 mm |
| SLC19A3 | 0.94 ± 0.05 | 0.52 ± 0.04 mm | 0.38 ± 0.03 mm |
Kinetic analyses of pyridoxine transport by SLC19A2 and SLC19A3
Both SLC19A2 and SLC19A3 were found to mediate pyridoxine transport in a highly saturable manner, as indicated by the concentration-dependent profiles of specific pyridoxine uptake (Fig. 9). According to kinetic analyses using the Michaelis-Menten model, the Vmax and Km were 332 pmol/min/mg of protein and 37.8 μm, respectively, for SLC19A2, and 264 pmol/min/mg of protein and 18.5 μm, respectively, for SLC19A3 (Table 2). Thus, the Km values for those SLC19As were comparable, suggesting their comparable affinities for pyridoxine. It should also be noted that the pyridoxine concentration of 5 nm, which was used in regular experiments, was confirmed to be in the linear phase of transport kinetics at concentrations much below the Km values for both SLC19As, where their transport activities were highest and could be evaluated most effectively.
Figure 9.
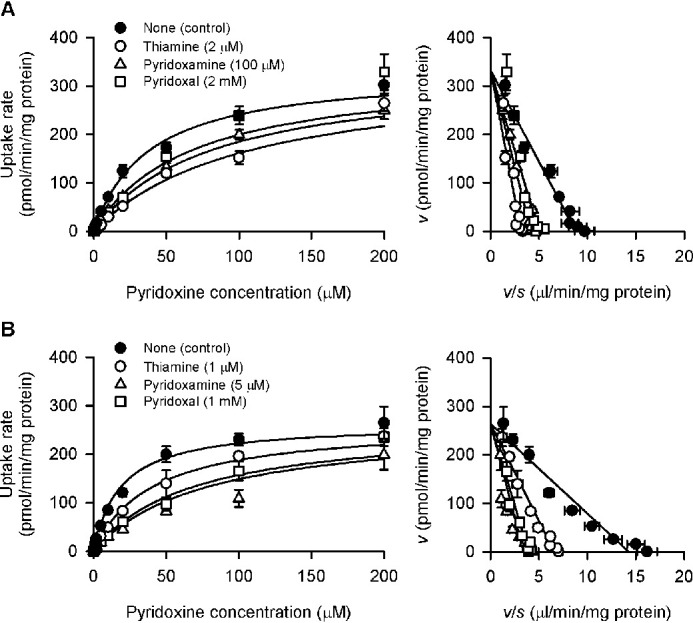
Effect of selected compounds on concentration-dependent pyridoxine uptake by SLC19A2 and SLC19A3 stably expressed in MDCKII cells. The specific uptake of [3H]pyridoxine by SLC19A2 (A) and SLC19A3 (B) was evaluated at varied concentrations for 3 min at pH 5.5 and 37 °C in the presence of a test compound or in its absence for control. The profiles are transformed into the Eadie-Hofstee format in the right panels. The estimated values of Vmax, Km, and the inhibition constant (Ki) are presented in Table 2. The Ki values of thiamine are also presented in Table 1 for comparison with the IC50 values. Data are presented as the mean ± S.E. (n = 3).
Table 2.
Parameters for the SLC19A2- and SLC19A3-mediated transport of pyridoxine and thiamine in stable transfectant MDCKII cells
The values of Vmax and Km were determined for the profiles shown in Figs. 9 (pyridoxine), 11 (thiamine, pH 7.4), and 12 (thiamine, pH 5.5). The values of the inhibition constant (Ki) of pyridoxine and thiamine were determined for their inhibitory effects on thiamine transport (Fig. 12) and pyridoxine transport (Fig. 9), respectively. The parameter values are presented as the mean ± S.E. (n = 3).
| Compound | Transporter | pH | Vmax | Km | Ki |
|---|---|---|---|---|---|
| pmol/min/mg of protein | µm | µm | |||
| Pyridoxine | SLC19A2 | 5.5 | 332 ± 23 | 37.8 ± 6.7 | 49.6 ± 1.7 |
| SLC19A3 | 5.5 | 264 ± 29 | 18.5 ± 1.5 | 13.8 ± 2.0 | |
| Thiamine | SLC19A2 | 7.4 | 106 ± 9 | 2.83 ± 0.42 | - |
| 5.5 | 100 ± 10 | 3.66 ± 0.68a | 1.11 ± 0.12 | ||
| SLC19A3 | 7.4 | 65.9 ± 9.5 | 2.36 ± 0.37 | - | |
| 5.5 | 26.9 ± 0.8b | 2.33 ± 0.27 | 0.86 ± 0.12 |
a Statistical differences were assessed by Student's t test. p < 0.1 compared with the value at pH 7.4.
b Statistical differences were assessed by Student's t test. p < 0.05 compared with the value at pH 7.4.
The profiles of the inhibition of the specific uptake of pyridoxine by thiamine, pyridoxamine, and pyridoxal were all found to conform to the competitive inhibition model (Fig. 9), with the values of inhibition constant (Ki) being comparable with the respective IC50 values determined in Fig. 8 (Table 1). These results suggest that the vitamin B6 compounds of pyridoxamine and pyridoxal may be competing substrates recognized at the pyridoxine-binding site in both SLC19As. Cationic characteristic in addition to structural similarity to pyridoxine may be important for pyridoxine-related compounds to be recognized by SLC19A2 and SLC19A3, as PLP and 4-pyridoxic acid, which are less cationic pyridoxine derivatives because of having anionic moieties, did not inhibit the specific uptake of pyridoxine by either of the SLC19As (Fig. 6), suggesting no affinity for them. Thus, those SLC19As may have some multispecific characteristics within that limitation. 4-Deoxypyridoxine, a pyridoxine derivative that does not have an acidic moiety, may also be recognized as a competing substrate by those SLC19As, as this pyridoxine derivative inhibited specific pyridoxine uptake by them (Fig. 6).
Kinetic analyses of the effect of pyridoxine on thiamine transport by SLC19A2 and SLC19A3
To further clarify the interrelation between pyridoxine transport and thiamine transport in the operation of each of SLC19A2 and SLC19A3, we examined the effect of pyridoxine on thiamine transport by those SLC19As. The uptake of thiamine was first examined at a trace concentration of 5 nm, the same low concentration as that in regular assessments of pyridoxine transport, and at pH 7.4, as those SLC19As have been reported to operate more efficiently under neutral to basic conditions than acidic conditions (6, 7). As shown in Fig. 10, the uptake was much greater in cells expressing those SLC19As than in mock cells, demonstrating their known ability to transport thiamine. As thiamine uptake increased in proportion to time up to 1 min in all the transfectant and mock cells, the uptake period was set to be 1 min in subsequent experiments for the evaluation of thiamine transport by those SLC19As in the initial uptake phase.
Figure 10.
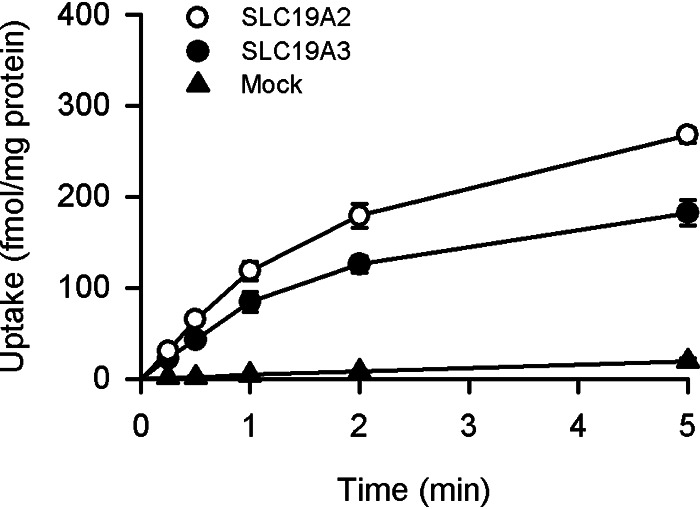
Time course of thiamine uptake in MDCKII cells stably expressing SLC19A2 and SLC19A3. The uptake of [3H]thiamine (5 nm) was evaluated at pH 7.4 and 37 °C. Data are presented as the mean ± S.E. (n = 3).
The specific uptakes of thiamine (5 nm) by SLC19A2 and SLC19A3 were smaller at pH 5.5 than at pH 7.4 by 34 and 64%, respectively (Table 3). These moderately pH-dependent characteristics of thiamine transport were in agreement with those reported earlier (6, 7). The inhibitory effects of pyridoxine (200 μm) on the specific uptakes of thiamine by SLC19A2 and SLC19A3 were quite extensive, reducing them to 24.0 and 8.9% of control, respectively, at pH 5.5, whereas its inhibitory effects were insignificant or only minimal at pH 7.4. These pH-dependent characteristics of the effect of pyridoxine on thiamine transport were consistent with those of pyridoxine transport by those SLC19As, which were indicative of the higher interaction of pyridoxine with them for its greater transport at pH 5.5 than at pH 7.4 (Fig. 3).
Table 3.
Effect of pyridoxine on thiamine uptake by SLC19A2 and SLC19A3 stably expressed in MDCKII cells
The specific uptake of [3H]thiamine (5 nm) by SLC19A2 and SLC19A3 was evaluated for 1 min at the specified pH and 37 °C in the presence of pyridoxine (200 μm) or in its absence (control). Data are presented as the mean ± S.E. (n = 3).
| Transporter | pH | Thiamine uptake rate |
||
|---|---|---|---|---|
| None (Control) | Pyridoxine | |||
| fmol/min/mg of protein | % control | |||
| SLC19A2 | 7.4 | 203 ± 16 | 168 ± 12 | 82.9 ± 5.7 |
| 5.5 | 133 ± 4a | 32 ± 1b | 24.0 ± 0.6a | |
| SLC19A3 | 7.4 | 170 ± 19 | 100 ± 5b | 58.6 ± 3.0 |
| 5.5 | 58 ± 3a | 5 ± 0.3b | 8.9 ± 0.5a | |
a Statistical differences were assessed by Student's t test. p < 0.05 compared with the value at pH 7.4.
b Statistical differences were assessed by Student's t test. p < 0.05 compared with control.
The saturable profiles of the specific uptake of thiamine by SLC19A2 and SLC19A3 were kinetically assessed at pH 7.4 (Fig. 11) and also at pH 5.5 (Fig. 12), and the estimated parameters are summarized in Table 2. At pH 7.4, the Vmax values were 106 and 65.9 pmol/min/mg of protein, respectively, for SLC19A2 and SLC19A3, and the Km values were 2.83 and 2.36 μm, respectively. These Km values were comparable with the previously reported values of 2.5 and 3.16 μm, respectively (6, 8). At pH 5.5, the Vmax values were 100 and 26.9 pmol/min/mg of protein, respectively, for SLC19A2 and SLC19A3, and Km values were 3.66 and 2.33 μm, respectively. These Km values were comparable with the Ki values of 1.11 and 0.86 μm, respectively, for the inhibition of pyridoxine transport by thiamine (Table 2), suggesting that the interaction of thiamine with those SLC19As for its transport is possibly linked to its inhibitory action for pyridoxine transport. It is notable that, for SLC19A2, the Km was indicated to be increased with a decrease in pH, whereas Vmax was unchanged. Although the extent of decrease in Km was not large enough to be statistically significant, the trend was indicated at p < 0.1. To the contrary, for SLC19A3, the Vmax was indicated to be decreased, whereas Km was unchanged. Therefore, different mechanisms may be involved in the pH-dependent alterations in thiamine transport by those SLC19As. It should also be noted that the thiamine concentration of 5 nm, which was used in preceding experiments, was confirmed to be in the linear phase of transport kinetics at concentrations much below the Km values for both SLC19As, where their transport activities were highest and could be evaluated most effectively.
Figure 11.
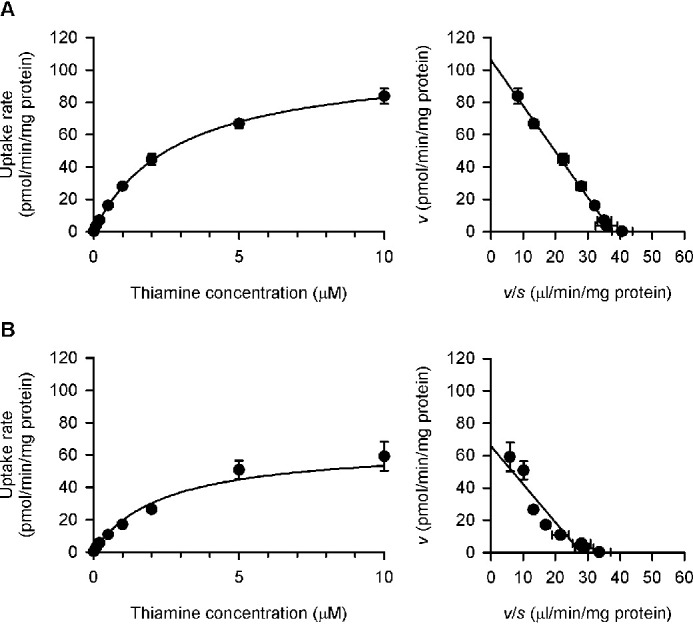
Concentration-dependent uptake of thiamine by SLC19A2 and SLC19A3 stably expressed in MDCKII cells under the near neutral conditions. The specific uptake of [3H]thiamine by SLC19A2 (A) and SLC19A3 (B) was evaluated at varied concentrations for 1 min at pH 7.4 and 37 °C. The estimated values of Vmax and Km are presented in Table 2. Data are presented as the mean ± S.E. (n = 3).
Figure 12.
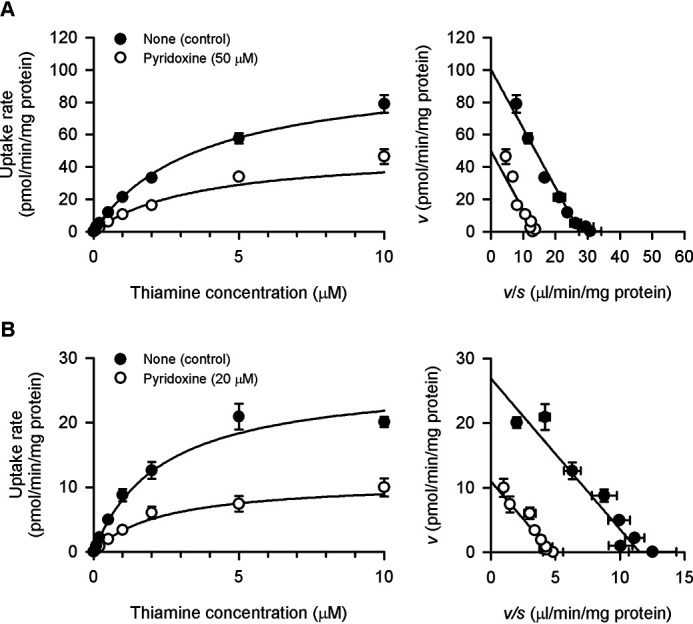
Effect of pyridoxine on concentration-dependent thiamine uptake by SLC19A2 and SLC19A3 stably expressed in MDCKII cells under the acidic conditions. The specific uptake of [3H]thiamine by SLC19A2 (A) and SLC19A3 (B) was evaluated at varied concentrations for 1 min at pH 5.5 and 37 °C in the presence of pyridoxine or absence for control. The profiles are transformed into the Eadie-Hofstee format in the right panels. The estimated values of Vmax, Km, and the inhibition constant (Ki) are presented in Table 2. Data are presented as the mean ± S.E. (n = 3).
The analyses of the inhibitory effect of pyridoxine on the specific uptake of thiamine at pH 5.5 indicated the noncompetitive type of inhibition for both SLC19As (Fig. 12). This is an unexpected result, as pyridoxine, of which the transport was indicated to be competitively inhibited by thiamine (Fig. 9), should inhibit thiamine transport competitively, according to the Michaelis-Menten model. It is notable, however, that the Ki values of 49.6 and 13.8 μm, respectively, for SLC19A2 and SLC19A3 were comparable with the Km values of 37.8 and 18.5 μm, respectively, for pyridoxine transport, suggesting that the interaction of pyridoxine with those SLC19As for its transport is possibly linked to its apparently noncompetitive type of inhibitory action for thiamine transport. It seems that some kind of unknown mechanism is involved in the interrelationship between pyridoxine transport and thiamine transport in the operation of each of those SLC19As, although each of the profiles of uptake and inhibition apparently conformed to the Michaelis-Menten model.
There is a slightly curvilinear trend in the low concentration region in the Eadie-Hofstee plot of pyridoxine transport by SLC19A3, which may suggest the presence of a second recognition site with a high affinity for pyridoxine (Fig. 9B). However, it is not evident and, besides, the major part of the concentration-dependent profile of pyridoxine uptake is well characterized by the estimated Km, which is comparable with the Ki of pyridoxine for thiamine transport.
Effect of silencing endogenous SLC19A2 and SLC19A3 in Caco-2 cells
The effect of silencing the endogenous SLC19A2 and SLC19A3 of Caco-2 cells (with the use of gene-specific RNAi) on pyridoxine uptake was examined to confirm the roles of these transporters in pyridoxine uptake. The expression of SLC19A2 was specifically suppressed by a siRNA specific to SLC19A2, as indicated by a significant reduction in the level of SLC19A2 mRNA but not in that of SLC19A3 mRNA (Fig. 13A). Similarly, the suppressing effect of an SLC19A3-specific siRNA was specific to the expression of SLC19A3 mRNA with no effect on the expression of SLC19A2 mRNA (Fig. 13B). The uptake of pyridoxine (5 nm) at pH 5.5 was reduced by silencing SLC19A3 (Fig. 13C), in accordance with the suppression of its mRNA expression and indicating its role in pyridoxine uptake. The SLC19A2 silencing-induced reduction of pyridoxine uptake was, however, not evident, although the trend was indicated at p < 0.1.
Figure 13.
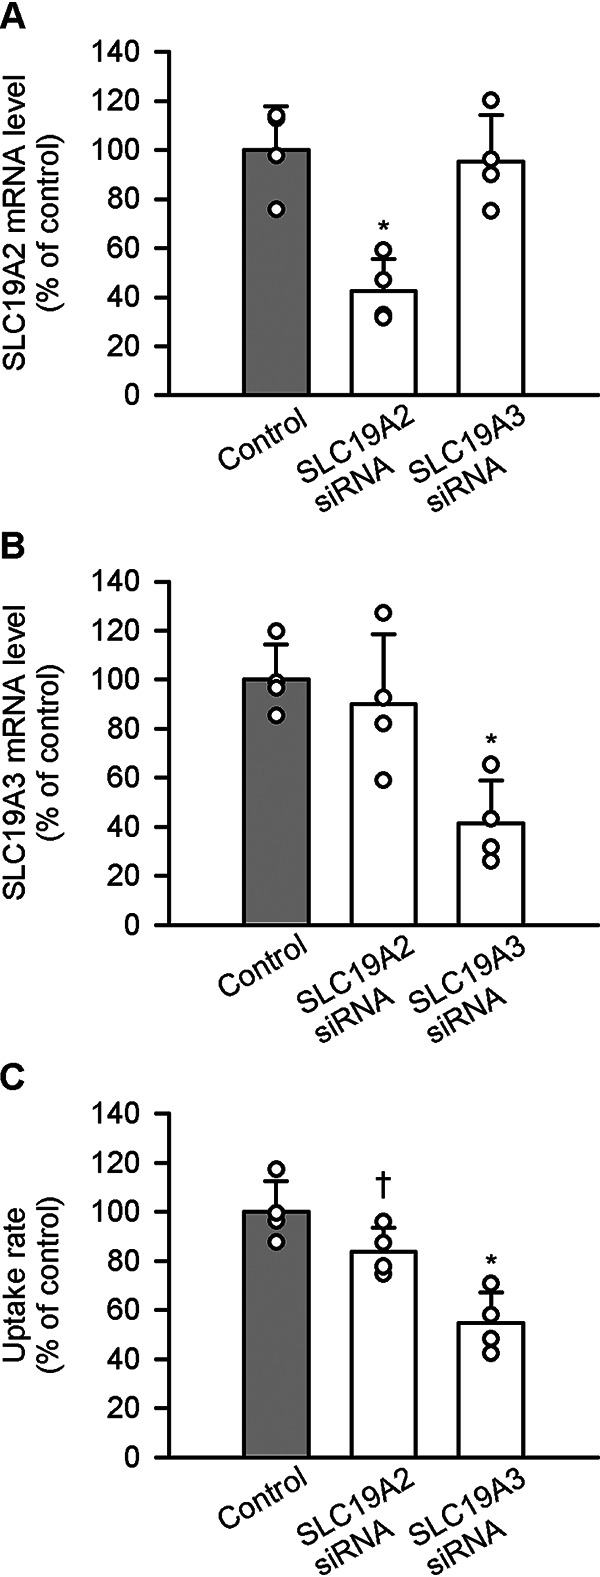
Effect of silencing endogenous SLC19A2 and SLC19A3 on pyridoxine uptake in Caco-2 cells. Caco-2 cells were cultured for 5 days after transfection with the siRNA for SLC19A2 or SLC19A3. The levels of SLC19A2 mRNA (A) and SLC19A3 mRNA (B) were assessed by real-time PCR. The uptake of [3H]pyridoxine (5 nm) was evaluated for 3 min at pH 5.5 and 37 °C (C). The uptake rate for control was 28.9 fmol/min/mg of protein. Data are presented as the mean ± S.D. (n = 4). Statistical differences from control were assessed by ANOVA followed by Dunnett's test. *, p < 0.05; †, p < 0.1.
The ratio of the uptake rate to concentration (transport coefficient) at a pyridoxine concentration as high as 1 mm, which can represent the transport coefficient for simple diffusion (2), was estimated to be 1.7 μl/min/mg of protein. Because the transport coefficient was 5.8 μl/min/mg of protein for control at low concentrations (Fig. 13C), about 30% of the uptake can be accounted for by basal uptake by simple diffusion and, hence, the remaining 70% can be by the carrier-mediated mechanism. The reduction in the uptake by about 50% by the silencing of SLC19A3 suggests that this transporter could be the main carrier-mediated pyridoxine uptake system in this cell model, accounting for about 70% of the carrier-mediated uptake. The remaining 30% of the carrier-mediated uptake could be accounted for by the modest contribution of SLC19A2, where its silencing led to ∼20% reduction in uptake.
Discussion
The present study demonstrates that both SLC19A2 and SLC19A3 transport pyridoxine, and that this process is optimal under acidic conditions. The Km values for SLC19A2 (37.8 μm) and SLC19A3 (18.5 μm) were comparable in stable transfectant MDCKII cells (Fig. 9 and Table 2) and similar to the Km of 12 μm reported for pyridoxine uptake in Caco-2 cells (2). Unlike the modest difference in Km for the two transporters in stable transfectant MDCKII cells, the Km of two transporters in Caco-2 cells was deemed similar. The low-pH optimum of pyridoxine uptake mediated by SLC19A2 and SLC19A3 (Figs. 3 and 4) and its inhibition by protonophores is in agreement with the properties of pyridoxine transport in Caco-2 cells (2) and is consistent with a proton-coupled process. Interestingly, the bsu1 pyridoxine transporter in yeast is also proton-coupled; however, it is genetically distinct from the eukaryotic thiamine transporters (1, 16). 4-Pyridoxic acid was not effective in inhibiting SLC19A2- or SLC19A3-mediated pyridoxine transport in stable transfectant MDCKII cells (Fig. 6), although this compound was reported to be a potent inhibitor of pyridoxine transport in Caco-2 cells (2). The effects of all other pyridoxine-related compounds on pyridoxine transport by these SLC19As in stable transfectant MDCKII cells (Figs. 6 and 8) were similar to the pattern of inhibition in Caco-2 cells.
The similarity of SLC19A2- and SLC19A3-mediated pyridoxine transport in stable transfectant MDCKII cells and pyridoxine transport reported for Caco-2 cells, the latter a model for intestinal transport, along with the impact of siRNA suppression of SLC19A3 in Caco-2 cells, suggests the possibility that this transporter plays a role in the intestinal absorption of pyridoxine. SLC19A2 and SLC19A3 have been known to be localized to the basolateral and brush border membranes (17–21), respectively, in intestinal epithelial cells and could constitute a pathway of pyridoxine absorption. According to this localization of the transporters, the latter would mediate uptake across the brush border membrane driven by the H+ gradient within the acidic microenvironment at the intestinal surface. A possible role for SLC19A2 in transport across the basolateral membrane in the absence of H+ gradient is uncertain but this transporter might facilitate export driven by a pyridoxine concentration gradient. More likely, there is some expression of SLC19A2 at the brush border membrane (17–20), where it would contribute to pyridoxine uptake. Although SLC19A2 and SLC19A3 are expressed in a variety of systemic tissues (6, 8), the extent to which they deliver pyridoxine to these tissues within their near neutral microenvironments is not clear.
The pH dependence of pyridoxine transport systems in other cell types (opossum kidney cells, mouse colonocytes, and pancreatic acinar 266-6 cells) differs from that of SLC19A2 and SLC19A3 in that these systems have neutral to basic pH optima (3–5). In addition, the Km for pyridoxine transport in these cells is 1-2 orders of magnitude lower than those observed for SLC19A2 and SLC19A3 (3–5). A similar low Km has also been reported for pyridoxine transport in human primary pancreatic acinar cells (5). There are also differences in sensitivity to pyridoxine-related compounds among pyridoxine transport systems in these cell types and as compared with SLC19A2 and SLC19A3. However, in the absence of additional information regarding the mechanism of transport of pyridoxine and related compounds, it is not possible to determine whether these observations are due to different properties of SLC19A2 and SLC19A3 expressed in these cells and/or the presence of other pyridoxine transporter(s).
The current study indicates that SLC19A2 and SLC19A3 transport both thiamine and pyridoxine. However, there are marked differences in the pH at which transport of these substrates is optimal; this occurs, for thiamine, at near neutral pH and, for pyridoxine, at acidic pH (Fig. 3 and Tables 2 and 3). There was also a qualitative difference in the kinetics of inhibition of pyridoxine transport by thiamine and inhibition of thiamine transport by pyridoxine; the former was competitive and the latter noncompetitive (Figs. 9 and 12). This suggests that the two substrates may bind to different sites of the transporter proteins, a likely possibility in view of the structural diversity of cationic compounds transported by these transporters (6–9). There is precedent for this; for example, novel organic cation transporter 2 (SLC22A5) functions as a Na+-dependent transporter for l-carnitine, whereas its mediated transport of organic cations such as tetraethylammonium is Na+-independent (22).
In summary, we report for the first time the molecular identity of transporters for pyridoxine. We demonstrate that SLC19A2 and SLC19A3, originally identified as thiamine transporters, are multispecific transporters shared by pyridoxine and other structurally unrelated cationic compounds. The proton-coupled transport manifested for pyridoxine raises the possibility that these transporters may be the carrier-mediated mechanism by which pyridoxine and related compounds are absorbed in the small intestine. These findings can be a basis for further studies on the role these transporters play in the physiological processes involving pyridoxine and the pathophysiology of deficiency disorders involving this vitamin.
Experimental procedures
Materials
[3H]Pyridoxine (20 Ci/mmol), [3H]thiamine (20 Ci/mmol), and [3H]3-O-MG (90 Ci/mmol) were obtained from American Radiolabeled Chemicals (St. Louis, MO). Unlabeled pyridoxine and thiamine were obtained from Tokyo Chemical Industry (Tokyo, Japan) and Wako Pure Chemical Industries (Osaka, Japan), respectively. Dulbecco's modified Eagle's medium (DMEM) was obtained from Wako Pure Chemical Industries and fetal bovine serum (FBS) was from Sigma-Aldrich. All other reagents were of analytical grade and commercially obtained.
Cell culture
HEK293 cells were obtained from Cell Resource Center for Biomedical Research, Tohoku University, Japan, and MDCKII cells and Caco-2 cells were from RIKEN BioResource Research Center (Tsukuba, Japan). The cells were maintained at 37 °C and 5% CO2 in DMEM supplemented with 10% FBS, 100 units/ml of penicillin, and 100 μg/ml of streptomycin, as described previously (23).
Preparation of plasmids
The cDNA of human SLC19A1 (GenBank accession number NM_194255.4) was cloned by an RT-PCR method, as described previously (23). In brief, an RT reaction was carried out to obtain a cDNA mixture from human placenta total RNA (BioChain Institute, Newark, CA), using 1 μg of the total RNA, an oligo(dT) primer, and ReverTra Ace (Toyobo, Osaka, Japan) as a reverse transcriptase. The cDNA of SLC19A1 was amplified by PCR, using PrimeSTAR Max DNA Polymerase (Takara Bio, Kusatsu, Japan). Then, the second PCR was performed using the amplified product as a template to incorporate restriction sites. Similarly, the cDNAs of SLC19A2 and SLC19A3 were cloned from human placenta total RNA. Their GenBank accession numbers are NM_006996.3 and NM_025243.4, respectively. The primers for PCR are shown in Table 4.
Table 4.
Primers for amplification of the cDNAs of SLC19As
Solid lines, bold italic, bold, and double lines are restriction sites for XhoI, XbaI, EcoRI, and SalI, respectively.
| Transporter | PCR | Orientation | Sequence (5′ to 3′) |
|---|---|---|---|
| SLC19A1 | 1st | Forward | GCAGGCACAGCGTCACCTTCGTC |
| Reverse | CGCCCGAGAGTCACTGGTTCACA | ||
| 2nd | Forward | CGACTCGAGGCAGGATGGTGCCCTCCAGC | |
| Reverse | CTTTCTAGAGTCACTGGTTCACATTC | ||
| SLC19A2 | 1st | Forward | CGGTTACAAGTGCCTGACCCTC |
| Reverse | TCAAACACATCCAGGCAGTTGCT | ||
| 2nd | Forward | CCTGAATTCCGCCATGGATGTGCCCGGCCC | |
| Reverse | CCCGTCGACAGTATATTATGAAGTGGT | ||
| SLC19A3 | 1st | Forward | GACACTCCCTTCTGTAGCCA |
| Reverse | TGTTTAATTATGATGACGGGTCCT | ||
| 2nd | Forward | AAGGAATTCAGCCATGGATTGTTACAGAA | |
| Reverse | AGTTCTAGATTAGAGTTTTGTTGACATGA |
All final cDNA products were incorporated into pCI-neo vector (Promega, Madison, WI) to prepare plasmids for transfection and their sequences were determined with an automated sequencer (ABI PRISM 3130, Applied Biosystems, Foster City, CA), as described previously (24).
Preparation of transient transfectant HEK293 cells
HEK293 cells (2.0 × 10⁵ cells/ml, 1 ml/well) were grown on 24-well–plates coated with poly-l-lysine (coated plates) for 12 h, transfected with 1 μg/well of the plasmid carrying the cDNA of the designated transporter (SLC19A1, SLC19A2, or SLC19A3), using 2 μg/well of Polyethylenimine “MAX” (Polyscience, Warrington, PA), and cultured for 48 h for transient transfection, as described previously (24). Mock cells were similarly prepared using empty pCI-neo vector.
Preparation of stable transfectant MDCKII cells
MDCKII cells (4.0 × 10⁵ cells/ml, 0.5 ml/well) were seeded on regular 24-well–plates, transfected with 1 μg/well of the plasmid for the designated transporter (SLC19A2 or SLC19A3), using 2 μl/well of Lipofectamine 2000 (Invitrogen), and cultured in DMEM supplemented with 10% FBS and 800 μg/ml of G418 (Sigma-Aldrich) for 2 to 3 weeks for stable transfection, as described previously (25). G418-resistant clones were selected to obtain stable transfectant MDCKII cells. Mock cells were similarly prepared using empty pCI-neo vector.
Silencing of SLC19A2 and SLC19A3 in Caco-2 cells
Caco-2 cells (5.0 × 10⁴ cells/ml, 1 ml/well) were grown on 24-well–coated plates for 6 h, transfected with 15 pmol/well of the siRNA specific to the mRNA of SLC19A2 or SLC19A3 (Sigma-Aldrich), using 1.5 μl/well of Lipofectamine RNAi MAX (Invitrogen), and cultured for 5 days for silencing of the designated transporter by RNAi. The sequences of the siRNAs are shown in Table 5. For control, Negative Control DsiRNA (Integrated DNA Technologies, Coralville, IA) was used.
Table 5.
Sequences of the siRNAs for SLC19A2 and SLC19A3
| Transporter | Type | Sequence (5′ to 3′) |
|---|---|---|
| SLC19A2 | Sense | AAGUUACUGUCGAAGUGCCAC |
| Antisense | GUGGCACUUCGACAGUAACUU | |
| SLC19A3 | Sense | AAGGAGUGAAGACCAUGCAGG |
| Antisense | CCUGCAUGGUCUUCACUCCUU |
Real-time PCR analysis
Total RNA isolated from Caco-2 cells by a guanidine isothiocyanate extraction method (26) was used to obtain a cDNA mixture by an RT reaction, using ReverTra Ace as a reverse transcriptase. Real-time quantitative PCR analysis was performed with a CFX Connect Real-Time PCR Detection System (Bio-Rad Laboratories), using SsoAdvanced Universal SYBR Green Supermix (Bio-Rad Laboratories) with specific detection primers for SLC19A2 and SLC19A3 (Table 6). GAPDH was used as the internal control, of which the mRNA expression level was used to normalize those of the SLC19As.
Table 6.
Primers for the real-time PCR analyses of the expression of SLC19A2 and SLC19A3
| Protein | Orientation | Sequence (5′ to 3′) |
|---|---|---|
| SLC19A2 | Forward | CAAGTTACTGTCGAAGTGCCA |
| Reverse | GCAGGTAGAAGGAATGTGGTGAA | |
| SLC19A3 | Forward | TCCCCGTTTGGACATACTCCT |
| Reverse | GCTTGTAGCGGACATAATCGGT | |
| GAPDH | Forward | CGGAGTCAACGGATTTGGTCGTAT |
| Reverse | AGCCTTCTCCATGGTGGTGAAGAC |
Transport study
Uptake assays were conducted as described previously (23), using transient transfectant HEK293 cells cultured on 24-well–coated plates, stable transfectant MDCKII cells cultured on regular 24-well–plates, and Caco-2 cells cultured on 24-well–coated plates. In brief, uptake solutions were prepared using Hanks' solution modified by supplementation with 10 mm MES (pH 6.5 and below) or 10 mm HEPES (pH 7.0 and above) and added with [3H]pyridoxine as the substrate. Cells in each well were preincubated for 5 min in 1 ml of substrate-free uptake solution. Uptake assays were started by replacing the substrate-free uptake solution with the one containing [3H]pyridoxine (0.25 ml). All the procedures were conducted at 37 °C. In experiments for intracellular acidification using the protonophores of FCCP and CCCP, they were added in the solution for preincubation as well as that for the uptake period. In those using nigericin and by an NH4Cl prepulse method, NaCl in the regular uptake solution was replaced with KCl. Nigericin was added only in the solution for preincubation. In the NH4Cl prepulse experiments, cells were preincubated in the solution added with 20 mm NH4Cl for 10 min and then in the solution without NH4Cl for 5 min before starting uptake using the solution without NH4Cl for the uptake period, as described previously (14). To examine the effect of ionic conditions, NaCl was replaced as indicated. In inhibition experiments, test compounds were added to the uptake solution to be present only during the uptake period. After termination of the uptake of [3H]pyridoxine into the cells, the cells were solubilized and the associated radioactivity was determined by liquid scintillation counting for the evaluation of the uptake. The uptake was normalized to cellular protein content, which was determined by the bicinchoninic acid method (BCA Protein Assay Reagent Kit, Thermo Fisher Scientific, Waltham, MA), using BSA as the standard. In experiments using stable transfectant MDCKII cells, the specific uptake of pyridoxine was estimated by subtracting the uptake in mock cells from that in transfectant cells. The uptake of [3H]thiamine was similarly assessed in stable transfectant MDCKII cells.
Estimation of cellular volume
The uptake of [3H]3-O-MG (1 nm) was evaluated at equilibrium (10 min after the initiation of uptake) for the estimation of the cellular volume, as reported previously (11), in SLC19A2-transfected and SLC19A3-transfected MDCKII cells.
Data analysis
The saturable uptake of a substrate by each transporter was analyzed using the Michaelis-Menten model equation as follows: v = Vmax × s/(Km + s). The Vmax and Km were estimated by fitting this equation to the experimental profile of the uptake rate (v) versus the concentration (s) of the substrate, using a nonlinear least-squares regression analysis program, WinNonlin (Certara, Princeton, NJ).
Analysis of the competitive type of inhibition of saturable substrate uptake by each transporter was conducted using the Michaelis-Menten model equation for competitive inhibition as follows: v = Vmax × s/(Km(1 + i/Ki) + s). The Ki was estimated by fitting this equation to the experimental profile of v versus s in the presence of an inhibitor at the concentration of i, with the Vmax and Km fixed at those estimated in its absence. Analysis of the noncompetitive type of inhibition was conducted similarly by using the equation for noncompetitive inhibition as follows: v = (Vmax/(1 + i/Ki)) × s/(Km + s).
The concentration-dependent inhibition of pyridoxine uptake by selected compounds was analyzed by using the following equation, which describes v as a function of i at s much lower than Km (s ≪ Km): v = v0/(1 + (i/IC50)n). The v0 represents v in the absence of inhibitors. The IC50 was estimated together with n by fitting this equation to the experimental profile of v versus i, with v0 fixed at the observed value.
Data are presented as the mean ± S.E. or S.D. with the number of experiments conducted using different preparations of cells, where each experiment was conducted in duplicate as biological repeats. Statistical analysis was performed by using Student's t test or, when multiple comparisons were needed, ANOVA followed by Dunnett's test, with p < 0.05 considered significant.
Data availability
All data are contained within the article.
Author contributions—T. Yamashiro and T. Yasujima investigation; H. M. S. and H. Y. writing-review and editing; H. Y. writing-original draft.
Funding and additional information—This work was supported in part by JSPS KAKENHI Grant JP19K16416. The views expressed in this article are those of the authors and do not necessarily reflect the position or policy of the Department of Veterans Affairs or the United States government.
Conflict of interest—The authors declare that they have no conflicts of interest with the contents of this article.
- HEK293
- human embryonic kidney 293
- CCCP
- carbonyl cyanide m-chlorophenylhydrazone
- DMEM
- Dulbecco's modified Eagle's medium
- FBS
- fetal bovine serum
- FCCP
- carbonyl cyanide p-trifluoromethoxyphenylhydrazone
- MDCKII
- Madin-Darby canine kidney II
- 3-O-MG
- 3-O-methyl-d-glucose
- PLP
- pyridoxal 5-phosphate
- ANOVA
- analysis of variance
- GAPDH
- glyceraldehyde-3-phosphate dehydrogenase.
References
- 1. Hediger, M. A., Clémençon, B., Burrier, R. E., and Bruford, E. A. (2013) The ABCs of membrane transporters in health and disease (SLC series): introduction. Mol. Aspects Med. 34, 95–107 10.1016/j.mam.2012.12.009 [DOI] [PMC free article] [PubMed] [Google Scholar]
- 2. Said, H. M., Ortiz, A., and Ma, T. Y. (2003) A carrier-mediated mechanism for pyridoxine uptake by human intestinal epithelial Caco-2 cells: regulation by a PKA-mediated pathway. Am. J. Physiol. Cell Physiol. 285, C1219–C1225 10.1152/ajpcell.00204.2003 [DOI] [PubMed] [Google Scholar]
- 3. Said, H. M., Ortiz, A., and Vaziri, N. D. (2002) Mechanism and regulation of vitamin B6 uptake by renal tubular epithelia: studies with cultured OK cells. Am. J. Physiol. Renal Physiol. 282, F465–F471 10.1152/ajprenal.00267.2001 [DOI] [PubMed] [Google Scholar]
- 4. Said, Z. M., Subramanian, V. S., Vaziri, N. D., and Said, H. M. (2008) Pyridoxine uptake by colonocytes: a specific and regulated carrier-mediated process. Am. J. Physiol. Cell Physiol. 294, C1192–C1197 10.1152/ajpcell.00015.2008 [DOI] [PubMed] [Google Scholar]
- 5. Srinivasan, P., Ramesh, V., Wu, J., Heskett, C., Chu, B. D., and Said, H. M. (2019) Pyridoxine and pancreatic acinar cells: transport physiology and effect on gene expression profile. Am. J. Physiol. Cell Physiol. 317, C1107–C1114 10.1152/ajpcell.00225.2019 [DOI] [PMC free article] [PubMed] [Google Scholar]
- 6. Dutta, B., Huang, W., Molero, M., Kekuda, R., Leibach, F. H., Devoe, L. D., Ganapathy, V., and Prasad, P. D. (1999) Cloning of the human thiamine transporter, a member of the folate transporter family. J. Biol. Chem. 274, 31925–31929 10.1074/jbc.274.45.31925 [DOI] [PubMed] [Google Scholar]
- 7. Rajgopal, A., Edmondnson, A., Goldman, I. D., and Zhao, R. (2001) SLC19A3 encodes a second thiamine transporter ThTr2. Biochim. Biophys. Acta 1537, 175–178 10.1016/S0925-4439(01)00073-4 [DOI] [PubMed] [Google Scholar]
- 8. Liang, X., Chien, H. C., Yee, S. W., Giacomini, M. M., Chen, E. C., Piao, M., Hao, J., Twelves, J., Lepist, E. I., Ray, A. S., and Giacomini, K. M. (2015) Metformin is a substrate and inhibitor of the human thiamine transporter, THTR-2 (SLC19A3). Mol. Pharm. 12, 4301–4310 10.1021/acs.molpharmaceut.5b00501 [DOI] [PMC free article] [PubMed] [Google Scholar]
- 9. Giacomini, M. M., Hao, J., Liang, X., Chandrasekhar, J., Twelves, J., Whitney, J. A., Lepist, E. I., and Ray, A. S. (2017) Interaction of 2,4-diaminopyrimidine-containing drugs including fedratinib and trimethoprim with thiamine transporters. Drug Metab. Dispos. 45, 76–85 10.1124/dmd.116.073338 [DOI] [PubMed] [Google Scholar]
- 10. Lumeng, L., Lui, A., and Li, T. K. (1980) Plasma content of B6 vitamers and its relationship to hepatic vitamin B6 metabolism. J. Clin. Invest. 66, 688–695 10.1172/JCI109906 [DOI] [PMC free article] [PubMed] [Google Scholar]
- 11. Fujimoto, N., Inoue, K., Hayashi, Y., and Yuasa, H. (2006) Glycerol uptake in HCT-15 human colon cancer cell line by Na+-dependent carrier-mediated transport. Biol. Pharm. Bull. 29, 150–154 10.1248/bpb.29.150 [DOI] [PubMed] [Google Scholar]
- 12. Pascoe, W. S., Inukai, K., Oka, Y., Slot, J. W., and James, D. E. (1996) Differential targeting of facilitative glucose transporters in polarized epithelial cells. Am. J. Physiol. Cell Physiol. 271, C547–C554 10.1152/ajpcell.1996.271.2.C547 [DOI] [PubMed] [Google Scholar]
- 13. Quan, Y., Jin, Y., Faria, T. N., Tilford, C. A., He, A., Wall, D. A., Smith, R. L., and Vig, B. S. (2012) Expression profile of drug and nutrient absorption related genes in Madin-Darby Canine Kidney (MDCK) cells grown under differentiation conditions. Pharmaceutics 4, 314–333 10.3390/pharmaceutics4020314 [DOI] [PMC free article] [PubMed] [Google Scholar]
- 14. Ohta, K., Inoue, K., Hayashi, Y., and Yuasa, H. (2006) Molecular identification and functional characterization of rat multidrug and toxin extrusion type transporter 1 as an organic cation/H+ antiporter in the kidney. Drug Metab. Dispos. 34, 1868–1874 10.1124/dmd.106.010876 [DOI] [PubMed] [Google Scholar]
- 15. dos Santos, T. D A. D., Costa, D. O. D., Pita, S. S. D R., and Semaan, F. S. (2010) Potentiometric and conductimetric studies of chemical equilibria for pyridoxine hydrochloride in aqueous solutions: simple experimental determination of pKa values and analytical applications to pharmaceutical analysis. Eclet. Quim. J. 35, 81–86 10.1590/S0100-46702010000400010 [DOI] [Google Scholar]
- 16. Stolz, J., Wöhrmann, H. J. P., and Vogl, C. (2005) Amiloride uptake and toxicity in fission yeast are caused by the pyridoxine transporter encoded by bsu1+ (car1+). Eukaryot. Cell 4, 319–326 10.1128/EC.4.2.319-326.2005 [DOI] [PMC free article] [PubMed] [Google Scholar]
- 17. Boulware, M. J., Subramanian, V. S., Said, H. M., and Marchant, J. S. (2003) Polarized expression of members of the solute carrier SLC19A gene family of water-soluble multivitamin transporters: implications for physiological function. Biochem. J. 376, 43–48 10.1042/BJ20031220 [DOI] [PMC free article] [PubMed] [Google Scholar]
- 18. Said, H. M., Balamurugan, K., Subramanian, V. S., and Marchant, J. S. (2004) Expression and functional contribution of hTHTR-2 in thiamin absorption in human intestine. Am. J. Physiol. Gastrointest. Liver Physiol. 286, G491–G498 10.1152/ajpgi.00361.2003 [DOI] [PubMed] [Google Scholar]
- 19. Subramanian, V. S., Marchant, J. S., and Said, H. M. (2006) Targeting and trafficking of the human thiamine transporter-2 in epithelial cells. J. Biol. Chem. 281, 5233–5245 10.1074/jbc.M512765200 [DOI] [PubMed] [Google Scholar]
- 20. Said, H. M. (2013) Recent advances in transport of water-soluble vitamins in organs of the digestive system: a focus on the colon and the pancreas. Am. J. Physiol. Gastrointest. Liver Physiol. 305, G601–G610 10.1152/ajpgi.00231.2013 [DOI] [PMC free article] [PubMed] [Google Scholar]
- 21. Zhao, R., and Goldman, I. D. (2013) Folate and thiamine transporters mediated by facilitative carriers (SLC19A1-3 and SLC46A1) and folate receptors. Mol. Aspects Med. 34, 373–385 10.1016/j.mam.2012.07.006 [DOI] [PMC free article] [PubMed] [Google Scholar]
- 22. Ohashi, R., Tamai, I., Nezu, J., Nikaido, H., Hashimoto, N., Oku, A., Sai, Y., Shimane, M., and Tsuji, A. (2001) Molecular and physiological evidence for multifunctionality of carnitine/organic cation transporter OCTN2. Mol. Pharmacol. 59, 358–366 10.1124/mol.59.2.358 [DOI] [PubMed] [Google Scholar]
- 23. Mimura, Y., Yasujima, T., Ohta, K., Inoue, K., and Yuasa, H. (2017) Functional identification of plasma membrane monoamine transporter (PMAT/SLC29A4) as an atenolol transporter sensitive to flavonoids contained in apple juice. J. Pharm. Sci. 106, 2592–2598 10.1016/j.xphs.2017.01.009 [DOI] [PubMed] [Google Scholar]
- 24. Yamashiro, T., Yasujima, T., Ohta, K., Inoue, K., and Yuasa, H. (2019) Identification of the amino acid residue responsible for the myricetin sensitivity of human proton-coupled folate transporter. Sci. Rep. 9, 18105 10.1038/s41598-019-54367-9 [DOI] [PMC free article] [PubMed] [Google Scholar]
- 25. Furukawa, J., Inoue, K., Ohta, K., Yasujima, T., Mimura, Y., and Yuasa, H. (2017) Role of equilibrative nucleobase transporter 1/SLC43A3 as a ganciclovir transporter in the induction of cytotoxic effect of ganciclovir in a suicide gene therapy with herpes simplex virus thymidine kinase. J. Pharmacol. Exp. Ther. 360, 59–68 10.1124/jpet.116.236984 [DOI] [PubMed] [Google Scholar]
- 26. Chomczynski, P., and Sacchi, N. (1987) Single-step method of RNA isolation by acid guanidinium thiocyanate–phenol–chloroform extraction. Anal. Biochem. 162, 156–159 10.1016/0003-2697(87)90021-2 [DOI] [PubMed] [Google Scholar]
Associated Data
This section collects any data citations, data availability statements, or supplementary materials included in this article.
Data Availability Statement
All data are contained within the article.


