

Abstract
We have observed overexpression of PACS-1, a cytosolic sorting protein in primary cervical tumors. Absence of exonic mutations and overexpression at the RNA level suggested a transcriptional and/or posttranscriptional regulation. University of California Santa Cruz genome browser analysis of PACS-1 micro RNAs (miR), revealed two 8-base target sequences at the 3′ terminus for hsa-miR-34a and hsa-miR-449a. Quantitative RT-PCR and Northern blotting studies showed reduced or loss of expression of the two microRNAs in cervical cancer cell lines and primary tumors, indicating dysregulation of these two microRNAs in cervical cancer. Loss of PACS-1 with siRNA or exogenous expression of hsa-miR-34a or hsa-miR-449a in HeLa and SiHa cervical cancer cell lines resulted in DNA damage response, S-phase cell cycle arrest, and reduction in cell growth. Furthermore, the siRNA studies showed that loss of PACS-1 expression was accompanied by increased nuclear γH2AX expression, Lys382-p53 acetylation, and genomic instability. PACS-1 re-expression through LNA-hsa-anti-miR-34a or -449a or through PACS-1 cDNA transfection led to the reversal of DNA damage response and restoration of cell growth. Release of cells post 24-h serum starvation showed PACS-1 nuclear localization at G1-S phase of the cell cycle. Our results therefore indicate that the loss of hsa-miR-34a and hsa-miR-449a expression in cervical cancer leads to overexpression of PACS-1 and suppression of DNA damage response, resulting in the development of chemo-resistant tumors.
Keywords: PACS-1, cervical cancer, hsa-miRNA-34a, hsa-miR-449a, DNA damage response, p53 acetylation, nuclear translocation, genome stability, cancer biology, oncogene, tumor, tumor suppressor gene, nuclear transport, trafficking protein
Cervical cancer is the second most common cancer responsible for cancer-related death in women around the world. The incidence is increasing, with 450,000 new cases diagnosed annually and 13,000 in the United States (1–3). It is the third leading cause of death from cancer in women of 15 to 34 years of age and the fifth leading cause of death in women of 35 to 54 years, representing about 2% of all cancers in women in the USA. Human papillomavirus (HPV) infection is detected in 90% of cervical cancer lesions (4–7). The disease is also associated with smoking, alcohol consumption, and multiple sex partnerships leading to cervical infection and poor immune response (4–7). Positivity of p16 protein is a good prognostic marker of chemo-radiation therapy, and resistant tumors show inactivation of p16 (8).
It has also been established that HPV infection alone is insufficient to induce cancer (8–10). Absence of HPV sequences in a fraction of cervical cancers clearly indicated the involvement of genetic/environmental factors in tumor development. Moreover, oncogenes E6 and E7 of high-risk HPVs (HPV16 and HPV18) are known to reinitiate DNA replication in terminally differentiated keratinocytes by abrogating cell cycle checkpoint proteins p53 and Rb, respectively (11, 12). It is well-known that unscheduled S phase entry of the cells induces replication stress and activates S phase checkpoint–mediated DNA damage responses (DDR) and chromosomal instability, an important step in HPV-induced carcinogenesis (12). However, the molecular network that responds to the HPV oncogenic stress leading to the survival of transformed cells is not understood.
We and others have shown that a cervical cancer tumor suppressor gene is localized to chromosome 11q13 and that genomic rearrangements at this site are common in cervical and other human cancers (13, 14). We have further shown that homozygous deletion of 5.5 kb is seen in HeLa cell–derived tumorigenic cell lines and primary tumors, indicating the importance of these sequences in tumor development (15–17). Extensive mapping of the 300-kb region localized the 5.5-kb sequence to the first intron of PACS-1, a protein involved in cytoplasmic protein trafficking (15–17). The repetitive nature of the 5.5-kb sequence made it extremely difficult to functionally characterize the sequence for its role in tumor development. Transfection studies could not be carried out with the 5.5-kb sequence containing plasmid, cosmid, or bacterial artificial chromosome (BAC) vectors because of the deletion of these sequences in the transfected clones. A 175-kb sequence surrounding the 5.5-kb sequence is also repeat rich, indicating chromosomal fragility at this site (18). Thus, investigation was directed at the PACS-1 gene containing the 5.5-kb sequence as the first intronic sequence.
PACS-1 is a cytoplasmic trafficking protein transporting cargo from the Golgi to endosomes and the membrane surface (19–21). It is known to interact with several proteins, including the nef protein of HIV (19–22). Although the role of furin, a protein transported by PACS-1, in human tumors has been reported, a direct role for PACS-1 in cancer has never been established (19, 20). Presence of an abnormal 8-kb transcript in addition to the normal 4.5-kb transcript in cancer cell lines and HeLa cell–derived tumorigenic hybrids indicated that variant transcripts might be related to tumor development (17, 18).
MicroRNAs (miRNAs) are small noncoding RNAs that are known to regulate more than 60% of gene expression in mammals (23). miRNAs degrade mRNA or inhibit translation by targeting complementary sequences in specific gene transcripts. miRNAs have a functional 8-base seed sequence and bind in a complementary fashion to the target mRNAs, predominantly in the 3′UTR (24). Thus, the miRNAs are known to play a key role in cell growth, differentiation, apoptosis, and senescence and are implicated in several diseases including cancer. A search of the PACS-1 genomic sequence using the University of California Santa Cruz genome database revealed seed sequences for the binding of hsa-miR-34a and hsa-miR-449a. Whereas the involvement of hsa-miR-34a in cervical and other human tumors has been well-established, the role of hsa-miR-449a in cancer is not well-defined (25–31). A recent report has shown that PACS-1 has a role in epigenetic regulation of gene expression (32). However, regulation of PACS-1 is not yet known. Here we show that hsa-miR-34a and hsa-miR-449a regulate PACS-1 expression and that the absence of expression of these two miRNAs leads to PACS-1 overexpression resulting in genomic instability of human cancer cells.
Results
PACS-1 is overexpressed in cervical cancer
PACS-1 localized to chromosome 11q13 has 23 introns, with the first intron encompassing a 5.5-kb homozygous deletion seen in some cervical cancer cell lines and primary tumors (Fig. 1A). Protein expression studies by Western blotting showed the presence of 150- and 120-kDa protein bands in normal fibroblasts and cervical cancer cell lines (Fig. 1B). Using PACS-1–specific siRNAs, it was revealed that the 120-kDa band represented the PACS-1 protein (Fig. 1C and Fig. S1). Complete absence of the 120-kDa protein band is seen posttreatment with single PACS-1 siRNAs (catalog nos. J-006697-09-0010, J-006697-10−0010, J-006697-11-0010, and J-006697-12-0010) (Dharmacon) or a combination of two siRNAs establishing this protein as the PACS-1 protein. The 150-kDa protein band cross-hybridizing with at least three different PACS-1 antibodies (antibodies 601 and 177,03 from Dr. Gary Thomas, University of Pittsburgh and sc-136344 from Santa Cruz Biotechnology) is not lost with the siRNAs and thus could represent a PACS-1 variant correlating to the variant RNA seen in HeLa and HeLa cell–derived tumorigenic hybrid cell lines (17, 18). This protein also serves as a hybridization control for the 120-kDa PACS-1 protein in all our Western blots. Analysis of paired normal and primary tumor tissues showed elevated expression of the 120-kDa PACS-1 protein in tumor samples compared with the normal tissue counterparts with the 150-kDa protein band serving as a loading control (Fig. 1D). Normal tissues showed reduced or complete absence of the 120-kDa protein band. University of California Santa Cruz Xena Browse RNA-seq database reveals PACS-1 expression in normal tissues, although at lower levels, indicating that PACS-1 RNA is expressed in normal human tissues (Fig. S2). Therefore, we conclude that the absence of protein expression in normal tissues is related to the regulation of PACS-1 RNA. Genomic sequencing of the 23 exons in two cancer cell lines, HeLa (HPV 18) and SiHa (HPV 16) did not reveal any mutations, ruling out genomic mutations as the cause of protein overexpression (data not shown). The Cancer Genome Atlas database search has shown mutations in 7 of 314 tumors, indicating mutations of PACS1 as a rare event in cervical cancer.
Figure 1.
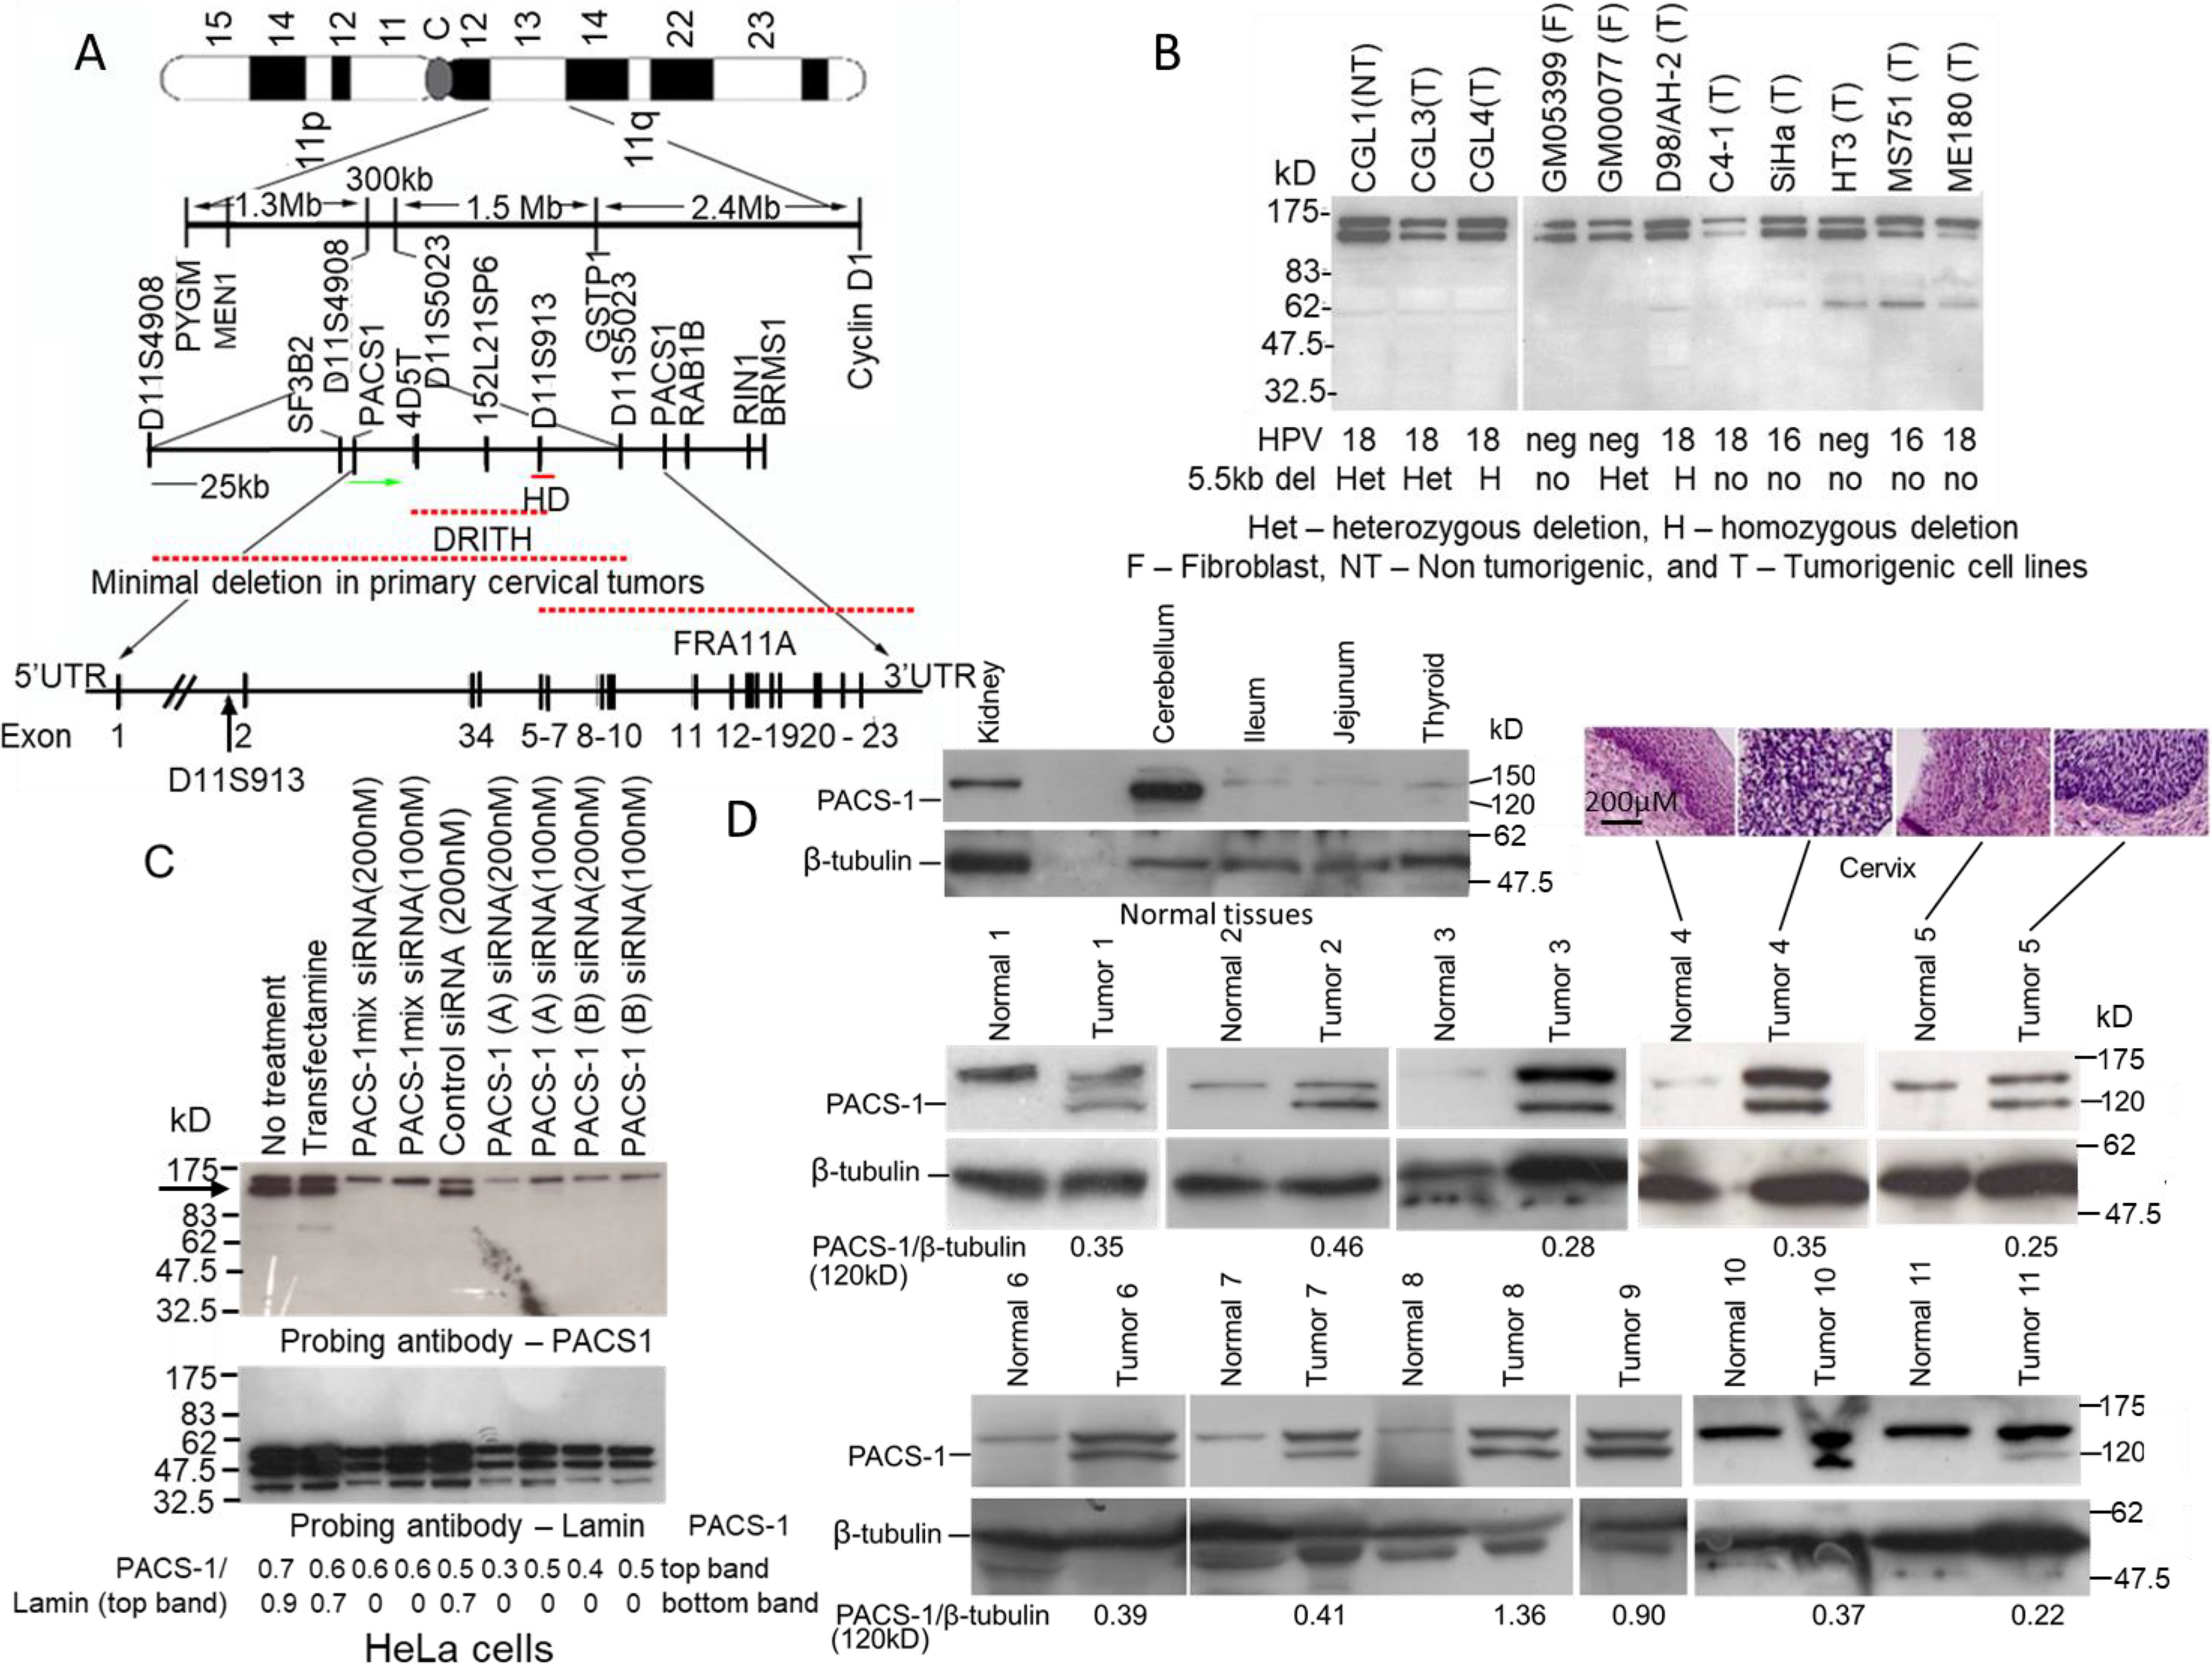
Overexpression of PACS-1 in primary cervical tumors. A, map of the 300-kb 11q13 region containing the PACS-1 gene and the 5.5-kb HD localized within the first intron. B, Western blotting hybridization with a PACS-1 antibody shows the expression of 120-kDa and 150-kDa proteins in fibroblast and HPV-positive and HPV-negative cervical cancer cell lines. C, however, hybridization of proteins from the HeLa cells treated with PACS-1 siRNA shows the loss of the 120-kDa protein (indicated by the arrow), pointing to the 120-kDa protein to be the PACS-1 protein. Hybridization to lamin served as a positive control in the siRNA studies. D, hybridization of normal and tumor samples from cervical cancer patients shows loss of 120-kDa PACS-1 protein in the normal tissues. Overexpression of the 120-kDa protein is observed in tumor samples, pointing to the enhanced expression of the PACS-1 in primary cervical tumors. The 150-kDa protein is seen in both the normal and tumor samples. Green arrow in the 11q13 map points to the direction of PACS-1 transcription. DRITH, minimal deletion in γ ray–induced tumorigenic hybrids; FRA11A, fragile site 11A. NT, nontumorigenic; T, tumorigenic; F, fibroblast; het, heterozygous deletion; H, homozygous deletion; no, no deletion.
PACS-1 overexpression is related to the loss of expression of miRNAs 34a and 449a
To determine whether PACS-1 overexpression in tumors was due to RNA overexpression or genomic amplification, two sets of normal and tumor samples were subjected to RT-PCR or PCR. The RT-PCR using primers for exons 7 and 13 showed enhanced expression of RNA in tumor tissues compared with the normal tissues (Table 1 and Fig. 2A). PCR did not identify a genomic amplification of the two exons 3 and 7 (Fig. 2B), indicating that protein overexpression was related to increased transcription of the PACS-1 gene. Overexpression at the RNA level led us to believe that transcription control was involved. Analysis of the intronic 5.5-kb sequence encompassing the homozygous deletion in HeLa cells and HeLa cell–derived tumorigenic hybrids failed to show any miRNA within this sequence. Presence of alu sequences in the deletion prevented us from performing genetic studies to identify the functional significance of the 5.5-kb deletion in PACS-1 overexpression. University of California Santa Cruz database search revealed the presence of an 8-base consensus sequence (CACTGCCA) within a 120-base interval of the 3′ UTR that could bind to a complementary sequence in miRNAs 34a or 449a (Fig. 2C and Fig. 3, A and B).
Table 1.
PCR and RT-PCR primer sequences
| Analysis | Marker | Sequence | Product size (bp) |
|---|---|---|---|
| PCR | D11S4933 forward Reverse |
GTGGCCGCTACCCCCTTGTC GTCCCTGGCAGATGTTTGTATTGG |
177 |
| PCR | PACS-1 exon 3F Exon 3R |
CTCCCAAACTGCTGGGATTA ATCCTGGCTAGTCCCCAGAC |
218 |
| PCR | PACS-1 exon 7F Exon 7R |
CACCCTCATTCTGTCCCTGT TTCAGTCTGGGGGTAGGTTG |
169 |
| RT-PCR | PACS-1 exon 7F Exon 13R |
GAAGAAGACCCGGAGGAAAC GCAGATTCCAAGAAAGGTGG |
710 |
| RT-PCR | Β-actin forward Reverse |
GTCGCCCTGGACTTCGAGCAAGAG CGTCCACCGCAAATGCTTCTAG |
474 |
qRT-PCR sequences:
Expression analysis of hsa-miR-34a and hsa-miR-449 in cervical normal and tumor samples. TaqManTM MicroRNA assay: Assay name: hsa-miR-34a, Catalog number: 4427975, Assay ID: 000426. TaqManTM MicroRNA assay: Assay name: hsa-miR-449, Catalog number: 4427975, Assay ID: 001030. TaqManTM MicroRNA assay: Assay name: RNU48 (used to normalize the microRNA expression), Catalog number: 4427975, Assay ID: 001006.
Expression analysis of PACS-1 in cervical normal and tumor samples. TaqManTM gene expression assay: Catalog number: 4331182, Assay ID: Hs00216026_m1, Gene Symbol: PACS1. TaqManTM gene expression assay: Catalog number: 4331182, Assay ID: Hs01060665_g1, Gene Symbol: ACTB (used for normalization).
Luciferase transfection analysis using pre-hsa-miR-34a and pre-hsa-miR-449. Pre-miRTM miRNA precursor: Catalog number: AM17100, Assay ID: PM11127, Assay name: hsa-miR-449a. Pre-miRTM miRNA precursor: Catalog number: AM17100, Assay ID: PM11030, Assay name: hsa-miR-34a-5p. Pre-hsa-miRTM miRNA precursor negative control 1, Catalog number: AM17110.
Figure 2.
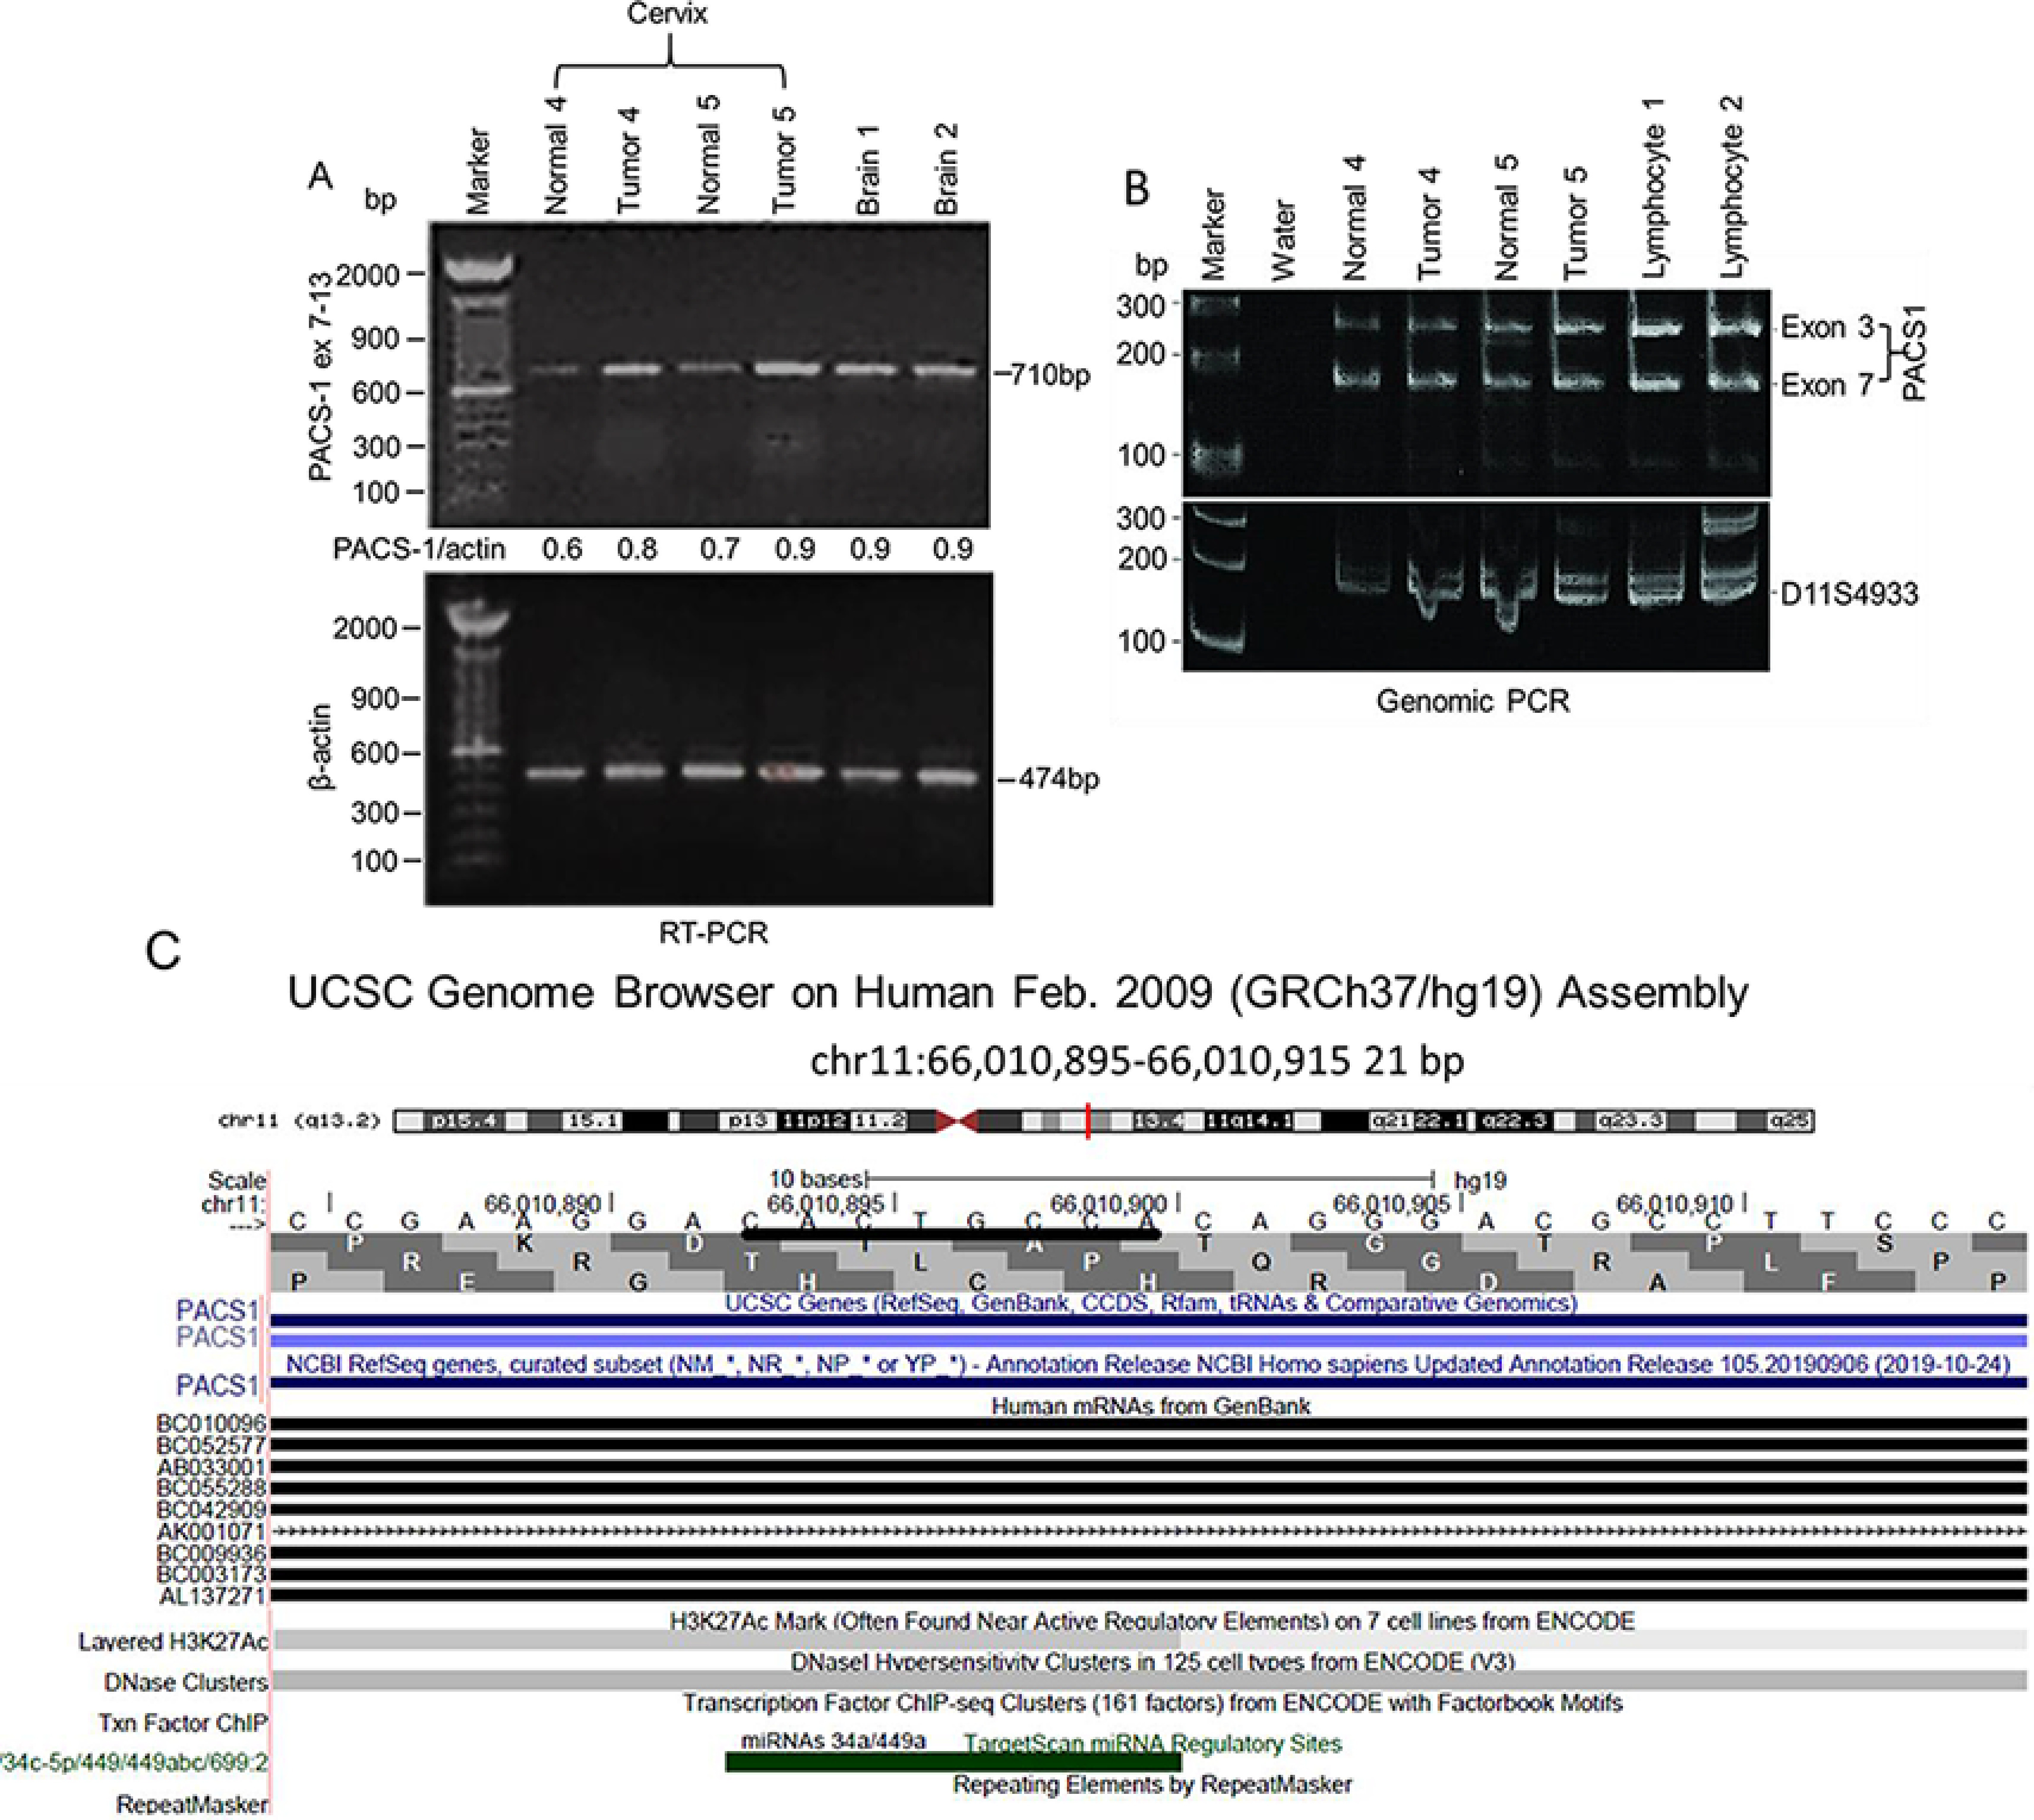
Absence of PACS-1 transcription regulation in primary cervical tumors. A, RT-PCR of normal and tumor tissues from samples 4 and 5 indicates enhanced expression of the PACS-1 gene at the RNA level. B, PCR analysis with exons 3 and 7 of PACS-1 shows equal-intensity PCR bands in both the normal and tumor tissues 4 and 5, pointing to the absence of PACS-1 gene amplification. Probe D11S4933 localized 1 Mb proximal to PACS-1 was used as the control probe. C, UCSC genome browser points to the presence of hsa-miR-34a and hsa-miR-449a binding sequences at the 3′ terminus of PACS-1. Green bar represents miRNA binding sequence CACTGCCA in PACS-1.
Figure 3.

Presence of hsa-miR-34a and 449a binding sequences at 3′ terminus of PACS-1 gene. A, two hsa-miR-34a/449a binding sites are seen within 200 bp of the stop codon of the PACS-1 gene, indicating a strong binding site for the miRNAs. B, stem loop structures of hsa-miRNAs 34a and 449a contain complementary binding sequences shown in green. The source for the stem loop structures is http://www.mirbase.org/cgi-bin/mirna_entry.pl?acc=MI0000268.
To confirm that miRNAs 34a and 449a were expressed in normal cervical tissues and that expression was lost in tumors, we performed qRT-PCR analysis using primers supplied in Applied Biosystems TaqMan qRT-PCT kit (Table 1). The qRT-PCR analysis of normal cervical tissues and corresponding tumors showed expression of hsa-miR-34a and -449a and reduced expression of PACS-1 in normal tissues (Fig. 4A). Tumors showed loss or reduced expression of hsa-miR-34a and -449a accompanied by enhanced PACS-1 expression, confirming the inverse relationship between the two miRNAs and PACS-1. Our data on the expression of miR-34a and miR-449a in normal tissues are also supported by the report, indicating that hsa-miR-34a and hsa-miR-449a are ex-pressed in normal cervical tissues (33) (Fig. S3). Investigation of control HEK cells (precursor cells of cervical epithelium) and cells immortalized with HPV 16 E6, E7, or E6 and E7 genes showed higher expression of hsa-miR-34a in the control HEK cells (top panel in Fig. 4B). The expression was reduced in the E6 and the E6 and E7 transformed cells. This was due to ubiquitination of p53, the protein responsible for the activation of hsa-miR-34a, by the HPV 16 E6 protein. Expression of hsa-miR-449a was not detected in the normal or immortalized HEK cells. Although HEK cells had expression of PACS-1, statistically significant higher expression of PACS-1 was seen in E6 and E7 immortalized HEK cells (bottom panel in Fig. 4B). The analysis thus revealed an inverse relationship between hsa-miR-34a and PACS-1 in the transformed HEK cells.
Figure 4.

Validation of PACS-1 mRNA as a direct target of miR-34a and miR-449a. A, analysis by qRT-PCR shows higher expression of hsa-miR-34a and hsa-miR-449a in normal cervical samples compared with corresponding tumor samples. There is, however, an increased PACS-1 expression in cancer samples compared with normal samples, pointing to the inverse relationship in the expression of hsa-miR-34a/449a and PACS-1. B, qRT-PCR of control and HPV 16 E6, E7, or E6 + E7 transformed HEK cell lines show decreased expression of hsa-miR-34a in E6 and E6 + E7 transformed cell lines accompanied by increased expression of PACS-1 in the two cell lines reflecting inactivation of p53 by the HPV 16 E6 protein and inverse relationship in the expression of hsa-miR-34a and PACS-1. C, luciferase activity with respect to β-gal activity in HeLa and SiHa cells transfected with reporter vectors containing PACS-1 3′-UTR target sequences of hsa-miR-34a or hsa-miR-449a (WT or mutant plasmid vectors), and pre-hsa-miR-34a/449a or respective pre-hsa-miR controls show statistically significant decreased luciferase activity in WT sequence transfected cell lines. Luciferase activity is unaffected in mutant plasmid transfected cell lines, confirming the presence of hsa-miR-34a and hsa-miR-449a binding sites at the 3′ end of the PACS-1 gene (*p < 0.05; **p > 0.05). D, a Northern blotting analysis of three different primary cervical tumors and corresponding normal tissues shows reduced expression of hsa-miR-449a in tumor samples. Whereas reduced hsa-miR-449a expression is seen in HPV-positive cell lines HeLa, SiHa, MS751, and C4-1, expression is lost in HPV-negative cell lines C33A and HT3. Ratio of hsa-miR-449a expression with respect to U6 RNA (top band) clearly points to reduced hsa-miR-449a expression in tumor samples.
To validate hsa-miR-34a– and hsa-miR-449a–mediated inactivation of PACS-1, we transfected HeLa and SiHa cells with WT and mutant PACS-1 3′UTR plasmids containing the luciferase gene along with β-gal plasmid as internal control. The cells were then transfected with precursor hsa-miR-negative control or hsa-miR-34a or hsa-miR-449a precursor miRNAs, and luciferase activity was measured compared with β-gal activity. We observed loss of luciferase activity in the WT plasmid (containing the miR-34a and miR-449a binding sites CACTGCCA….CACTGCCA…) and not in the mutant plasmid (containing four nucleotide substitutions, CACCAAGA….CACCAAGA…, at the binding sites) transfected cell lines (Fig. 4C). These results indicated that the two 8-bp sequences represented hsa-miR-34a and -449a binding sites and that the two miRNAs regulate PACS-1 expression.
Genomic sequence of 200 bp of the 3′UTR from 10 different normal and corresponding cervical cancer tissues did not reveal hsa-miR-34a or hsa-miR-449a binding site mutations in any of the samples (data not shown). Our qRT-PCR analysis has shown that hsa-miR-34a is expressed in normal HEK cells and that the expression is lost in E6 transformed cells (see Fig. 4B). It has also been shown that hsa-miR-34a expression is lost in cervical tumors (24, 25). Therefore, we examined RNA expression of hsa-miR-449a in cervical cancers. The Northern blotting analysis showed reduced expression of hsa-miR-449a in tumor cell lines and primary tumors compared with the corresponding normal tissues (Fig. 4D). In the HPV−ve cell lines, HT3 and C33A, we could not detect hsa-miR-449a expression, indicating a possible role for E6 and E7 genes in the control of hsa-miR-449a expression in HPV+ve tumors. There is evidence to indicate that the E6 protein of HPV 16 or 18 is involved in p53-mediated regulation of hsa-miR-34a (26, 34). It is likely that hsa-miR-449a transcription is affected by the regulation of Rb/E2F1 pathway by the E7 protein of HPVs 16 and 18 (27, 29, 30). Therefore, these results indicated that the absence of hsa-miRNA-34a and hsa-miRNA-449a expression resulted in the loss of PACS-1 regulation, leading to the overexpression of PACS-1 in primary cervical tumors.
Down-regulation of PACS-1 with the siRNA or miRNAs 34a or 449a expression leads to S-phase cell cycle arrest in HeLa cells
To determine the relationship between tumor cell growth and PACS-1 overexpression, siRNA experiments were performed. The propidium iodide–annexin apoptotic assay revealed a minimal increase in apoptosis in PACS-1 siRNA-treated HeLa cells (19.08% versus 17.80%) compared with that of scrambled siRNA–treated cells (Fig. S4). However, addition of FAS ligand led to an increase in apoptosis in PACS-1 siRNA–treated cells (41.72% versus 17.01% in controls), indicating cell growth suppression with the loss of PACS-1 expression. The results indicated that PACS-1 overexpression plays an oncogenic role and that the loss of expression results in tumor cell growth suppression.
To examine whether the miR-34a– and miR-449a–mediated regulation of PACS-1 mimics the effect of siRNA, we performed transfection studies with PACS-1 siRNA and the precursor microRNAs. Cell cycle analysis after a 72-h treatment showed S-phase cell cycle arrest in PACS-1 siRNA–treated cells (representative figure, top panel in 5A shows 43.8% of cells at S phase versus 27.8% in control siRNA). Similarly, a higher fraction of cells in the S phase was seen in hsa-miR-34a or -449a–transfected cells compared with that of scrambled miRNA–treated cells (representative figure shows 26.12% and 33.34% of cells at S phase for hsa-miR-34a and hsa-miR-449a, respectively, versus 17.13% for the control miRNA), indicating an S-phase arrest (bottom panel of Fig. 5A). There was also increase in cells at G1 phase and cell death at sub-G1 in miRNA–transfected cells. Statistical significance (p < 0.05, Fig. 5B) from three independent FACS studies showed that S-phase cell cycle arrest seen with the siRNA is also observed in hsa-miR-34a– or -449a–treated HeLa cells.
Figure 5.
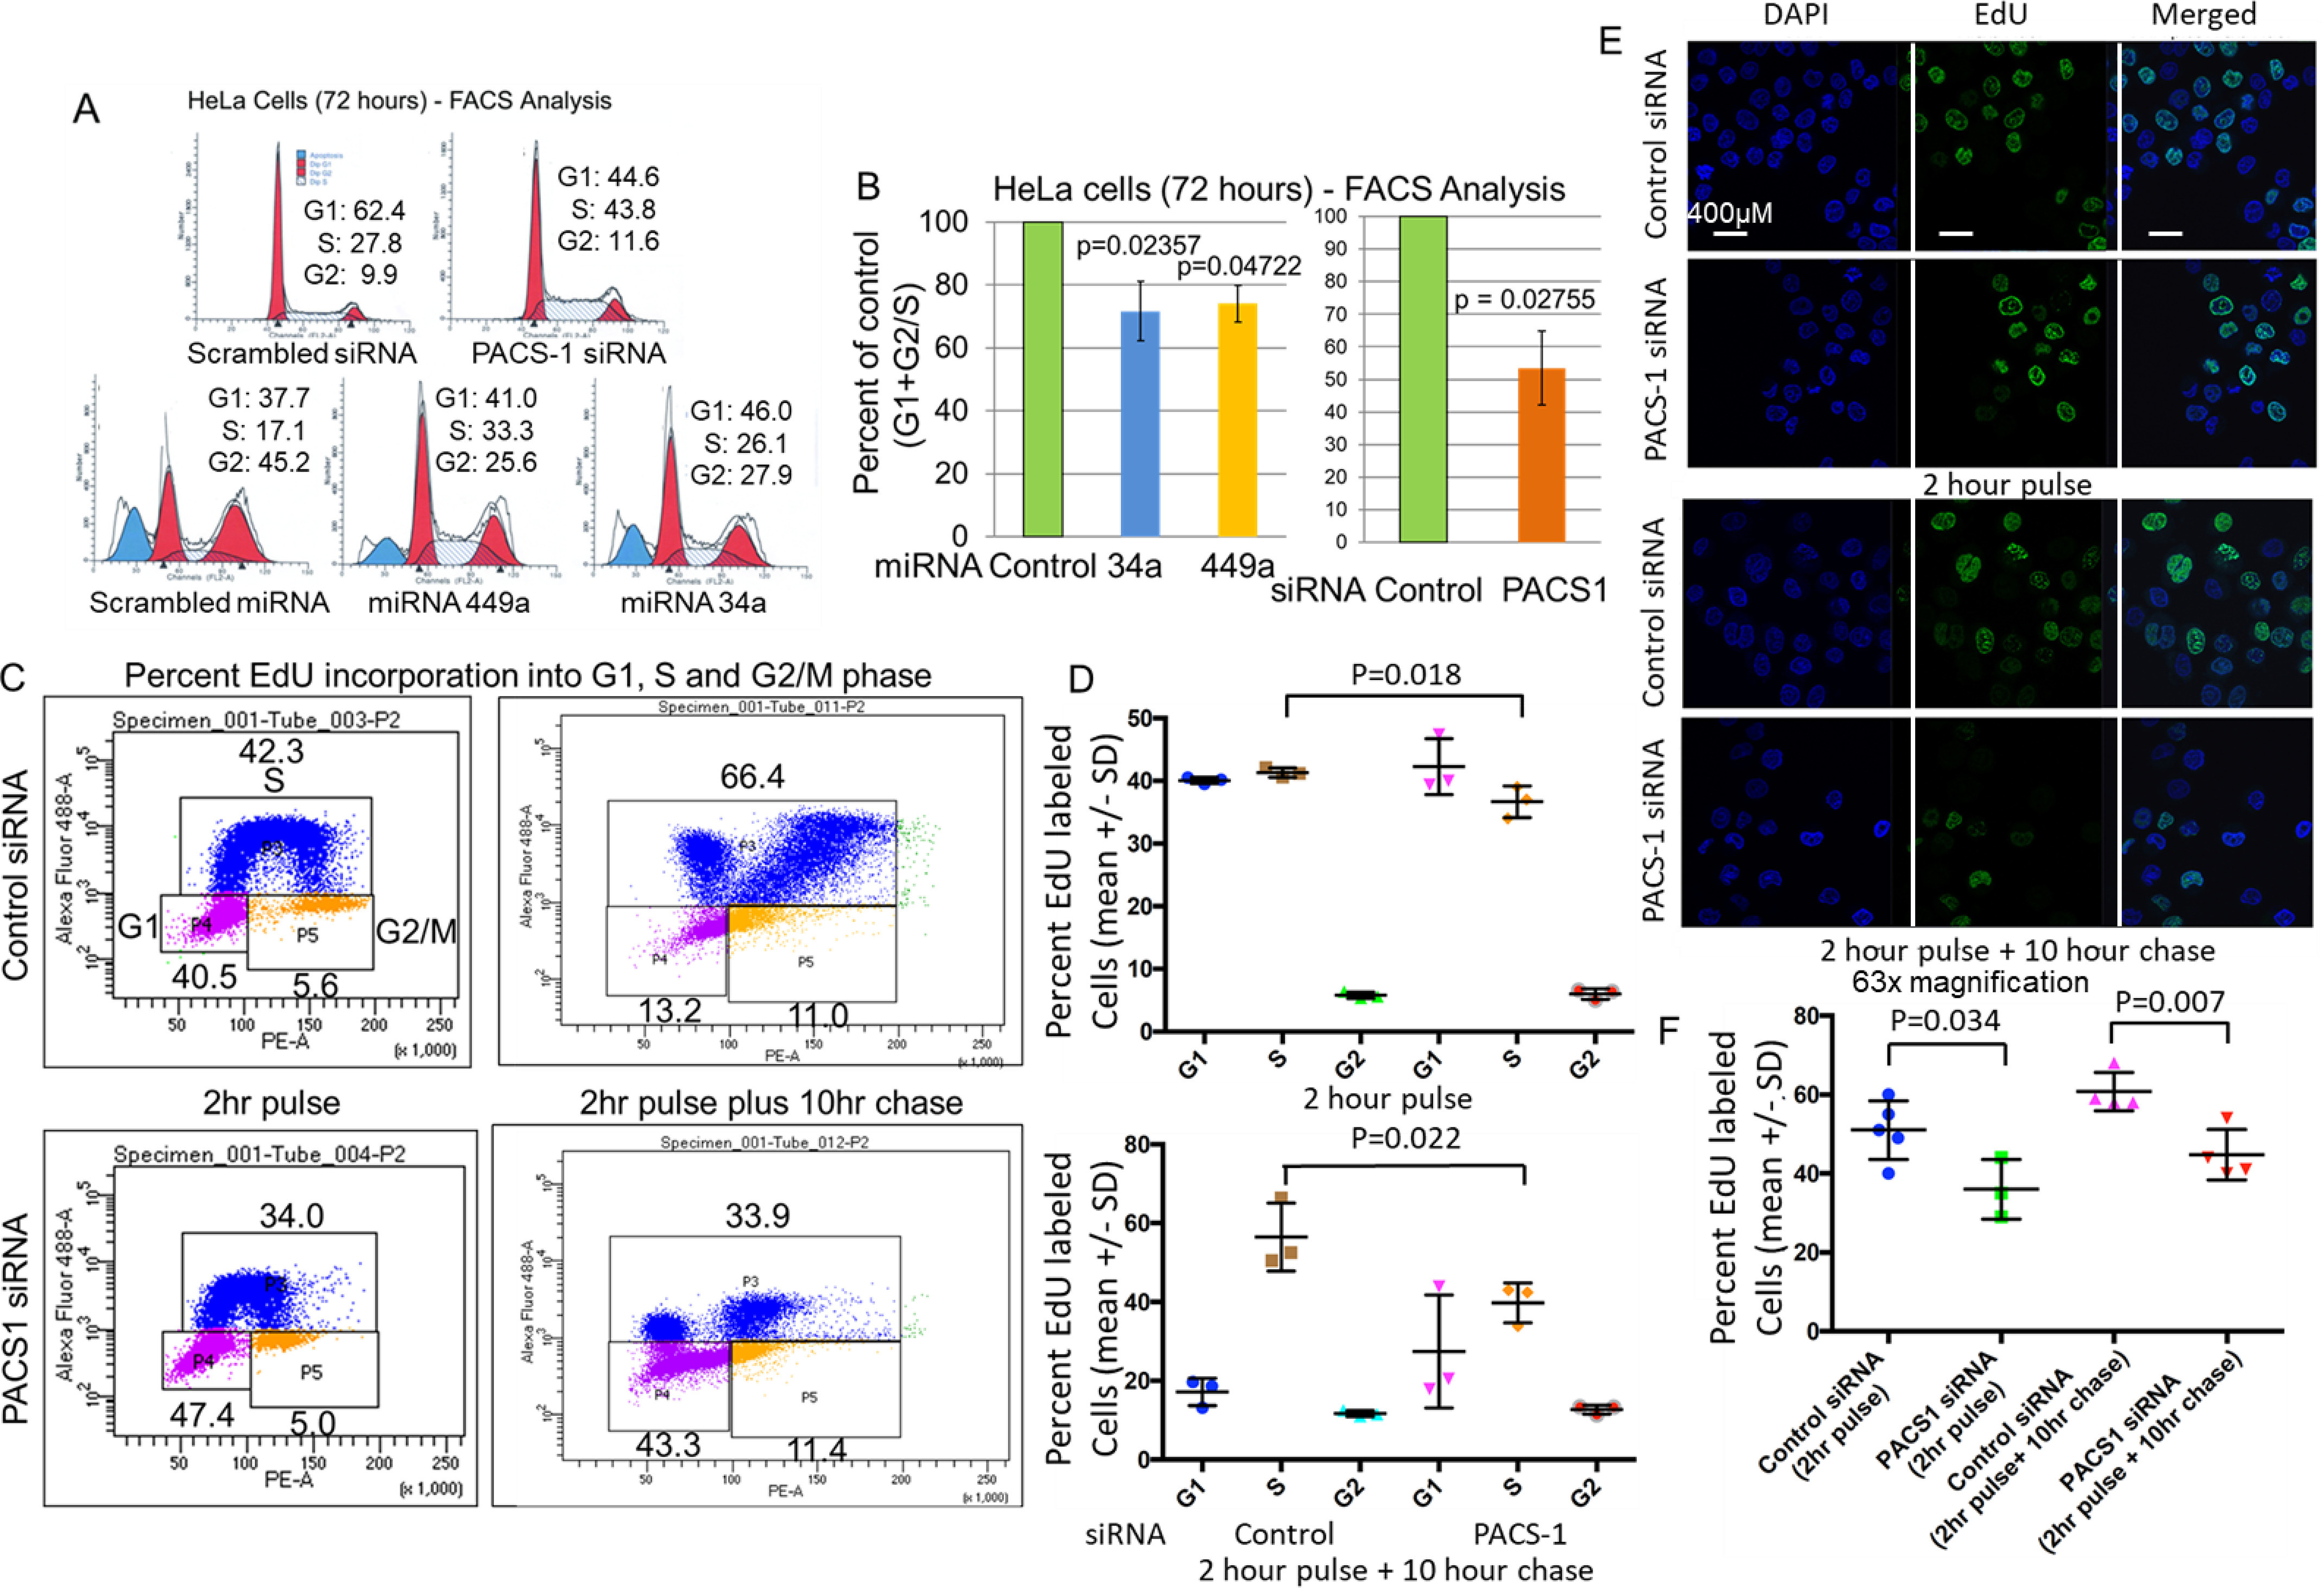
S-phase cell cycle arrest in PACS-1 downregulated HeLa cells. A, FACS analysis of HeLa cells shows delayed S phase in the presence of PACS-1 siRNA (43.8 versus 27.8), indicating a role for the PACS-1 protein in the S phase of the cell cycle. Exogenous expression of hsa-miR-34a or hsa-miR-449a also shows a similar delay in S phase (26.1 and 33.8 for hsa-miR-34a and hsa-miR-449a, respectively, versus 17.1 for the scrambled hsa-miR-control), pointing to the association between inactivation of PACS-1 and S-phase cell cycle arrest. B, bar graph points to statistically significant increase in S phase in hsa-miR-34a–, hsa-miR-449a–, or PACS-1 siRNA–transfected cell lines. C and D, statistically significant decreased Edu incorporation is observed at S phase of both the 2-h pulse and the 2-h pulse and 10-h chase of PACS-1 siRNA–transfected cells. E and F, Immunofluorescence assay confirms reduced nuclear EdU staining of PACS-1 siRNA–transfected cells. Percentage represents green EdU staining compared with total blue 4′,6-diamidino-2-phenylindole (DAPI)-stained cells. Data represent at least three independent studies.
To confirm that loss of PACS-1 expression leads to S-phase cell cycle arrest, using the DNA synthesis assay, we performed incorporation of EdU (DNA synthesis nucleotide precursor) by a pulse-chase experiment. PACS-1 siRNA–transfected HeLa cells had statistically significant reduction in EdU-labeled cells at S phase both in the pulse (2 h) and chase (2-h pulse plus 10-h chase) time periods, indicating decreased DNA replication (Fig. 5, C and D). Two-dimensional FACS analysis (plotting DNA content versus labeled EdU incorporation) of the same cells showed a higher fraction of cells in the 2n–4n stage (S phase) of the cell cycle in PACS-1 siRNA–treated cells (Fig. S5). The S-phase reduction was much lower than the reduction seen in EdU-labeled cells shown in Fig. 5C. This discrepancy in the percentage of S-phase arrested cells in the two experiments is attributed to the fact that single-agent DNA content analysis using propidium iodide staining will not distinguish cells in the early S phase from G1 and late S phase from the G2 phase of the cell cycle (35). The EdU-labeling analysis is therefore an acceptable assay, and our results confirmed that there is S-phase cell cycle arrest with the loss of PACS-1 expression.
To determine the fraction of EdU-labeled DNA through the immunofluorescence assay, confocal microscopic analysis was performed. The data showed significant reduction (p = 0.034) in the EdU-labeled green signals in 2-h pulse PACS-1 siRNA–treated HeLa cells, pointing to reduction in DNA synthesis (Fig. 5, E and F). The reduction in EdU labeling was highly significant (p = 0.007) in the 2-h pulse plus 10-h chase PACS-1 siRNA–treated cells, indicating reduced incorporation into the second wave of DNA synthesis at the S phase of the cell cycle. 4′,6-diamidino-2-phenylindole labeling confirmed the presence of EdU-labeled cells in the nucleus. Thus, a second method of DNA-labeling studies confirmed a direct relationship between loss of PACS-1 expression and S-phase cell cycle arrest.
Induction of DDR and cell-growth suppression with the loss of PACS-1 expression in HeLa cells
Arrest of cells at S phase will result in DDR, as noticed by enhanced expression of γH2AX and BRCA1. To test this hypothesis, we induced DDR with doxorubicin and etoposide (4-h treatment 48 h post siRNA or cDNA transfections) with the loss or overexpression of PACS-1 in HeLa cells. Loss of PACS-1 expression was seen by the loss of a 120-kDa protein band in PACS-1 siRNA–treated cells (Fig. 6A), Confocal microscopic studies showed statistically significant (p < 0.0001) increased expression of γH2AX and BRCA1 in PACS-1 siRNA–transfected cells and decreased expression in PACS-1 cDNA–transfected cells (Figs. 6, B–E), confirming the inverse relationship between DDR and PACS-1 expression. To determine whether DDR induction in PACS-1–depleted cells leads to cell growth arrest, soft agar colony formation assay was performed. The growth assay demonstrated statistically significant (p < 0.00001) loss of HeLa cell growth in PACS-1 siRNA–treated cells (Fig. 6, F and G). These results clearly demonstrated that the loss of PACS-1 results in S-phase cell cycle arrest, DDR induction, and tumor cell growth suppression in the HPV 18–containing HeLa cells.
Figure 6.
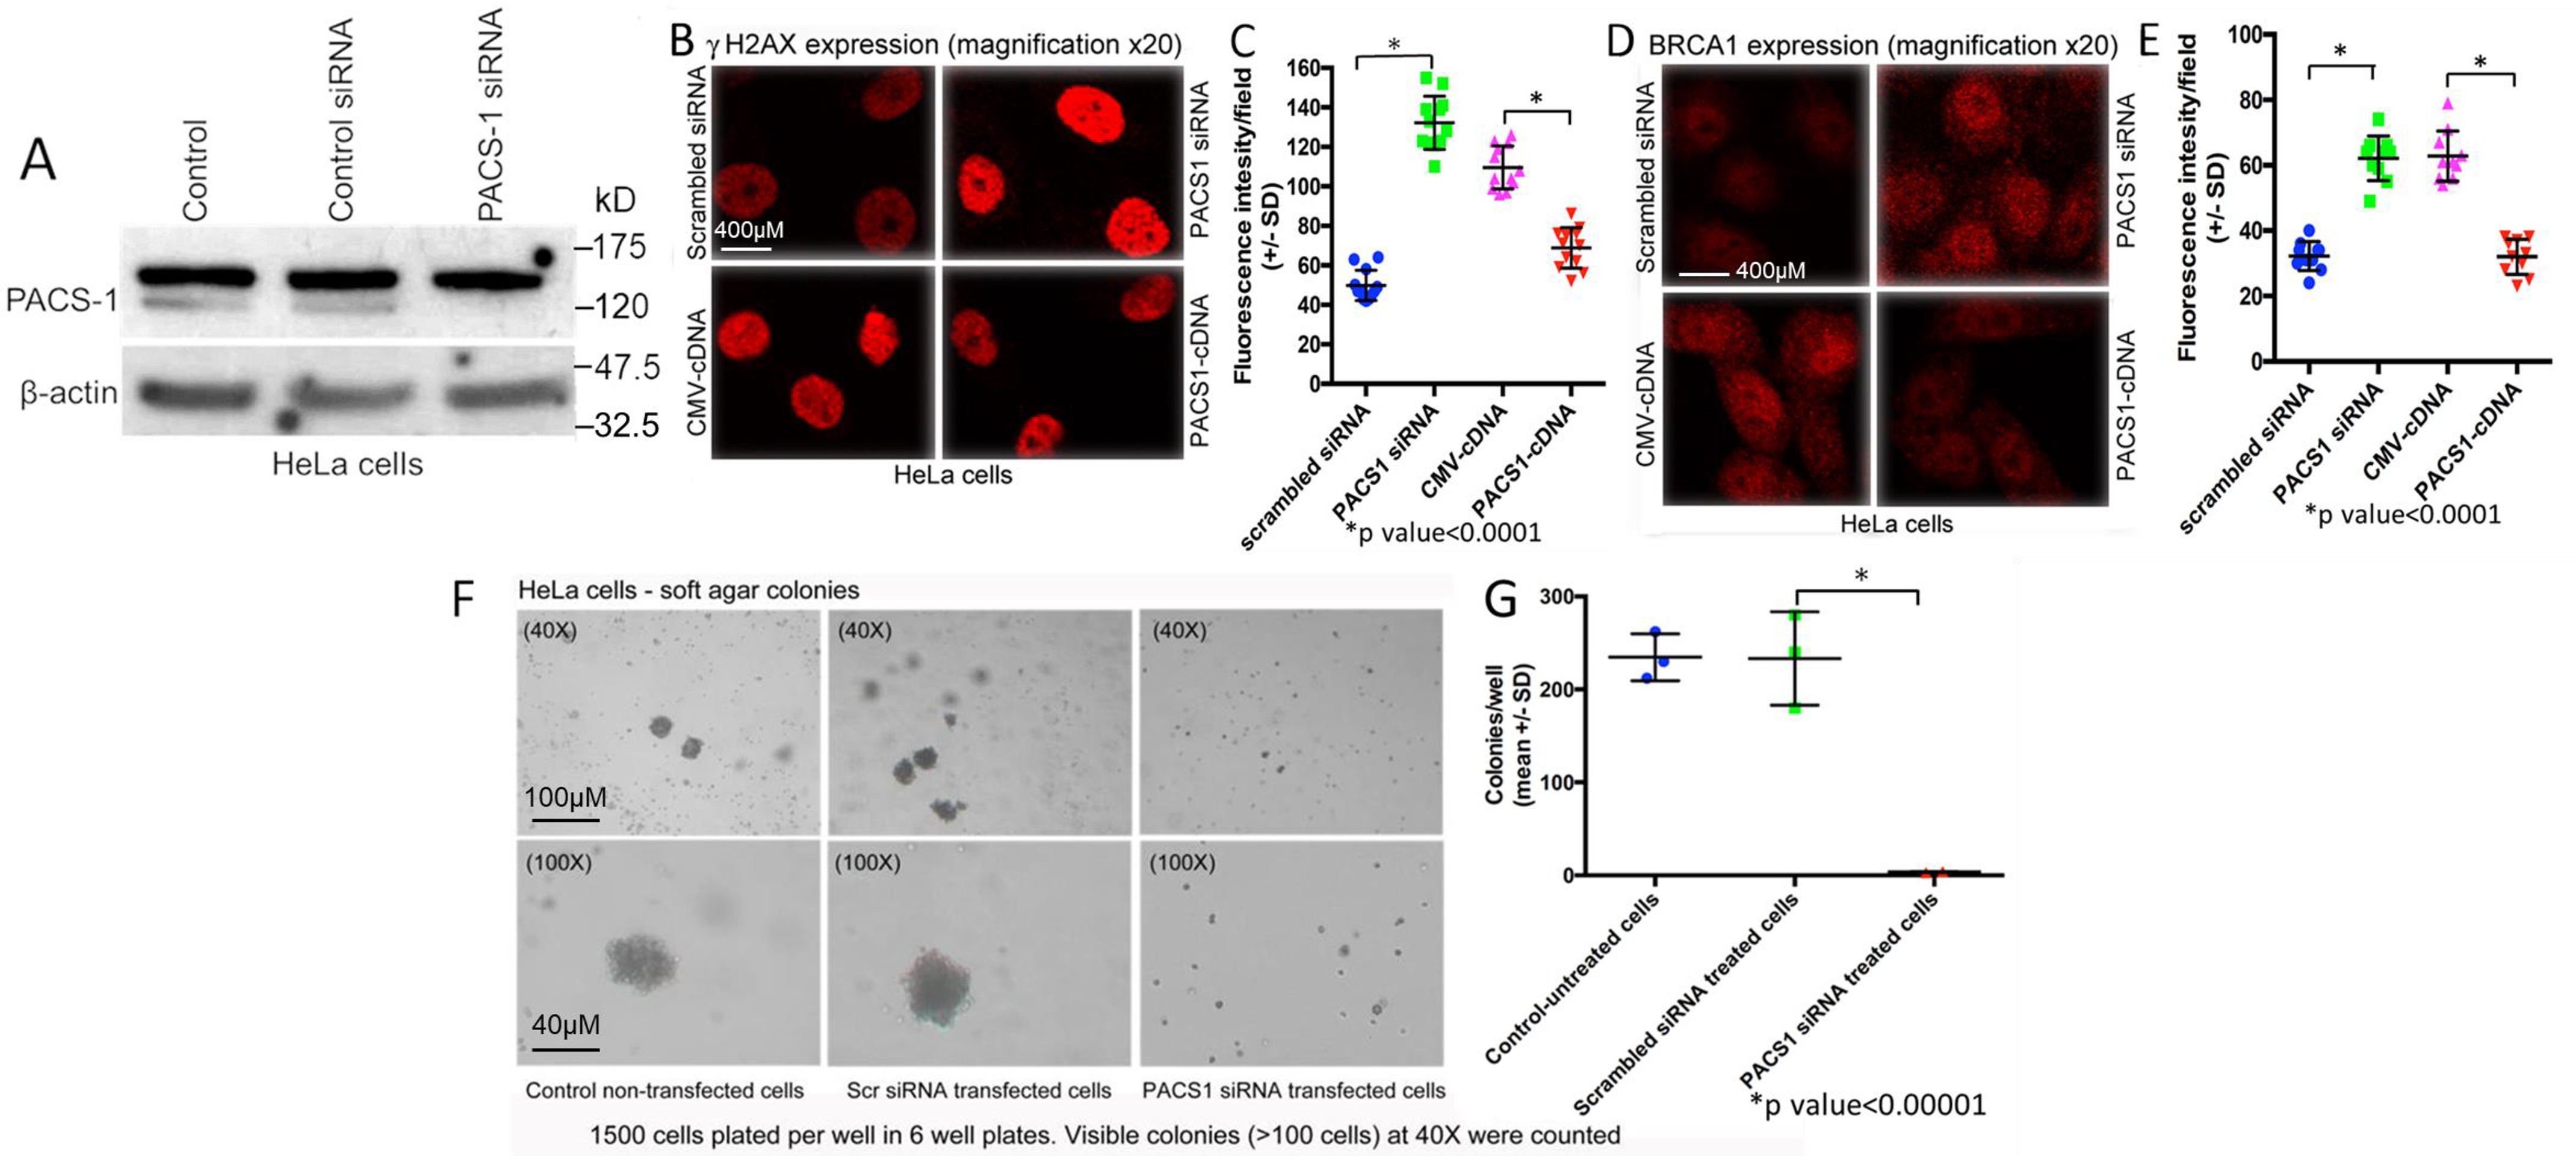
Induction of DDR with the loss of PACS-1 expression in HeLa cells. A, loss of 120-kDa PACS-1 protein band in the Western blots after 48-h treatment with PACS-1 siRNA. B and C, confocal microscopy of HeLa cells transfected with controls, siRNA, or PACS-1 cDNA for 48 h and then treated with doxorubicin (0.5 µm) and etoposide (50 µm) for 4 h shows up-regulation of γH2AX with PACS-1 siRNA and down-regulation with PACS-1 overexpression. D and E, statistically significant up-regulation of another DDR marker BRCA1 with the loss of PACS-1 expression and down-regulation with PACS-1 overexpression is seen. Values represent mean intensity of 20 measurements ± S.D. (p < 0.0001). F and G, soft agar colony formation assay of PACS-1 siRNA–transfected cells plated onto soft agar 48-h posttransfection shows absence of colonies (measured as >100 cells) compared with the control untreated or nonspecific siRNA treated cells, indicating statistically significant (p < 0.00001) reduction in tumor cell line growth with the loss of PACS-1 expression.
Cell growth suppression and induction of DDR with the loss of PACS-1 expression in the SiHa cells
To determine whether S-phase cell cycle arrest and cell growth suppression occurs in PACS-1–depleted SiHa cells, an HPV 16–containing cervical cancer cell line, growth assays were performed. The hsa-miR-34a or -449a–transfected SiHa cells showed elongated structures indicating cellular senescence (Fig. 7A). Staining of the cells with β-gal pointed to the presence of blue cells, confirming senescence-mediated cell death, i.e. p53/p21-mediated cellular senescence (Fig. 7B). Cell growth assay studies also showed presence of tiny soft agar colonies in hsa-miR-34a or -449a–transfected SiHa cells compared with the large colonies observed in untreated or scrambled miRNA–transfected cells (Fig. 7C). Further, the miRNA-transfected colonies appeared in 4 weeks compared with the appearance of control colonies in less than 2 weeks, clearly demonstrating a statistically significant (p < 0.0001) growth inhibitory effect of the two miRNAs (Fig. 7D). Correspondingly, analysis of protein expression in Western blots confirmed inhibition of PACS-1 expression in miRNA-transfected cells and that cellular senescence was related to the increased expression of p53 and p21 genes (Fig. 7E).
Figure 7.
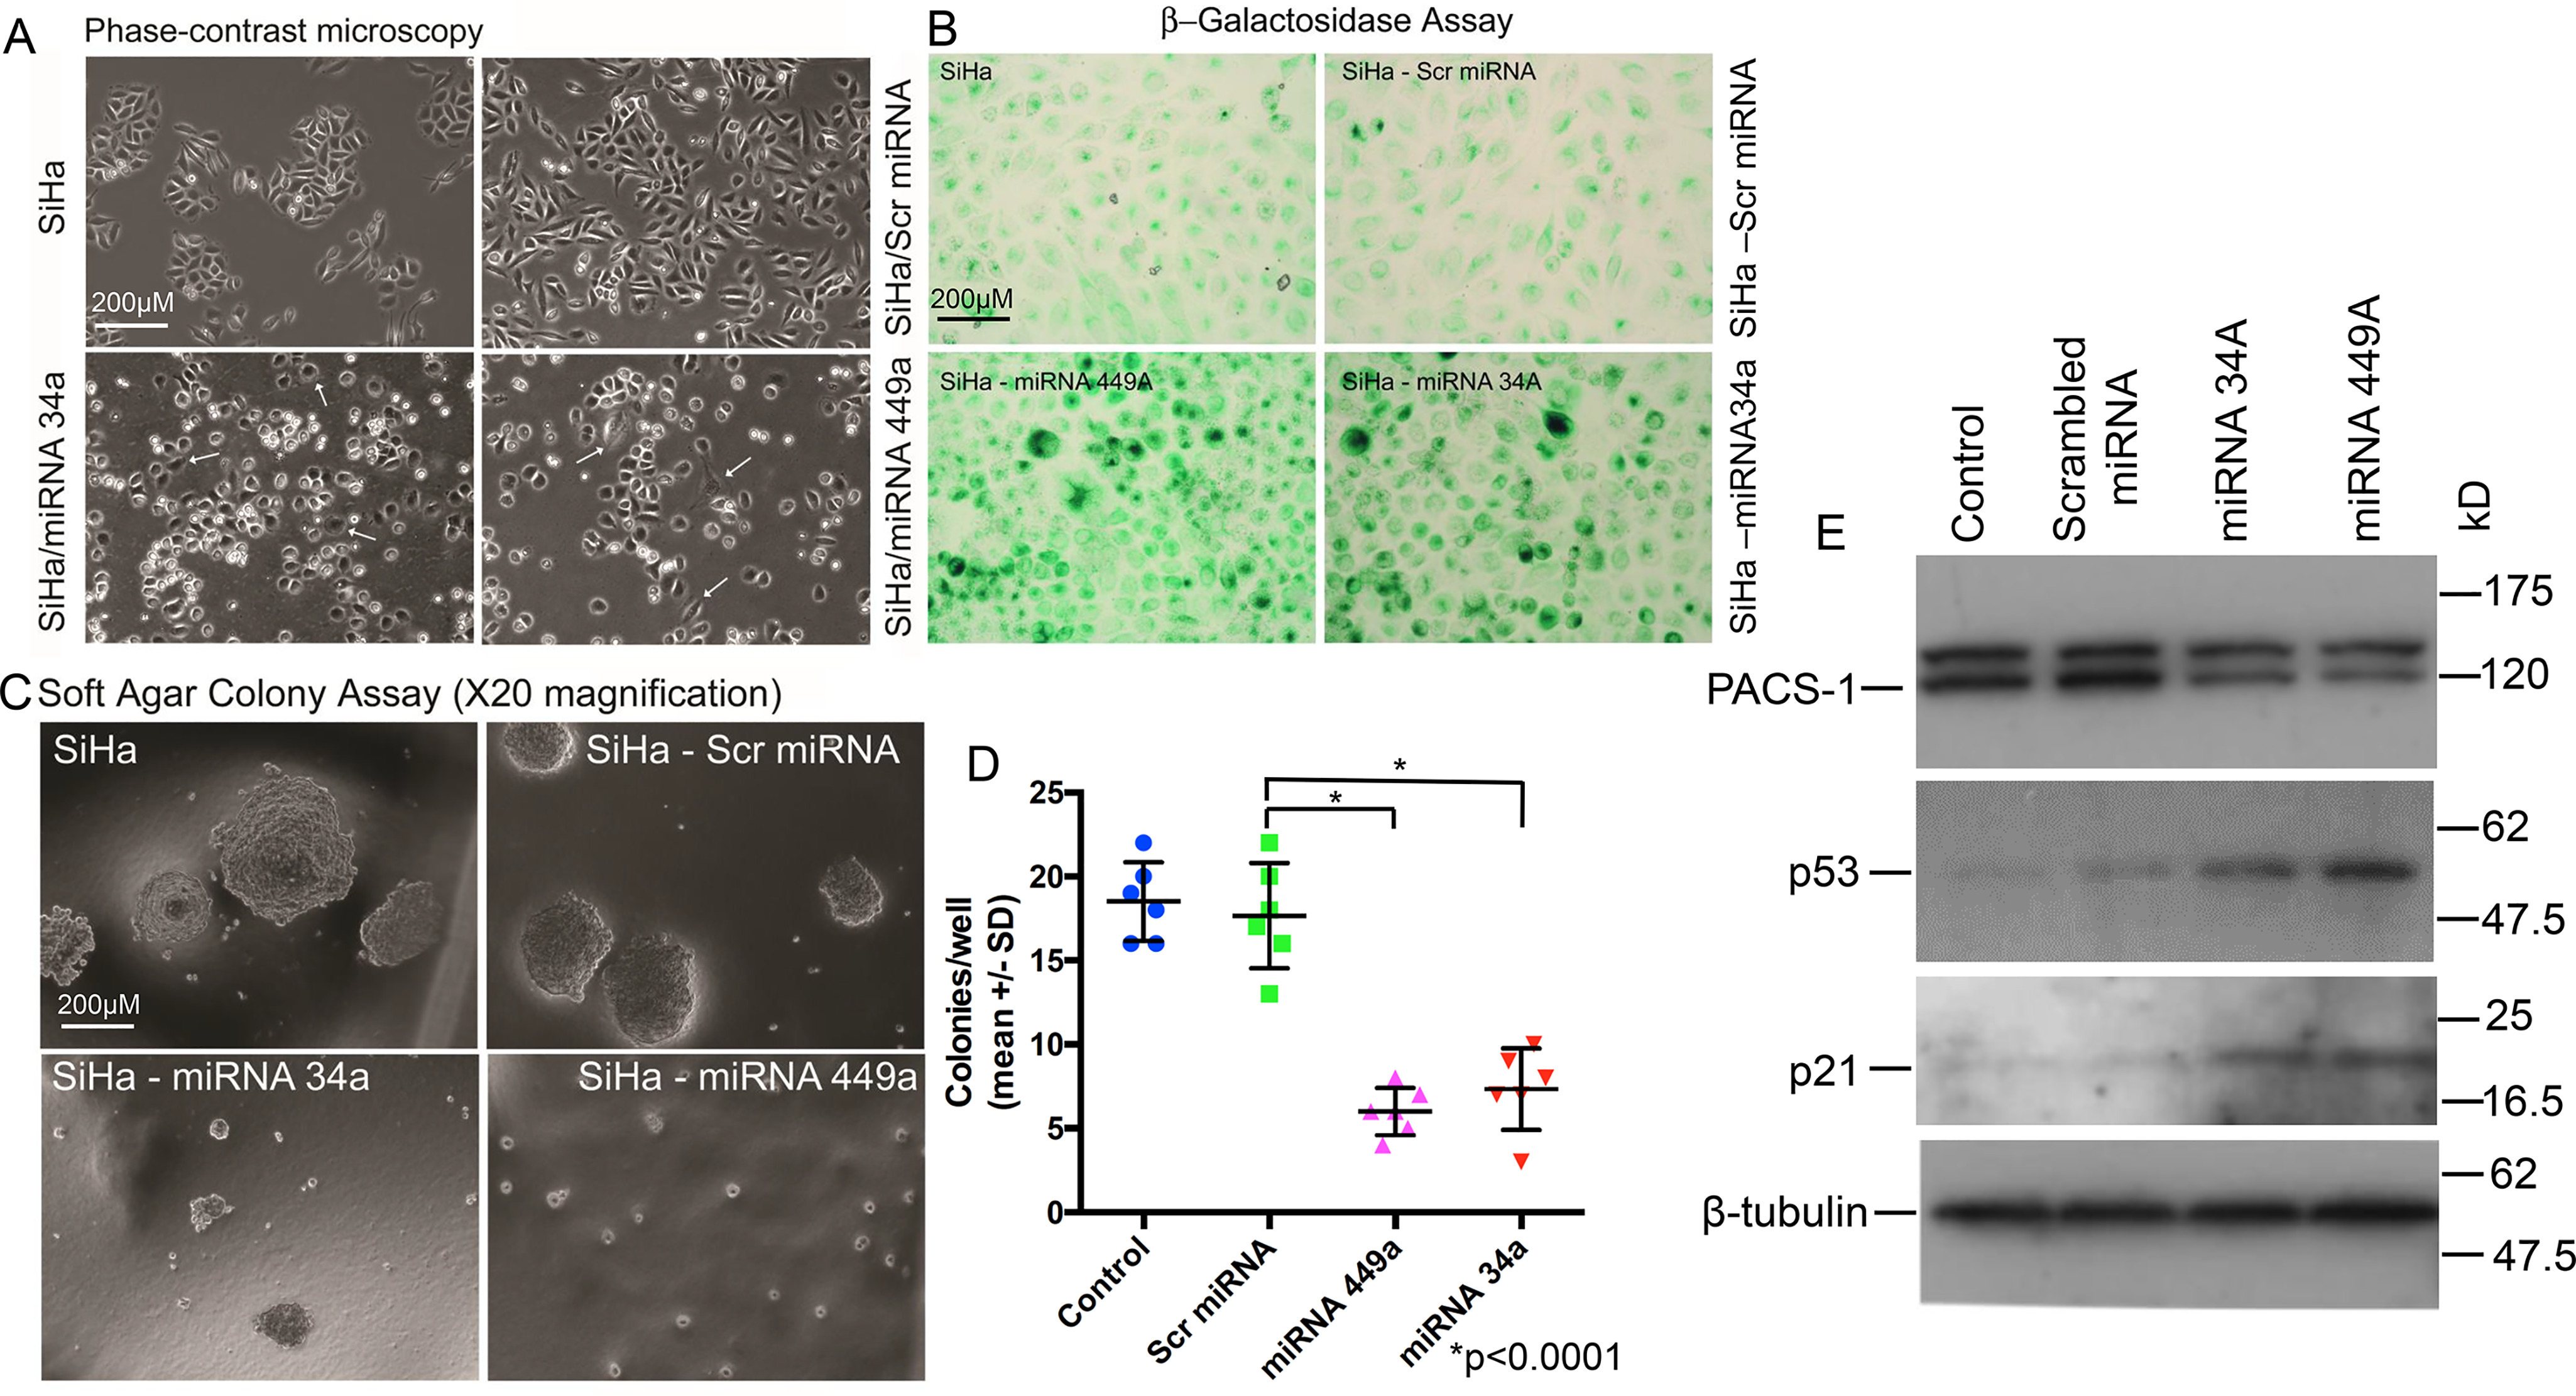
Expression of hsa-miR-449a leads to growth suppression of SiHa cells. A, phase-contrast microscopy of the miRNA-treated SiHa cells shows senescent and dying cells, pointing to the growth suppressive effect of hsa-miR-34a and hsa-miR-449a. B, staining with β-gal indicates the presence of blue cells in hsa-miR-34a– or hsa-miR-44a–transfected SiHa cells, indicating induction of senescence by these two miRNAs. C, colony formation assay shows large colonies in the untreated and control miRNA–transfected SiHa cells. Absence of large colonies in the hsa-miR-34a– or -449a–treated SiHa cells points to the role of these two hsa-miRNAs in cancer cell line growth suppression. D, scatter plot shows significant reduction (p < 0.0001) in soft agar colony formation of hsa-miR-34a– or hsa-miR-449a–expressing cells. E, Western blotting analysis confirms the role of hsa-miR-34a– and hsa-miR-449a–mediated inactivation of PACS-1 and activation of p53 and p21 genes, pointing to p53/p21 mediated cell death.
To confirm the inverse relationship between DDR and PACS-1, transfection studies were carried out using hsa-miR-449a alone or in combination with LNA-hsa-anti-miR-449a or PACS-1 plasmid cDNA in SiHa cells. Introduction of hsa-miR-449a led to loss of PACS-1 expression, and cotransfection with LNA-hsa-anti-miR-449a resulted in the re-expression of PACS-1 (loss of 120-kDa protein band with hsa-miR-449a and reappearance with LNA-hsa-anti-miR-449a) accompanied by decreased expression of p53 (Fig. 8A). Increased expression of γH2AX and p53 with the introduction of hsa-miR-449a and decreased expression post cotransfection with LNA-hsa-anti-miR-449a indicated reversal of the hsa-miR-449a–mediated DDR by re-expression of PACS-1 in LNA-hsa-anti-miR-449a–expressing cells.
Figure 8.
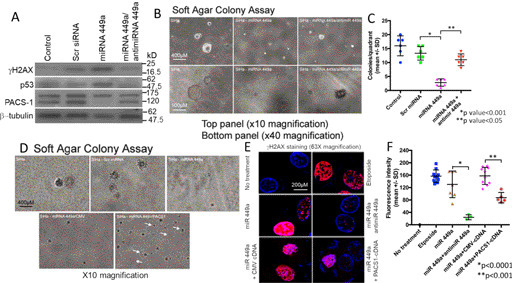
Relationship between PACS-1 and DDR to cell growth in hsa-miR-449a–expressing SiHa cells. A, loss of PACS-1 expression with hsa-miR-449a transfection leads to increased expression of γH2AX and p53, and cotransfection with LNA-hsa-anti-miR-49a results in the re-expression of PACS-1 accompanied by down-regulation of γH2AX and p53. B, growth suppression of SiHa cells by hsa-miR-449a is also reversed by cotransfection with LNA-hsa-anti-miR-449a, pointing to the inverse relationship between PACS-1 expression and cell growth inhibition. C, scatter plot shows statistically significant SiHa cell line growth suppression and reversal of growth suppression with the introduction of LNA-anti-miR-449a. D, large colonies of SiHa cells become small colonies after transfection with hsa-miR-449a. Cotransfection of hsa-miR-449a with PACS-1 cDNA results in the appearance of a higher number of larger colonies than that of hsa-miR-449a– and CMV-cDNA–transfected cells. Thus, there is reversal of hsa-miR-449a–mediated growth suppression by exogenous PACS-1 re-expression. White arrows point to colonies in PACS-1 cDNA–transfected cells. E, confocal microscopy confirms γH2AX foci formation in SiHa cells in the presence of hsa-miR-449a and the reversal of this phenotype with the introduction of anti-miR-449a or the PACS-1 cDNA. Whereas etoposide (50 µm) treatment for the DNA damage–mediated overexpression of γH2AX was used as the positive control, transfection with CMV cDNA was used as the control for transfection studies. F, scatter plot shows statistically significant reversal of γH2AX foci formation by cotransfection with LNA-anti-hsa-miR449a (p < 0.0001) or PACS-1 cDNA (p < 0.001). Values represent mean intensity of 20 measurements ± S.D.
Soft agar colony formation studies showed statistically significant (p < 0.001) cell growth inhibition by hsa-miR-449a and reappearance of medium colonies by cotransfection with LNA-hsa-anti-miR-449a, pointing to the reversal of growth suppression with the re-expression of PACS-1 (Fig. 8, B and C). Although colony size was small, there was an increase in the number of soft agar colonies in the hsa-miR-449a and PACS-1 cDNA cotransfected cells compared with hsa-miR-449a alone or in combination with control cDNA–transfected cells, confirming an inverse relationship between PACS-1 expression and SiHa cell line growth (Fig. 8D). Further, confocal microscopy showed enhanced γH2AX expression in hsa-miR-449a–transfected cells and decreased expression in the presence of LNA-hsa-anti-miR-449a or PACS-1 cDNA (63× magnification data are shown in Fig. 8E). Intensity measurements confirmed increased γH2AX fluorescence in hsa-miR-449a–transfected cells and a statistically significant (p < 0.0001) reduction in fluorescence intensity by cotransfection with LNA-hsa-anti-miR-449a (Fig. 8F). Significant reduction of γH2AX fluorescence (p < 0.001) was also seen by cotransfection of PACS-1 cDNA, indicating reversal of DDR with PACS-1 re-expression.
To find out whether the reversal of colony formation and PACS-1 expression could also be seen with LNA-hsa-anti-miR-34a, SiHa cells transfected with hsa-miR-34a alone or in combination with LNA-hsa-anti-miR-34a were assayed for colony formation in soft agar. The analysis showed statistically significant reduction in colony formation in the hsa-miR-34a–transfected cells (p < 0.0001) compared with the reagent and hsa-miR-control–transfected cells (Fig. 9, A and B). An increase in colony number and size was observed in LNA-hsa-anti-miR-34a cotransfected cells (p < 0.0001), confirming the growth inhibitory effect of hsa-miR-34a correlating to reduced PACS-1 expression and reversal of growth inhibition with the increase in PACS-1 expression. Western blotting analysis showed reduced expression of PACS-1 with hsa-miR-34a compared with the reagent or hsa-miR-control–transfected cells (Fig. 9C). Although cotransfection of LNA-hsa-anti-miR-34a with hsa-miR-34a showed an increase in PACS-1 expression, the increase was not as pronounced as seen with LNA-hsa-anti-miR-449a/hsa-miR-449a cotransfected cells shown in Fig. 8A. Expression of p53 increased with hsa-miR-34a compared with hsa-miR-control–transfected cells. However, as opposed to LNA-hsa-anti-miR-449a–induced reduction in p53 expression, inclusion of LNA-hsa-anti-miR-34a did not result in the abolition of p53 expression. This could be attributed to the interdependent regulation of p53 and hsa-miR-34a genes (36). Transfection of hsa-miR-34a resulted in the enhanced expression of Ac-Lys382-p53 and γH2AX, and the expression was reduced in LNA-hsa-anti-miR-34a cotransfected cells. Acetylation of p53 with hsa-miR-34a and deacetylation in combination with LNA-hsa-anti-miR-34a can be attributed to the inhibitory effect of hsa-miR-34a on p53 deacetylase, SIRT1, and the reversal with LNA-hsa-anti-miR-34a. Our studies have thus confirmed the inverse relationship of PACS-1 to DDR and cell growth suppression in both the HPV 16 and 18 positive cervical cancer cell lines.
Figure 9.

Inverse relationship between PACS-1 expression and cell growth in hsa-miR-34a–transfected SiHa cells. A and B, soft agar colony formation assay shows statistically significant (p < 0.0001) loss of colony-forming ability post hsa-miR-34a transfection, and this growth suppression is reversed in LNA-hsa-anti-miR-34a cotransfected cells. C, transfection with hsa-miR-34a leads to decreased PACS-1 expression accompanied by increased expression of Ac-Lys382-p53 and γH2AX. Cotransfection with LNA-hsa-anti-miR-34a leads to increase in PACS-1 expression and reduction in the expression of Ac-Lys382-p53 and γH2AX, pointing to the inverse relationship between PACS-1 and DDR. Increased p53 expression observed with hsa-miR-34a compared with the miR-control is not reversed in LNA-hsa-anti-miR-34a cotransfected cells.
PACS-1 loss with the siRNA is associated with DDR but not with other hsa-miR-34a or hsa-miR-449a targets
In addition to S-phase cell cycle arrest and DDR, miRNAs 34a and 449a target other proteins, implying a pleotropic effect. To determine whether PACS-1 siRNA transfection leads to inhibition of other proteins targeted by miRNAs 34a and 449a, we analyzed HeLa and SiHa cells transfected with PACS-1 siRNA. The Western blotting analyses showed increased expression of γH2AX and Ac-Lys382–p53 and –p21, confirming DDR and p53 activation (Fig. 10, A and B). There was no change in the expression of SIRT1, HDAC1, or CDK 6 in PACS-1 siRNA–transfected cells compared with the control siRNA transfected cells, indicating that other target genes of hsa-miR-34a and -449a are not affected by the loss of PACS-1 expression. Further, inactivation of p53 in PACS-1 knocked-down cells did not alter γH2AX expression, indicating the p53 effect to be downstream of DDR (Fig. 10C). Although there was reduced γH2AX expression in PACS-1 siRNA plus vector EGFP cDNA–transfected cells compared with PACS-1 siRNA alone–transfected cells, PACS-1 re-expression with EGFP–PACS-1 cDNA resulted in the loss of γH2AX expression, confirming the inverse relationship between PACS-1 and DDR. These results pointed out that loss of PACS-1 plays a role in DDR without affecting other hsa-miR-34a/449a targets. Also, activation of p53 through Lys382 acetylation without affecting p53 expression (compared with the control siRNA–treated cells) indicates that p53 is a downstream target of DDR. At present, we do not know the deacetylase inhibited in PACS-1 siRNA–treated cells and therefore cannot speculate whether p53 acetylation is a direct or an indirect effect of PACS-1.
Figure 10.

Inverse relationship between PACS-1 and DDR. A, treatment of HeLa cells with PACS-1 siRNA leads to loss of PACS-1 expression accompanied by increased expression of γH2AX, Ac-Lys382-p53, and p21. There was no change in the expression of HDCA1, SIRT1, or CDK6 proteins. B, SiHa cells also show loss of PACS-1 expression (indicated by the arrow) accompanied by increased expression of γH2AX, Ac-Lys382-p53, p21, and p-Ser-317-chk1. C, Western blotting showing increased γH2AX expression in PACS-1 siRNA–treated cells that is not affected by the loss of p53 expression. Transfection of EGFP-plasmid cDNA 40 h posttransfection of PACS-1 siRNA shows γH2AX expression. Reduced expression compared with PACS-1 siRNA alone could be attributed to plasmid DNA transfection–induced genomic stress. However, γH2AX expression is lost with the re-expression of PACS-1 through EGFP-PACS-1 plasmid cDNA, pointing to a PACS-1–mediated reversal of DDR.
Genomic instability with the loss of PACS-1 expression
To understand the relationship between PACS-1 and p53, FACS analysis was performed with the inactivation of PACS-1 or both PACS-1 and p53. We could observe an increase in S phase accompanied by the presence of cells in 2n–4n stage (aneuploidy) and an absence of cells at the G2 phase in PACS-1 siRNA–treated cells (middle panel in Fig. 11A). Additional loss of p53 with p53 siRNA led to the disappearance of 2n–4n cells (aneuploidy) and the appearance of cells at G2 phase (bottom panel in Fig. 11A). To verify the relationship between PACS-1 and p53 further, RNA-seq analysis was performed on the cells used for the FACS studies. RNA-seq data showed that PACS-1 siRNA mediated down-regulation of cell cycle–related oncogenes (CDK6, CTNNB1/β catenin-1, and NFkB1) and up-regulation of tumor suppressor genes (STK11/LKB1 and cystatins A and B), with a decrease or increase of at least 50% of control siRNA (Fig. 11B). These changes were reversed with the inactivation of p53, confirming the relationship between PACS-1 and p53. Several hsa-miR-449a target genes HDAC1, E2F1, SIRT1, SIRT2, CDK4, and CDC25A, however, were not affected by the inactivation of PACS-1. Although we have seen an inhibitory effect of PACS-1 loss on CDK6 at the RNA level, this effect is not observed at the protein level (see Fig. 10A), indicating that CDK6 may not be a PACS-1 siRNA target for cell cycle arrest.
Figure 11.
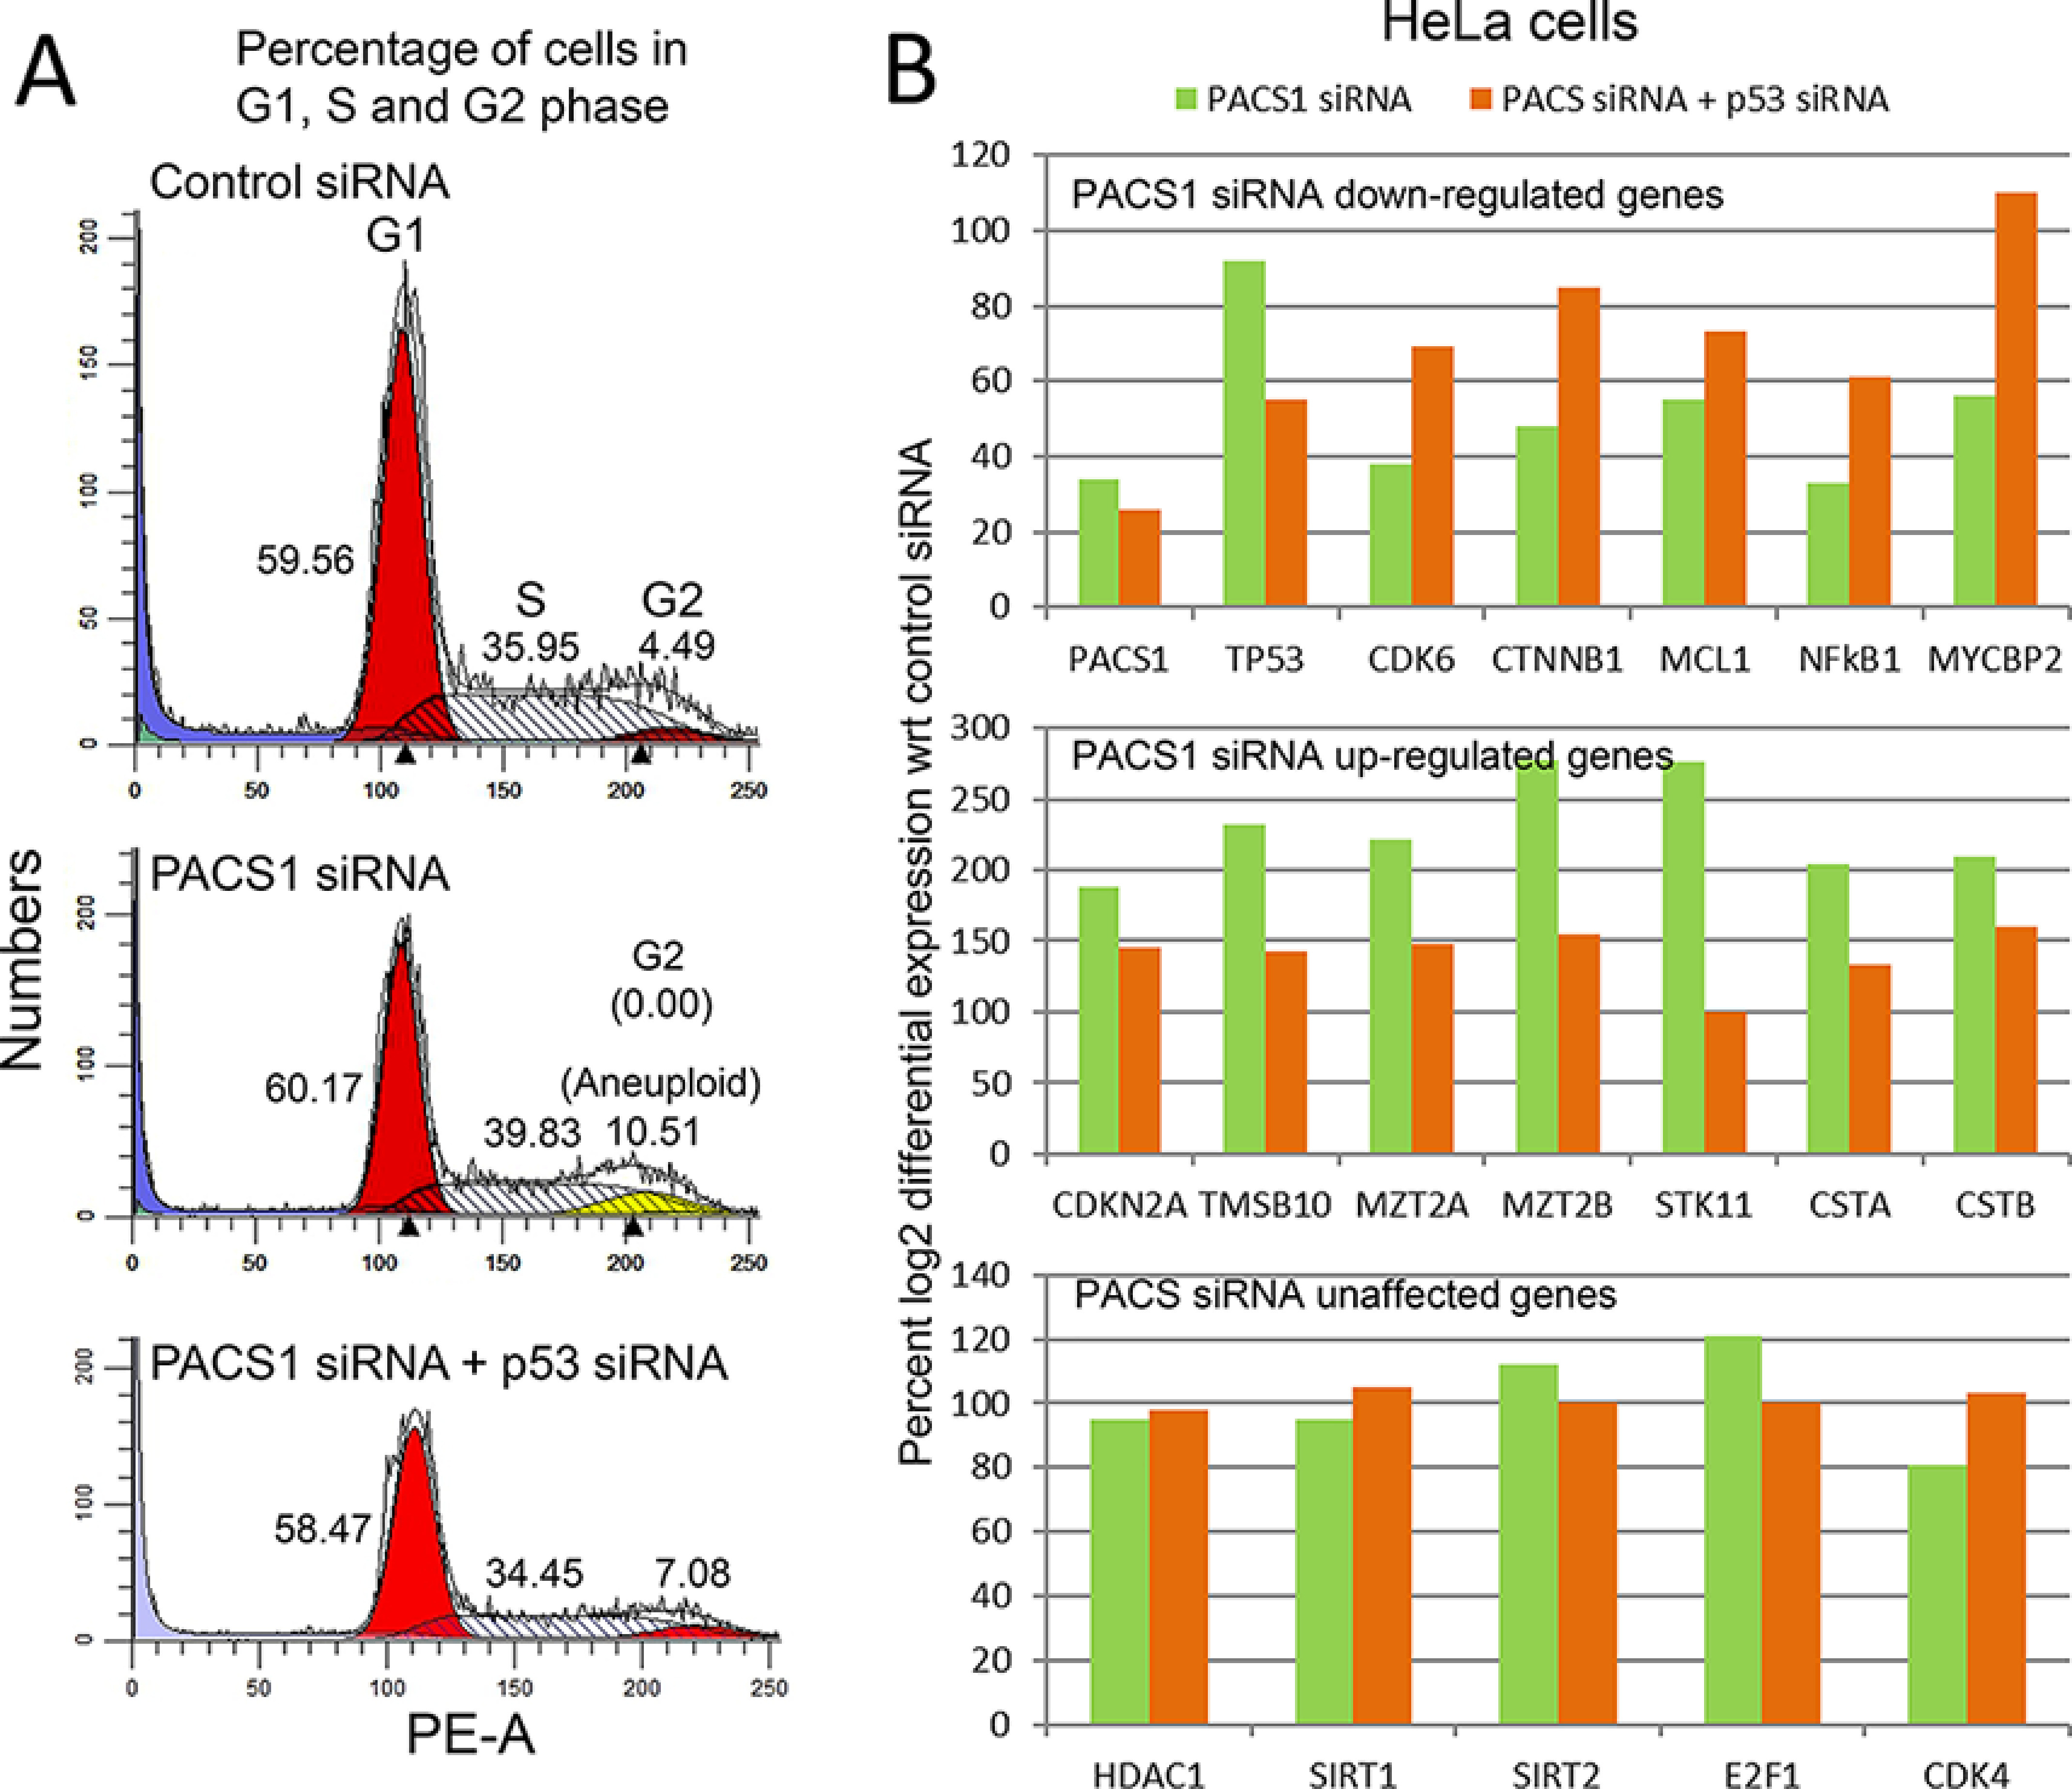
Loss of PACS-1 results in genomic instability. A, a representative figure indicates that HeLa cells transfected with PACS1 siRNA show retention of cells in 2n–4n stage (G1 and S phase) of the cell cycle, and this effect is reversed with the inactivation of p53 with p53 siRNA. B, relative RNA expression of PACS1 siRNA–treated cells shows down-regulation of oncogenes (less than 60% of the control) or up-regulation (above 190% of the control) of tumor suppressor genes. These changes are reversed by p53 inactivation with p53 siRNA. Expression of CDK4, E2F1, HDAC1, SIRT1, and SIRT2 genes is unaffected (between 70 and 120% of the control) by the loss of PACS-1 expression alone or in combination with the loss of p53.
Gene Ontology analysis of the RNA-seq data showed a reduction in the G2-M pathway gene expression in PACS-1–inactivated cells, which was reversed with the additional loss of p53 (Fig. S6). However, an increase in DNA repair pathway with PACS-1 loss was not affected by the loss of p53. p53 pathway gene expression was decreased in p53 siRNA–treated cells serving as a positive control for these studies.
Karyotype analysis of HeLa cells is extremely difficult because of the presence of innumerable deletions and translocations present in 64 chromosomes of this cell line. Thus, we decided to perform whole genomic sequencing of this cell line and a normal human fibroblast cell line (GM00023) to identify copy number variations (CNVs) as a measure of PACS-1 loss-induced genomic instability. We observed statistically significant CNVs in the intragenic regions of number of chromosomes (Fig. S7, A–D). Representative CNVs of chromosome 22 in GM00023 and chromosome 16 in HeLa cells are presented in Fig. 12, A–C. Cotransfection with p53 siRNA led to the appearance of a different set of CNVs and reversal of PACS-1 siRNA–associated CNVs (Fig. 12C). These results suggested that p53 plays a role in DNA replication, as also suggested by Klusmann et al. (37), leading to the development of aneuploidy in PACS-1 inactivated cells. Aneuploidy is lost with the additional loss of p53. Thus, PACS-1 loss leads to genomic instability, DDR, and p53-mediated cell death, and these phenotypes are lost with the inactivation of both p53 and PACS-1.
Figure 12.
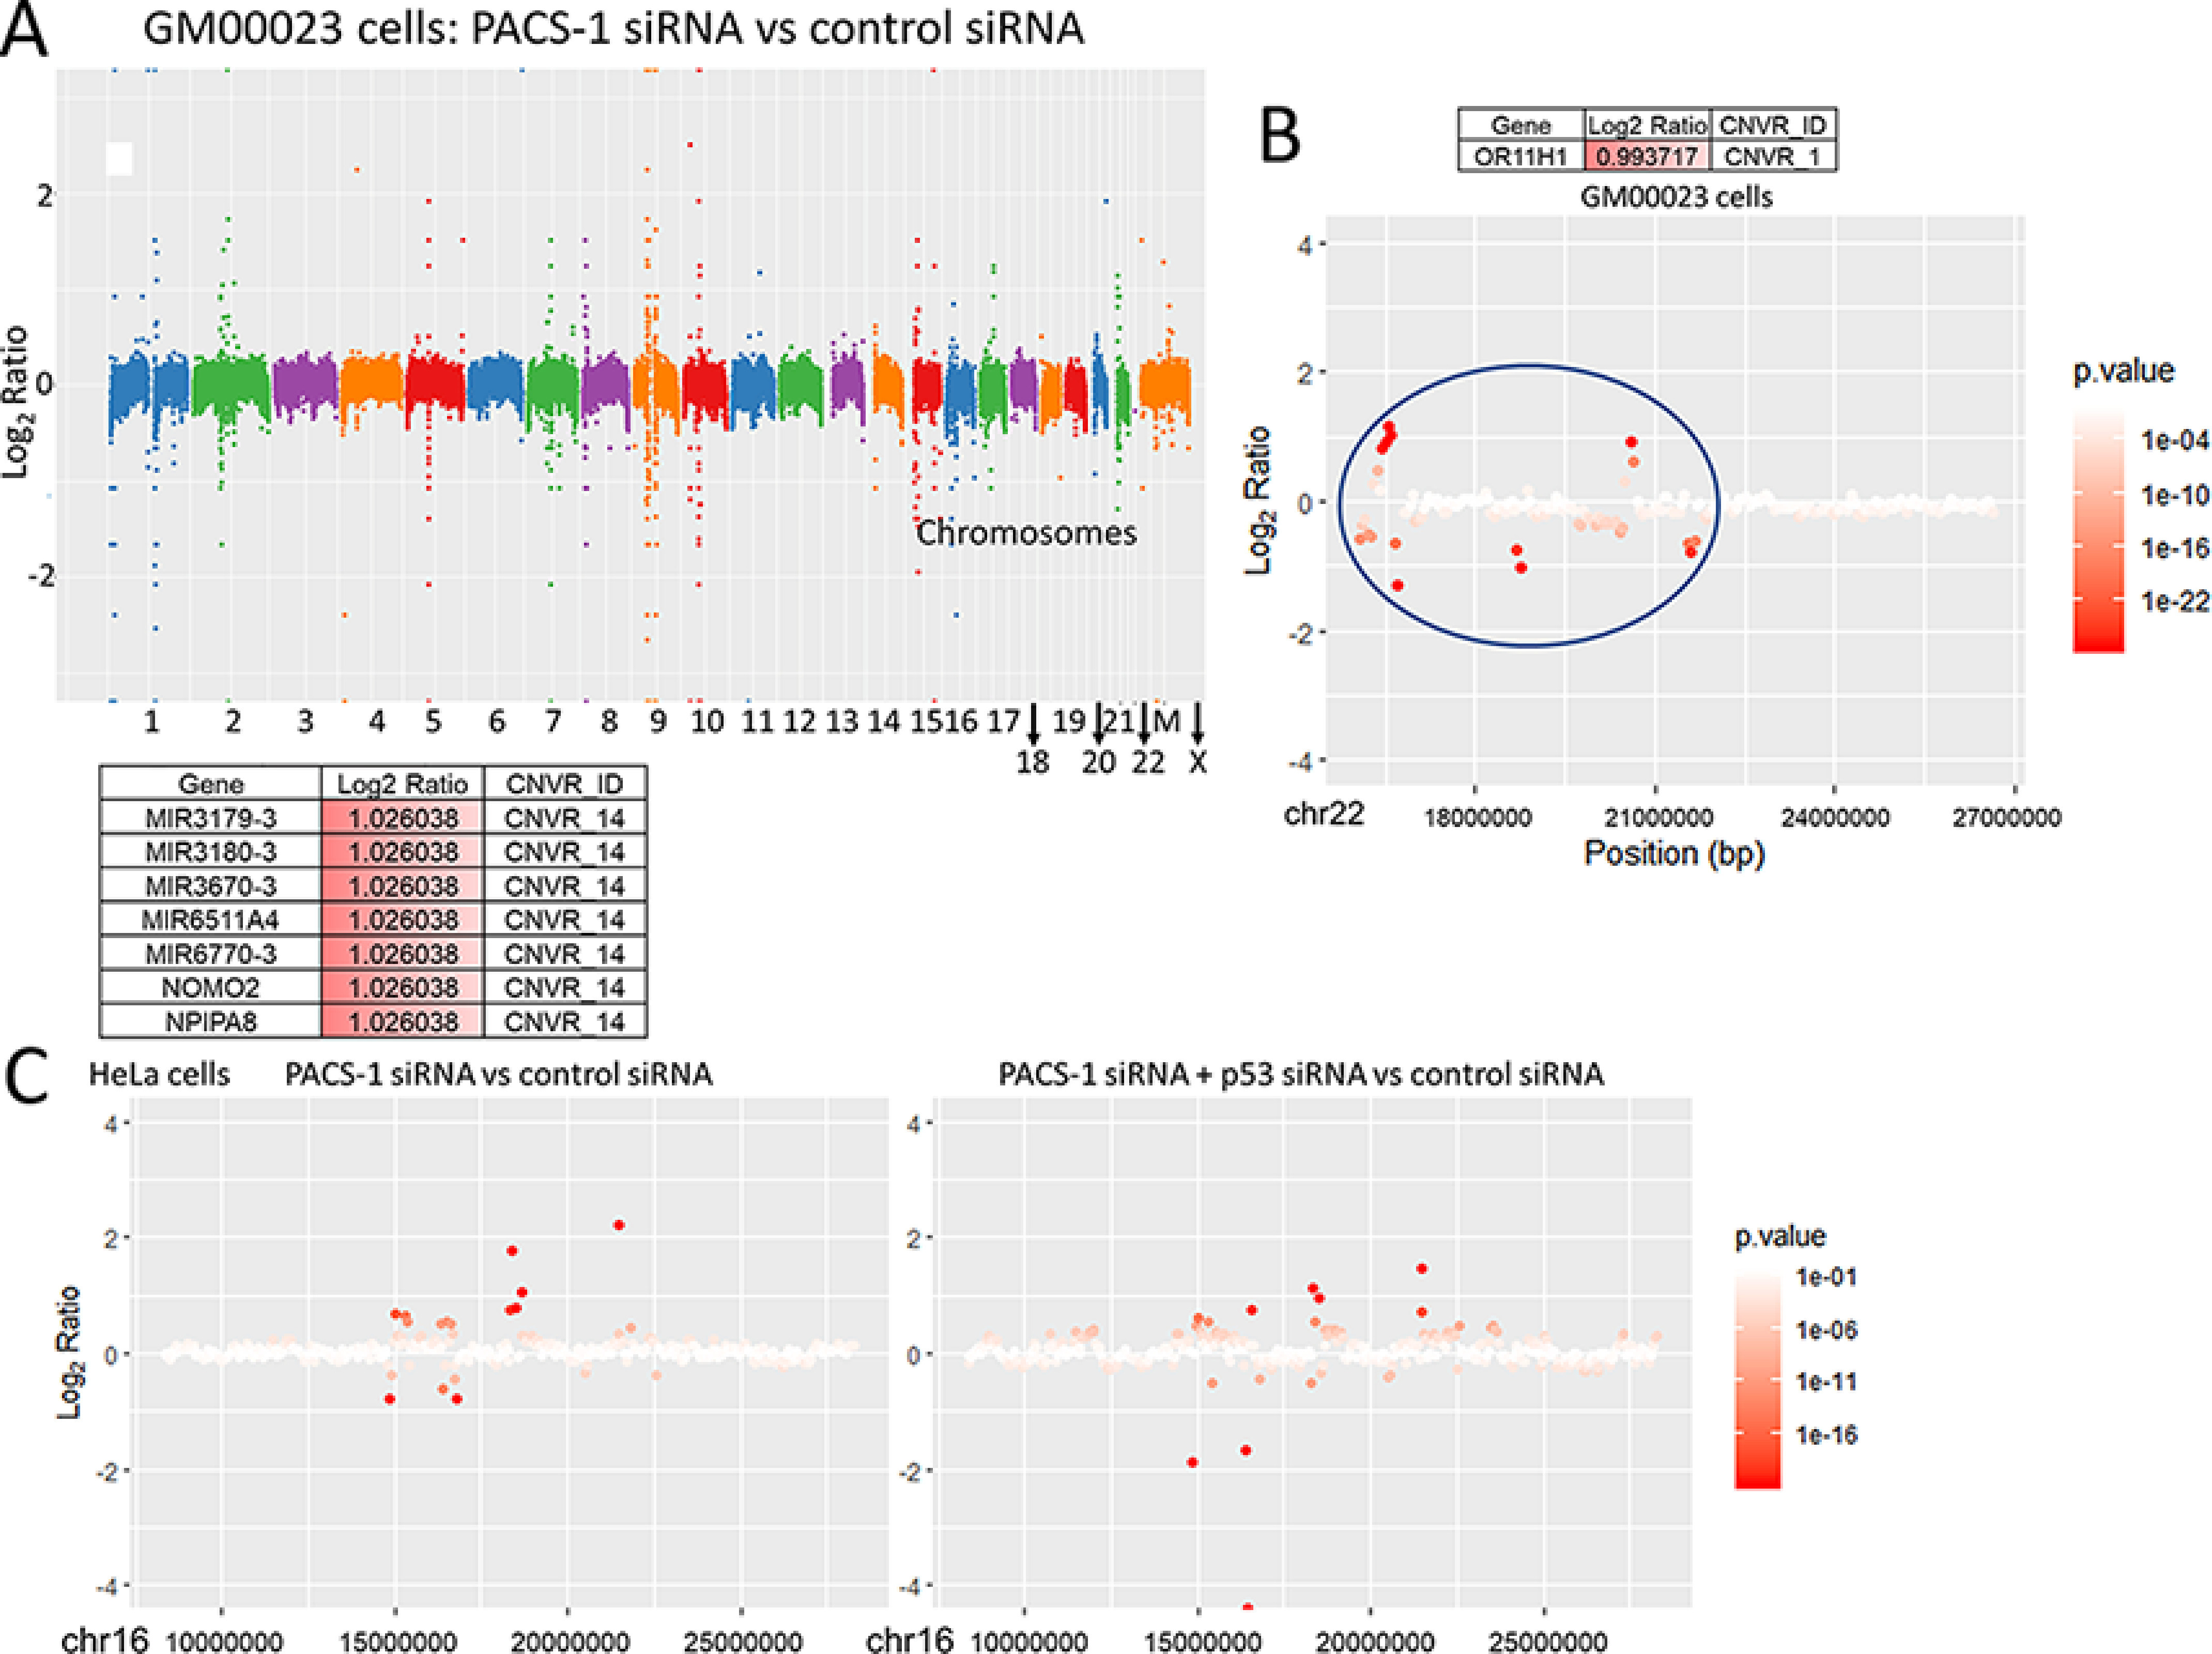
A, representative figure shows statistically significant CNVs of all the chromosomes of the GM00023 cells transfected with PACS-1 siRNA versus control siRNA. M refers to mitochondrial DNA. B, CNVR 1 of chromosome 22 is shown as a representative of GM00023 cell line CNVs observed in a single chromosome. C, representative figures are shown for statistically significant CNVs (CNVR 14) seen in chromosome 16 of HeLa cells transfected with PACS-1 siRNA versus control siRNA (left panel) and combined PACS-1 and p53 siRNAs versus control siRNA (right panel). Different intragenic regions are targeted by the loss of PACS-1 expression alone compared with the combined loss of PACS-1 and p53.
PACS-1 nuclear expression
To find out whether nuclear expression occurs in HeLa and SiHa cells for the S-phase cell cycle arrest, immunofluorescence analysis was performed. We observed statistically significant nuclear expression (p < 0.0001) at 8 h post 24-h serum starvation compared with 0, 16, and 24 h in both the HeLa and SiHa cell lines (Fig. 13, A–D). Our endogenous expression data concur with the exogenous PACS-1 nuclear expression seen by Atkins et al. (38), indicating that PACS-1 is transported to the nucleus. Protein expression studies of the cells collected at the same time periods showed nuclear expression correlating to the expression of G1-S phase cyclins, cyclin D1 and E (Fig. 13E). Cyclin A (S-G2 phase cyclin) is expressed at 8 h in HeLa cells, indicating a role for PACS-1 in the early S phase of the cell cycle. From our results, we hypothesize that hsa-miRNA-34a and hsa-miR-449a regulate PACS-1 expression during the cell cycle. Inactivation of the two miRNAs through HPV E6 and E7 proteins in cervical cancer leads to PACS-1 overexpression resulting in the loss of both the DDR and p53 mediated cell death (Fig. 13F).
Figure 13.
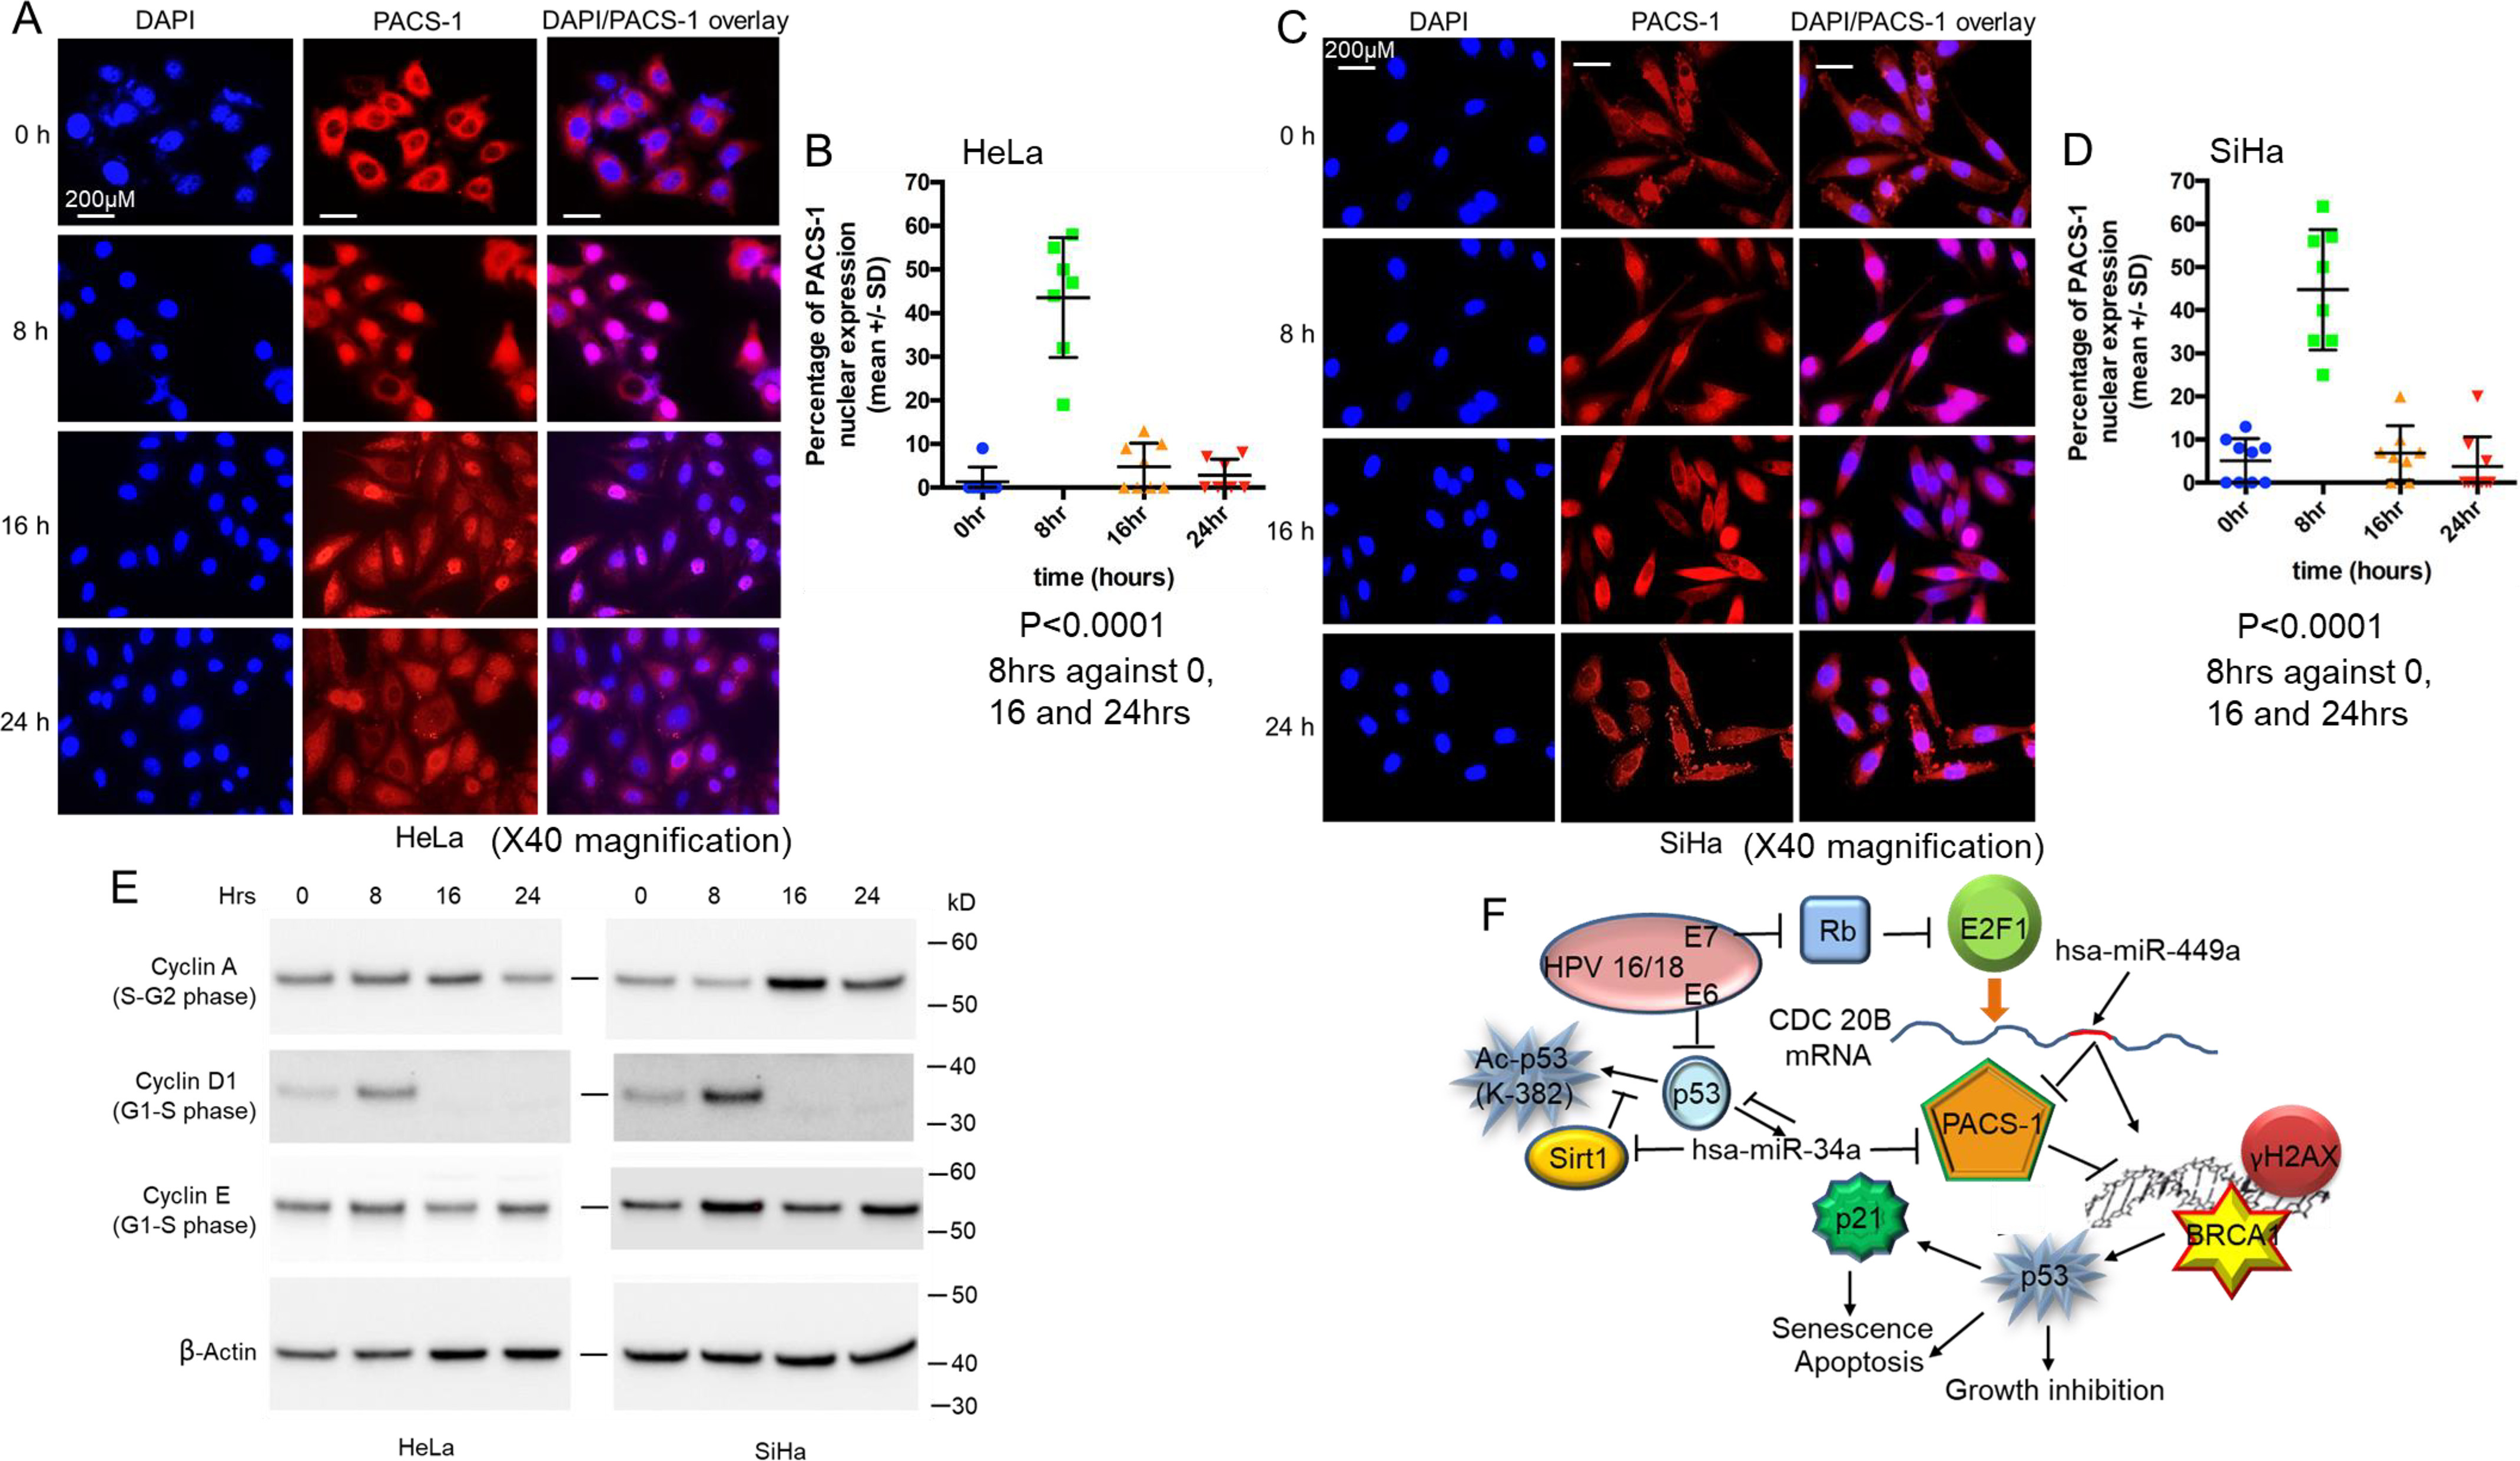
Nuclear PACS-1 expression. A and B, HeLa cell immunofluorescence shows statistically significant (p < 0.0001) nuclear PACS-1 expression at 8 h compared with 0, 16, and 24 h post serum starvation. C and D, SiHa cells also show statistically significant (p < 0.0001) nuclear PACS-1 expression at 8 h compared with 0, 16, and 24 h. E, cell cycle protein analysis shows 8-h PACS-1 nuclear expression correlates to the expression of G1-S phase cyclins, cyclin D1 and cyclin E. Expression of cyclin A (S-G2 phase cyclin) at 8 h is also observed in the HeLa cells, pointing to nuclear translocation possibly occurring at early S phase. F, mechanism is proposed where the cytoplasmic sorting protein PACS-1 has a role in the inhibition of stress-induced DDR in cervical cancer. Inhibition of Sirt1 by hsa-miR-34a or -449a results in p53 activation by Lys382 acetylation. In the absence of miRNA expression, PACS-1 overexpression results in the inhibition of DDR and the associated p53 activation.
Inverse relationship between PACS-1 expression and cervical cancer survival
Kaplan-Meier survival analysis of the Cancer Genome Atlas database did not show a statistical significance for the expression of PACS-1 or the homologous protein PACS-2 and cancer-free survival at earlier time periods (< 6 years) (Fig. S8, A–E). However, the data revealed PACS-1 overexpression (indicated as +) and reduced PACS-2 expression (indicated as −) tending toward poor survival at later years (>6 years) postdiagnosis, suggesting a prognostic role for PACS-1 in cervical cancer and an inverse relationship to PACS-2. It is likely that the loss of PACS-2 might be a requirement for the PACS-1–mediated poor survival in cancer survival, and thus there is a time delay. The data also show a direct correlation of survival to cyclin D1 expression and inverse correlation to E2F. This indicates that there is an inverse relationship between PACS-1 and hsa-miR-449a, whose expression is mediated by E2F (Fig. 13E).
Discussion
Nonrandom chromosomal changes involving 11q13 have been observed in cervical, breast, head, neck, and other human tumors (39, 40). These changes include chromosomal deletions and amplifications. Extensive studies have mapped amplification of cyclin D1 and distal 11q13 markers as a major event in human tumors (39). We have previously shown that proximal 11q13 breakages in cervical cancer cell lines exhibit deletions, including deletion of sequences of the cystatin E/M tumor suppressor gene (41–43). In these investigations, we have also identified homozygous deletion (HD) of a 5.5-kb sequence overlapping with the common fragile site FRA11H at chromosome 11q13 (14, 18). The HD has led us to the identification of the transport protein PACS-1 to be overexpressed in primary tumors, and we show that PACS-1 plays a nuclear role in genomic stability. Results from Fig. 1B suggest that 5.5-kb HD does not have a role in the overexpression of PACS-1.
Microarray analysis of miRNAs between normal and cervical cancer samples has identified both oncogenic and suppressor miRNAs (44, 45). Functional investigations have confirmed their role in enhanced cell growth or cell growth suppression. Although these are important investigations, direct targets of these miRNAs have not been identified in tumor development. Hsa-miR-34a has been shown by several investigators to be a p53-activated suppressor miRNA whose expression is lost in human tumors (23). Because p53 is inactivated by the E6 gene of HPV, it has been pointed out that hsa-miR-34a is also inactivated in cervical cancer (23–26).
Hsa-miR-449a was identified as a regulatory miRNA of CDK6 in the Rb-E2F pathway (27–30). It was shown that the increased activation of E2F1 resulting from the phosphorylation of Retinoblastoma gene (RB) protein leads to transcription of the CDC20B gene containing the hsa-miR-449a. This in turn results in the inhibition of CDK6 leading to dephosphorylated RB and RB-mediated inactivation of E2F1. However, the effect of hsa-miR-449a on CDK4, the major RB phosphorylating enzyme, has not been shown. Thus, the existing data provide only partial evidence for the involvement of hsa-miR-449a in the RB-E2F feedback loop. Additionally, it has been shown that hsa-miR-449a is involved in the regulation of various regulatory proteins, SIRT1, cyclin D1, HDAC1, and CDK6 of the Rb and p53 pathways (25–27). These investigations have also pointed out the role of hsa-miR-449a in genomic instability and cellular senescence through the activation of p53/p21 genes. Here we demonstrate that PACS-1 is the primary target of hsa-miRNA-34a and hsa-miR-449a for the DNA damage response and the cell cycle arrest associated with DDR and that the effects are inhibited by the overexpression of PACS-1. Although SIRT1 inactivation by hsa-miR-34a or -449a will result in the acetylation of p53, we cannot at present speculate whether p53 acetylation in PACS-1 siRNA–treated cells is a direct or indirect effect of PACS-1. We feel that p53 acetylation occurs as a downstream effect because of activation of DDR.
Previous studies have demonstrated that cell cycle arrest at the G1 phase with the exogenous expression of hsa-miR-34a and hsa-miR-449a correlated to the activation of p53 and p21 genes (23–25). Whereas we could observe an increase in G1, there was increase in S phase in hsa-miR-34a– or hsa-miR-449a–transfected cells. The results could suggest that hsa-miR-449a could function as a secondary-level tumor suppressor to hsa-miR-34a. Just as at least two oncogenes are required for cellular transformation; two suppressor miRNAs might be required to inhibit cellular transformation. It is also likely that there might be tissue-specific expression of these two miRNAs to regulate PACS-1 expression.
Genomic instability is also associated with both rare and common chromosomal fragile sites. Rare fragile sites include sites that are induced to break in 5% of the population and are related to CCG/CAG triplet repeats. The best examples are FRXA associated with the inactivation of FMR1 (fragile X associated mental retardation gene 1) and FRXE related to the inactivation of FMR2 gene (46, 47). Common fragile sites, on the other hand, occur in normal population, and FRA3B and FRA16D are the best examples of common fragile sites (46–48). The two genes FHIT (frequently hit) and WWOX/FOX (fragile 16D oxidoreductase) of FRA3B and FRA16D, respectively, represent a large genome of >1 megabase and a short transcript of <1.5 kb. These genes contain large introns that seem to play a role in the fragility of these sites. We believe that sequences encompassing the PACS-1 gene represent the common fragile site FRA11H mapped to proximal 11q13 locus for the following reasons: 1) a large genome of 175-kb coding for a short transcript of 4.5 kb, 2) a large 123-kb first intron, 3) large stretches of alu- and AT-rich sequences (normally associated with common fragile sites) within this intron, and 4) homozygous deletion of an alu-rich 5.5-kb sequence in cervical cancer cell lines and primary tumors. Thus, HPV oncogene-induced replication stress or chemo-radiation treatments could induce fragile site induction leading to chromosomal rearrangements that could be stabilized by PACS-1 overexpression.
Persistence of replication stress as in the case of HPV infection of keratinocytes leads to fork-stalling lesions such as double stranded breaks and activation of ATM and Rad3-related (ATR)- and ATM-mediated signaling cascades leading to S-G2 cell cycle arrest. Activation of H2AX by phosphorylation and recruitment of MRN (MRE11, RAD50, and Nbs1; Neijmahan syndrome protein and Fanconi anemia pathway proteins) and RAD51 proteins result in error-free homologous recombination preventing genomic instability (49). Activation of downstream p53 by acetylation leads to cell senescence and apoptosis. However, with the inhibition of this repair pathway in PACS-1 overexpressed cancer cells, there will be nonhomologous recombinations resulting in genomic instability represented by translocations and deletions. Fragile sites have also been suggested to be favorable sites of HPV genome integration (46, 47). Thus, inactivation of p53 and Rb proteins by oncogenic HPV E6 and E7 proteins, respectively, and overexpression of PACS-1 resulting in the loss of DDR lead to chemo-radiation–resistant genomic instability of HPV-induced cervical cancers.
An inverse relationship between PACS-1 expression and p53 acetylation suggested PACS-1's role in the regulation of p53 through DDR. Importantly, SIRT1 regulation of p53 is well-known in tumor response to chemotherapy (38, 50). It has been shown that PACS-2 inhibits SIRT1, leading to the increased acetylation of p53 for the activation of p21 and cell cycle arrest (38). However, we find that the deacetylation of p53 in PACS-1 siRNA–treated cells does not involve SIRT1 or SIRT2. It is likely that PACS-1 recruits an HDAC other than HDAC1 or another deacetylase for the inactivation of p53 and prevention of cell cycle arrest for entry into S phase.
The RNA-seq analysis has shown PACS-1 fragments/kb million values to be 1731 and 1836 for HeLa treated with control siRNA and p53 siRNA, respectively, indicating no effect of p53 loss on PACS-1 expression (data not shown). The TP53 values were 702 and 378 for the control and p53 siRNA–treated cells, respectively, indicating a 46% reduction in p53 RNA expression post p53 siRNA treatment. This is also reflected in >50% reduction in p53 expression post p53 siRNA treatment in the Western blotting shown in Fig. 11C. The Gene Ontology data of RNA expression presented in Fig. S6 show reduction in the p53 pathway with p53 siRNA and no effect on the DNA repair pathway which increases with the PACS-1 siRNA. Thus, we hypothesize that PACS-1 expression is regulated by hsa-miR-34a and not by the direct effect of p53.
There is increased p53 expression in hsa-miR-34a– or -449a–transfected cells compared with the control-miR transfected cells (Fig. 7E and Fig. 9C). Although cell growth inhibition is reversed with the cotransfection of LNA-hsa-anti-miR-34a or -449a with the respective miRNAs (Fig. 8B and Fig. 9A), decrease in p53 expression was not observed in LNA-hsa-anti-miR-34a cotransfected cells (Fig. 9C). This could be attributed to the interdependent relationship between p53 and hsa-miR-34a, where the loss of miR-34a with anti-miR-34a could result in the re-expression of p53 (36). As seen with LNA-hsa-anti-miR-449a, DDR and cell growth suppression were lost in association with increased PACS-1 expression in LNA-hsa-anti-miR-34a–treated cells. These results indicated that inactivation of PACS-1 plays a role in DDR and cell growth suppression in hsa-miRNA-34a– and hsa-miR-449a–treated cell lines.
In conclusion, we show that PACS-1 plays a role in genome stability during the S phase of the cell cycle. Its expression is regulated by miRNAs 34a and 449a, which serve as suppressor molecules in tumor development. Cancer genome studies have shown that there are numerous driver mutations due to tumor heterogeneity (51). miRNAs 34a and 449a control the cell cycle through regulation of several of these targets, and our results demonstrate that PACS-1 is a primary target of the two miRNAs. With the loss of these miRNAs, PACS-1 is overexpressed in HPV-induced replicative stress, leading to genomic rearrangements and tumor development.
Experimental procedures
Cell lines
Cervical cancer cell lines HeLa, SiHa, Caski, Me-180, HT3, and C33A and normal human fibroblast cell lines GM00023, GM00047, and GM05399 were grown in RPMI supplemented with 10% FBS, 100 μg/ml streptomycin sulfate, and 100 units/ml penicillin (42, 43). Primary human epidermal keratinocytes stably transduced with HPV 16 E6, E7, E6 and E7, or control retroviral vectors were obtained from Dr. Denise Galloway (University of Washington, Seattle, WA) and grown in keratinocyte-specific media with keratinocyte culture supplements.
Primary tumor samples
Protein extracts were prepared from primary cervical cancer and adjacent normal tissues obtained with the Institutional Review Board (IRB) approval from VAGLAHS Los Angeles and City of Hope Medical Center, Duarte, CA.
PCR and genome sequencing
DNA from cell lines was amplified using exon-specific primers for the 23 exons of PACS-1 gene. PCR products were cloned into TA vectors, and at least three clones were sequenced for each of the exons (18).
RT-PCR and Northern blotting
RNA was extracted using TRIzol following the manufacturer's instructions. miRNA was extracted using miRNA isolation kit (Ambion). Northern blotting for hsa-miR-449a was carried out following established protocol (17, 18). RT-PCR was carried out using 1 ng of RNA using the RT first strand synthesis kit (Invitrogen) followed by PCR using standard reaction conditions.
Cell cycle and annexin assay
Cell cycle studies of the control, PACS siRNA (Thermo Fisher Scientific), and hsa-miRNA (Exiqon A/S Life Sciences, Germany) transfected cells were carried out using the established protocol.
Western blotting
Proteins separated on SDS-PAGE gels were transferred to nitrocellulose membranes and hybridized to antibodies as described (42, 43, 52).
miRNA transfection and qRT-PCR
For microRNA overexpression, precursor miRNAs were obtained from Applied Biosystems (Thermo Fisher Scientific) (Table 1). The cells were transfected with precursor hsa-miR-34a (miR-34a, 30 nm), precursor hsa-miR-449a (miR-449a, 30 nm), or precursor hsa-miR-449a and LNA-hsa-anti-miR-449a (30 nm each) using siPORT NeoFX transfection reagent, whereas a scrambled miRNA precursor (hsa-miR-control) was used as a negative control. The cells were harvested for mRNA analysis 48 h posttransfection, and qRT-PCR was performed as described (30).
Edu (5-ethynyl-2′-deoxyuridine) labeling and FACS analysis
HeLa cells grown in RPMI medium in 100-mm tissue culture dishes to 70% confluency were transfected with control or PACS-1 siRNA (Thermo Fisher Scientific), and the EdU labeling and FACS analyses were performed following the manufacturer's protocol.
Immunofluorescence
The immunofluorescence studies were performed in siRNA-, miRNA-, or plasmid-transfected exponentially growing cells as described earlier (42, 52).
Statistical calculations
For the qRT-PCR, statistical analysis of differential expression was performed by one-way analysis of variance with multiple pairwise comparisons with Sidak correction. All the studies including miRNA and siRNA transfections, FACS, growth suppression, and EdU labeling studies were carried out in at least three independent experiments, and statistical significance was calculated using Student's t test. All the results are presented as means ± S.D., and a p-value of <0.05 was considered significant.
Data availability
All the data are contained within this article and in the supporting information.
Supplementary Material
Acknowledgments
We thank Alborz Zinabadi and Dr. Yasutada Akiba for technical help. We thank Dr. Bharat Panwar, La Jolla Institute for Allergy and Immunology for help with hsa-miR-34a and -449a expression in normal and tumor tissues.
Author contributions—M. S. V., S. R., S. K. B., N. V., P. K., R. B., R. C., J. L., T. S., M. G.-J., M. M., T. G., S. P. W., and E. S. S. data curation; M. S. V., S. R., S. K. B., N. V., P. K., R. B., R. C., J. L., T. S., M. G.-J., M. M., H. F., M. P., M. I. A., M. B. R., D. S. S., and E. S. S. formal analysis; M. S. V., S. K. B., N. V., P. K., R. B., R. C., T. S., M. G.-J., H. F., M. P., T. G., M. I. A., S. P. W., and E. S. S. validation; M. S. V., S. R., N. V., and E. S. S. investigation; M. S. V., S. R., S. K. B., P. K., R. B., R. C., J. L., T. S., M. G.-J., M. M., H. F., T. G., D. S. S., and E. S. S. methodology; M. S. V., S. K. B., and E. S. S. writing-original draft; M. S. V., N. V., P. K., R. B., M. P., M. I. A., M. B. R., and E. S. S. writing-review and editing; N. V. visualization; M. M. and E. S. S. conceptualization; M. P., M. I. A., M. B. R., and E. S. S. supervision; S. P. W. and D. S. S. resources; E. S. S. funding acquisition; E. S. S. project administration.
Funding and additional information—This work was supported by the VA Greater Los Angeles Healthcare System, by the West Los Angeles Surgical Education Research program, and by a VA Merit Grant to Eri S. Srivatsan. Support was also provided by NCI National Institutes of Health Grant 5U24CA195858-03, Oncology Models Forum project (to T. G.). Eri S. Srivatsan is a member of Jonsson Comprehensive Cancer Center and an associate member of the Molecular Biology Institute, UCLA, Los Angeles, California, USA. Flow cytometry was performed in the UCLA Jonsson Comprehensive Cancer Center and Center for AIDS Research Flow Cytometry Core Facility, which is supported by National Institutes of Health awards P30 CA016042 and 5P30 AI028697 and by the JCCC, the UCLA AIDS Institute, the David Geffen School of Medicine at UCLA, the UCLA Chancellor's Office, and the UCLA Vice Chancellor's Office of Research. The content is solely the responsibility of the authors and does not necessarily represent the official views of the National Institutes of Health.
Conflict of interest—The authors declare that they have no conflicts of interest with the contents of this article.
- HPV
- human papillomavirus
- DDR
- DNA damage response
- miRNA
- microRNA
- CNV
- copy number variation
- HD
- homozygous deletion.
References
- 1. Bray, F., Ferlay, F., Soerjomataram, I., Siegel, R. L., Torre, L. A., and Jemal, A. (2018) Global cancer statistics 2018: GLOBOCAN estimates of incidence and mortality worldwide for 36 cancers in 185 countries. CA Cancer J. Clin. 68, 394–424 10.3322/caac.21492 [DOI] [PubMed] [Google Scholar]
- 2. Ries, L. A. G., Young, J. L., Keel, G. E., Eisner, M. P., Lin, Y. D., and Horner, M.-J. (2007) SEER survival monograph: cancer survival among adults: U.S. SEER program, 1988–2001, patient and tumor characteristics. National Cancer Institute 6215, 7–22 [Google Scholar]
- 3. Denny, L., Herrero, R., Levin, C., and Kim, J. J. (2015) Cervical Cancer. in Cancer: Disease control priorities (Gelband H., Jha. P., Sankaranarayanan. R., Horton. S. eds.) 3rd Ed. (Volume3), The International Bank for Reconstruction and Development/The World Bank, Washington, D.C. 10.1596/978-1-4648-0349-9_ch4 [DOI] [PubMed] [Google Scholar]
- 4. Zur Hausen, H. (2009) Papillomaviruses in the causation of human cancers - a brief historical account. Virology 384, 260–265 10.1016/j.virol.2008.11.046 [DOI] [PubMed] [Google Scholar]
- 5. Slama, J., Sehnal, B., Dusek, L., Zima, T., and Cibula, D. (2015) Impact of risk factors on prevalence of anal HPV infection in women with simultaneous cervical lesion. Neoplasma 62, 308–314 10.4149/neo_2015_037 [DOI] [PubMed] [Google Scholar]
- 6. Lin, K., Lu, X., Chen, J., Zou, R., Zhang, L., and Xue, X. (2015) E6-associated transcription patterns in human papilloma virus 16-positive cervical tissues. Oncol. Lett. 9, 478–482 10.3892/ol.2014.2698 [DOI] [PMC free article] [PubMed] [Google Scholar]
- 7. Tian, Q., Li, Y., Wang, F., Li, Y., Xu, J., Shen, Y., Ye, F., Wang, X., Cheng, X., Chen, Y., Wan, X., Lu, W., and Xie, X. (2014) MicroRNA detection in cervical exfoliated cells as a triage for human papillomavirus-positive women. J. Natl. Cancer Inst. 106, dju241 10.1093/jnci/dju241 [DOI] [PMC free article] [PubMed] [Google Scholar]
- 8. Huang, K., Li, L. A., Meng, Y. G., and Fu, X. Y. (2014) p16 expression in patients with cervical cancer and its prognostic significance: meta-analysis of published literature. Eur. J. Obstet. Gynecol. Reprod. Biol. 183, 64–69 10.1016/j.ejogrb.2014.10.016 [DOI] [PubMed] [Google Scholar]
- 9. Wieringa, H. W., van der Zee, A. G., de Vries, E. G., and van Vugt, M. A. (2016) Breaking the DNA damage response to improve cervical cancer treatment. Cancer Treat. Rev. 42, 30–40 10.1016/j.ctrv.2015.11.008 [DOI] [PubMed] [Google Scholar]
- 10. Vedham, V., Divi, R. L., Starks, V. L., and Verma, M. (2014) Multiple infections and cancer: implications in epidemiology. Technol. Cancer Res. Treat. 13, 177–194 10.7785/tcrt.2012.500366 [DOI] [PubMed] [Google Scholar]
- 11. Ben-Bassat, H., Rosenbaum-Mitrani, S., Hartzstark, Z., Shlomai, Z., Kleinberger-Doron, N., Gazit, A., Plowman, G., Levitzki, R., Tsvieli, R., and Levitzki, A. (1997) Inhibitors of epidermal growth factor receptor kinase and of cyclin-dependent kinase 2 activation induce growth arrest, differentiation, and apoptosis of human papilloma virus 16-immortalized human keratinocytes. Cancer Res. 57, 3741–3750 [PubMed] [Google Scholar]
- 12. Wallace, N. A., and Galloway, D. A. (2014) Manipulation of cellular DNA damage repair machinery facilitates propagation of human papillomaviruses. Semin. Cancer Biol. 26, 30–42 10.1016/j.semcancer.2013.12.003 [DOI] [PMC free article] [PubMed] [Google Scholar]
- 13. Shamay, M., Agami, R., and Shaul, Y. (2001) HBV integrants of hepatocellular carcinoma cell lines contain an active enhancer. Oncogene 20, 6811–6819 10.1038/sj.onc.1204879 [DOI] [PubMed] [Google Scholar]
- 14. Debacker, K., Winnepenninckx, B., Longman, C., Colgan, J., Tolmie, J., Murray, R., van Luijk, R., Scheers, S., Fitzpatrick, D., and Kooy, F. (2007) The molecular basis of the folate-sensitive fragile site FRA11A at 11q13. Cytogenet. Genome Res. 119, 9–14 10.1159/000109612 [DOI] [PubMed] [Google Scholar]
- 15. Zainabadi, K., Jain, A. V., Donovan, F. X., Elashoff, D., Rao, N. P., Murty, V. V., Chandrasekharappa, S. C., and Srivatsan, E. S. (2014) One in four individuals of African-American ancestry harbors a 5.5 kb deletion at chromosome 11q13.1. Genomics 103, 276–287 10.1016/j.ygeno.2014.01.001 [DOI] [PMC free article] [PubMed] [Google Scholar]
- 16. Srivatsan, E. S., Chakrabarti, R., Zainabadi, K., Pack, S. D., Benyamini, P., Mendonca, M. S., Yang, P. K., Kang, K., Motamedi, D., Sawicki, M. P., Zhuang, Z., Jesudasan, R. A., Bengtsson, U., Sun, C., Roe, B. A., et al. (2002) Localization of deletion to a 300 Kb interval of chromosome 11q13 in cervical cancer. Oncogene 21, 5631–5642 10.1038/sj.onc.1205698 [DOI] [PubMed] [Google Scholar]
- 17. Mendonca, M. S., Farrington, D. L., Mayhugh, B. M., Qin, Y., Temples, T., Comerford, K., Chakrabarti, R., Zainabadi, K., Redpath, J. L., Stanbridge, E. J., and Srivatsan, E. S. (2004) Homozygous deletions within the 11q13 cervical cancer tumor-suppressor locus in radiation-induced, neoplastically transformed human hybrid cells. Genes Chromosomes Cancer 39, 277–287 10.1002/gcc.20007 [DOI] [PubMed] [Google Scholar]
- 18. Zainabadi, K., Benyamini, P., Chakrabarti, R., Veena, M. S., Chandrasekharappa, S. C., Gatti, R. A., and Srivatsan, E. S. (2005) A 700-kb physical and transcription map of the cervical cancer tumor suppressor gene locus on chromosome 11q13. Genomics 85, 704–714 10.1016/j.ygeno.2005.02.014 [DOI] [PubMed] [Google Scholar]
- 19. Wan, L., Molloy, S. S., Thomas, L., Liu, G., Xiang, Y., Rybak, S. L., and Thomas, G. (1998) PACS-1 defines a novel gene family of cytosolic sorting proteins required for trans-Golgi network localization. Cell 94, 205–216 10.1016/S0092-8674(00)81420-8 [DOI] [PubMed] [Google Scholar]
- 20. Xiang, Y., Molloy, S. S., Thomas, L., and Thomas, G. (2000) The PC6B cytoplasmic domain contains two acidic clusters that direct sorting to distinct trans-Golgi network/endosomal compartments. Mol. Biol. Cell 11, 1257–1273 10.1091/mbc.11.4.1257 [DOI] [PMC free article] [PubMed] [Google Scholar]
- 21. Youker, R. T., Shinde, U., Day, R., and Thomas, G. (2009) At the crossroads of homoeostasis and disease: roles of the PACS proteins in membrane traffic and apoptosis. Biochem. J. 421, 1–15 10.1042/BJ20081016 [DOI] [PMC free article] [PubMed] [Google Scholar]
- 22. Piguet, V., Wan, L., Borel, C., Mangasarian, A., Demaurex, N., Thomas, G., and Trono, D. (2000) HIV-1 Nef protein binds to the cellular protein PACS-1 to downregulate class I major histocompatibility complexes. Nat. Cell Biol. 2, 163–167 10.1038/35004038 [DOI] [PMC free article] [PubMed] [Google Scholar]
- 23. Ma, L., and Weinberg, R. A. (2008) Micromanagers of malignancy: role of microRNAs in regulating metastasis. Trends Genet. 24, 448–456 10.1016/j.tig.2008.06.004 [DOI] [PubMed] [Google Scholar]
- 24. Sotiropoulou, G., Pampalakis, G., Lianidou, E., and Mourelatos, Z. (2009) Emerging roles of microRNAs as molecular switches in the integrated circuit of the cancer cell. RNA 15, 1443–1461 10.1261/rna.1534709 [DOI] [PMC free article] [PubMed] [Google Scholar]
- 25. Wang, X., Wang, H. K., McCoy, J. P., Banerjee, N. S., Rader, J. S., Broker, T. R., Meyers, C., Chow, L. T., and Zheng, Z. M. (2009) Oncogenic HPV infection interrupts the expression of tumor-suppressive miR-34a through viral oncoprotein E6. RNA 15, 637–647 10.1261/rna.1442309 [DOI] [PMC free article] [PubMed] [Google Scholar]
- 26. Wang, X., Meyers, C., Guo, M., and Zheng, Z. M. (2011) Upregulation of p18Ink4c expression by oncogenic HPV E6 via p53-miR-34a pathway. Int. J. Cancer 129, 1362–1372 10.1002/ijc.25800 [DOI] [PMC free article] [PubMed] [Google Scholar]
- 27. Yang, X., Feng, M., Jiang, X., Wu, Z., Li, Z., Aau, M., and Yu, Q. (2009) miR-449a and miR-449b are direct transcriptional targets of E2F1 and negatively regulate pRb-E2F1 activity through a feedback loop by targeting CDK6 and CDC25A. Genes Dev. 23, 2388–2393 10.1101/gad.1819009 [DOI] [PMC free article] [PubMed] [Google Scholar]
- 28. Noonan, E. J., Place, R. F., Basak, S., Pookot, D., and Li, L. C. (2010) miR-449a causes Rb-dependent cell cycle arrest and senescence in prostate cancer cells. Oncotarget 1, 349–358 10.18632/oncotarget.167 [DOI] [PMC free article] [PubMed] [Google Scholar]
- 29. Lizé, M., Pilarski, S., and Dobbelstein, M. (2010) E2F1-inducible microRNA 449a/b suppresses cell proliferation and promotes apoptosis. Cell Death Differ. 17, 452–458 10.1038/cdd.2009.188 [DOI] [PubMed] [Google Scholar]
- 30. Kumar, P., Sharad, S., Petrovics, G., Mohamed, A., Dobi, A., Sreenath, T. L., Srivastava, S., and Biswas, R. (2016) Loss of miR-449a in ERG-associated prostate cancer promotes the invasive phenotype by inducing SIRT1. Oncotarget 7, 22791–22806 10.18632/oncotarget.8061 [DOI] [PMC free article] [PubMed] [Google Scholar]
- 31. Ghandadi, M., and Sahebkar, A. (2016) MicroRNA-34a and its target genes: Key factors in cancer multidrug resistance. Curr. Pharm. Des. 22, 933–939 10.2174/1381612822666151209153729 [DOI] [PubMed] [Google Scholar]
- 32. Mani, C., Tripathi, K., Luan, S., Clark, D. W., Andrews, J. F., Vindigni, A., Thomas, G., and Palle, K. (2020) The multifunctional protein PACS-1 is required for HDAC2- and HDAC3-dependent chromatin maturation and genomic stability. Oncogene 39, 2583–2596 10.1038/s41388-020-1167-x [DOI] [PMC free article] [PubMed] [Google Scholar]
- 33. Chung, I. F., Chang, S. J., Chen, C. Y., Liu, S. H., Li, C. Y., Chan, C. H., Shih, C. C., and Cheng, W. C. (2017) YM500v3: a database for small RNA sequencing in human cancer research. Nucleic Acids Res. 45, D925–D931 10.1093/nar/gkw1084 [DOI] [PMC free article] [PubMed] [Google Scholar]
- 34. Ribeiro, J., and Sousa, H. (2014) MicroRNAs as biomarkers of cervical cancer development: a literature review on miR-125b and miR-34a. Mol. Biol. Rep. 41, 1525–1531 10.1007/s11033-013-2998-0 [DOI] [PubMed] [Google Scholar]
- 35. Yong, L., Kleiboeker, S., Deng, X., and Qiu, J. (2013) Human parvovirus B19 infection causes cell cycle arrest of human erythroid progenitors at late S phase that favors viral DNA replication. J. Virol. 87, 12766–12775 10.1128/JVI.02333-13 [DOI] [PMC free article] [PubMed] [Google Scholar]
- 36. Slabáková, E., Culig, Z., Remšík, J., and Souček, K. (2017) Alternative mechanisms of miR-34a regulation in cancer. Cell Death Dis. 8, e3100 10.1038/cddis.2017.495 [DOI] [PMC free article] [PubMed] [Google Scholar]
- 37. Klusmann, I., Rodewald, S., Müller, L., Friedrich, M., Wienken, M., Li, Y., Schulz-Heddergott, R., and Dobbelstein, M. (2016) p53 activity results in DNA replication fork processivity. Cell Rep. 17, 1845–1857 10.1016/j.celrep.2016.10.036 [DOI] [PubMed] [Google Scholar]
- 38. Atkins, K. M., Thomas, L. L., Barroso-González, J., Thomas, L., Auclair, S., Yin, J., Kang, H., Chung, J. H., Dikeakos, J. D., and Thomas, G. (2014) The multifunctional sorting protein PACS-2 regulates SIRT1-mediated deacetylation of p53 to modulate p21-dependent cell-cycle arrest. Cell Rep. 8, 1545–1557 10.1016/j.celrep.2014.07.049 [DOI] [PMC free article] [PubMed] [Google Scholar]
- 39. Günther, K., Merkelbach-Bruse, S., Amo-Takyi, B. K., Handt, S., Schröder, W., and Tietze, L. (2001) Differences in genetic alterations between primary lobular and ductal breast cancers detected by comparative genomic hybridization. J. Pathol. 193, 40–47 [DOI] [PubMed] [Google Scholar]
- 40. Harris, C. P., Lu, X. Y., Narayan, G., Singh, B., Murty, V. V., and Rao, P. H. (2003) Comprehensive molecular cytogenetic characterization of cervical cancer cell lines. Genes Chromosomes Cancer 36, 233–241 10.1002/gcc.10158 [DOI] [PubMed] [Google Scholar]
- 41. Bane, A. L., Mulligan, A. M., Pinnaduwage, D., O'Malley, F. P., and Andrulis, I. L. (2011) EMSY and CCND1 amplification in familial breast cancer: from the Ontario site of the Breast Cancer Family Registry. Breast Cancer Res. Treat. 127, 831–839 10.1007/s10549-011-1380-y [DOI] [PubMed] [Google Scholar]
- 42. Veena, M. S., Lee, G., Keppler, D., Mendonca, M. S., Redpath, J. L., Stanbridge, E. J., Wilczynski, S. P., and Srivatsan, E. S. (2008) Inactivation of the cystatin E/M tumor suppressor gene in cervical cancer. Genes Chromosomes Cancer 47, 740–754 10.1002/gcc.20576 [DOI] [PMC free article] [PubMed] [Google Scholar]
- 43. Soh, H., Venkatesan, N., Veena, M. S., Ravichandran, S., Zinabadi, A., Basak, S. K., Parvatiyar, K., Srivastava, M., Liang, L.-J., Gjertson, D. W., Torres, J. Z., Moatamed, N. A., and Srivatsan, E. S. (2016) Cystatin E/M suppresses tumor cell growth through cytoplasmic retention of NF-κB. Mol. Cell Biol. 36, 1776–1792 10.1128/MCB.00878-15 [DOI] [PMC free article] [PubMed] [Google Scholar]
- 44. Yablonska, S., Hoskins, E. E., Wells, S. I., and Khan, S. A. (2013) Identification of miRNAs dysregulated in human foreskin keratinocytes (HFKs) expressing the human papillomavirus (HPV) type 16 E6 and E7 oncoproteins. Microrna 2, 2–13 10.2174/2211536611302010002 [DOI] [PubMed] [Google Scholar]
- 45. Villegas-Ruiz, V., Juárez-Méndez, S., Pérez-González, O. A., Arreola, H., Paniagua-García, L., Parra-Melquiadez, M., Peralta-Rodríguez, R., López-Romero, R., Monroy-García, A., Mantilla-Morales, A., Gómez-Gutiérrez, G., Román-Bassaure, E., and Salcedo, M. (2014) Heterogeneity of microRNAs expression in cervical cancer cells: over-expression of miR-196a. Int. J. Clin. Exp. Pathol. 7, 1389–1401 [PMC free article] [PubMed] [Google Scholar]
- 46. Durkin, S. G., and Glover, T. W. (2007) Chromosome fragile sites. Annu. Rev. Genet. 41, 169–192 10.1146/annurev.genet.41.042007.165900 [DOI] [PubMed] [Google Scholar]
- 47. Debacker, K., and Kooy, R. F. (2007) Fragile sites and human disease. Hum. Mol. Genet. 16, R150–158 10.1093/hmg/ddm136 [DOI] [PubMed] [Google Scholar]
- 48. Thys, R. G., Lehman, C. E., Pierce, L. C., and Wang, Y. H. (2015) DNA secondary structure at chromosomal fragile sites in human disease. Curr. Genomics 16, 60–70 10.2174/1389202916666150114223205 [DOI] [PMC free article] [PubMed] [Google Scholar]
- 49. Ciccia, A., and Elledge, S. J. (2010) The DNA damage response: making it safe to play with knives. Mol. Cell 40, 179–204 10.1016/j.molcel.2010.09.019 [DOI] [PMC free article] [PubMed] [Google Scholar]
- 50. Vaziri, H., Dessain, S. K., Ng Eaton, E., Imai, S. I., Frye, R. A., Pandita, T. K., Guarente, L., and Weinberg, R. A. (2001) hSIR2(SIRT1) functions as an NAD-dependent p53 deacetylase. Cell 107, 149–159 10.1016/S0092-8674(01)00527-X [DOI] [PubMed] [Google Scholar]
- 51. Vogelstein, B., Papadopoulos, N., Velculescu, V. E., Zhou, S., Diaz, L. A., Jr, and Kinzler, K. W. (2013) Cancer genome landscapes. Science 339, 1546–1558 10.1126/science.1235122 [DOI] [PMC free article] [PubMed] [Google Scholar]
- 52. Veena, M. S., Wilken, R., Zheng, J. Y., Gholkar, A., Venkatesan, N., Vira, D., Ahmed, S., Basak, S. K., Dalgard, C. L., Ravichandran, S., Batra, R. K., Kasahara, N., Elashoff, D., Fishbein, M. C., Whitelegge, J. P., et al. (2014) p16 protein and gigaxonin are associated with the ubiquitination of NFκB in cisplatin-induced senescence of cancer cells. J. Biol. Chem. 289, 34921–34937 10.1074/jbc.M114.568543 [DOI] [PMC free article] [PubMed] [Google Scholar]
Associated Data
This section collects any data citations, data availability statements, or supplementary materials included in this article.
Supplementary Materials
Data Availability Statement
All the data are contained within this article and in the supporting information.