

Abstract
Thermodynamic partitioning dictates solute loading and release from a hydrogel. Design of drug delivery vehicles, cell and tissue matrices, and immunoassay scaffolds that utilize hydrogel materials is informed by an understanding of the thermodynamic partitioning properties of those hydrogels. We develop aberration-compensated laser scanning confocal microscopy (AC-LSCM), a technique that can be applied to all fluorescence microscopy-based equilibrium partition coefficient measurements where the fluorescence is uniformly distributed in the reference material (e.g., many solutes in thermodynamic equilibrium). In this paper, we use AC-LSCM to measure spatially resolved in situ equilibrium partition coefficients of various fluorescently labeled solutes in single-layer and multilayer open hydrogels. In considering a dynamic material, we scrutinize solute interactions with a UV photoactive polyacrylamide gel that incorporates a benzophenone methacrylamide backbone. We observed strong agreement with an adjusted version of Ogston’s ideal size-exclusion model for spatially resolved in situ equilibrium partition coefficients across a wide range of polyacrylamide hydrogel densities (R2 = 0.98). Partition coefficients of solutes differing in hydrodynamic radius were consistent with size-based theory in the photoactive hydrogels, but exceed those in unmodified polyacrylamide gels. This observation suggests a deviation from the size-exclusion model and a shift in the thermodynamic equilibrium state of the solutes toward the gel phase. AC-LSCM also resolves differential partitioning behavior of the model solute in two-layer gels, providing insight into the transport phenomena governing the partitioning in multilaminate gel structures. Furthermore, AC-LSCM identifies and quantifies depth-dependent axial aberrations that could confound quantitation, highlighting the need for the “aberration compensated” aspect of AC-LSCM.
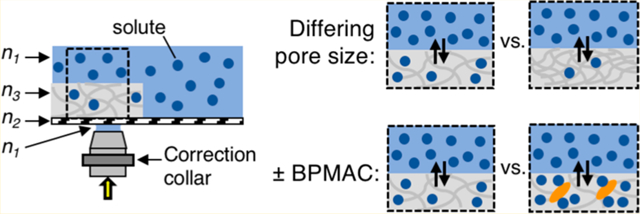
Graphical Abstract
Hydrogels find broad biomedical utility as drug delivery vehicles, cell encapsulation platforms, and immunoassay scaffolds for diagnostics, among other applications.1–4 Microscale hydrogels are tens of micrometers thick with modifiable properties to optimize function for a specific application. Changing hydrophilicity, pore size, and/or electrostatic characteristics of a microscale hydrogel will modulate the thermodynamic properties of the gel–solute system. One thermodynamic property critical to gel design is partitioning, which governs solute load and release from a hydrogel. Partitioning is characterized by an equilibrium partition coefficient, K, defined as the ratio of the solute concentration inside the gel to the solute concentration in the surrounding free solution when the system is at equilibrium:5
| (1) |
where [solute]gel and [solute]solution are the concentrations of solute in-gel and in solution, respectively. K depends on all interactions that occur between gel and solute:5
| (2) |
In eq 2, Ksize, Khphob, Kbiosp, Kelec, and Kconf refer to contributing partition coefficients due specifically to the size of the solute and gel pores, hydrophobic interactions, biospecific affinity (e.g., between a ligand and its target), electrostatic interactions, and conformational changes (e.g., folded vs unfolded proteins), respectively. Other interactions (e.g., hydrogen bonding and van der Waals forces) are grouped into the Kother term.5,6 All of these interactions can govern gel performance.7 For example, environmentally responsive hydrogels for drug delivery have been designed to swell in specific physiological conditions to increase the effective pore size of the hydrogel, stimulating release of the cargo drug.8 The pore size of hydrogels for cell transplantation can be optimized to protect encapsulated cells from the host immune system while allowing permeation of key nutrients and release of therapeutics.9,10 The gel network and any added functional groups influence the performance of hydrogels as immunoassay scaffolds, as the sensitivity of the assay is directly related to partitioning of immunoreagents into the hydrogel network to complex with the target.4,11–13 Therefore, understanding thermodynamic partitioning—including dependencies on interactions between gel and solute—informs design of microscale hydrogels.
The most prevalent technique to measure K values of solutes in hydrogels uses indirect mass balance/back-extraction methods.14–19 However, these methods are unable to provide information on the spatial distribution of the solute within the hydrogel, which can yield critical insight into local material properties of the hydrogel. Properties of interest include pore density distribution in unilaminar and multilaminar structures, balances between surface adsorption vs absorption, charge distribution, and uniformity of functionalization.20,21 Fluorescence microscopy can also be used to determine K, with the caveats that a solute must be amenable to fluorescence labeling and that the fluorescence intensity of the label is linearly proportional to solute concentration. In general, fluorescence intensity is linearly proportional to concentration when the absorbance of the solution is <5%.22,23 Absorbance is dependent on the solute concentration, the imaging depth, and the extinction coefficient of the fluorophore.24 Given these caveats, we can write
| (3) |
where Ig is the in-gel fluorescence intensity and Is,c is the in-solution fluorescence intensity above the coverslip (Figure 1).
Figure 1.
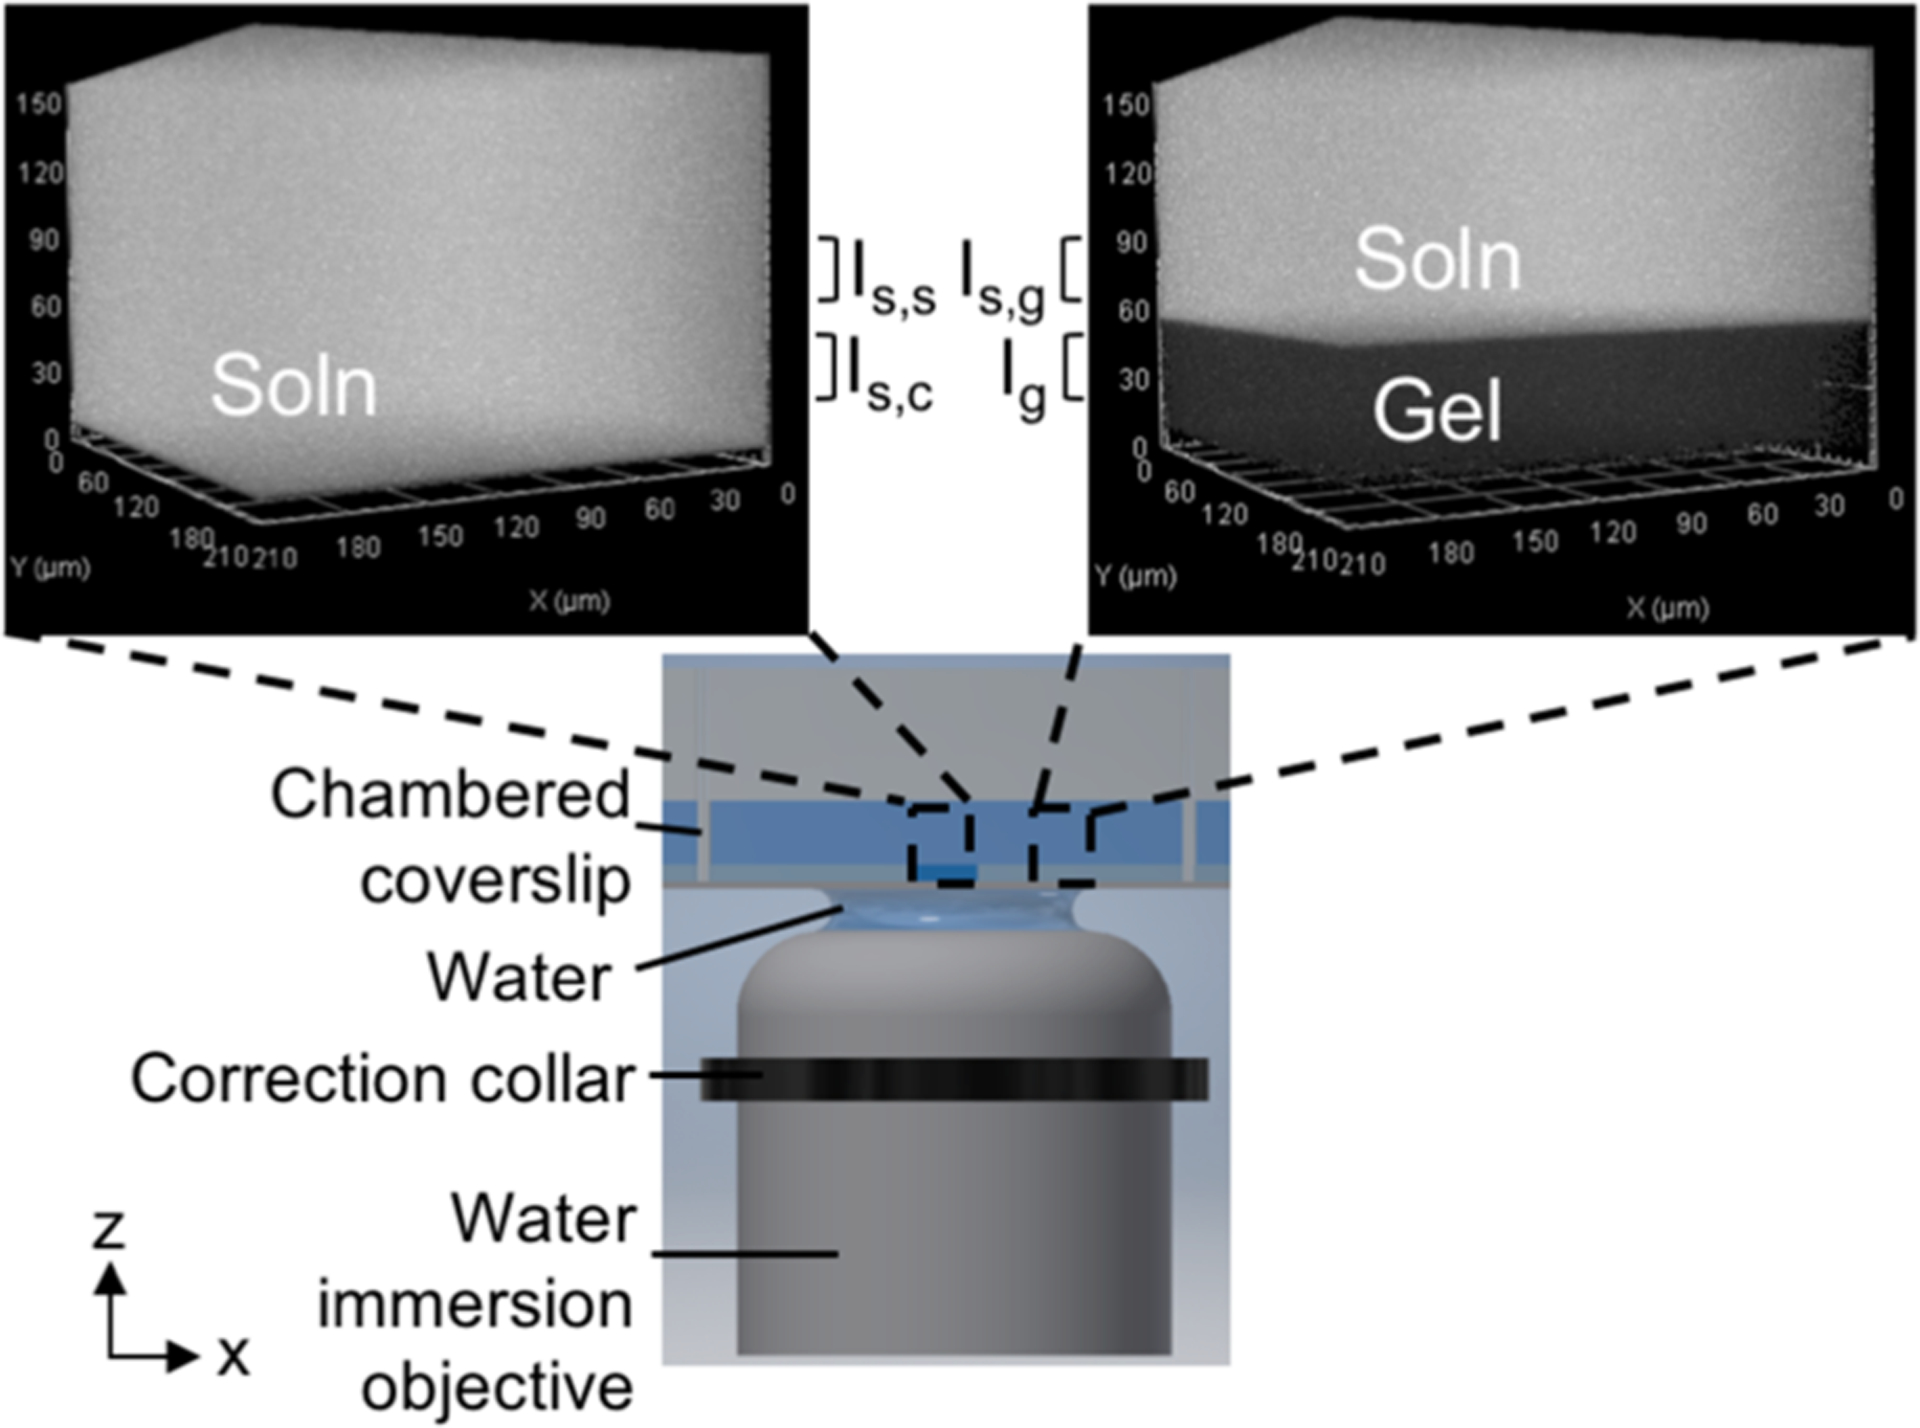
AC-LSCM uses chambered coverslips interfacing with a correction collar-fitted water immersion objective to compensate for aberrations induced by the coverslip. Each chamber holds a polyacrylamide gel polymerized with a well in the center. Fluorescence micrographs of both the gel and the fluid-filled well are acquired. Surrounding free solution serves as a reference for measuring both gel-independent optical artifacts and gel-dependent artifacts.
For direct calculation of K, wide-field fluorescence microscopy ideally measures the lateral (within the x–y plane) solute distribution within hydrogels.25,26 However, wide-field microscopy inherently detects fluorescence throughout the axial (z-depth) field of view. Consequently, in situ measurements of K on hydrogels submerged in a liquid bath (open hydrogel systems) will be skewed by both the image plane depth and surrounding fluorescence (i.e., fluid layer on top of hydrogel structure).26 The measurements will be a convolution of fluorescence at the image plane and any background fluorescence. Also importantly, when a sample has differences in K axially20,21,27 and/or radially,28–30 such differences are not directly measurable using wide-field fluorescence microscopy. In cases where only the lateral solute distribution is of interest and there is no fluorescent solution layer above or below the gel, wide-field fluorescence microscopy is suitable for measuring K. Nevertheless, for open microscale hydrogel systems where the volumetric solute distribution is of interest, wide-field microscopy is not effective.
Optical sectioning techniques (e.g., laser-scanning confocal, multiphoton microscopy) meet the specifications for our system and have been used to measure K.31–34 However, optical aberrations still introduce both lateral and axial measurement artifacts; therefore, any optical artifacts need to be minimized and remaining artifacts quantified and controlled for to permit accurate quantitation.35,36
We therefore developed an aberration-compensated laser scanning confocal microscopy (AC-LSCM) technique that interfaces with gels fabricated on chambered coverslips to measure spatially resolved in situ K in open hydrogel systems. With this technique, we address two key criteria: the (i) minimization and (ii) quantification of optical artifacts that could confound quantitation in any fluorescence microscopy-based K measurement. We then measure in situ K of a model protein in microscale polyacrylamide (PA) gels spanning a range of pore sizes and validate the K values with both theoretical and experimentally determined values reported by others. We further study how a chemical modification to the PA hydrogel backbone impacts solute partitioning and the implications for immunoassays performed in-gel. Finally, we use AC-LSCM to characterize spatially resolved in situ K in thicker (>100 μm), two layered PA gels. In summary, we present an accessible analytical technique that can be used to directly quantify and validate the spatially resolved in situ partitioning of solutes in hydrogels, directing the custom engineering of hydrogels for a wide range of applications. Furthermore, with a multi-immersion objective, AC-LSCM is more broadly applicable to determining K and the corresponding accuracy of the K measurement of any sample with reference solution refractive index between the limits of the objective (commonly 1.33–1.52).
EXPERIMENTAL SECTION
Chemicals/Reagents.
40%T, 3.3%C acrylamide/bis-acrylamide (29:1) (A7802), N,N,N′,N′-tetramethylethylenediamine (T9281), ammonium persulfate (A3678), bovine serum albumin (BSA, A7030), and soybean trypsin inhibitor (TI, T6522) were purchased from Sigma-Aldrich. 1.5 M Tris-HCl, pH 8.8, was purchased from Teknova (T1588). Tris-buffered saline with Tween (TBST) (10×) was procured from Cell Signaling Technology (9997S). Alexa Fluor 647-labeled donkey anti-rabbit IgG antibody (A31573) was obtained from Life Technologies. Alexa Fluor 647-conjugated donkey anti-goat IgG Fab fragment (705-607-003) was purchased from Jackson ImmunoResearch. Deionized water (18.2 MΩ) was acquired using an Ultrapure water system from Millipore. N-[3-[(3-Benzoylphenyl)formamido]propyl] methacrylamide (BPMAC) was custom synthesized by PharmAgra Laboratories and resuspended in dimethyl sulfoxide (DMSO).
Micrograph Acquisition.
All micrographs were acquired on a Carl Zeiss LSM 710 AxioObserver inverted laser scanning confocal microscope using a C-Apochromat 40×/1.1 NA water-immersion objective with correction collar. The 633 nm line of a helium–neon laser was used to excite Alexa Fluor 647 and to perform reflected light confocal microscopy of the coverslip–sample interface to find the optimal correction collar setting. Fluorescence was imaged using a 488/561/633 nm dichroic filter and a pinhole set to 1.0 Airy units. Three-dimensional image stacks of fluorescence were captured over a 212.55 μm × 212.55 μm field of view with 0.71 μm × 0.71 μm × 0.70 μm cubic voxels. The samples were imaged from the coverslip–sample interface to at least 120 μm into the sample. Reflected light confocal microscopy was used to identify the starting z-position of the coverslip surface to image baseline autofluorescence of gels in solute-free buffer. Reflected light confocal images were acquired using a T80/R20 partial mirror over a 212.55 μm × 212.55 μm field of view with 0.71 μm × 0.71 μm × 0.10 μm cubic voxels.
Correction Collar Positioning.
The optimal position of the correction collar was found by measuring the average intensity of the field of view at the z-position yielding the highest average intensity (i.e., the glass–sample interface). Peak intensity values were recorded at each collar position. The collar was adjusted until a maximum peak intensity was observed. 3D image stacks were then acquired at different correction collar positions to illustrate changing reflection intensity z-profiles at the coverslip–sample interface (Figure S1).
PA Gel Fabrication.
PA hydrogels of varying density (%T w/v acrylamide) and 3.3% bis-acrylamide cross-linker were fabricated inside silanized37 chambered coverslips (ibidi, 80427). Samples used for the same experiment were fabricated on chambered coverslips from the same lot to minimize coverslip thickness variation. The gel precursor solution was prepared as described previously.37 For unmodified PA gels, BPMAC in the precursor was replaced with water. For vehicle control gels, BPMAC was replaced with DMSO. After deposition of precursor into the chamber, a ~9 mm × 19 mm photopatterned glass-weighted silicon mold with a 30–40-μm-tall square feature was placed upside down on top of the precursor. Polymerization proceeded for 20 min before the mold was released, leaving in each chamber a microscale PA hydrogel with a well in the center (Figure 1). Gels were then rinsed with deionized water and stored in 1× TBST overnight at 4 °C. BPMAC-containing gels were exposed to UV light using a collimated mercury lamp (~20 mW/cm2 at 365 nm, Optical Associates, Inc.) in 1× TBST for 5 min and washed for 1 h prior to introduction of fluorescently labeled solute in solution. Multilayer PA gels were fabricated using featureless wafer pieces and Kapton tape applied directly to the chamber bottom to form the well in the gel due to difficulty in aligning wafer features for layer-by-layer fabrication. The bottom layer gel was first polymerized around a 40-μm-tall Kapton tape (Caplinq, PIT0.5S/6.4) feature. The bottom layer gel was then dried to facilitate addition of a layer of 70 μm Kapton tape (Ted Pella, 16090–6) on top of the 40 μm tape layer. The bottom gel was then rehydrated before deposition of the second gel precursor and subsequent polymerization. Both layers of Kapton tape were removed after gel fabrication.
Partition Coefficient Measurements.
Soybean trypsin inhibitor was covalently labeled with Alexa Flour 647 (TI*) using a protein labeling kit (Invitrogen, A20173) (degree of labeling between 0.7 and 0.8). For separation of labeled protein from free dye, P6 fine resin (BioRad, 150–4134) was used. Single-layer PA gels were incubated in 1.5 μM TI* or 0.67 μM of Alexa Fluor 647-labeled immunoprobe in 2% BSA in 1× TBST solution for >60 min in the dark at room temperature before imaging. Multilayer gels were incubated in 1.5 μM TI* for >240 min before imaging. Micrographs of gels and solution surrounding gels incubated in solute-free buffer were used for background subtraction. The autofluorescence of unmodified PA microscale gels incubated in solute-free buffer was found to be independent of PA gel density, so only one gel density was ultimately used for background subtraction for the unmodified PA gels during image analysis.
Measurements of Fluorescence Retention after Unloading.
The test solution was removed from the gel chamber and replaced with 1× TBST solution for ≥2 h, with a buffer exchange after 30 min to allow for complete unloading of the solute from gel. Gels were then reimaged to measure retained solute after unloading.
Micrograph Analysis and Quantitation.
To standardize the post-imaging processing, a custom macro in ImageJ 1.52i (NIH) was written that uses well-known algorithms to identify regions for analysis (Figure S2, analysis code available at: https://github.com/Llamero/Gel_partition_analysis_macro).
RESULTS AND DISCUSSION
Measuring the Spatially Resolved in Situ K of Open Hydrogels.
We first sought to design an LSCM measurement technique suitable for reporting spatially resolved in situ K values from open hydrogel systems. To report solute distribution throughout the entire volume of a gel, AC-LSCM uses the surrounding free solution as an intrinsic reference. This free solution reference allows AC-LSCM to measure both gel-independent optical artifacts and gel-dependent artifacts. Both types of artifacts confound K quantitation. In particular, gel-independent artifacts are addressable in the design of the experimental setup, including by lowering solute concentration to reduce absorption and adjusting the objective correction collar to minimize refractive errors (Figure S1). To further enhance design of the experimental setup for reproducibility, we report a companion computational algorithm to precisely define regions of interest and perform quantification.
When measuring K, we consider both axial (along z depth) and lateral (within the x–y plane) artifacts. Monochromatic depth-dependent axial optical artifacts, such as spherical aberrations, arise predominantly as signal attenuation with increasing depth into the sample (Figure S3).36 One main cause of these signal attenuating artifacts is refractive index (n) mismatches in the light path relative to the immersion medium of the objective (e.g., air, water, oil), which can arise from (i) the interface between the immersion medium (water) and the coverslip, (ii) the interface between the coverslip and the gel, and (iii) differences in n between the immersion medium and the sample.35,36 In this study, the sample is the wetted microscale hydrogel. Lateral artifacts arise from optical aberrations (e.g., coma, astigmatism) and nonuniform illumination and/or resolution across the field of view (vignetting). Considering artifacts, the calculation of K using fluorescence microscopy is more accurately described as a convolution of the true intensity (I(x,y,z)), artifacts in the axial direction (f(z)), and artifacts in the lateral direction (f(x,y)). Lateral artifacts, such as vignetting, are introduced by the finite apertures within the optical path and thus are independent of imaging depth. These lateral artifacts can be normalized during analysis by dividing a 3D image stack by a known uniform reference image stack (Figure S4). The calculation of K inherently incorporates division by a known reference stack, as the bulk solution should be perfectly uniform in intensity, and thus any observed differences are known to be artifacts:
| (4) |
The result of eq 4 is an image stack containing information on the lateral and axial distribution of solute after normalizing for lateral artifacts, still confounded by any axial aberrations (discussed in the following paragraphs). The lateral normalization can be validated by measuring the lateral intensity profile of an optical section in the K stack (Figure S4).
K is calculated from micrographs collected using an inverted LSCM system to image open PA hydrogels fabricated on chambered coverslips. Each hydrogel houses a fluid-filled well designed for collection of matched (i) in-gel fluorescence, Ig, and (ii) in-solution fluorescence, Is,c (Figure 1). Fluorescence intensity is linear with solute concentration over the ranges considered (Figure S5). The microscale hydrogel is fabricated by casting gel precursor on top of a chambered coverslip underneath a photopatterned silicon mold (see Experimental Methods, Figure 1).37 The chambered coverslip–gel system here supports in situ K measurements, in contrast to a commonly reported direct K measurement technique which involves removal of the gel from bulk solution for imaging.38,39 To investigate solute–gel interactions, chambered coverslips facilitate sample handling for measuring Ig both after solute loading and after solute unloading.
To closely match the n of PA hydrogels,40 AC-LSCM employs a water-immersion objective fitted with a correction collar. The correction collar counteracts axial artifacts induced by mismatch between n of the coverslip and n of water, and is set accurately using reflected light confocal microscopy (Figure S1). The correction collar setting was determined to be 150 μm for #1.5H chambered coverslips (170 ± 5 μm), a position that differs from the coverslip thickness specifications by 20 μm. While actively minimizing mismatches in n, we also quantify the effects of any remaining refractive errors introduced by the gel. As shown in Figure 1, the open nature of the system provides a solution layer above the gel (with corresponding fluorescence, Is,g) that is fluidically connected and in equilibrium with the solution in the well directly above the coverslip (with corresponding fluorescence, Is,c). Therefore, in the absence of refractive errors, we can write the ratio of solution fluorescence intensities as
| (5) |
Gel-induced artifacts can therefore be quantified by measuring the deviation of SIR from 1.0 (δSIR) for every K measurement. The δSIR value reports accuracy of the AC-LSCM measurement (e.g., δSIR = 0.10 indicates that the K value could be inaccurate by as much as 10%). Conventional LSCM imaging and data analysis fails to capture the impact of gel-induced artifacts on K quantitation, a primary contribution of the AC-LSCM technique reported here.
We can also control for inaccurate correction collar positioning by measuring fluorescence signal with depth in the solution filling the well. To do this, we compare the solution fluorescence intensity at the same depth as that used from the gel micrograph (Is,s) to the solution intensity in the well proximal to the coverslip (Is,c) (Figure 1). The estimated absorbance of solution is minimal for the concentration and imaging depths used.41 Therefore, with an accurately positioned correction collar, the intensity of solution should be depth-invariant:
| (6) |
SIRC provides real-time data validating the optimal correction collar position for every K measurement, replacing the need to collect reflection micrographs throughout the experiment. The advent of multi-immersion objectives makes AC-LSCM compatible with any fluorescence microscopy-based K measurement where the solution has n between 1.33 and 1.52. The objective should be matched to n of the solution and can be verified by measuring SIRC.
Assessing K in Solute and Hydrogel System Governed by Size-Exclusion.
We then utilized AC-LSCM to study gel–solute interactions in open microscale unmodified PA gel systems. Ogston’s ideal size-exclusion model, which assumes that K = Ksize (from eq 2), posits that K for a given solute will decrease in a log–linear manner as gel density increases:42
| (7) |
where ϕ represents polymer volume fraction (related to pore size for a uniform suspension of fibers), Rh is the hydrodynamic radius of the partitioning solute, and af corresponds to the polymer fiber radius. Thus, as gel density increases, ϕ increases, and the average pore size of the gel decreases. Decreasing pore size results in increased exclusion of a given solute from the gel matrix. Various solutes have been shown to follow Ogston’s ideal size-exclusion model in PA gels larger than the microscale dimension studied here.26,43,44 Using the AC-LSCM system, we assessed K in 6%T, 9%T, 12%T, 15%T, and 18%T w/v microscale PA gels (all with bis-acrylamide density equal to 3.3%C). Note that the lateral resolution of the microscope (100s of nm) does not resolve the estimated pore size45 of any PA gels in this study (radii of 10s of nm); therefore, we do not anticipate observed lateral differences in K. Microscale gels were 40–60 μm thick (z). As solute, we studied the 20.1 kDa protein TI labeled with Alexa Fluor 647 (TI*). TI*-containing solution and hydrogel were incubated until equilibrium was reached (>60 min). The equilibration time was estimated using the equation for 2D diffusion combined with a hindered in-gel diffusion model (Note S1).46
In considering Ogston’s theory, we converted47 gel density (%T w/v) to ϕ, adjusting for a lower percent bis-acrylamide used in this study (ϕ = 0.0093 × %T − 0.03151). We used Rh ~ 24.5 Å for TI*.48,49 Because the K measurements were performed in 2% (~300 μM) BSA solution, an additional term is included in the model to account for interactions between BSA and TI* (Note S2).14 K values were equated following eq 4, and uniform lateral distribution of solute throughout the gels was observed after normalization of lateral artifacts (Figure S4). The experimentally determined K values follow the anticipated size-exclusion model trend of a log–linear decrease in K with increasing gel density (Figure 2A). Our results fit the adjusted Ogston model with R2 = 0.98 and yielded af = 5.9 Å, which agrees with previous findings for PA gels of similar composition.26
Figure 2.
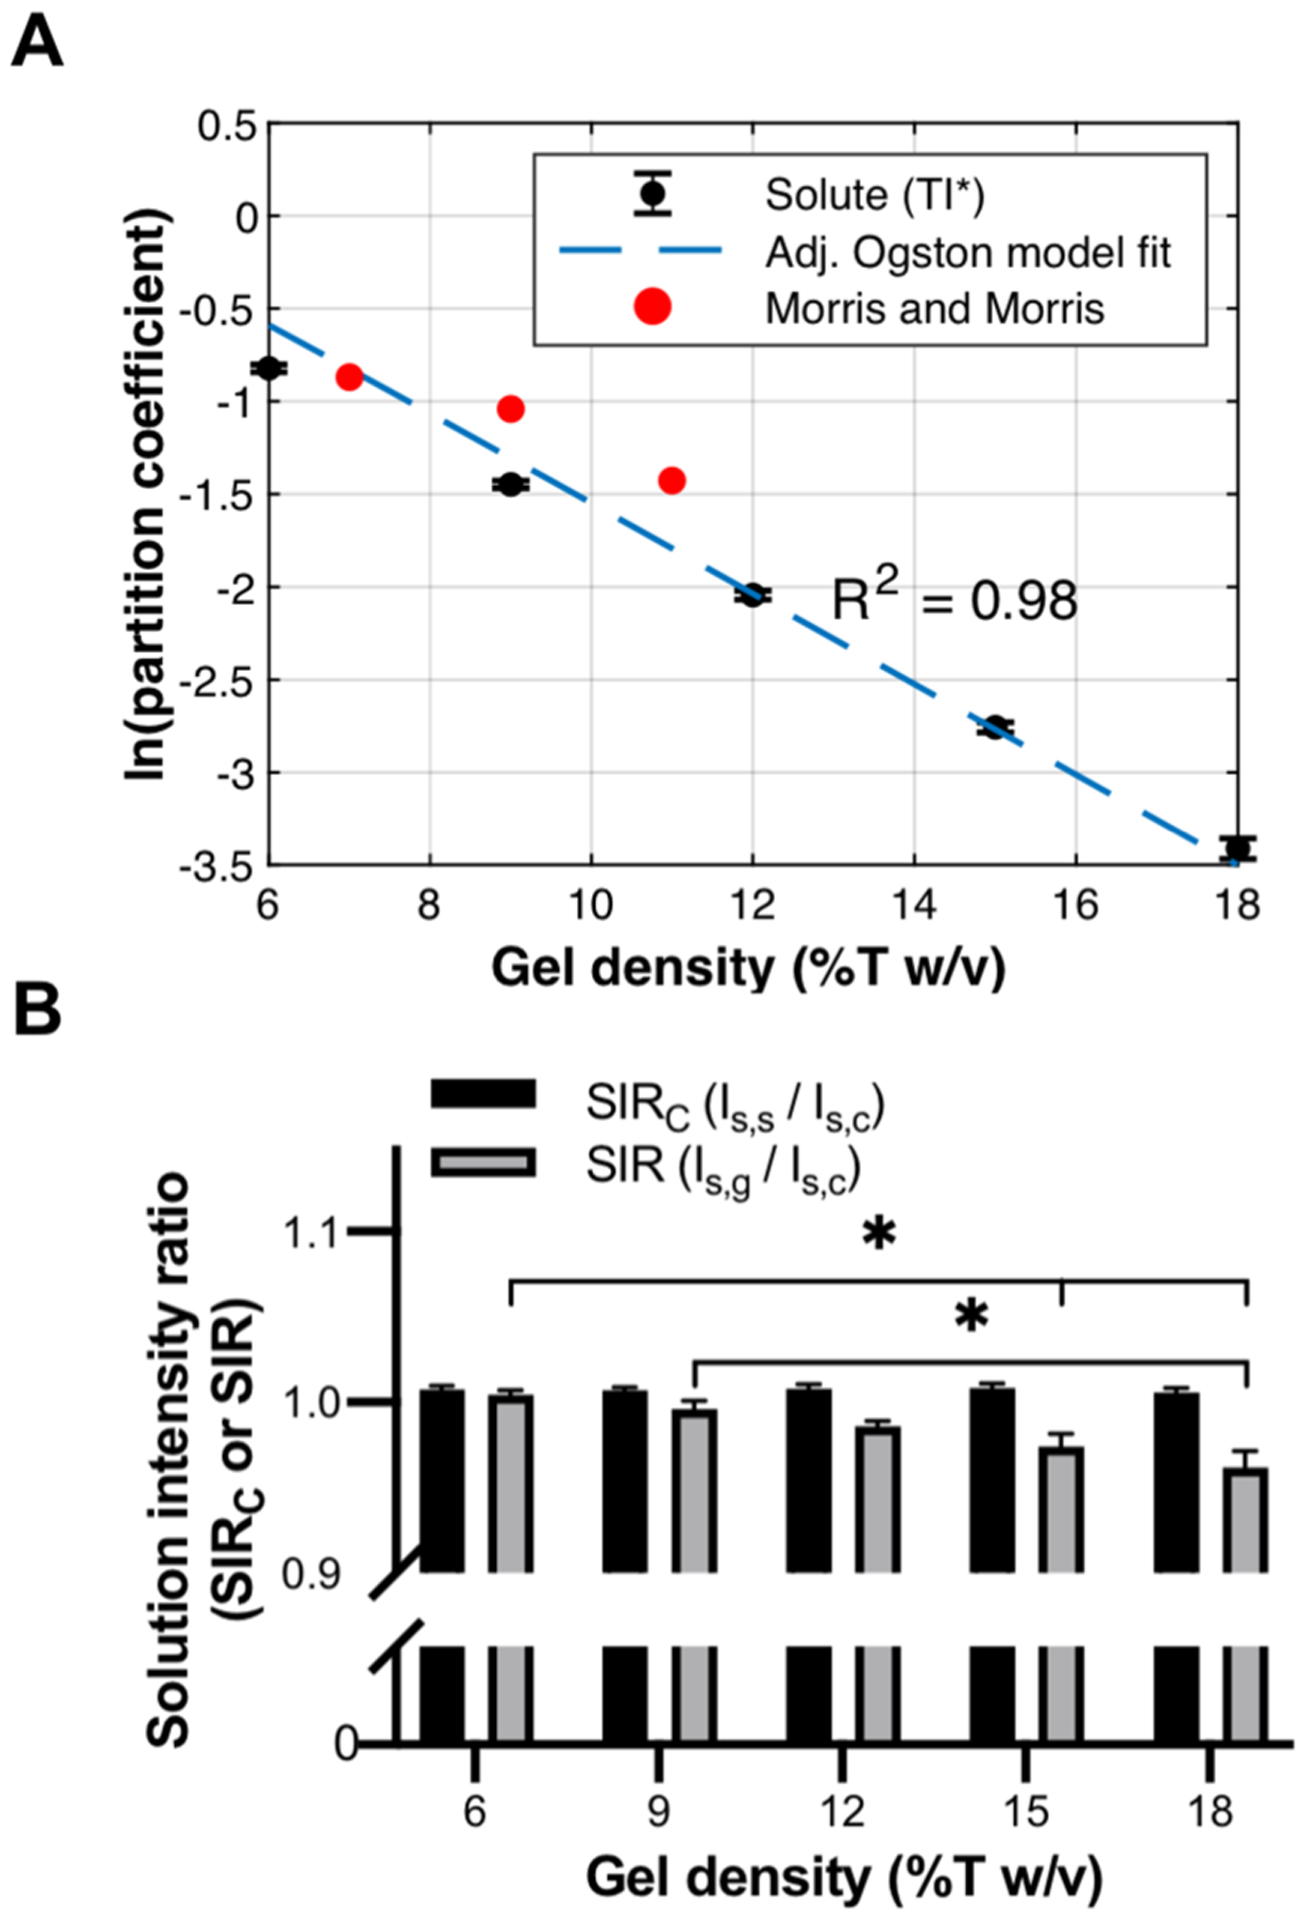
Validation of AC-LSCM measurement system. (A) AC-LSCM is used to measure K of TI* in varying density microscale hydrogels (black data points) compared to the adjusted Ogston model (dashed blue line) and published values (red data points). (B) Characterization of axial artifacts over varying gel densities. Error bars indicate standard deviation of N = 4 replicates. *p < 0.05, Kruskal–Wallis test with Dunn’s multiple comparison test.
We further compared our experimentally determined K values to previously reported K values for TI measured using size-exclusion chromatography in PA gels with similar acrylamide and bis-acrylamide concentrations to this study (Figure 2A). Morris and Morris50 report K values of 0.419, 0.353, and 0.240 for TI in 7%T, 9%T, and 11%T w/v PA hydrogels (all with 3%C). Including the fluorophore labeling of TI (increasing the effective Rh by ~7 Å), the estimates of Morris and Morris corroborate the K values measured here.51 Furthermore, no significant difference is observed in the K value of TI* when comparing a mass-balance technique to AC-LSCM adapted for macroscale gels (Figure S6, N = 3 replicates; p > 0.9999, Mann-Whitney U-test).
From the 3D micrograph stacks used to calculate K (Figure 1), we also characterized axial aberrations by quantifying SIR and SIRC defined in eqs 5 and 6, respectively. We anticipated SIRC would remain close to 1.0 across all conditions, as the correction collar was set at the beginning of the experiment using reflected light confocal microscopy and all coverslips originated from the same lot. We observed no significant deviation of SIRC over the conditions tested, verifying accurate positioning of the correction collar and minimal solution absorption (Figure 2B, N = 4 replicates, p > 0.05, Kruskal–Wallis test with Dunn’s multiple comparison test). In contrast, SIR decreases from 1.0 with increasing gel density, with significant differences between gel densities (Figure 2B, N = 4 replicates, p = 0.0015, Kruskal–Wallis with post-test Dunn’s multiple comparisons). The decreasing SIR does not appear to be due to increasing gel height (Figure S7). Rather, we hypothesize that SIR decreases with increasing gel density due to a measured decline in Is,g caused by increasing n of the gel. As n of the gel increases, the difference between n of the gel and n of the immersion medium (water) increases.40 This difference has been shown to cause a decline in measured intensity with imaging depth.35,36Conversely, if the correction collar position is set to the coverslip specification of 170 μm (i.e., without using reflected light confocal microscopy position-determination), the collar position will be overadjusted and artificially compensate for aberrations induced by denser gels, resulting in SIR > 1.0 (Figure S8). An overadjusted collar reports erroneous impact of aberrations on K, which could ultimately propagate to inaccurate quantitation of K.
To assess the impact of axial artifacts on quantitation, we compared δSIR to the coefficient of variation (CV) measured for each gel density (Figure S9). We observe a CV equal to or greater than δSIR for each gel density, which suggests that axial aberrations are negligible for the conditions studied here. We hypothesize that, in addition to the n of these hydrogels being closely matched to the n of water, axial artifacts are further mitigated by the relatively short axial length of these gels, which reduces the required imaging depth and, concomitantly, depth-dependent artifacts.
Characterization of Partitioning Behavior of Differently Sized Solutes in Modified PA Gels.
Modifying PA structure imparts tailored functionality, including the introduction of new interactions, such as hydrophobic52,53 or biospecific54 interactions (eq 5), between the altered PA gel matrix and the solute. Modification by conjugation of a photoactive molecule to the PA gel backbone introduces light-triggered solute–gel interactions. Benzophenone is a light-activated molecule that forms covalent bonds with compatible solutes through hydrogen abstraction and can be incorporated into the PA gel backbone during polymerization in the form of BPMAC.4,55 The impact of incorporation and photoactivation of BPMAC in PA microscale hydrogels on partitioning behavior of solutes (both after loading and after unloading) has not yet been studied. We apply the AC-LSCM measurement system to investigate this modification with 3D resolution.
We hypothesize that photoactivation of BPMAC-containing PA gels prior to introduction of solute could influence the partitioning behavior of solutes in the following ways: (1) BPMAC reaction with neighboring acrylamide strands would decrease the effective gel pore size and therefore decrease K, (2) attractive interactions between BPMAC and solute (e.g., hydrophobic or biospecific) would raise K, (3) a combination of 1 and 2, or (4) BPMAC modification of the PA gel yields no influence on partitioning behavior. Given that the ideal size-exclusion model requires that all solute molecules unload from the gel in solute-free solution, size-based and attractive interactions are independently measurable. The AC-LSCM technique differentiates the two phenomena by measuring both K and retention of solute after unloading of solute from the microscale PA gels.38
We first sought to understand how solute loading (K) and unloading (retention) scales with solute size in BPMAC-containing gels. We compared a commonly used immunoprobe, an antibody (Ab, Rh = 5.41 nm), to a smaller antigen-binding antibody fragment (Fab, Rh = 2.91 nm).56 Both were labeled with Alexa Fluor 647 for fluorescence visualization (Ab* and Fab*). We observed that photoactivated BPMAC-containing gels retain considerably more Fab* and Ab* after loading and subsequent unloading compared to vehicle control gels in the presence or absence of UV exposure or gels containing BPMAC without UV exposure (Figure S10). Therefore, K values and retained in-gel immunoprobe fluorescence after unloading were measured for the two most relevant conditions: vehicle control gels and photoactivated BPMAC-containing gels. Importantly, the 3D resolution provided by the AC-LSCM system provides critical insight into the spatial distribution of retention, not obtainable with indirect methods or wide-field fluorescence microscopy. Anticipated K values were estimated using eq 7, eq 7 adjusted to account for BSA interactions, and the parameters determined previously for PA gels used in this study (Table 1). Interestingly, The observed K value for Ab* in vehicle control gels exceeds that predicted by theory by 89% (eq 7) and 52% (adjusted eq 7) (Table 1). One possible explanation for the discrepancy between the measured and theoretical K values could stem from our assumption that Alexa Fluor 647 adds ~7 Å to Rh; depending on the label site, we hypothesize that the dye may not contribute significantly to Rh for larger molecules. If Rh of Ab* is assumed to equal Rh of Ab (54 Å), the anticipated K value is 0.08 (eq 7) or 0.10 (adjusted eq 7), closer to the measured value. Also notable is the observation that the measured K value for Ab* in 6%T w/v gels is only 50% of the reported K value for Ab* in 8%T w/v microscale PA gels measured previously using widefield fluorescence.4 Though the experimental conditions were not identical, our results using AC-LSCM suggest the importance of optical sectioning techniques for accurate K measurements in these open microscale hydrogel systems.
Table 1.
Partition Coefficients of Ab* and Fab* in Vehicle Control and Photoactivated 6%T w/v Microscale PA Gels
To determine what impact the incorporation and photoactivation of BPMAC has on K values of Ab* and Fab*, we compared K values in UV-exposed BPMAC-modified PA gels to vehicle control gels (Table 1). We observe a statistically significant (~10%) increase in K values for both Ab* and Fab* in photoactivated BPMAC-modified PA gels compared to controls (N = 4 replicates, Mann–Whitney U-test, p = 0.0286; Figure 3A). These higher K values in BPMAC-photoactivated PA gels indicate that the inclusion and photoactivation of BPMAC cause a shift in the thermodynamic equilibrium state of the immunoprobes toward the gel phase, likely due to attractive interactions between the solutes and immobilized BPMAC.
Figure 3.
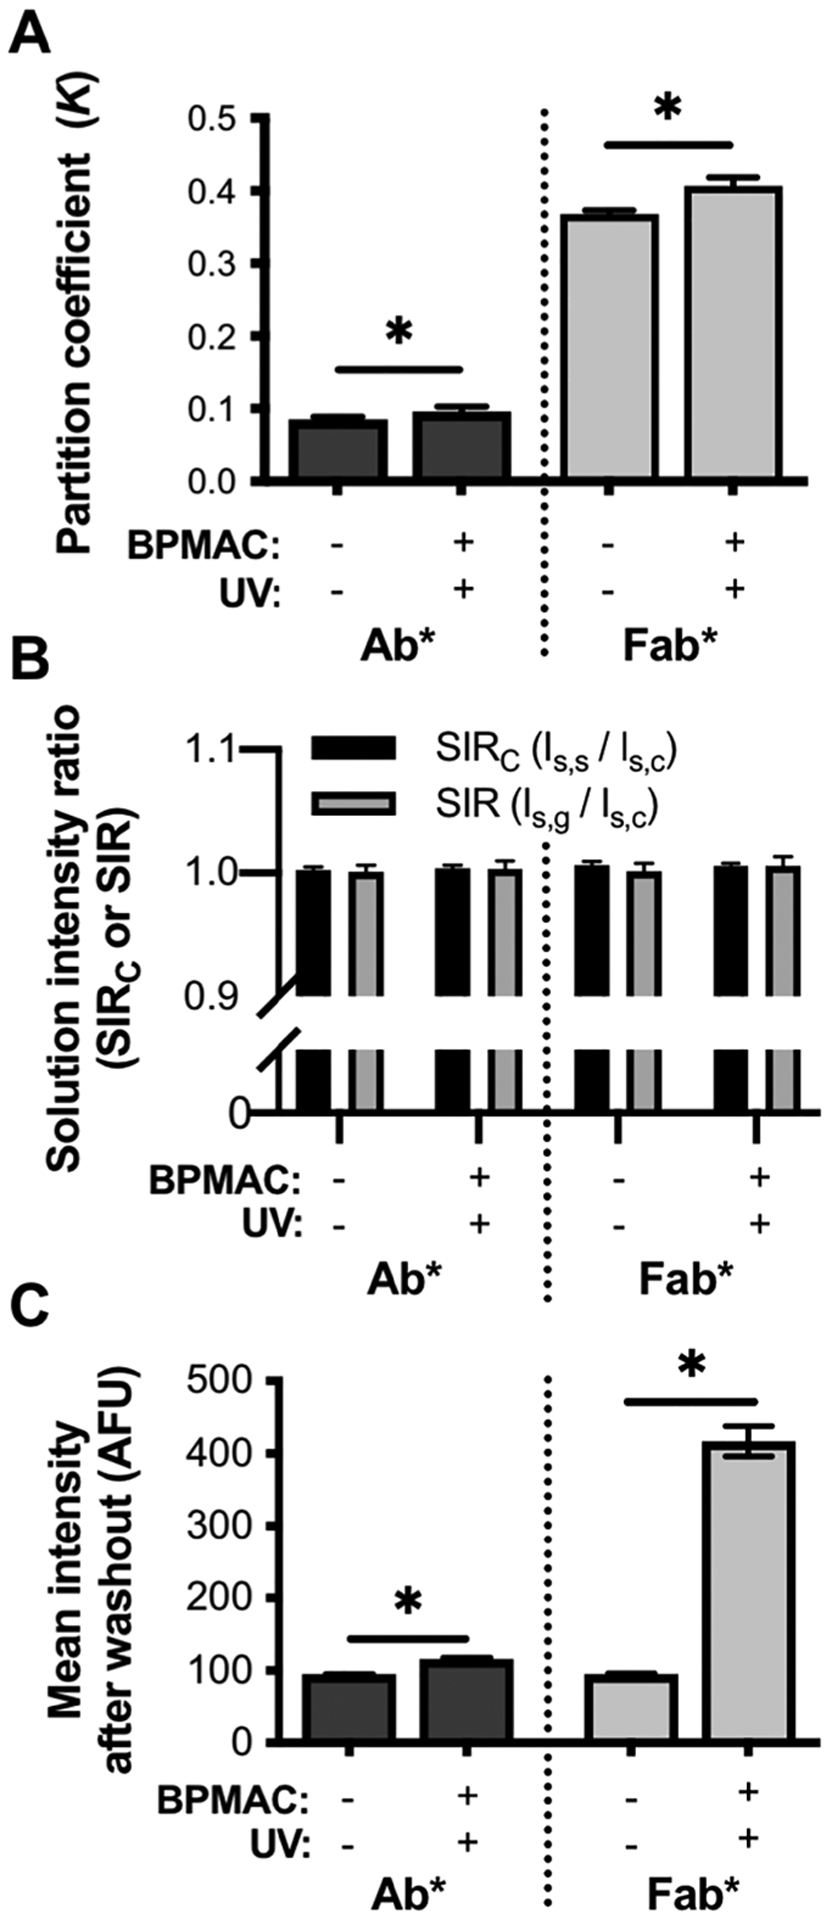
Comparison of partitioning behavior of Ab* and Fab* in photoactivated BPMAC-containing and vehicle control gels. (A) K of immunoprobes in photoactivated BPMAC-modified gels and vehicle control gels. (B) Characterization of solution intensity ratios reveal minimal axial aberrations. (C) Comparison of retention of both immunoprobes after unloading in photoactivated BPMAC-containing gels compared to control gels. Error bars indicate standard deviation of N = 4 replicates. *p < 0.05, Mann–Whitney U-test.
As described earlier, important to quantitation is the measurement of SIR and SIRC for all experimental conditions. All ratios were close to 1.0 (Figure 3B), confirming that the correction collar was accurately positioned and that activated BPMAC does not introduce additional axial artifacts.
We also investigated whether there is retention of Ab* and Fab* in photoactivated BPMAC-modified PA gels after unloading in solute-free buffer, how retention is distributed throughout the gel in all three dimensions, and if the amount retained depends on solute size. These questions are critical not only for a fundamental understanding of how photoactivated BPMAC influences PA gel–solute interactions, but also because these photoactivatable gels are currently essential for targeted proteomic electrophoretic cytometry assays in their ability to serve as both a separation matrix (for electrophoresis) and an immunoblotting scaffold (for a subsequent immunoassay).4,57 Given that the background and noise generated by immunoprobe in in-gel immunoassays is directly related to retention of immunoprobe in the gel after unloading, understanding how this photoactivated BPMAC-modified gel matrix impacts immunoprobe partitioning behavior is critical.11 After the micrographs to calculate K were acquired, all gels were subjected to solute unloading in 1× TBST for >2 h and imaged to quantify the remaining in-gel solute fluorescence. The mean fluorescence intensities after washout of Ab* and Fab* in both gel conditions are presented in Figure 3C.
The results show that significant amounts of both Ab* and Fab* remain in the gel after unloading compared to vehicle control gels (N = 4 replicates, Mann–Whitney U-test, p = 0.0286). Furthermore, axial intensity profiles establish that retention of both immunoprobes throughout the gels is uniform in all three dimensions (Figure S11), establishing that retention is not caused by adsorption of solute to the outer surface of the gel. We hypothesize that probe retention is caused by one of three potential mechanisms of interaction with BPMAC after UV exposure: (1) formation of benzopinacol,55 which forms hydrophobic interactions with the probes, (2) continued reactivity of BPMAC, resulting in covalent bonds forming between immunoprobe and gel backbone, or (3) formation of an “IgG-like” epitope that is reactive with both immunoprobes.
To understand the impact of immunoprobe size on partitioning behavior in photoactivated gels, we compared the ratios of Ig after to Ig before washout for both Ab* and Fab*, which normalizes for different degrees of labeling between the two probes. We find that Fab* is significantly (5.4×) more retained than Ab* in photoactivated BPMAC-containing gels (N = 4 replicates, Mann–Whitney U-test, p = 0.0286) Note that the median filter used for image analysis results in an underestimate of the fraction of retained fluorescence in-gel (Figure S12). We attribute the increased retention of smaller immunoprobe to the higher in-gel Fab* concentration compared to Ab* (~270 nM vs ~65 nM), resulting in more availability to interact with BPMAC which is present in excess (3 mM in the precursor solution). The higher retention of Fab* has degrading implications for the analytical sensitivity of in-gel immunoassays using smaller immunoprobes: even though Fab* has a higher K value than Ab*, higher retention after washout leads to higher background signal.
Assessing K in Multilayered PA Gels.
We next considered a two-layer PA gel structure and applied AC-LSCM to measure K along the z-axis of the composite system (Figure S13). The two-layer gel comprises a large-pore-size gel layered atop a smaller-pore-size gel. The two-layer gel is fabricated layer-by-layer on a chambered coverslip. The bottom gel is cast from a 15%T w/v precursor solution (15%Tnom, “nom” = nominal). A 6%T w/v precursor solution is polymerized in situ on the hydrated bottom gel to form the top gel (6%Tnom). After fabrication, the composite structure is immersed in a solution of TI*. Using AC-LSCM, we measured K in each layer of the two-layer gel structure (which required small adjustments to the analysis script to identify multiple gel layers) and in each of two control gel configurations, which comprised single-layer gels having the same nominal gel composition as each layer from the two-layer gel (Table 2).
Table 2.
K of Composite, Two-Layer Gel Structure Measured by AC-LSCM
| K | Two-layer (N = 4) | Single-layer (N = 4) |
|---|---|---|
| 6%T formulation | 0.52 ± 0.01 | 0.44 ± 0.02 |
| 15%T formulation | 0.021 ± 0.001 | 0.067 ± 0.003 |
In comparison to control gels, the K value for the top gel layer was 18% larger than that of the single-layer 6%T control gel (N = 4 replicates; p = 0.0286, Mann–Whitney U-test). For the bottom layer of the two-layer gel system, we observed a K value that is 69% smaller than the single-layer 15%T control gel (N = 4 replicates; p = 0.0286, Mann–Whitney U-test) (Figure 4A). We next sought to understand why the effective K values measured for each layer of the two-layer gel structure differ from the K values of each gel when fabricated as a single gel layer.
Figure 4.
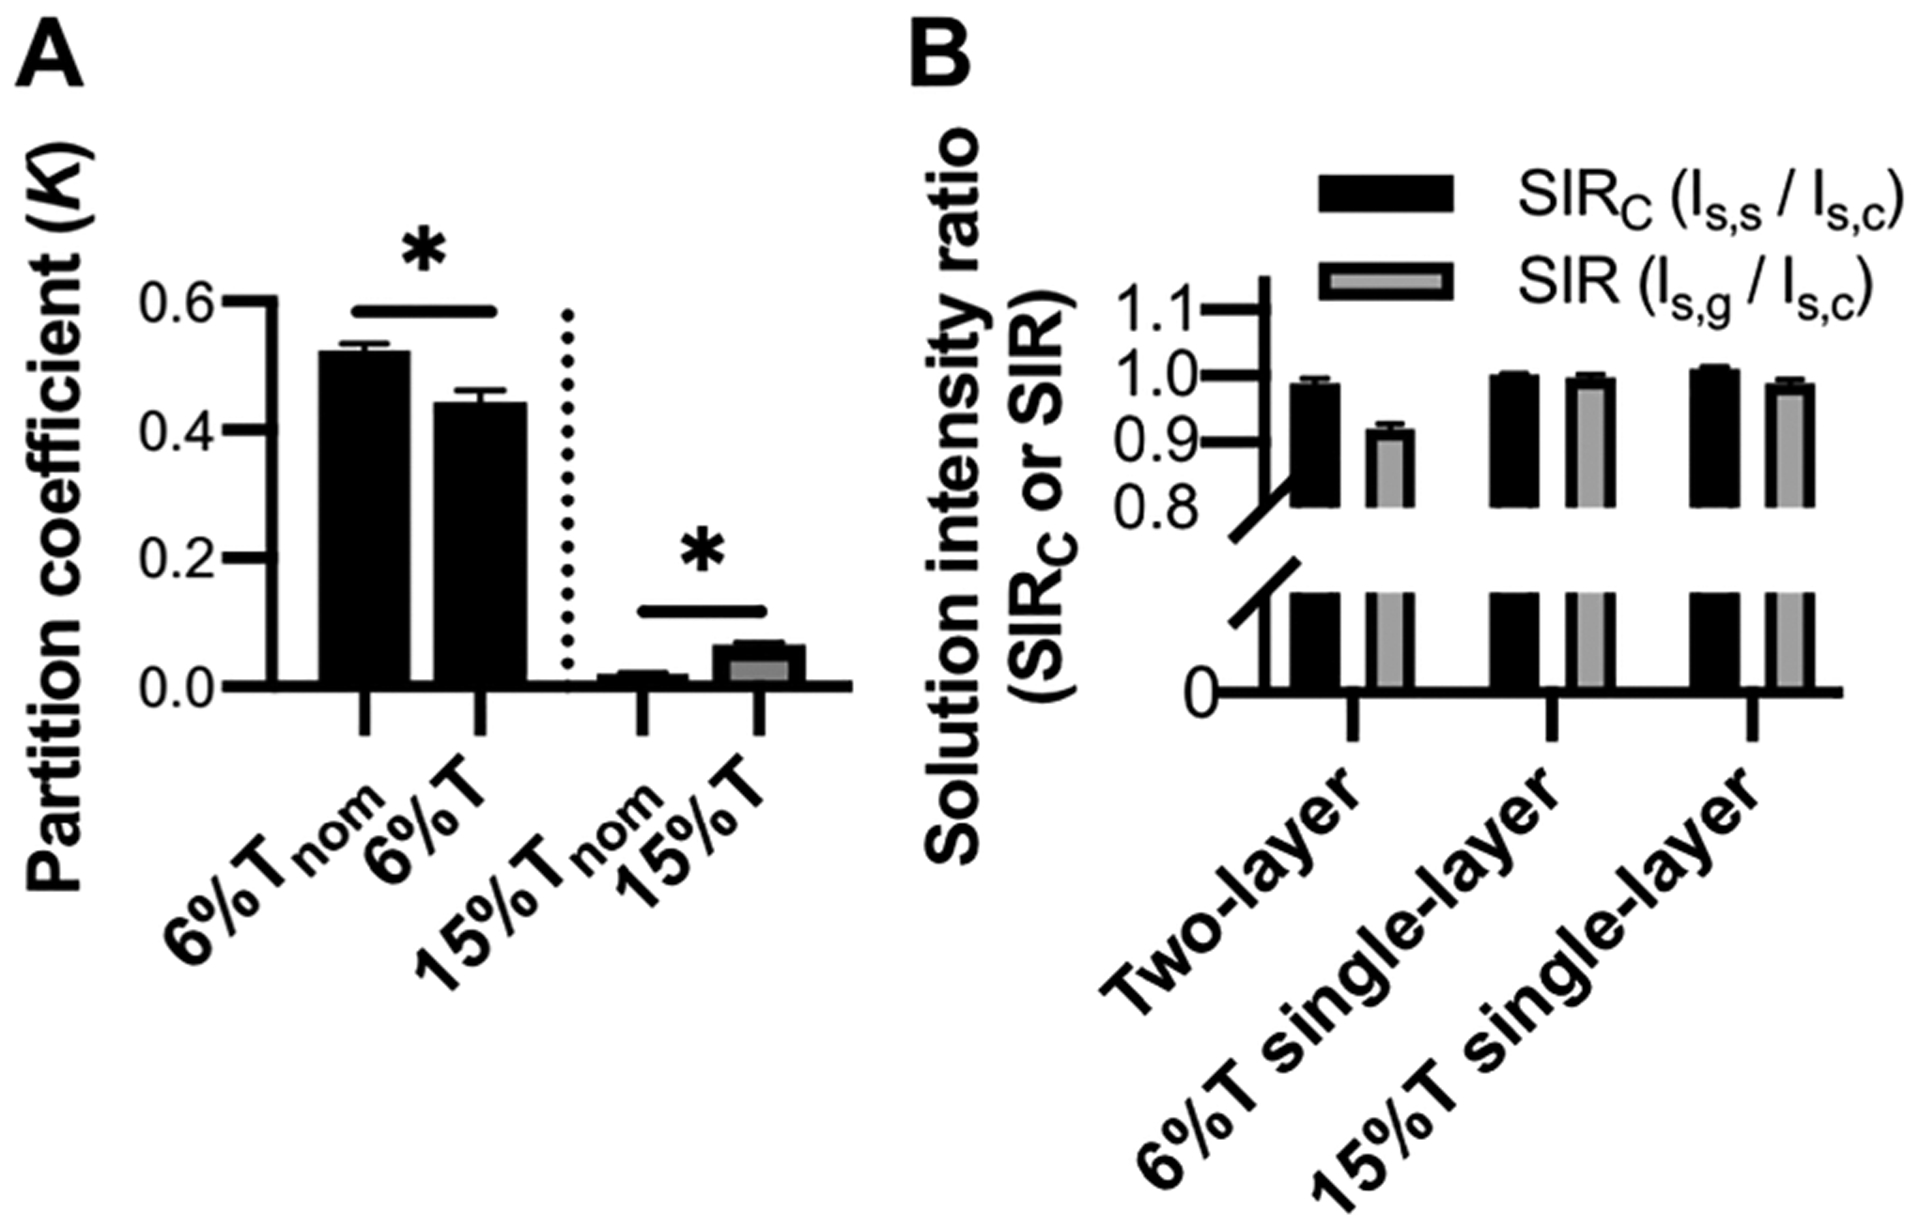
Two-layer gel structures exhibit more complex partitioning behavior than single-layer control gels of same nominal pore size. (A) K of TI* in each layer of the two-layer gel (“nom”) compared to control single-layer gel. (B) Characterization of solution intensity ratios to assess axial aberrations. Error bars indicate standard deviation of N = 4 replicates. *p < 0.05, Mann–Whitney U-test.
First, when considering the top layer of the two-layer structure, we note that the top layer sits atop the hydrated 15% Tnom bottom gel layer, whereas the single-layer control gel sits atop a chambered coverslip. Consequently, in the two-layer configuration, we expect excess water from the hydrated 15% Tnom gel to dilute the concentration of acrylamide monomer in the 6%T precursor solution, prior to polymerization of the 6% T layer. A single-layer gel will not experience this dilution effect. In the two-layer system, the dilution process will create a lower effective pore size in the top layer than that expected from the nominal 6%T of the precursor solution.
Second, when considering the bottom layer, we expect that the layer-by-layer fabrication approach will see diffusion of free monomer from the top layer precursor solution into the polymerized bottom layer. The diffusion of monomer into the 15%T network will create a denser network than expected from the nominal 15%T of the precursor solution. The generation of smaller pore sizes caused by an acrylamide concentration gradient has been reported in photopolymerized PA gels.58 In that study, a gradient of pore sizes along the main axis of diffusion was observed. We observe not a gradient, but an apparent uniform distribution of TI* throughout the 15% Tnom gel layer, indicative of a uniform pore size distribution (Figure S13). Analysis of the Damköhler number demonstrates that the uniform distribution observed in this study using chemically polymerized gels is consistent with theory (Note S3).
Third, we must account for the differing solute concentration boundary conditions of the 15%T gel in the two configurations. In the two-layer gel, the top 6%Tnom layer creates a boundary condition where the solute concentration interfacing with the 15%Tnom gel layer is not the bulk solution concentration C0, but rather the concentration in the 6%Tnom gel, C6%T = K6%Tnom × C0 (Figure S13). In a multi-layered system dominated by size-exclusion partitioning where one layer is screened from the bulk solution phase, past studies have shown that the screened layer will not reach equilibrium with the bulk solution phase, resulting in a lower K value when K is measured with respect to the bulk solution concentration.59 This applies to the system considered here when images are acquired far from the gel edges and equilibrium is established along the shorter axial z dimension but not the lateral dimension. Interestingly, when the configuration of the two-layer gel system is reversed, only a single gel layer is distinguishable using AC-LSCM (Figure S14). The observed uniformity in gel pore size is consistent with the analysis presented and is likely due to a combination of a denser network formed during polymerization of the dense top gel layer, and the low concentration of solute available to partition into the bottom gel due to the solute concentration boundary condition.
Finally, we consider depth-dependent aberrations and their influence on measured K values. We observe δSIR = 8% in the two-layer gels, greater than those of the control 6%T (δSIR = (0.3 ± 0.5%) and 15%T (δSIR = 1.1 ± 0.6%) single-layer gels and greater than δSIRC (δSIRC = 1.17 ± 0.9%) (N = 4 replicates, Figure 4B). The deviation from 1.0 is expected and stems from the larger thickness of the two-layer gels (>100 μm) compared to the single-layer control gels (20–60 μm). The thicker gels increase the imaging depth required to reach Is,s and therefore enhance depth-dependent aberrations. In this case, the 8% decrease in solution intensity after imaging through the gel is larger than the CV of the K values measured in both the 6% Tnom gel (CVK = 2.0%) and 15%Tnom gel (CVK = 4.6%) layers. The depth-dependent aberrations introduced by the gel act to reduce the measured solute fluorescence intensity Ig in the gel. Therefore, the reduced fluorescence intensity measured in the gel would also be observed using standard LSCM. However, the AC-LSCM technique additionally reports the accuracy of the Ig measurement. Through the δSIR value, AC-LSCM estimates the degree of optical aberration-induced, depth-dependent variation in Ig, thus allowing a user to determine the accuracy of K. For example, in the system studied here, the Ig value in both the 6%Tnom and the 15%Tnom gel layers has a δSIR = 0.08 (Figure 4B). A δSIR of 0.08 means that K is within 8% of the measured value. To further reduce uncertainty in the K measurement, an empirical relationship describing the aberration-induced depth-dependence of the in-gel fluorescence signal could be established (Note S4).
CONCLUSIONS
We report on AC-LSCM, a measurement tool for quantifying spatially resolved partitioning behavior of solutes in open microscale hydrogel systems. The measurement system minimizes and quantifies optical artifacts that could further confound analysis while providing 3D spatial information on the distribution of solute within different hydrogel systems. We quantify the effect of pore size and chemical modifications to the gel backbone on partitioning of proteins into microscale PA gels. We find that while unmodified microscale PA gels follow size-exclusion partitioning, modification of the PA backbone with an activated BPMAC photocapture moiety results in spatially uniform, size-dependent retention of immunoprobes. This is intriguing, as benzophenone has been reported to be stable under ambient light and only remains in the activated state on the order of μs.55 We further characterize the partitioning characteristics of composite multilaminate gels using AC-LSCM. We measure the differential partitioning of solute in the distinct gel layers. Partitioning analysis revealed deviations in K of a model solute in the layers of these composite gels compared to single-layer control gels, consistent with theory. Overall, AC-LSCM and the accompanying analysis process presented in this study provide a data-rich framework for characterizing 3D partitioning of solutes in complex hydrogel structures with high precision and accuracy that can be readily extended beyond hydrogel systems to measure K in other systems, such as solid-phase micro-extraction systems that have applications ranging from environmental to biomedical and pharmaceutical to physicochemical.60
Supplementary Material
ACKNOWLEDGMENTS
This work was supported by National Institutes of Health NIH R01 Award #R01CA203018 and Cancer Moonshot R33 Award #R33CA225296, and the Office of the Assistant Secretary of Defense for Health under Award #W81XWH-16-1-0002 (PI: Herr). Opinions, interpretations, conclusions, and recommendations are those of the authors and are not necessarily endorsed by the Department of Defense. A.S. was supported by NIH training grant under Award #T32GM008155 and a National Science Foundation Graduate Research Fellowship under Award #DGE 1106400. Photolithography was performed in the Biomolecular Nanotechnology Center. Confocal imaging experiments were conducted at the CRL Molecular Imaging Center, supported by the Gordon and Betty Moore Foundation. The authors are grateful for helpful discussions with Dr. Samantha Grist, as well as other members of the Herr lab.
Footnotes
Supporting Information
The Supporting Information is available free of charge at https://pubs.acs.org/doi/10.1021/acs.analchem.9b03582.
Correction collar positioning and impact on quantitation; analysis schematics; impact of axial artifacts and median filtering on quantitation; solute concentration vs fluorescence intensity, gel height vs SIR, CV vs δSIR, and AC-LSCM vs mass-balance; preliminary experiments with photoactivated gels; retention of solute after gel unloading; partitioning in two-layer gel configurations; diffusion time calculations; adjusted Ogston model; Damköhler number analysis; quantifying aberration-induced depth-dependent in-gel fluorescence (PDF)
The authors declare no competing financial interest.
REFERENCES
- (1).Álvarez-Paino M; Muñoz-Bonilla A; Fernández-García M Nanomaterials 2017, 7, 48. [DOI] [PMC free article] [PubMed] [Google Scholar]
- (2).Kamperman T; Karperien M; Le Gac S; Leijten J Trends Biotechnol. 2018, 36, 850–865. [DOI] [PubMed] [Google Scholar]
- (3).Appleyard DC; Chapin SC; Srinivas RL; Doyle PS Nat. Protoc 2011, 6, 1761–1774. [DOI] [PubMed] [Google Scholar]
- (4).Hughes AJ; Spelke DP; Xu Z; Kang C-C; Schaffer DV; Herr AE Nat. Methods 2014, 11, 749–755. [DOI] [PMC free article] [PubMed] [Google Scholar]
- (5).Gehrke SH; Fisher JP; Palasis M; Lund ME Ann. N. Y. Acad. Sci 1997, 831, 179–207. [DOI] [PubMed] [Google Scholar]
- (6).Albertsson P Adv. Protein Chem 1970, 24, 309–341. [DOI] [PubMed] [Google Scholar]
- (7).Peppas NA; Hilt JZ; Khademhosseini A; Langer R Adv. Mater 2006, 18, 1345–1360. [Google Scholar]
- (8).Lowman AM; Morishita M; Kajita M; Nagai T; Peppas NA J. Pharm. Sci 1999, 88, 933–937. [DOI] [PubMed] [Google Scholar]
- (9).Lim F; Sun A Science 1980, 210, 908–910. [DOI] [PubMed] [Google Scholar]
- (10).Nafea EH; Marson A; Poole-Warren LA; Martens PJ J. Controlled Release 2011, 154, 110–122. [DOI] [PubMed] [Google Scholar]
- (11).Vlassakis J; Herr AE Anal. Chem 2015, 87, 11030–11038. [DOI] [PMC free article] [PubMed] [Google Scholar]
- (12).Choi NW; Kim J; Chapin SC; Duong T; Donohue E; Pandey P; Broom W; Hill WA; Doyle PS Anal. Chem 2012, 84, 9370–9378. [DOI] [PubMed] [Google Scholar]
- (13).Appleyard DC; Chapin SC; Doyle PS Anal. Chem 2011, 83, 193–199. [DOI] [PMC free article] [PubMed] [Google Scholar]
- (14).Lazzara MJ; Deen WM J. Colloid Interface Sci 2004, 272, 288–297. [DOI] [PubMed] [Google Scholar]
- (15).Kosto KB; Panuganti S; Deen WM J. Colloid Interface Sci 2004, 277, 404–409. [DOI] [PubMed] [Google Scholar]
- (16).Yoon SC; Jhon MS J. Appl. Polym. Sci 1982, 27, 3133–3149. [Google Scholar]
- (17).Peng C-C; Chauhan AJ Controlled Release 2011, 154, 267–274. [DOI] [PubMed] [Google Scholar]
- (18).Lei J; Mayer C; Freger V; Ulbricht M Macromol. Mater. Eng 2013, 298, 967–980. [Google Scholar]
- (19).Buehler KL; Anderson JL Ind. Eng. Chem. Res 2002, 41, 464–472. [Google Scholar]
- (20).Dursch TJ; Liu DE; Oh Y; Radke CJ Acta Biomater. 2015, 15, 48–54. [DOI] [PubMed] [Google Scholar]
- (21).Watkins AW; Southard SL; Anseth KS Acta Biomater. 2007, 3, 439–448. [DOI] [PMC free article] [PubMed] [Google Scholar]
- (22).Parker CA; Rees WT Analyst 1962, 87, 83. [Google Scholar]
- (23).Kubista M; Sjöback R; Eriksson S; Albinsson B Analyst 1994, 119, 417–419. [Google Scholar]
- (24).Swinehart DF J. Chem. Educ 1962, 39, 333–335. [Google Scholar]
- (25).Russell SM; Carta G Ind. Eng. Chem. Res 2005, 44, 8213–8217. [Google Scholar]
- (26).Tong J; Anderson JL Biophys. J 1996, 70, 1505–1513. [DOI] [PMC free article] [PubMed] [Google Scholar]
- (27).Herrmann A; Rö S; Schmidt C; Schierack P; Schedler U Anal. Chem 2019, 91, 8484–8491. [DOI] [PubMed] [Google Scholar]
- (28).Linden T; Ljunglöf A; Hagel L; Kula M-R; Thömmes J Sep. Sci. Technol 2002, 37, 1–32. [Google Scholar]
- (29).Ljunglöf A; Thömmes J J. Chromatogr. A 1998, 813, 387–395. [DOI] [PubMed] [Google Scholar]
- (30).Blasi L; Argentiere S; Morello G; Palamà I; Barbarella G; Cingolani R; Gigli G Acta Biomater. 2010, 6, 2148–2156. [DOI] [PubMed] [Google Scholar]
- (31).Thomas FA; Visco I; Petrášek Z; Heinemann F; Schwille P Biochim. Biophys. Acta, Biomembr 2015, 1848, 2932–2941. [DOI] [PubMed] [Google Scholar]
- (32).Zielinska K; Town RM; Yasadi K; van Leeuwen HP Langmuir 2014, 30, 2084–2092. [DOI] [PubMed] [Google Scholar]
- (33).Vagias A; Sergelen K; Koynov K; Košovan P; Dostalek J; Jonas U; Knoll W; Fytas G Macromolecules 2017, 50, 4770–4779. [Google Scholar]
- (34).Kotsmar C; Sells T; Taylor N; Liu DE; Prausnitz JM; Radke CJ Macromolecules 2012, 45, 9177–9187. [Google Scholar]
- (35).Michielsen S J. Appl. Polym. Sci 2001, 81, 1662–1669. [Google Scholar]
- (36).Hell S; Reiner G; Cremer C; Stelzer EKH J. Microsc 1993, 169, 391–405. [Google Scholar]
- (37).Kang C-C; Yamauchi KA; Vlassakis J; Sinkala E; Duncombe TA; Herr AE Nat. Protoc 2016, 11, 1508–1530. [DOI] [PMC free article] [PubMed] [Google Scholar]
- (38).Dursch TJ; Taylor NO; Liu DE; Wu RY; Prausnitz JM; Radke CJ Biomaterials 2014, 35, 620–629. [DOI] [PubMed] [Google Scholar]
- (39).Hagel V; Haraszti T; Boehm H Biointerphases 2013, 8. [DOI] [PubMed] [Google Scholar]
- (40).Stejskal J; Horská J Makromol. Chem 1982, 183, 2527–2535. [Google Scholar]
- (41).Kao S; Asanov AN; Oldham PB Instrum. Sci. Technol 1998, 26, 375–387. [Google Scholar]
- (42).Ogston AG Trans. Faraday Soc 1958, 54, 1754–1757. [Google Scholar]
- (43).Sellen DB J. Polym. Sci., Part B: Polym. Phys 1987, 25, 699–716. [Google Scholar]
- (44).Williams JC; Mark LA; Eichholtz S Biophys. J 1998, 75, 493–502. [DOI] [PMC free article] [PubMed] [Google Scholar]
- (45).Holmes DL; Stellwagen NC Electrophoresis 1991, 12, 612–619. [DOI] [PubMed] [Google Scholar]
- (46).Park H; Johnson CS; Gabriel DA Macromolecules 1990, 23, 1548–1553. [Google Scholar]
- (47).Baselga J; Hernández-Fuentes I; Masegosa RM; Llorente MA Polym. J 1989, 21, 467–474. [Google Scholar]
- (48).Sweet RM; Wright HT; Janin J; Chothia CH; Blow DM Biochemistry 1974, 13, 4212–4228. [DOI] [PubMed] [Google Scholar]
- (49).Moparthi SB; Thieulin-Pardo G; Mansuelle P; Rigneault H; Gontero B; Wenger J FEBS J. 2014, 281, 3206–3217. [DOI] [PubMed] [Google Scholar]
- (50).Morris C. J. o R.; Morris P Biochem. J 1971, 124, 517–528. [DOI] [PMC free article] [PubMed] [Google Scholar]
- (51).Moparthi SB; Thieulin-Pardo G; Mansuelle P; Rigneault H; Gontero B; Wenger J FEBS J. 2014, 281, 3206–3217. [DOI] [PubMed] [Google Scholar]
- (52).Varshosaz J; Falamarzian M Eur. J. Pharm. Biopharm 2001, 51, 235–240. [DOI] [PubMed] [Google Scholar]
- (53).Lee SC; Acharya G; Lee J; Park K Macromolecules 2003, 36, 2248–2255. [Google Scholar]
- (54).Gil ES; Hudson SM Prog. Polym. Sci 2004, 29, 1173–1222. [Google Scholar]
- (55).Dormán G; Nakamura H; Pulsipher A; Prestwich GD Chem. Rev 2016, 116, 15284–15398. [DOI] [PubMed] [Google Scholar]
- (56).Armstrong JK; Wenby RB; Meiselman HJ; Fisher TC Biophys. J 2004, 87, 4259–4270. [DOI] [PMC free article] [PubMed] [Google Scholar]
- (57).Tentori AM; Yamauchi KA; Herr AE Angew. Chem., Int. Ed 2016, 55, 12431–12435. [DOI] [PMC free article] [PubMed] [Google Scholar]
- (58).Hou C; Herr AE Anal. Chem 2010, 82, 3343–3351. [DOI] [PubMed] [Google Scholar]
- (59).Liu L; Li P; Asher SA J. Am. Chem. Soc 1999, 121, 4040–4046. [Google Scholar]
- (60).Smith RM, Pawliszyn J, Ed., RSC Chromatography Monographs; Royal Society of Chemistry: Cambridge, 1999. [Google Scholar]
Associated Data
This section collects any data citations, data availability statements, or supplementary materials included in this article.