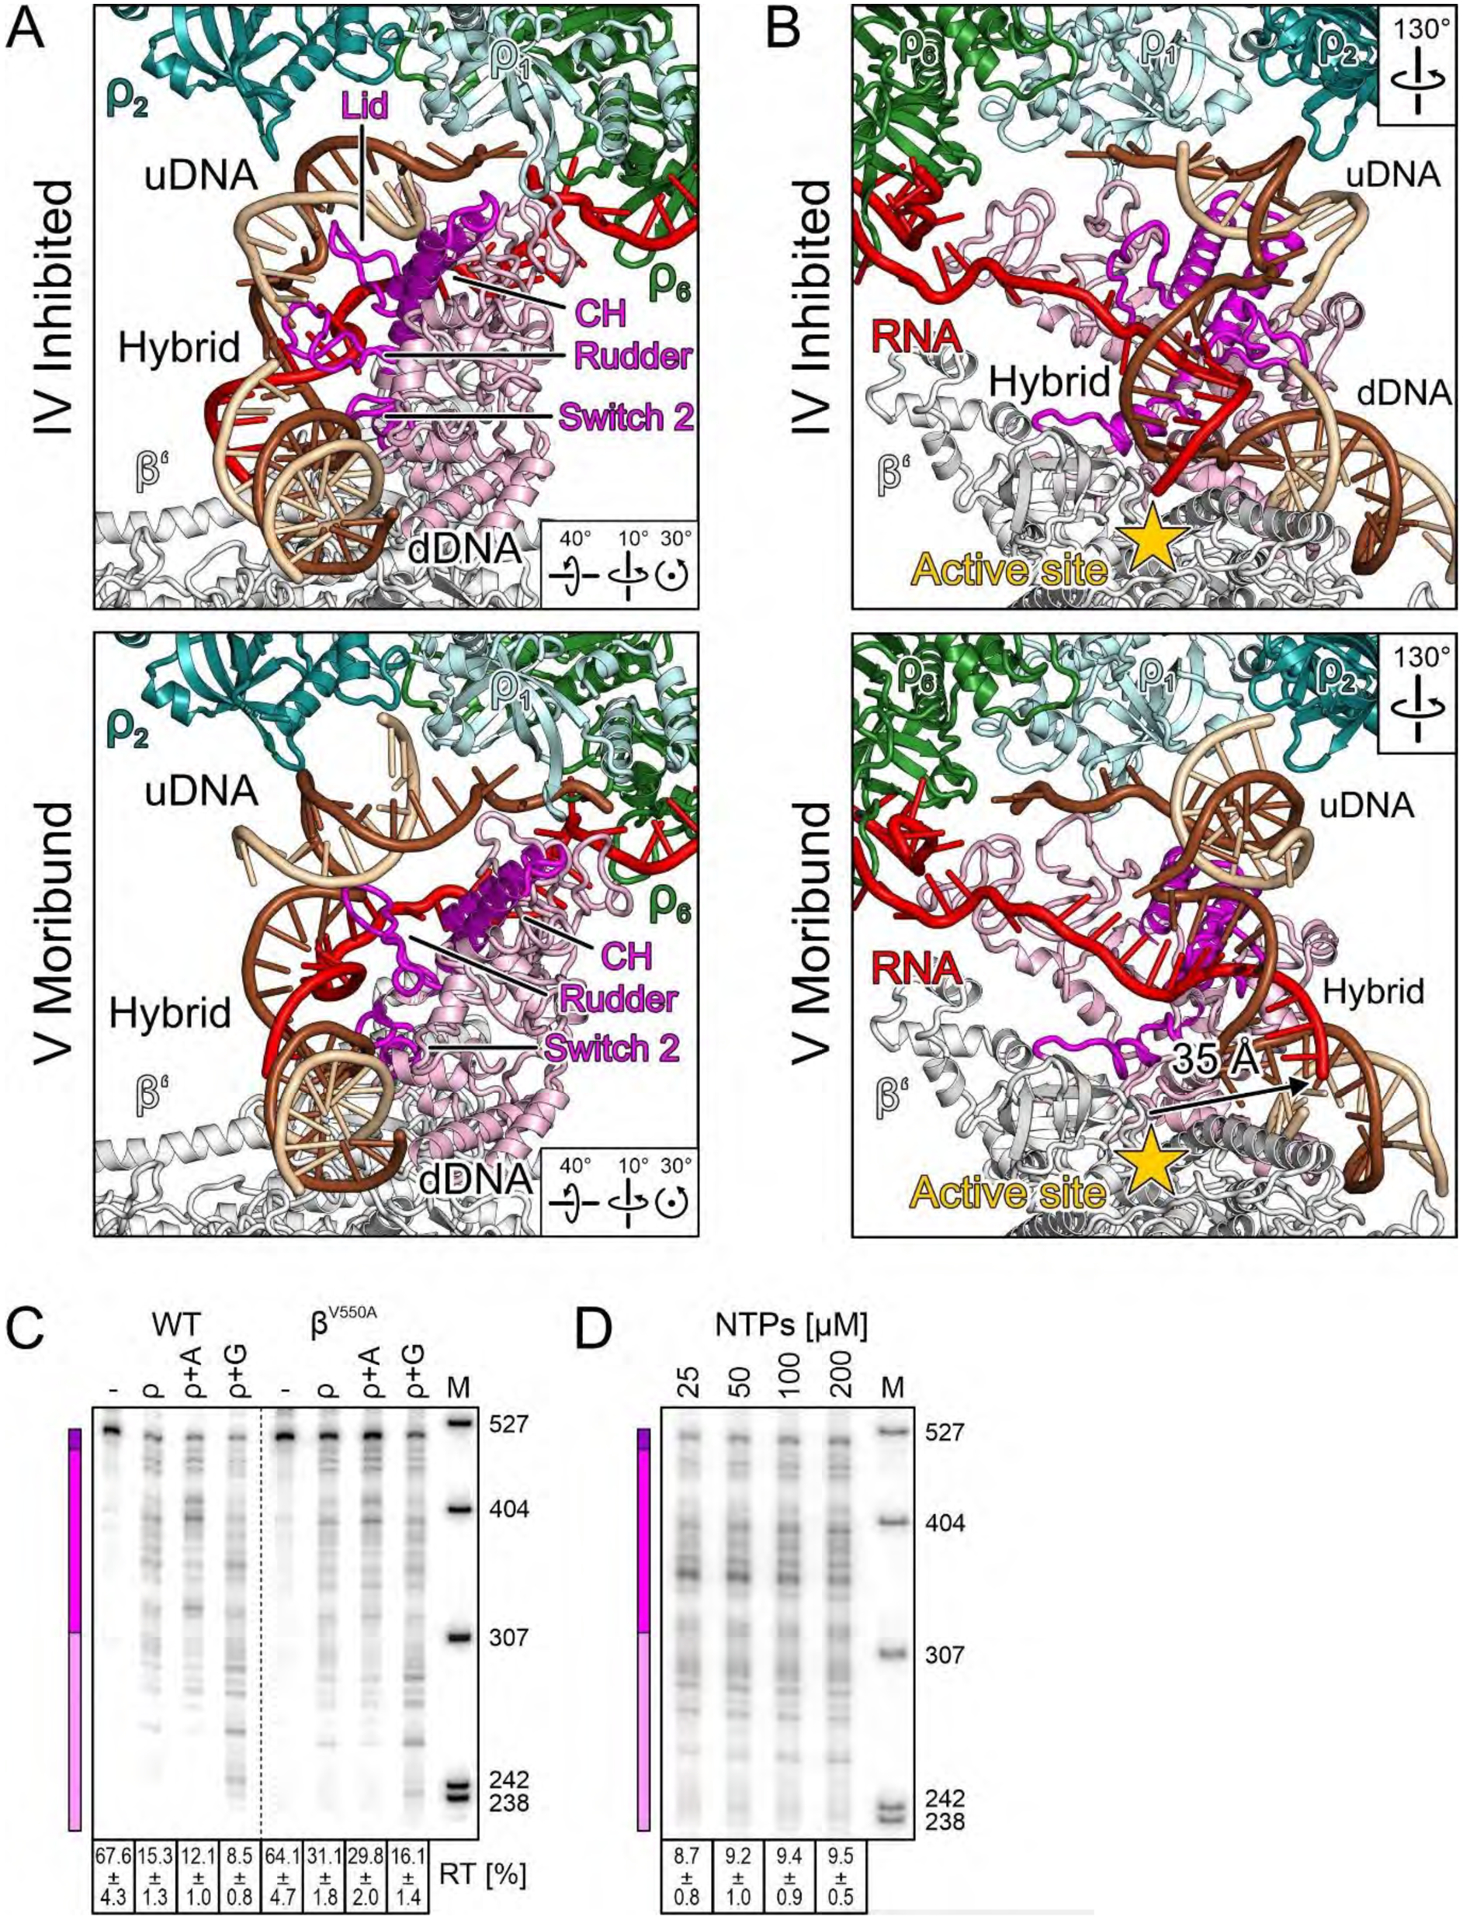
Fig. 7. Inactivation.

(A,B) Side-by-side comparison of selected elements in the inhibited complex (top) and in the moribund complex (bottom), highlighting movement of the β’ clamp helices (CH, magenta) and nucleic acid-guiding loops (lid/rudder/switch 2, magenta) (A), as well as repositioning of the hybrid and displacement of the RNA 3’-end from the active site (arrow) (B). (C) Pause-resistant βV550A substitution decreases ρ termination. Reactions were run on the same gel, and a dashed line indicates the splice position. (D) Effects of NTP concentration at λ tR1.
