Supplemental digital content is available in the text.
Key Words: aging, MDME, myelin, quantitative synthetic MRI, relaxometry, volumetry
Abstract
Objectives
Quantitative synthetic magnetic resonance imaging (MRI) enables the determination of fundamental tissue properties, namely, T1 and T2 relaxation times and proton density (PD), in a single scan. Myelin estimation and brain segmentation based on these quantitative values can also be performed automatically. This study aimed to reveal the changes in tissue characteristics and volumes of the brain according to age and provide age-specific reference values obtained by quantitative synthetic MRI.
Materials and Methods
This was a prospective study of healthy subjects with no history of brain diseases scanned with a multidynamic multiecho sequence for simultaneous measurement of relaxometry of T1, T2, and PD. We performed myelin estimation and brain volumetry based on these values. We performed volume-of-interest analysis on both gray matter (GM) and white matter (WM) regions for T1, T2, PD, and myelin volume fraction maps. Tissue volumes were calculated in the whole brain, producing brain parenchymal volume, GM volume, WM volume, and myelin volume. These volumes were normalized by intracranial volume to a brain parenchymal fraction, GM fraction, WM fraction, and myelin fraction (MyF). We examined the changes in the mean regional quantitative values and segmented tissue volumes according to age.
Results
We analyzed data of 114 adults (53 men and 61 women; median age, 66.5 years; range, 21–86 years). T1, T2, and PD values showed quadratic changes according to age and stayed stable or decreased until around 60 years of age and increased thereafter. Myelin volume fraction showed a reversed trend. Brain parenchymal fraction and GM fraction decreased throughout all ages. The approximation curves showed that WM fraction and MyF gradually increased until around the 40s to 50s and decreased thereafter. A significant decline in MyF was first noted in the 60s age group (Tukey test, P < 0.001).
Conclusions
Our study showed changes according to age in tissue characteristic values and brain volumes using quantitative synthetic MRI. The reference values for age demonstrated in this study may be useful to discriminate brain disorders from healthy brains.
Quantitative magnetic resonance imaging (MRI) has revealed changes in brain tissue characteristics according to age.1–13 Establishing normative reference values according to age is essential for discriminating disease from normal aging.14 The signal intensity of conventional magnetic resonance (MR) images, such as T1- and T2-weighted images, is dependent on variations in acquisition parameters and scanners. Hence, the evaluation of such images is mainly performed by comparing with surrounding tissues.15 Quantitative MRI can mitigate differences due to scanner differences and imperfections, as opposed to conventional MRI.15,16 One method is simultaneous tissue relaxometry for quantifying T1 and T2 relaxation times (or their inverses, R1 and R2) and proton density (PD) with inherent alignment.17 Recent studies of simultaneous relaxometry showed the changes in T1 and T2 values according to age using MR fingerprinting18 in adults and quantitative synthetic MRI in children.1 Quantitative synthetic MRI is typically performed through a commercial 2-dimensional (2D) multidynamic multiecho (MDME) sequence, providing simultaneous quantification of T1, T2, and PD, with a scan time of about 5 to 6 minutes for full head coverage.16 Quantitative synthetic MRI has enabled objective evaluation of diseases such as Alzheimer disease,19 multiple sclerosis,20–22 brain infarction,23 brain tumor,24,25 and Sturge-Weber syndrome.26 Using dedicated software, we can also automatically obtain brain parenchymal volume (BPV), white matter volume (WMV), and gray matter volume (GMV), based on these quantitative values.27 Furthermore, voxel-wise myelin volume fraction (MVF) and myelin volume (MyV) in the whole brain can also be estimated from the same relaxometry values based on a 4-compartment model.28 Myelin volume fraction derived from quantitative synthetic MRI has been validated by postmortem imaging29,30 and comparison with other myelin imaging techniques.22,31
Quantifying the degree of brain atrophy is especially crucial in evaluating neurodegenerative disorders, such as Alzheimer disease,14,32 vascular dementia,33 and multiple sclerosis.34 Although quantification of BPV may be useful for management and early diagnosis of these diseases, it can be challenging to determine whether the brain atrophy is caused by normal aging or pathological processes. Previous studies have shown age-related decreases in BPV,35 GMV,36–38 and WMV.39,40 For brain volumetry, postprocessing software, such as FreeSurfer, FMRIB Software Library (FSL), and Statistical Parametric Mapping, has been used. These methods require relatively longer postprocessing times (from 10 minutes to a few hours),21 hindering clinical use in a timely manner. On the other hand, quantitative synthetic MRI is already approved by the Food and Drug Administration and can perform tissue volumetry based on tissue relaxation times by dedicated software with a postprocessing time of less than 1 minute, which is feasible in clinical practice.16 Previous studies have shown that the volumetric measurements, including BPV, GMV, WMV, and intracranial volume (ICV), performed on 2D quantitative synthetic MRI agreed with those on other volumetric software, such as FreeSurfer, FSL, and Statistical Parametric Mapping, using 3D T1-weighted images.21,41
Relaxometry, PD measurement, volumetry, and myelin measurements performed with quantitative synthetic MRI have been reported to be highly repeatable and reproducible across scanners from different vendors,15,42 and age-related changes in these values have been demonstrated in children.1–3 However, to our knowledge, there has been no study discussing the age-related changes in T1, T2, and PD, and GMV, WMV, and MyV obtained by quantitative synthetic MRI in adults. Integrating relaxometry and tissue volumetry, we can estimate age-related changes in the human brain in a multidimensional manner. Further, reference values for age are prerequisites to discriminate abnormal from normal in an individual brain. Therefore, this study aimed to describe the changes in regional relaxometry and brain tissue volumes as well as MyV according to age and to provide reference values obtained by an MDME sequence according to age.
MATERIALS AND METHODS
Subjects
A total of 134 subjects 20 years or older with no history of brain disorders were enrolled in this study, and written informed consent was obtained from all subjects. Subjects 65 years or older were recruited as part of the Bunkyo Health Study lasting over 10 years that included 1629 older people aimed at the prevention of disease requiring long-term care.43 Subjects recruited from April 2017 until September 2018 in the Bunkyo Health Study were included in the current study. We classified white matter (WM) hyperintensity on fluid-attenuated inversion recovery (FLAIR) imaging using the Fazekas scale44 and excluded subjects with a scale score of 3 or higher. We also excluded subjects with old hemorrhage, microbleeds, infarcts, and/or intracranial mass lesions detected on T2*-weighted images and FLAIR images.
MR Acquisition and Quantitative Maps
All subjects were scanned using an MDME sequence on a 3 T scanner (MAGNETOM Prisma, Siemens Healthcare, Erlangen, Germany) with a 64-channel head coil. This sequence is a multislice, multisaturation deslay, multiecho, fast spin-echo sequence, using combinations of 2 echo times (TEs) and 4 delay times to produce 8 complex images per slice.17 The TEs were 22 and 99 milliseconds, and the delay times were 170, 620, 1970, and 4220 milliseconds. The repetition time (TR) was 4250 milliseconds. The other parameters used for MDME were as follows: field of view, 230 × 186 mm; matrix, 320 × 260; echo-train length, 10; bandwidth, 150 Hz/pixel; parallel imaging acceleration factor, 2; slice thickness/gap, 4.0/1.0 mm; 30 sections; and acquisition time, 5 minutes 8 seconds. The postprocessing was performed using SyMRI software (version 8.04; SyntheticMR AB, Linköping, Sweden) to retrieve T1, T2, and PD maps. The PD values are reported as percentage unit (pu), where the PD of pure water at 37°C corresponds to 100 pu.17 The details of the postprocessing are described elsewhere.17 We created T1-weighted and FLAIR images with postprocessing TR of 500 milliseconds and TE of 10 milliseconds, as well as TR of 15,000 milliseconds, TE of 100 milliseconds, and inversion time of 3000 milliseconds, respectively, based on T1, T2, and PD maps on SyMRI software (SyntheticMR AB). The patients were also scanned using T2*-weighted gradient-echo imaging. The scan parameters were as follows: TR, 500 milliseconds; TE, 12 milliseconds; flip angle, 20°; field of view, 230 × 201.3 mm; matrix, 320 × 176; echo-train length, 1; bandwidth, 230 Hz/pixel; parallel imaging acceleration factor, 3; slice thickness/gap, 5/1 mm; sections, 22; and acquisition time, 48 seconds.
Myelin volume fraction in each voxel was automatically calculated by using SyMRI software (SyntheticMR AB). The model of myelin calculation was based on the 4-compartment model in the brain: myelin, cellular, free water, and excess parenchymal water volume fractions.21 The R1, R2, and PD values of free water and excess parenchymal water volume fractions were fixed to those of cerebrospinal fluid (CSF) (R1, 0.24 s−1; R2, 0.87 s−1; PD, 100%).17 The R2 of MVF was fixed to the literature value of 77 s−1.45 Optimization of other model parameters was performed by simulation of running Bloch equations for observable R1, R2, and PD properties in a spatially normalized and averaged brain from a group of healthy subjects. In this model, the magnetization exchange rates between partial volume compartments are also considered. A lookup grid was made in R1-R2-PD space for all possible distributions (ranging from 0% to 100%) of the 4 volume fractions. The measured R1, R2, and PD values were projected onto the lookup grid for estimating the MVF in each voxel.
Volume of Interest Analysis
T1, T2, PD, and MVF maps were evaluated by volume of interest (VOI) analysis. We created 8 gray matter (GM) (frontal, parietal, temporal and occipital GM, insula, caudate, putamen, and thalamus) and 8 WM (frontal, parietal, temporal and occipital WM, genu and splenium of the corpus callosum, internal capsules, and middle cerebellar peduncles) VOIs in the Montreal Neurological Institute space as described previously.42 Other than splenium of the corpus callosum, we combined the right and left components, because the right-left difference has been reported to be minimal for relaxometry.46 We warped VOIs created in the Montreal Neurological Institute space to the space of each volunteer using FSL v 5.0.11 (http://fsl.fmrib.ox.ac.uk/fsl/fslwiki/FSL) linear and nonlinear image registration tools (FLIRT and FNIRT), based on the synthetic T1-weighted images. No smoothing was used. The GM and WM masks were generated from the synthetic T1-weighted images using FMRIB's Automated Segmentation Tool. These masks were then thresholded at 0.9 and used on the T1, T2, PD, and MVF maps to compute average values within the GM and WM. In other words, VOI analysis of GM and WM structures was performed only on voxels for which equal to or more than 90% of their volumes are GM and WM, respectively. Figure 1 shows an example of VOI measurements.
FIGURE 1.
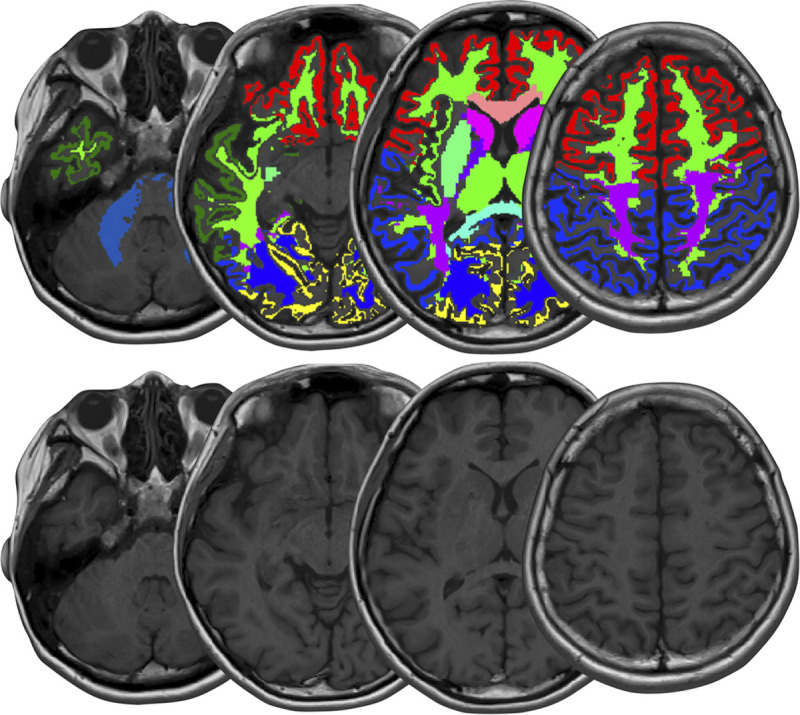
An example of VOI analysis. The upper and lower rows show T1-weighed images with and without, respectively, VOI overlay.
Brain Tissue Volume and MyV Calculation
Based on the acquired T1, T2 and PD, we also calculated GM/WM/CSF volume in the whole brain on the SyMRI software (SyntheticMR AB). The measured quantitative values of brain tissues were used as coordinates in the T1-T2-PD space. Based on the quantitative values for WM, GM, and CSF measured by SyMRI (SyntheticMR AB) for healthy controls, each brain tissue was defined and a numerical Bloch simulation was performed to investigate T1, T2, and PD for tissue mixtures and their partial volumes. Technical details are described elsewhere.27 Voxels not classified as GM, WM, or CSF were called non-WM/GM/CSF (NoN). Total volumes of GM, WM, CSF, and NoN were summed up for each voxel in the intracranial tissue. The BPV was calculated as the sum of WM, GM, and NoN. Myelin volume fraction in each voxel was also summed up in the whole brain to represent the MyV. The border of the ICV was defined exactly at a PD of 50%, assuming that the edge of the ICV corresponds to the interface between CSF (PD = 100%) and bone (PD = 0%).47 The ICV is automatically cut at the base of the skull.48 The ICV corresponds to the sum of BPV and CSF. Acquired volumes were normalized by ICV, and we obtained the brain parenchymal fraction (BPF), WM fraction (WMF), GM fraction (GMF), and myelin fraction (MyF). Figure 2 shows representative quantitative and tissue volume maps.
FIGURE 2.
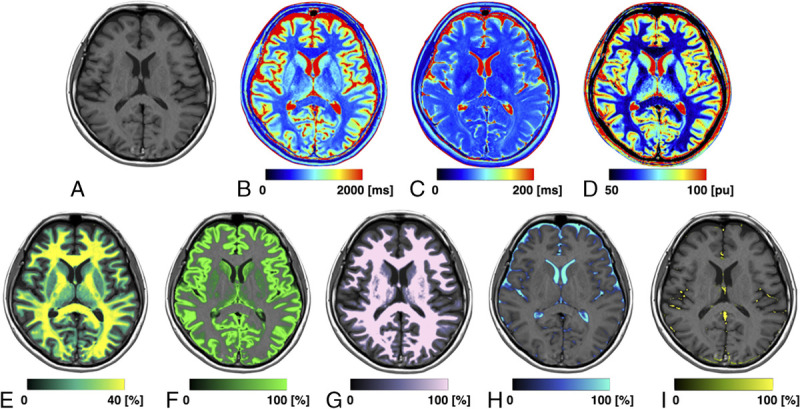
Representative images of a 24-year-old patient. Panels show a synthetic T1-weighted image (A) and maps of T1 (B), T2 (C), PD (D), MVF (E), GM (F), WM (G), CSF (H), and NoN (I). MVF, GM, WM, CSF, and NoN maps are overlaid on a T1-weighted image.
Statistical Analysis
For statistical analysis, the normality of each variable was tested using the Shapiro-Wilk test. We compared the age, quantitative values (T1, T2, PD, and MVF) averaged in each segmented area, tissue volumes, and tissue fractions between men and women using a Mann-Whitney U test or Student t test. To verify the validity of adjusting each volume by ICV, we performed correlation analysis between age and ICV and between ICV and BPV.
To investigate the relationship between age and quantitative values, we conducted regression analyses as a function of age. For tissue volume fraction (BPF, GMF, WMF, MyF), regression analyses were performed as a function of age separated by sex. We selected linear or quadratic approximation by choosing the one that showed the smaller Akaike information criterion (AIC).44 We stratified the subjects into each decade (7 groups: 21–29, 30–39, 40–49, 50–59, 60–69, 70–79, and 80–86 years) and performed 2-way analysis of variance (ANOVA) to test the effect of age and sex on MyF. In case of a significant effect on the ANOVA, a post hoc Tukey test was performed for multiple comparisons. The level of statistical significance was set at P < 0.05. Statistical analyses were performed with Matlab (release R2015b; MathWorks, Natick, MA).
RESULTS
Of the 132 subjects included in this study, those with old hemorrhage, microbleeds, and/or infarctions (n = 17) and with an intracranial mass lesion (n = 1) were excluded. Hence, we excluded 18 subjects in total and the data of 114 subjects were finally analyzed (53 men; median age, 66.5 years; age range, 21–86 years). Each decade group from the 20s to 70s included at least 5 men and 5 women. There were 2 men and 6 women in their 80s.
VOI Analysis
No significant differences were found in T1, T2, PD, and MVF between men and women, except for T1 in the middle cerebellar peduncle (men vs women [mean ± SD], 830 ± 27 vs 816 ± 32 milliseconds; P = 0.01) and PD in the caudate (mean vs women [mean ± SD], 78.8 ± 2.1 vs 79.5 ± 1.6 pu; P = 0.04).
In all segmented areas, the approximate curves of T1, T2, PD, and MVF were the best fitted by quadratic curves (Figs. 3–6). The equations used to plot the T1, T2, PD, and MVF curves are provided, respectively, in Supplemental Digital Content 1 to 4, http://links.lww.com/RLI/A561. The AICs of linear and quadratic approximations for T1, T2, PD, and MVF are shown in Supplemental Digital Content 5, http://links.lww.com/RLI/A561. The coefficient of determination (R2) was higher than 0.1 for all estimations, except for PD in the insula, middle cerebellar peduncle, and thalamus and MVF in the occipital GM, the middle cerebellar peduncle, putamen, and the thalamus. Overall, T1 and T2 were stable until around the 60s and increased thereafter. Proton density was stable in almost all areas until around the 60s, except for GM, which showed a variable degree of decrease, with frontal GM showing the highest rate of decrease. Overall, PD showed an increase after the 60s. Myelin volume fraction showed the opposite tendency to PD. For T1, T2, PD, and MVF, the middle cerebellar peduncle showed smaller changes compared with supratentorial regions. The occipital GM and WM showed slower demyelination in the senescence period compared with the frontal, parietal, and temporal GM and WM, respectively, with the frontal GM and temporal WM showing the fastest demyelination among these GM and WM structures, respectively, as indicated by Figure 6 and the first coefficients of MVF for age2 (the first coefficients of MVF: frontal GM, −0.0031; parietal GM, −0.0020; temporal GM, −0.0015; occipital GM, −0.00048; frontal WM, −0.0032; parietal WM, −0.0023; temporal WM, −0.0035; occipital WM, −0.0022) shown in Supplemental Digital Content 4, http://links.lww.com/RLI/A561.
FIGURE 3.
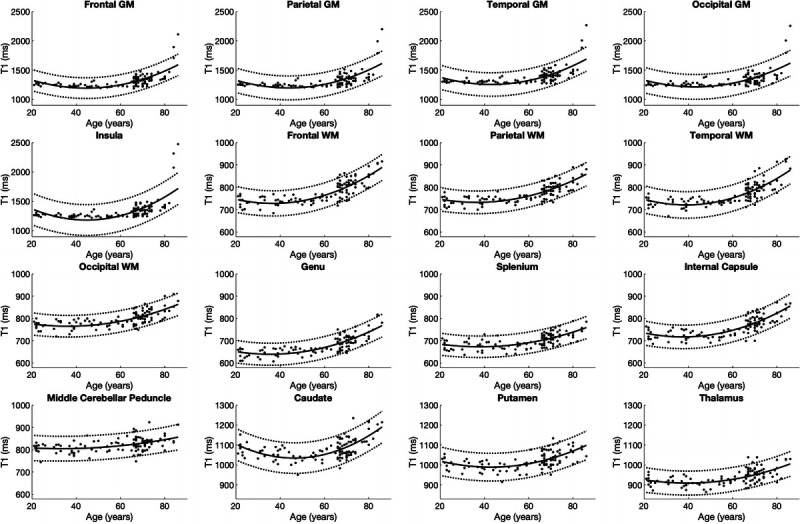
Scatterplots and approximate curves of T1 values in relation to age for each region. A regression line is shown with 95% confidence intervals (dotted lines).
FIGURE 6.
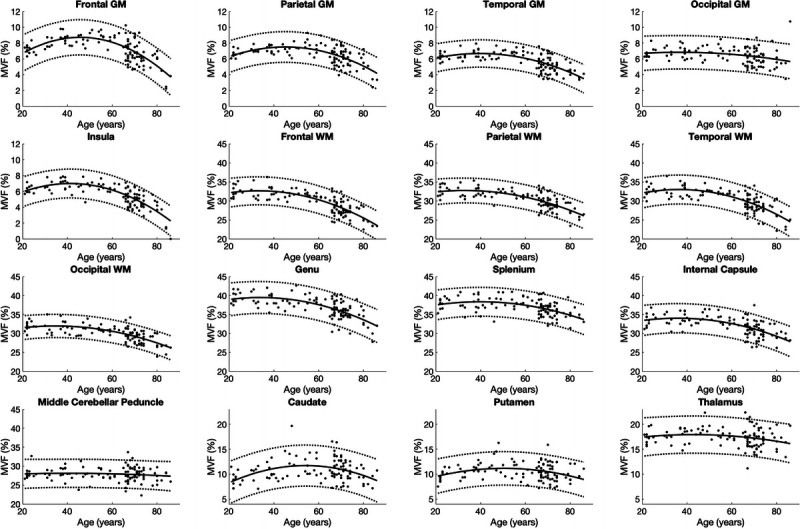
Scatterplots and approximate curves of MVF in relation to age for each region. A regression line is shown with 95% confidence intervals (dotted lines).
FIGURE 4.
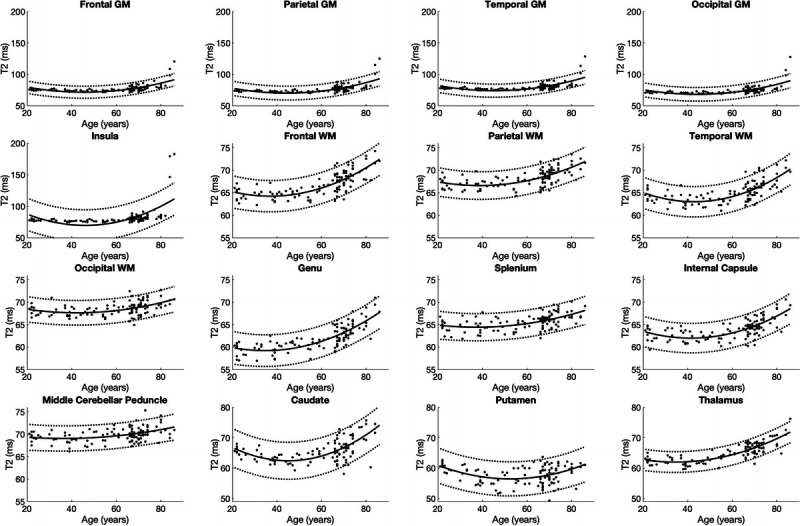
Scatterplots and approximate curves of T2 values in relation to age for each region. A regression line is shown with 95% confidence intervals (dotted lines).
FIGURE 5.
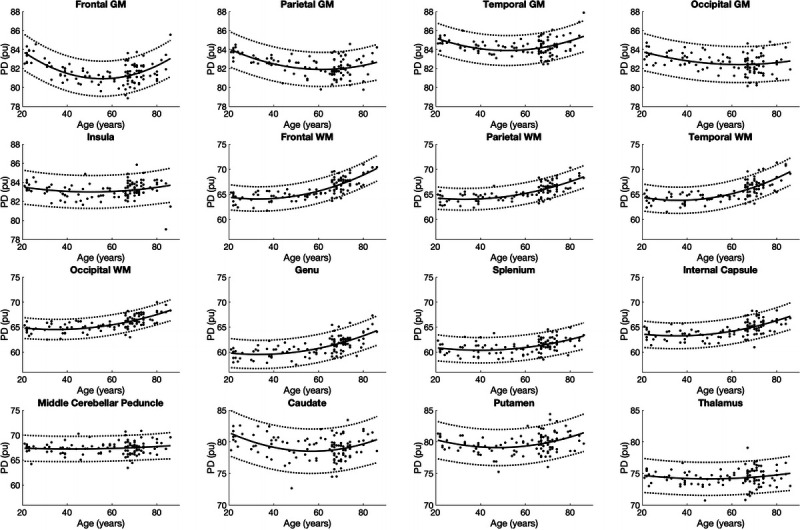
Scatterplots and approximate curves of PD in relation to age for each region. A regression line is shown with 95% confidence intervals (dotted lines).
Tissue Volumes and Volume Fractions
There was no significant correlation between ICV and age (Spearman correlation coefficient [95% confidence interval], −0.11 [−0.30 to 0.08]; P = 0.26), and there was a significant strong correlation between ICV and BPV (Pearson correlation coefficient [95% confidence interval], 0.82 [0.74–0.88]; P < 0.001) (Supplemental Digital Content 6, http://links.lww.com/RLI/A561). Hence, it was considered to be appropriate to normalize each tissue volume by ICV to evaluate the effect of aging on tissue volumes.
Mean tissue volumes and volume fractions are shown in Table 1. We found significantly larger brain tissue volumes in men than women. After normalization by ICV however, BPF, GMF, and WMF were significantly smaller in men than in women, whereas there was no significant difference in MyF between men and women (P = 0.36).
TABLE 1.
The ICV, BPV, GMV, WMV, and MyV of Men and Women
| Men (n = 53) | Women (n = 61) | P | |
|---|---|---|---|
| Age, median (range), y | 67 (22–86) | 66 (21–84) | 0.88 |
| Raw volume, mean ± SD, mL | |||
| ICV | 1530 ± 115 | 1350 ± 91 | <0.001 |
| BPV | 1260 ± 120 | 1150 ± 91 | <0.001 |
| GMV | 715 ± 69 | 650 ± 53 | <0.001 |
| WMV | 523 ± 62 | 477 ± 52 | <0.001 |
| MyV | 173 ± 24 | 154 ± 20 | <0.001 |
| Volume normalized by ICV, mean ± SD, % | |||
| BPF | 82.5 ± 5.1 | 84.9 ± 4.3 | 0.008 |
| GMF | 46.8 ± 3.5 | 48.2 ± 2.9 | 0.02 |
| WMF | 34.2 ± 2.8 | 35.3 ± 3.1 | 0.048 |
| MyF | 11.2 ± 1.2 | 11.4 ± 1.2 | 0.36 |
P values are for comparisons between men and women. All comparisons are performed with Student t test, except for age, which is analyzed using the Mann-Whitney U test. P < 0.05 is considered statistically significant.
Abbreviations: ICV, intracranial volume; BPV, brain parenchymal volume; GMV, gray matter volume; WMV, white matter volume; MyV, myelin volume; BPF, brain parenchymal fraction; GMF, gray matter fraction; WMF, white matter fraction; MyF, myelin fraction.
The changes in BPF, GMF, WMF, and MyF in relation to age are shown in Figure 7. The equations used to plot the curves are shown in Supplemental Digital Content 7, http://links.lww.com/RLI/A561. All of these metrics were best approximated by quadratic curves. The AICs of linear and quadratic approximations for BPF, GMF, WMF, and MyF are shown in Supplemental Digital Content 8, http://links.lww.com/RLI/A561. Brain parenchymal fraction monotonously decreased through all ages, and it decreased slightly faster after around the 50s. Gray matter fraction decreased until around the 60s and became stable. White matter fraction and MyF seemed to increase gradually until the 40s, and they were on the decline thereafter.
FIGURE 7.
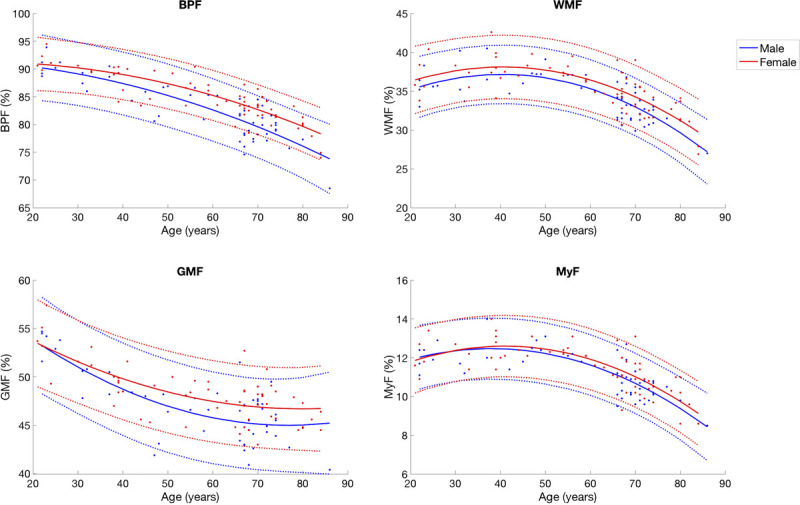
Scatterplots of BPF, GMF, WMF, and MyF in relation to age. Regression lines are shown with 95% confidence intervals (dotted lines).
A 2-way ANOVA for age and sex factors with MyF as dependent variables showed a significant effect of age group on MyF (P < 0.001), but the effects of sex and interaction between age and sex were not significant (P = 0.28 and 0.97, respectively). Tukey multiple comparison test for MyF did not show significant differences among younger groups (equal to and under the 50s), whereas it showed a significant difference between the younger groups and the older groups (60s and over) and among older groups except between 60s and 70s (Fig. 8). In other words, the earliest decade of life where a significant decrease in MyF was found was in the 60s age group (P < 0.001 compared with the 50s age group).
FIGURE 8.
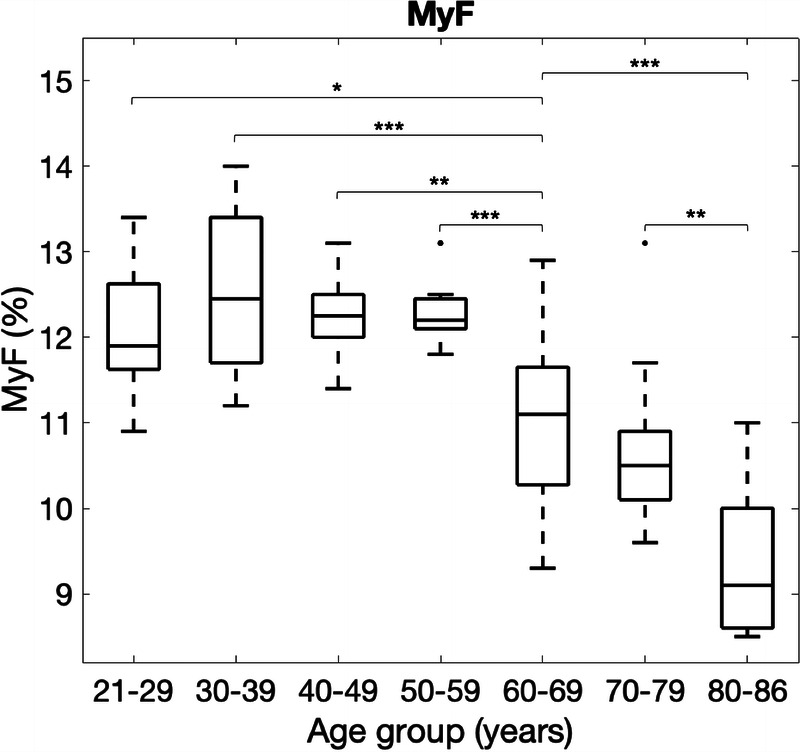
Boxplots of MyF stratified by decade-long age groups. A significant difference revealed by Tukey multiple comparisons is shown as a bracket. Comparisons between the 50s or younger and 70s or 80s, which also show significant differences, are omitted for visual clarity. *P < 0.05, **P < 0.01, ***P < 0.001.
DISCUSSION
We performed quantitative synthetic MRI on healthy adults aged 21 to 86 years and examined the change in T1, T2, PD, and MVF values and tissue volumes associated with aging. Regional T1, T2, and PD values showed similar patterns of change with aging, except for the middle cerebellar peduncle that showed smaller changes compared with supratentorial regions. Overall, T1, T2, and PD values were stable or slightly decreased until the 60s and increased thereafter, whereas MVF showed a reversed trend. Various microstructural changes have been shown to affect T1 and T2 values. Some reports indicated that changes in T1 and T2 values result from the change in water content,49 myelin,50 and iron.51 In the normal aging process until about 50, myelination has been suggested to continue, which is followed by demyelination.52 During continuing myelination in children, myelin increase and water decrease contribute to the decrease in T1 and T2 values.53 Our results for adults until the 60s were partially congruent with this observation, with MVF in some regions, mainly GM, increasing along with a decrease in PD. The effect of sex on relaxometry was minimal in this study, in line with a previous study performed by MR fingerprinting.18
In our study, the T1, T2, and PD of GM started to increase from the 60s, and T1 showed a remarkable increase after 80 years, possibly because of an increase in water content. Stable T1 and T2 values from the 20s until 60s in both GM and WM and increases from 60s are in line with previous studies,6,13,18,46 except for reports by Gracien et al54 and Okubo et al.55 Gracien et al showed a decrease in the T1 value of the cortical GM after the 60s over 7 years in 17 healthy subjects (51–77 years) and concluded that this observation was due to decreasing water and iron accumulation. This discrepancy may lie in the difference in methods used for relaxometry (quantitative synthetic MRI vs variable flip angle). Okubo et al55 used 3D T1 map created by magnetization-prepared 2 rapid acquisition gradient echoes sequence to investigate the effect of aging on T1 values. Even though wide areas showed increases in T1 related to aging on voxel-based analysis, some structures (ie, inferior putamen, nucleus accumbens, and amygdala) showed decreases. The narrower age range in their study (ie, 20–76) than ours (ie, 21–86), usage of only linear regression in their study, and differences in sequences and analysis methods may have resulted in the discrepancy between the results of their and our studies. Notably, discrepancy in the T1 values obtained with different methods are discussed in previous literatures.15,56 For example, Stikov et al56 compared inversion recovery, Look-Locker, and variable flip angle techniques and reported that deviations from inversion recovery reached over 30% in the WM, from 750 milliseconds in the Look-Locker technique (underestimation) to 1070 milliseconds in the variable flip angle technique (overestimation). Even though we mitigated partial volume effects by thresholding the partial GM volume maps, the quantitative values could have been affected by partial volume effects because the cortex in elderly people is thinner than in younger people.57 Because the tissue properties of the cortical GM are more different from the CSF than the WM, the partial volume effects, if any, would affect the quantitative values of the cortical GM by deviating them slightly near to those of the CSF (ie, leading to increases in T1, T2, and PD and a decrease in MVF). Likewise, enlarged perivascular spaces, which progress with aging,58 may also have affected the quantitative values of subcortical GM and WM. Novel 3D quantitative synthetic MRI, which is still a research sequence but mitigates the partial volume effect, is desired to be used to further investigate the age-related changes in the quantitative values in the cortical GM.59–61 Meanwhile, T1 value in the cortical GM has been reported to be stable in other studies, possibly because of the much smaller sample size of subjects over 60 compared with the younger population.46,62,63
Age-related myelin changes in adults have been investigated by myelin water imaging10,11 and magnetization transfer imaging.12,13,52 The quadratic inverted U-shape trend shown in our study, with stable or increasing myelin metrics until around the 60s and the following decease, was also shown in these studies, except for the linear decrease reported by Cercignani et al,12 who included the fewest number of participants among these studies. In line with the observation by myelin water imaging,10 the occipital lobes showed delayed demyelination compared with other lobes in the senescence period. This regional demyelination pattern agrees with the retrogenesis hypothesis (first-in-last-out), in which the posterior brain is spared from degeneration for healthy subjects in the senescence period and patients with Alzheimer disease compared with the late-myelinated anterior brain.64–66
Upon investigation of age-related changes in tissue volumes, we revealed that the original brain tissue volumes, namely, BPV, GMV, WMV, and MyV, were larger in men than in women; however, after normalization, these tissue volumes, except for MyF, were significantly larger in women than in men. Previous studies have shown that the brains of men are larger than those of women, while BPV is dependent on skull size.7,67–69 In our study, BPV had a strong correlation with ICV, and ICV had no significant change upon aging, in line with the results of previous studies.7,70,71 These results justified the appropriateness of normalization of tissue volumes using ICV. Previous studies investigating sex differences in GMF and WMF were only partially congruent with our results,72,73 possibly owing to the small effect size of sex on normalized volumes.
We demonstrated that the inverted U-shaped quadratic curve was better fitted to BPF than a line as a function of age, with a constant decrease in BPF accelerating throughout adulthood. There is general agreement that BPF constantly declines in adulthood upon aging,40,41,67 and some of them also fitted quadratic curves to BPF in relation to aging.41,67 Contrary to BPF, the rate of decrease in GMF was decelerated through adulthood and GMF became stable after around the 60s. This deceleration pattern is in line with previous studies,7,46 although other studies reported a linear decrease in GMF.36,73 Notably, a decrease in GMF and BPF was observed to begin even at a younger age around the 10s, after an increase during the developmental period.2
Similar quadratic inversed U-shapes are shown by WMF and MyF, with peaks at around the 40s to 50s. The Tukey multiple comparison test also supported this result for MyF, demonstrating the 60s age group to be the earliest decade of life showing a significant decrease in MyF. Previous studies have also reported an increase in WMF until around the 40s7,36,37,72–74 and a decline after the 40s.36,72–75 This gradual increase in WMF has been suggested to reflect myelination continuing until midlife shown by histology of human brains.76 To our knowledge, our report is the first to show MyF changes with aging in adults.
Even though we focused only on quantitative values in this study, we can also create synthetic images with any contrast-weighing based on quantitative synthetic MRI,16 as opposed to acquiring contrast-weighted images separately.77 Regarding future perspectives, comparison of quantitative synthetic MRI with other sequences sensitive to cortical lesion detection would be interesting.78,79 Further, multiparametric quantitative information acquired with quantitative synthetic MRI may improve the prediction of contrast enhancement and the quality of automatic lesion segmentation, as were previously performed by using contrast-weighted images.80,81
There were some limitations to our study. First, we did not consider the clinical background of the subjects, including race, hypertension, smoking, and drinking. However, the effect of these factors on T1 and T2 values in the brain have been reported to be minimal.82 A future study is warranted to investigate the age-related changes in the brain using quantitative synthetic MRI considering the effects of these factors. The second limitation was the cross-sectional design of this study. A longitudinal design may enable us to avoid biases related to the interindividual variability of brain tissues.54 Third, we used quadratic regression models to fit the quantitative values to age. Even though a quadratic regression model is conventional and well represented in the literature, it has been revealed that the choice of age range affects the peak age of the quadratic curve.83 Caution is warranted when comparing the peak ages reported for studies performed on populations with different age ranges. Nonetheless, our results would serve as a reference of quantitative values derived from 2D quantitative synthetic MRI for the age range investigated in the current study (ie, 21–86). Lastly, subjects 65 years or older were recruited differently from the younger subjects. This study design and the larger density of subjects in the 65 to 75 age range compared with the other age ranges may have introduced some biases in the results.
CONCLUSIONS
This study showed age-related changes in quantitative values and brain volumes derived from quantitative synthetic MRI. The results were overall in line with those measured by other methods. Differences may lie in the quantitative technique, analysis method, and age range used in each study. Reference values according to age demonstrated in this study may be useful for discriminating brain disorders from healthy brains using quantitative synthetic MRI.
Supplementary Material
Footnotes
Conflicts of interest and source of funding: We have no conflicts of interest to declare. This work was supported by Japan Agency for Medical Research and Development (AMED) under grant number JP19lk1010025h9902; JSPS KAKENHI grant numbers 19K17150, 19K17177, and 18K07692; Health, Labour, and Welfare Policy Research Grants for Research on Region Medical; a grant-in-aid for Special Research in Subsidies for ordinary expenses of private schools from The Promotion and Mutual Aid Corporation for Private Schools of Japan; and Brain/MINDS program from AMED grant numbers JP19dm0307024 and JP19dm0307101.
Supplemental digital contents are available for this article. Direct URL citations appear in the printed text and are provided in the HTML and PDF versions of this article on the journal’s Web site (www.investigativeradiology.com).
Contributor Information
Akifumi Hagiwara, Email: hagiwara.akifumi.0314@gmail.com;ahagiwara-tky@umin.ac.jp.
Kotaro Fujimoto, Email: material_mage_yks@yahoo.co.jp.
Koji Kamagata, Email: kkamagat@juntendo.ac.jp.
Syo Murata, Email: s-murata@juntendo.ac.jp.
Ryusuke Irie, Email: ririe@juntendo.ac.jp.
Hideyoshi Kaga, Email: hkaga@juntendo.ac.jp.
Yuki Someya, Email: yksomeya@juntendo.ac.jp.
Christina Andica, Email: andicach@gmail.com.
Shohei Fujita, Email: sh-fujita@juntendo.ac.jp.
Shimpei Kato, Email: katousinnpei@gmail.com.
Issei Fukunaga, Email: ifukuna@juntendo.ac.jp.
Akihiko Wada, Email: a-wada@juntendo.ac.jp.
Masaaki Hori, Email: mahori@juntendo.ac.jp.
Yoshifumi Tamura, Email: ys-tamur@juntendo.ac.jp.
Ryuzo Kawamori, Email: kawamori@juntendo.ac.jp.
Hirotaka Watada, Email: hwatada@juntendo.ac.jp.
Shigeki Aoki, Email: saoki@juntendo.ac.jp.
REFERENCES
- 1.Lee SM Choi YH You SK, et al. Age-related changes in tissue value properties in children: simultaneous quantification of relaxation times and proton density using synthetic magnetic resonance imaging. Invest Radiol. 2018;53:236–245. [DOI] [PubMed] [Google Scholar]
- 2.McAllister A Leach J West H, et al. Quantitative synthetic MRI in children: normative intracranial tissue segmentation values during development. AJNR Am J Neuroradiol. 2017;38:2364–2372. [DOI] [PMC free article] [PubMed] [Google Scholar]
- 3.Kim HG Moon WJ Han J, et al. Quantification of myelin in children using multiparametric quantitative MRI: a pilot study. Neuroradiology. 2017;59:1043–1051. [DOI] [PubMed] [Google Scholar]
- 4.Wang J Shaffer ML Eslinger PJ, et al. Maturational and aging effects on human brain apparent transverse relaxation. PLoS One. 2012;7:e31907. [DOI] [PMC free article] [PubMed] [Google Scholar]
- 5.Kumar R Delshad S Macey PM, et al. Development of T2-relaxation values in regional brain sites during adolescence. Magn Reson Imaging. 2011;29:185–193. [DOI] [PMC free article] [PubMed] [Google Scholar]
- 6.Hasan KM Walimuni IS Abid H, et al. Multimodal quantitative magnetic resonance imaging of thalamic development and aging across the human lifespan: implications to neurodegeneration in multiple sclerosis. J Neurosci. 2011;31:16826–16832. [DOI] [PMC free article] [PubMed] [Google Scholar]
- 7.Hasan KM Walimuni IS Kramer LA, et al. Human brain atlas-based volumetry and relaxometry: application to healthy development and natural aging. Magn Reson Med. 2010;64:1382–1389. [DOI] [PubMed] [Google Scholar]
- 8.Siemonsen S Finsterbusch J Matschke J, et al. Age-dependent normal values of T2* and T2' in brain parenchyma. AJNR Am J Neuroradiol. 2008;29:950–955. [DOI] [PMC free article] [PubMed] [Google Scholar]
- 9.Faizy TD Kumar D Broocks G, et al. Age-related measurements of the myelin water fraction derived from 3D multi-echo GRASE reflect myelin content of the cerebral white matter. Sci Rep. 2018;8:14991. [DOI] [PMC free article] [PubMed] [Google Scholar]
- 10.Bouhrara M Rejimon AC Cortina LE, et al. Adult brain aging investigated using BMC-mcDESPOT-based myelin water fraction imaging. Neurobiol Aging. 2020;85:131–139. [DOI] [PMC free article] [PubMed] [Google Scholar]
- 11.Arshad M, Stanley JA, Raz N. Adult age differences in subcortical myelin content are consistent with protracted myelination and unrelated to diffusion tensor imaging indices. Neuroimage. 2016;143:26–39. [DOI] [PMC free article] [PubMed] [Google Scholar]
- 12.Cercignani M Giulietti G Dowell NG, et al. Characterizing axonal myelination within the healthy population: a tract-by-tract mapping of effects of age and gender on the fiber g-ratio. Neurobiol Aging. 2017;49:109–118. [DOI] [PMC free article] [PubMed] [Google Scholar]
- 13.Slater DA Melie-Garcia L Preisig M, et al. Evolution of white matter tract microstructure across the life span. Hum Brain Mapp. 2019;40:2252–2268. [DOI] [PMC free article] [PubMed] [Google Scholar]
- 14.Vinke EJ Huizinga W Bergtholdt M, et al. Normative brain volumetry derived from different reference populations: impact on single-subject diagnostic assessment in dementia. Neurobiol Aging. 2019;84:9–16. [DOI] [PubMed] [Google Scholar]
- 15.Hagiwara A Fujita S Ohno Y, et al. Variability and standardization of quantitative imaging: monoparametric to multiparametric quantification, radiomics, and artificial intelligence [published online ahead of print June 24, 2020]. Invest Radiol. [DOI] [PMC free article] [PubMed] [Google Scholar]
- 16.Hagiwara A Warntjes M Hori M, et al. SyMRI of the brain: rapid quantification of relaxation rates and proton density, with synthetic MRI, automatic brain segmentation, and myelin measurement. Invest Radiol. 2017;52:647–657. [DOI] [PMC free article] [PubMed] [Google Scholar]
- 17.Warntjes JB Leinhard OD West J, et al. Rapid magnetic resonance quantification on the brain: optimization for clinical usage. Magn Reson Med. 2008;60:320–329. [DOI] [PubMed] [Google Scholar]
- 18.Badve C Yu A Rogers M, et al. Simultaneous T 1 and T 2 brain Relaxometry in asymptomatic volunteers using magnetic resonance fingerprinting. Tomography. 2015;1:136–144. [DOI] [PMC free article] [PubMed] [Google Scholar]
- 19.Park M Moon Y Han SH, et al. Myelin loss in white matter hyperintensities and normal-appearing white matter of cognitively impaired patients: a quantitative synthetic magnetic resonance imaging study. Eur Radiol. 2019;29:4914–4921. [DOI] [PubMed] [Google Scholar]
- 20.Hagiwara A Kamagata K Shimoji K, et al. White matter abnormalities in multiple sclerosis evaluated by quantitative synthetic MRI, diffusion tensor imaging, and neurite orientation dispersion and density imaging. AJNR Am J Neuroradiol. 2019;40:1642–1648. [DOI] [PMC free article] [PubMed] [Google Scholar]
- 21.Granberg T Uppman M Hashim F, et al. Clinical feasibility of synthetic MRI in multiple sclerosis: a diagnostic and volumetric validation study. AJNR Am J Neuroradiol. 2016;37:1023–1029. [DOI] [PMC free article] [PubMed] [Google Scholar]
- 22.Saccenti L Hagiwara A Andica C, et al. Myelin measurement using quantitative magnetic resonance imaging: a correlation study comparing various imaging techniques in patients with multiple sclerosis. Cell. 2020;9:393. [DOI] [PMC free article] [PubMed] [Google Scholar]
- 23.Duchaussoy T Budzik JF Norberciak L, et al. Synthetic T2 mapping is correlated with time from stroke onset: a future tool in wake-up stroke management? Eur Radiol. 2019;29:7019–7026. [DOI] [PubMed] [Google Scholar]
- 24.Warntjes M Blystad I Tisell A, et al. Synthesizing a contrast-enhancement map in patients with high-grade gliomas based on a postcontrast MR imaging quantification only. AJNR Am J Neuroradiol. 2018;39:2194–2199. [DOI] [PMC free article] [PubMed] [Google Scholar]
- 25.Kang KM Choi SH Hwang M, et al. Application of synthetic MRI for direct measurement of magnetic resonance relaxation time and tumor volume at multiple time points after contrast administration: preliminary results in patients with brain metastasis. Korean J Radiol. 2018;19:783–791. [DOI] [PMC free article] [PubMed] [Google Scholar]
- 26.Andica C Hagiwara A Hori M, et al. Aberrant myelination in patients with Sturge-Weber syndrome analyzed using synthetic quantitative magnetic resonance imaging. Neuroradiology. 2019;61:1055–1066. [DOI] [PubMed] [Google Scholar]
- 27.West J, Warntjes JB, Lundberg P. Novel whole brain segmentation and volume estimation using quantitative MRI. Eur Radiol. 2012;22:998–1007. [DOI] [PubMed] [Google Scholar]
- 28.Warntjes M Engström M Tisell A, et al. Modeling the presence of myelin and edema in the brain based on multi-parametric quantitative MRI. Front Neurol. 2016;7:16. [DOI] [PMC free article] [PubMed] [Google Scholar]
- 29.Ouellette R Mangeat G Polyak I, et al. Validation of rapid magnetic resonance myelin imaging in multiple sclerosis. Ann Neurol. 2020;87:710–724. [DOI] [PubMed] [Google Scholar]
- 30.Warntjes JBM Persson A Berge J, et al. Myelin detection using rapid quantitative MR imaging correlated to macroscopically registered Luxol fast blue-stained brain specimens. AJNR Am J Neuroradiol. 2017;38:1096–1102. [DOI] [PMC free article] [PubMed] [Google Scholar]
- 31.Hagiwara A Hori M Kamagata K, et al. Myelin measurement: comparison between simultaneous tissue Relaxometry, magnetization transfer saturation index, and T1w/T2w ratio methods. Sci Rep. 2018;8:10554. [DOI] [PMC free article] [PubMed] [Google Scholar]
- 32.Simmons A Westman E Muehlboeck S, et al. MRI measures of Alzheimer's disease and the AddNeuroMed study. Ann N Y Acad Sci. 2009;1180:47–55. [DOI] [PubMed] [Google Scholar]
- 33.Kim GH Lee JH Seo SW, et al. Hippocampal volume and shape in pure subcortical vascular dementia. Neurobiol Aging. 2015;36:485–491. [DOI] [PubMed] [Google Scholar]
- 34.Rovira A, Leon A. MR in the diagnosis and monitoring of multiple sclerosis: an overview. Eur J Radiol. 2008;67:409–414. [DOI] [PubMed] [Google Scholar]
- 35.Fotenos AF Snyder AZ Girton LE, et al. Normative estimates of cross-sectional and longitudinal brain volume decline in aging and AD. Neurology. 2005;64:1032–1039. [DOI] [PubMed] [Google Scholar]
- 36.Taki Y Thyreau B Kinomura S, et al. Correlations among brain gray matter volumes, age, gender, and hemisphere in healthy individuals. PLoS One. 2011;6:e22734. [DOI] [PMC free article] [PubMed] [Google Scholar]
- 37.Abe O Yamasue H Aoki S, et al. Aging in the CNS: comparison of gray/white matter volume and diffusion tensor data. Neurobiol Aging. 2008;29:102–116. [DOI] [PubMed] [Google Scholar]
- 38.Sullivan EV, Pfefferbaum A. Neuroradiological characterization of normal adult ageing. Br J Radiol. 2007;80 Spec No 2:S99–S108. [DOI] [PubMed] [Google Scholar]
- 39.Lemaitre H Crivello F Grassiot B, et al. Age- and sex-related effects on the neuroanatomy of healthy elderly. Neuroimage. 2005;26:900–911. [DOI] [PubMed] [Google Scholar]
- 40.Scahill RI Frost C Jenkins R, et al. A longitudinal study of brain volume changes in normal aging using serial registered magnetic resonance imaging. Arch Neurol. 2003;60:989–994. [DOI] [PubMed] [Google Scholar]
- 41.Vågberg M Ambarki K Lindqvist T, et al. Brain parenchymal fraction in an age-stratified healthy population—determined by MRI using manual segmentation and three automated segmentation methods. J Neuroradiol. 2016;43:384–391. [DOI] [PubMed] [Google Scholar]
- 42.Hagiwara A Hori M Cohen-Adad J, et al. Linearity, bias, intrascanner repeatability, and interscanner reproducibility of quantitative multidynamic multiecho sequence for rapid simultaneous Relaxometry at 3 T: a validation study with a standardized phantom and healthy controls. Invest Radiol. 2019;54:39–47. [DOI] [PubMed] [Google Scholar]
- 43.Someya Y Tamura Y Kaga H, et al. Skeletal muscle function and need for long-term care of urban elderly people in Japan (the Bunkyo health study): a prospective cohort study. BMJ Open. 2019;9:e031584. [DOI] [PMC free article] [PubMed] [Google Scholar]
- 44.Akaike H. A new look at the statistical model identification. IEEE Trans Automat Control. 1974;19:716–723. [Google Scholar]
- 45.Levesque IR, Pike GB. Characterizing healthy and diseased white matter using quantitative magnetization transfer and multicomponent T(2) relaxometry: a unified view via a four-pool model. Magn Reson Med. 2009;62:1487–1496. [DOI] [PubMed] [Google Scholar]
- 46.Saito N Sakai O Ozonoff A, et al. Relaxo-volumetric multispectral quantitative magnetic resonance imaging of the brain over the human lifespan: global and regional aging patterns. Magn Reson Imaging. 2009;27:895–906. [DOI] [PubMed] [Google Scholar]
- 47.Ambarki K Lindqvist T Wahlin A, et al. Evaluation of automatic measurement of the intracranial volume based on quantitative MR imaging. AJNR Am J Neuroradiol. 2012;33:1951–1956. [DOI] [PMC free article] [PubMed] [Google Scholar]
- 48.Warntjes JB Tisell A Landtblom AM, et al. Effects of gadolinium contrast agent administration on automatic brain tissue classification of patients with multiple sclerosis. AJNR Am J Neuroradiol. 2014;35:1330–1336. [DOI] [PMC free article] [PubMed] [Google Scholar]
- 49.Neeb H, Zilles K, Shah NJ. Fully-automated detection of cerebral water content changes: study of age- and gender-related H2O patterns with quantitative MRI. Neuroimage. 2006;29:910–922. [DOI] [PubMed] [Google Scholar]
- 50.Maniega SM Valdes Hernandez MC Clayden JD, et al. White matter hyperintensities and normal-appearing white matter integrity in the aging brain. Neurobiol Aging. 2015;36:909–918. [DOI] [PMC free article] [PubMed] [Google Scholar]
- 51.Stüber C Morawski M Schäfer A, et al. Myelin and iron concentration in the human brain: a quantitative study of MRI contrast. Neuroimage. 2014;93(pt 1):95–106. [DOI] [PubMed] [Google Scholar]
- 52.Wu M, Kumar A, Yang S. Development and aging of superficial white matter myelin from young adulthood to old age: mapping by vertex-based surface statistics (VBSS). Hum Brain Mapp. 2016;37:1759–1769. [DOI] [PMC free article] [PubMed] [Google Scholar]
- 53.Ding XQ Kucinski T Wittkugel O, et al. Normal brain maturation characterized with age-related T2 relaxation times: an attempt to develop a quantitative imaging measure for clinical use. Invest Radiol. 2004;39:740–746. [DOI] [PubMed] [Google Scholar]
- 54.Gracien RM Nurnberger L Hok P, et al. Evaluation of brain ageing: a quantitative longitudinal MRI study over 7 years. Eur Radiol. 2017;27:1568–1576. [DOI] [PubMed] [Google Scholar]
- 55.Okubo G Okada T Yamamoto A, et al. Relationship between aging and T 1 relaxation time in deep gray matter: a voxel-based analysis. J Magn Reson Imaging. 2017;46:724–731. [DOI] [PubMed] [Google Scholar]
- 56.Stikov N Boudreau M Levesque IR, et al. On the accuracy of T1 mapping: searching for common ground. Magn Reson Med. 2015;73:514–522. [DOI] [PubMed] [Google Scholar]
- 57.Hurtz S Woo E Kebets V, et al. Age effects on cortical thickness in cognitively normal elderly individuals. Dement Geriatr Cogn Dis Extra. 2014;4:221–227. [DOI] [PMC free article] [PubMed] [Google Scholar]
- 58.Heier LA Bauer CJ Schwartz L, et al. Large Virchow-Robin spaces: MR-clinical correlation. AJNR Am J Neuroradiol. 1989;10:929–936. [PMC free article] [PubMed] [Google Scholar]
- 59.Fujita S Hagiwara A Hori M, et al. 3D quantitative synthetic MRI-derived cortical thickness and subcortical brain volumes: scan-rescan repeatability and comparison with conventional T1-weighted images. J Magn Reson Imaging. 2019;50:1834–1842. [DOI] [PMC free article] [PubMed] [Google Scholar]
- 60.Fujita S Hagiwara A Hori M, et al. Three-dimensional high-resolution simultaneous quantitative mapping of the whole brain with 3D-QALAS: an accuracy and repeatability study. Magn Reson Imaging. 2019;63:235–243. [DOI] [PubMed] [Google Scholar]
- 61.Fujita S Hagiwara A Otsuka Y, et al. Deep learning approach for generating MRA images from 3D quantitative synthetic MRI without additional scans. Invest Radiol. 2020;55:249–256. [DOI] [PubMed] [Google Scholar]
- 62.Steen RG, Gronemeyer SA, Taylor JS. Age-related changes in proton T1 values of normal human brain. J Magn Reson Imaging. 1995;5:43–48. [DOI] [PubMed] [Google Scholar]
- 63.Cho S Jones D Reddick WE, et al. Establishing norms for age-related changes in proton T1 of human brain tissue in vivo. Magn Reson Imaging. 1997;15:1133–1143. [DOI] [PubMed] [Google Scholar]
- 64.Bender AR, Volkle MC, Raz N. Differential aging of cerebral white matter in middle-aged and older adults: a seven-year follow-up. Neuroimage. 2016;125:74–83. [DOI] [PMC free article] [PubMed] [Google Scholar]
- 65.Brickman AM Meier IB Korgaonkar MS, et al. Testing the white matter retrogenesis hypothesis of cognitive aging. Neurobiol Aging. 2012;33:1699–1715. [DOI] [PMC free article] [PubMed] [Google Scholar]
- 66.Reisberg B Franssen EH Souren LE, et al. Evidence and mechanisms of retrogenesis in Alzheimer's and other dementias: management and treatment import. Am J Alzheimers Dis Other Demen. 2002;17:202–212. [DOI] [PMC free article] [PubMed] [Google Scholar]
- 67.Fotenos AF Mintun MA Snyder AZ, et al. Brain volume decline in aging: evidence for a relation between socioeconomic status, preclinical Alzheimer disease, and reserve. Arch Neurol. 2008;65:113–120. [DOI] [PubMed] [Google Scholar]
- 68.Hofman PA Kemerink GJ Jolles J, et al. Quantitative analysis of magnetization transfer images of the brain: effect of closed head injury, age and sex on white matter. Magn Reson Med. 1999;42:803–806. [DOI] [PubMed] [Google Scholar]
- 69.Cowell PE Turetsky BI Gur RC, et al. Sex differences in aging of the human frontal and temporal lobes. J Neurosci. 1994;14:4748–4755. [DOI] [PMC free article] [PubMed] [Google Scholar]
- 70.Buckner RL Head D Parker J, et al. A unified approach for morphometric and functional data analysis in young, old, and demented adults using automated atlas-based head size normalization: reliability and validation against manual measurement of total intracranial volume. Neuroimage. 2004;23:724–738. [DOI] [PubMed] [Google Scholar]
- 71.Mortamet B Zeng D Gerig G, et al. Effects of healthy aging measured by intracranial compartment volumes using a designed MR brain database. Med Image Comput Comput Assist Interv. 2005;8(pt 1):383–391. [DOI] [PMC free article] [PubMed] [Google Scholar]
- 72.Farokhian F Yang C Beheshti I, et al. Age-related gray and white matter changes in normal adult brains. Aging Dis. 2017;8:899–909. [DOI] [PMC free article] [PubMed] [Google Scholar]
- 73.Ge Y Grossman RI Babb JS, et al. Age-related total gray matter and white matter changes in normal adult brain, part I: volumetric MR imaging analysis. AJNR Am J Neuroradiol. 2002;23:1327–1333. [PMC free article] [PubMed] [Google Scholar]
- 74.Walhovd KB Fjell AM Reinvang I, et al. Effects of age on volumes of cortex, white matter and subcortical structures. Neurobiol Aging. 2005;26:1261–1270; discussion 1275–1268. [DOI] [PubMed] [Google Scholar]
- 75.Jernigan TL Archibald SL Fennema-Notestine C, et al. Effects of age on tissues and regions of the cerebrum and cerebellum. Neurobiol Aging. 2001;22:581–594. [DOI] [PubMed] [Google Scholar]
- 76.Benes FM. Myelination of cortical-hippocampal relays during late adolescence. Schizophr Bull. 1989;15:585–593. [DOI] [PubMed] [Google Scholar]
- 77.Kazmierczak PM Duhrsen M Forbrig R, et al. Ultrafast brain magnetic resonance imaging in acute neurological emergencies: diagnostic accuracy and impact on patient management. Invest Radiol. 2020;55:181–189. [DOI] [PubMed] [Google Scholar]
- 78.Beck ES Gai N Filippini S, et al. Inversion recovery susceptibility weighted imaging with enhanced T2 weighting at 3 T improves visualization of subpial cortical multiple sclerosis lesions. Invest Radiol. 2020;Publish Ahead of Print. [DOI] [PMC free article] [PubMed] [Google Scholar]
- 79.Eichinger P Hock A Schön S, et al. Acceleration of double inversion recovery sequences in multiple sclerosis with compressed sensing. Invest Radiol. 2019;54:319–324. [DOI] [PubMed] [Google Scholar]
- 80.Kleesiek J Morshuis JN Isensee F, et al. Can virtual contrast enhancement in brain MRI replace gadolinium?: a feasibility study. Invest Radiol. 2019;54:653–660. [DOI] [PubMed] [Google Scholar]
- 81.Fartaria MJ Sati P Todea A, et al. Automated detection and segmentation of multiple sclerosis lesions using ultra-high-field MP2RAGE. Invest Radiol. 2019;54:356–364. [DOI] [PMC free article] [PubMed] [Google Scholar]
- 82.Breger RK Yetkin FZ Fischer ME, et al. T1 and T2 in the cerebrum: correlation with age, gender, and demographic factors. Radiology. 1991;181:545–547. [DOI] [PubMed] [Google Scholar]
- 83.Fjell AM Walhovd KB Westlye LT, et al. When does brain aging accelerate? Dangers of quadratic fits in cross-sectional studies. Neuroimage. 2010;50:1376–1383. [DOI] [PubMed] [Google Scholar]
Associated Data
This section collects any data citations, data availability statements, or supplementary materials included in this article.


