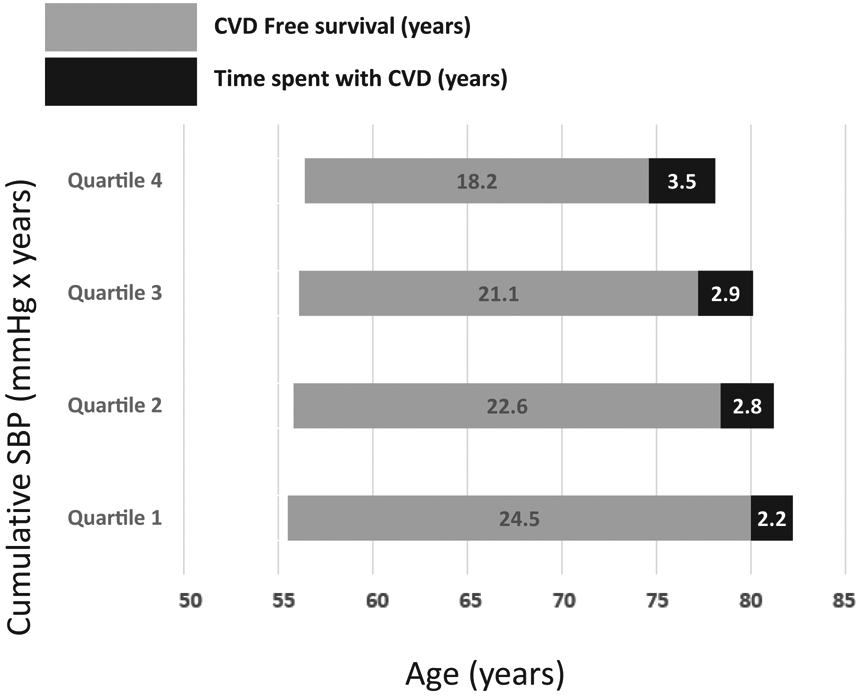
Figure 3: Overall Survival, CVD Free Survival and Time Spent With CVD After Index Date*,†.

This flow chart shows the overall survival, CVD Free survival and time spent with CVD after the index date according to 10 years cumulative systolic blood pressure quartiles.
* Average age (years) at index date was 55.5yr, 55.8yr, 56.1yr, and 56.4yr for quartile 1, quartile 2, quartile 3, and quartile 4, respectively.
† Mean life expectancy was 82.2yr, 81.2yr, 80.1yr, and 78.1yr for quartile 1, quartile 2, quartile 3, and quartile 4, respectively.
