Abstract
Paper-based devices have a wide range of applications in point-of-care diagnostics, environmental analysis, and food monitoring. Paper-based devices can be deployed to resource-limited countries and remote settings in developed countries. Paper-based point-of-care devices can provide access to diagnostic assays without significant user training to perform the tests accurately and timely. The market penetration of paper-based assays requires decreased device fabrication costs, including larger packing density of assays (i.e., closely packed features) and minimization of assay reagents. In this review, we discuss fabrication methods that allow for increasing packing density and generating closely packed features in paper-based devices. To ensure that the paper-based device is low-cost, advanced fabrication methods have been developed for the mass production of closely packed assays. These emerging methods will enable minimizing the volume of required samples (e.g., liquid biopsies) and reagents in paper-based microfluidic devices.
I. INTRODUCTION
Several major pandemics have emerged over the last three decades, namely, SARS (2003), H1N1 influenza (2009), Ebola virus (2014), and Corona virus (2020).1 A lack of field-deployable laboratory instrumentation as well as trained experts in severely impacted regions limits the effective surveillance and control of pandemics.2 Existing conventional laboratory should be miniaturized and translated to point-of-care assays for rapid deployment in pandemics. Hence, developing affordable, portable, and mass-producible test platforms in the point-of-need should be considered.1
Paper-based microfluidic devices have been developed for point-of-need applications such as drug analysis,3,4 sperm analysis,5 medical diagnostics,6–15 environmental analysis,16–18 food monitoring,19–22 and tissue engineering.23 A number of practical examples of employing paper-based devices for diseases detection and diagnosis are as follow: bioplasmonic paper for rapid urinalysis for early cancer detection,6 magnetically actuated valve integrated with a microfluidic paper-based analytical device (μPAD) for detection of tumor markers,24 semi-quantitative detection of carcinoembryonic antigen,25 wax-printed μPAD for detection of prostate-specific antigen,26 early detection of cardiac and coronary heart disease,27,28 analysis of glucose level in diabetic patients,29 and the ultrasensitive multiplexed cancer detection with amplification-by-polymerization.30 A comprehensive review of end-applications of paper-based microfluidic devices is available in the literature.31–39 The attractive features of the microfluidic devices include their low cost, portability, disposability, ease of use, and simple fabrication.9,10,16,40–42 Moreover, these devices often do not need any external power sources for sample processing.43 These paper-based devices are ideal for remote locations, where access to critical medical resources is limited.10,16,44 Several approaches have been developed for fabricating paper-based microfluidic devices31,32,45–48 such as photolithography,49 inkjet printing,50 flexography,51 screen-printing,52,53 laser cutting/pattering,54–56 and plotting.57,58 Each of these approaches offers a unique combination of resolution, cost, and ease of fabrication. A thorough comparison of the advantages and drawbacks of each fabrication method can be found elsewhere.59
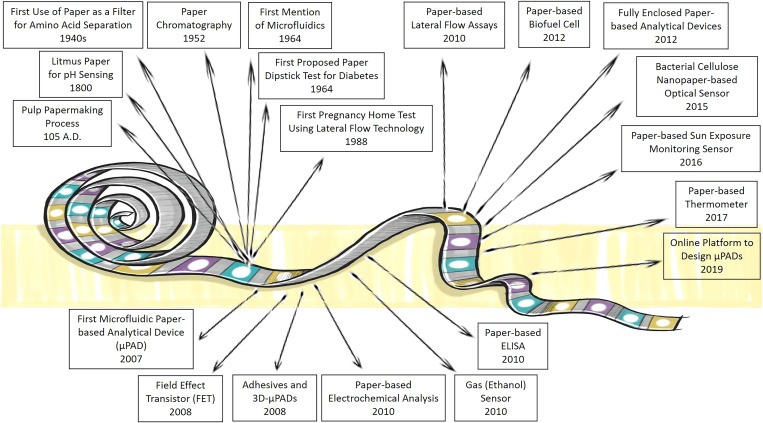
As a result of increasing population and industrialization, a tremendous amount of industrial pollutants, fertilizers, and pesticides are released in the environment. These chemicals not only can be absorbed by food products and threaten public health but they also can contaminate air, soil, and water reservoirs.17,60–65 These issues have triggered an arising concern regarding public health and preserving the environment, as well as how to monitor and control the short-term and long-term threats imposed by these contaminations.20,21,66–70 For instance, according to the World Health Organization (WHO), foodborne pathogens result in 2 × 10⁶ million deaths annually.71 Thus, continuous monitoring of the entire food production procedure in different stages of storage, processing, transportation, and use should be considered to alleviate the toxic contaminants in foods and beverages.22,72–76 Various techniques are developed to monitor the safety of foods, such as high-performance liquid chromatography (HPLC), gas chromatography (GC), and quantitative real-time polymerase chain reaction (qPCR).77 However, despite being reliable and accurate, these methods are high cost, complicated, time-consuming, and labor-intense processes. Additionally, these instrumentations are not usually portable and field-deployable to resource-poor regions that suffer from environmental pollutions and food-related illnesses. Therefore, paper-based devices can be developed to address these concerns and detect food contaminations in the early stages. Furthermore, PADs can determine the risk of exposure of the population to the hazardous pollutions in the air, water, and soil, thus, timely decisions can be made to intervene by the authorities.18,78 Figure 1 demonstrates key studies that contributed to the development of paper-based devices.
FIG. 1.
Timeline describing some of the milestone studies in paper-based devices and sensors. The wide range of applications that paper-based devices can contribute is presented, demonstrating the potential of these devices for further development.3 7,18,79–91
To achieve global market penetration in paper-based assays, the packing density of the assays (i.e., closely packed features) should be maximized. This would lead to lower costs, less medical waste, and low sample volume in multiplexed assays. Paper-based microfluidic devices generally have larger dimensions than the conventional devices due to sample evaporation issues in open-channel systems.92 The majority of paper-based microfluidic devices often need more reagents compared to their counterparts composed of other substrates such as glass and polymers.85,93–96 For instance, μPADs with open channels have four times more evaporation rate than a closed channel device.97 Hence, a higher sample volume is needed to compensate for the loss by evaporation.98 Moreover, there are further motivations for using low volumes of samples such as tear,99 or blood plasma obtained from a finger-prick blood sample, which can pass through a blood cell retaining filter.100 Minimizing the reaction zones and using closely packed features can reduce the consumption of the samples and reagents.101
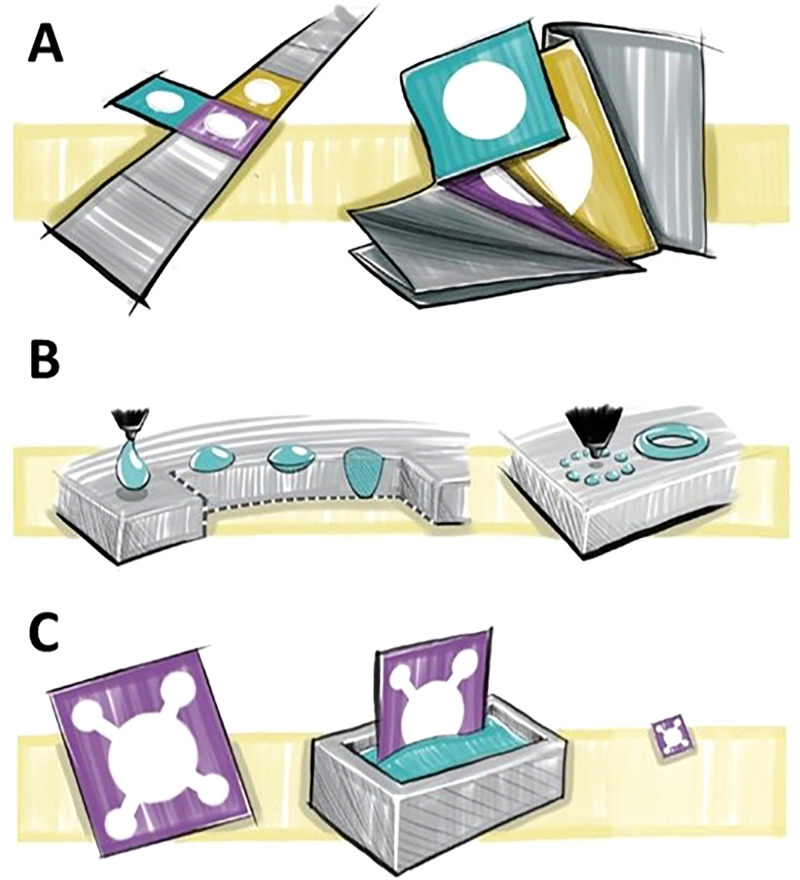
A few methods have emerged to fabricate closely packed paper-based devices: leveraging the third dimension via 3D paper-based devices, patterning hydrophobic barriers at high resolution, and imparting paper with features such as shrinkability (Fig. 2). 3D paper-based microfluidic devices have shortcomings in mass production due to the manual manufacturing steps. Assays with multiple-step tests and multiple assays in the same footprint of a 2D devices can be fabricated by assembling multiple layers of patterned papers to form a 3D μPAD.102 Sticking paper layers via adhesives or folding paper layers via origami are two commonly used approaches for the fabrication of 3D paper structures. Since, in 3D devices, channels can pass over other channels, different samples can be delivered to desired reaction zones without interfering with other channels. Thus, more channels can be embedded on the substrate, without increasing the size of the device considerably, resulting in more closely packed devices. 3D devices allow for movement through the thickness as well as the surface of the paper, minimizing the sample loss as a result of swelling of paper.45 Processing time can also be decreased using 3D architectures which connect inlets to reaction zones with shorter paths, benefiting from channels crossing over each other without mixing.37,85 Another advantage of 3D paper-based microfluidic devices is the homogenous colorimetric assays at the test zones. Since the vertical (up and down) transport of fluid between the channels and test zones is coaxial, spots with homogenous color are produced, which makes the interpretation of the results easier.103 The results can be easily interpreted because the equal length of the channels allows reagents to be evenly distributed to the detection zones so the output colorimetric intensity can be easily analyzed. 3D paper-based microfluidic devices, with their inherent design capacity, offer multi-step and multiplexed assays in 3D and may address the need for closely packed features (i.e., increasing packing density). The capability of patterning paper at higher resolution is the most direct solution to achieve smaller features, yet often with a fundamental limit regarding the deposition and diffusion of hydrophobic ink across the thickness of the paper matrix. Furthermore, emerging methods such as shrinking materials were explored104 and more recently the fabrication of smaller structures was fabricated.43 Shrinkable materials allow for fabrication methods which easily create larger patterns with lower resolution. They can be converted to smaller and high-resolution patterns without the need for sophisticated and high-cost equipment.101 Herein, we review various methods that are promising for increasing packing density and generating closely packed features in paper-based assays (Fig. 2).
FIG. 2.
Emerging approaches to increase the packing density of paper-based assays. (a) Increasing the packing density using the origami technique. 3D origami-based devices, as a subset of 3D paper-based devices, are 3D multiple-layer products fabricated by folding patterned papers in the same footprint of a 2D device. (b) Increasing the packing density in 2D by raising patterning resolution to create more closely packed features. Having more control over the patterning resolution leads to the creation of hydrophobic boundaries with more detail, which can prevent diffusion of samples out of the channel or diffusion of patterning ink into the channel. Therefore, more channels with smaller size features and higher precision can be patterned, resulting in more complex, closely packed devices. (c) Increasing the packing density in 2D by shrinking via chemical post-treatment.
II. CURRENT APPROACHES
A. 3D fabrication of paper-based devices
1. Origami
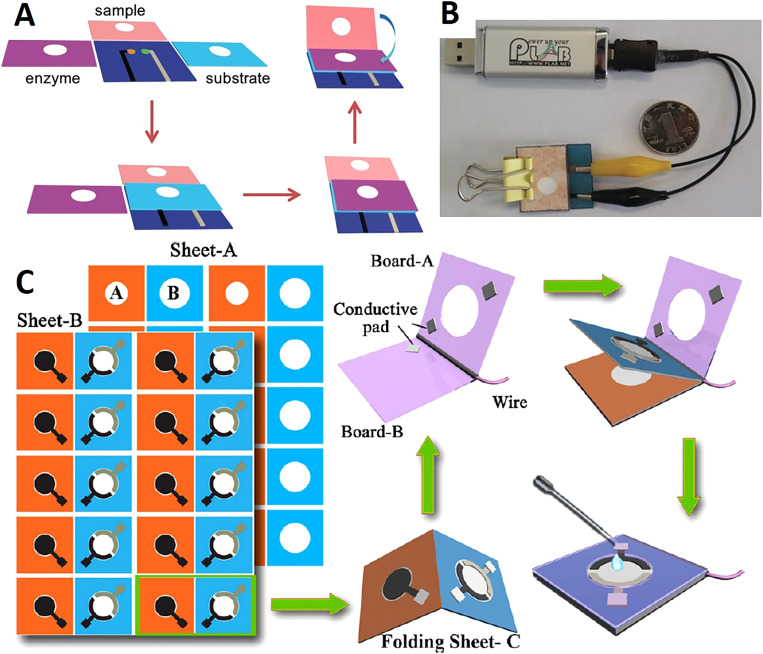
Origami is a common fabrication technique that has been used for devices including biosensors, batteries, and heart stents.105–107 This technique provides a method for creating compact and foldable 3D structures from 2D sheets.108,109 The 3D structures are created through a precise folding process of the sheets on predefined creases. Before origami was used as a fabrication technique for paper-based devices, 3D structures were typically bonded with double-sided tape and alternating layers of patterned paper. However, this method of fabrication could not be mass-produced. Thus, the origami method allows ease of production without double-sided tape assembly. The combination of origami and wax printing allowed the device fabrication to be rapid and low cost.102 Origami paper-based microfluidic devices were developed with wax patterning for the application in potentiometric biosensing of proteins and detecting enzyme activities as well as organophosphate pesticides in the enzymatic system. Finally, a detection limit of 0.006 nM was reported for this device. These 3D origami microfluidic devices eliminate the issue of reagent diffusion through lateral flow in the channels, which prevents the incompatibility of reagents in different zones [Figs. 3(a) and 3(b)].110 The evolution from single-layer systems to multilayer 3D systems has proven to allow the individual treatment of layers in the device, as well as increasing sample dispersion and enclosing intermediate layers to preserve reagents in the device.111 A self-powered paper-based sensor was produced by printing and folding paper, which did not need an external power source to operate. In this device, aptamers were used as the probe, where the results were transduced by a digital multimeter and an electrochemical readout.108 3D origami microfluidic devices were used to rapidly separate proteins and fluorescent molecules in bovine serum by the electrophoretic method.112 These multilayer devices were effective because they allow convenient sample introduction, simple and fast product analysis by unfolding the paper, as well as a high resolution of 180 μm/layer. In another study, after wax printing and subsequent baking step, the rectangular piece of cellulose paper was folded into a desired 3D structure.113 This device used AuNPs/graphene modified screen-printed working paper electrode (SPWPE) not only as a simple and low-cost electrochemical DNA sensor, which had sufficient analytical performance in human serum, but it also had applications in monitoring environmental parameters. Target DNA as low as 2 × 10⁻¹⁶ mmol l−1 was detected by this device [Fig. 3(c)].
FIG. 3.
Paper-based origami devices. (a) The folding procedure and sequence of the 3D potentiometric device. To improve the mechanical strength of the device, it was fabricated using wax patterning. (b) A miniaturized electrochemical analyzer that is controlled with a USB, which can be integrated with the origami paper-based device for potentiometric biosensing.110 Reproduced with permission from Ding et al., Angew. Chem. Int. Ed. 55, 13033–13037 (2016). Copyright 2016 John Wiley & Sons, Inc. (c) The fabrication procedure of a folding paper-based DNA sensor device. Sheet A is the paper sheets that were patterned in bulk with a wax printer. Sheet B contains three electrodes that were screen-printed on a wax-patterned sheet after baking was complete. The prepared sheets (A and B) were cut into rectangular sections (folding sheet, C), these sections were integrated with a transparent device-holder that was clamped. Finally, 40 μl of supporting electrolyte was added for the electrochemical assay.113 Reproduced with permission from Lu et al., Electrochim. Acta 80, 334–341 (2012). Copyright 2012 Elsevier Ltd.
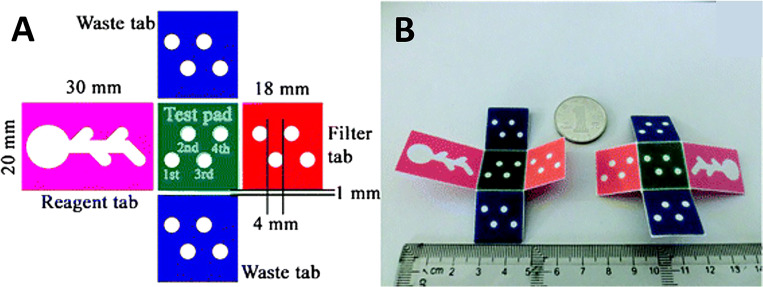
Wax patterning was utilized with origami for the fabrication of paper-based 3D devices. This study reported the fabrication of hemichannels and fully enclosed channels. Hemichannels can halve the number of paper layers needed for a particular device which can substantially decrease the complexity of the manufacturing process. The resistance of fully-enclosed channels to evaporation is four times more than that of open channels.97 A 3D microfluidic device was fabricated using origami on a paper patterned through wax printing (Fig. 4).114 The 3D origami-based sandwich-type chemiluminescence immunodevice, integrated with a representative luminuol-H2O2 CL which was catalyzed by Ag NPs, allowed for separating plasma from blood samples as well as detecting four tumor markers. Origami has been used for developing paper-based sensors for electrochemical glucose monitoring.115 Wax printing and origami were used to create microfluidic devices, where a smartphone was utilized to detect color intensity changes to analyze the test results obtained from protein and glucose concentration measurements.116 This device successfully detected 1.5–75 μM of bovine serum albumin (BSA) and 0–900 mg dl−1 of glucose concentrations (Fig. 5).
FIG. 4.
A microfluidic origami device. (a) Shape and size of 3D origami device. The device is composed of one test pad that is surrounded by four folding tabs: one reagent tab, two waste tabs, and one filter tab. (b) The front and back surfaces of the 3D origami device.114 Reproduced with permission from Ge et al., Lab Chip 12, 3150–3158 (2012). Copyright 2012 Royal Society of Chemistry.
FIG. 5.
Paper-based origami devices. (a) Schematic of a paper-based 3D microfluidic device for multiplexed bioassays and sequential fluidic manipulation. The device has two layers. In step 1, each reservoir in the top layer is preloaded with the priming and reagent solutions for colorimetric protein and glucose bioassays. In step 2, the injection zones in the bottom layer were loaded with the test solutions. In step 3, the chemical reactions occur through the tip-pinch manipulation of the thumb and index fingers. Once the device is unfolded, it is air dried and then the image readout is complete. (b) and (c) Paper-based 3D microfluidic devices after wax impregnating, which demonstrates clear hydrophobic patterns that are present on the back view of the device (c). Scale bar = 10 mm.116 Reproduced with permission from Choi et al., Sens. Actuators B Chem. 219, 245–250 (2015). Copyright 2015 Elsevier B.V.
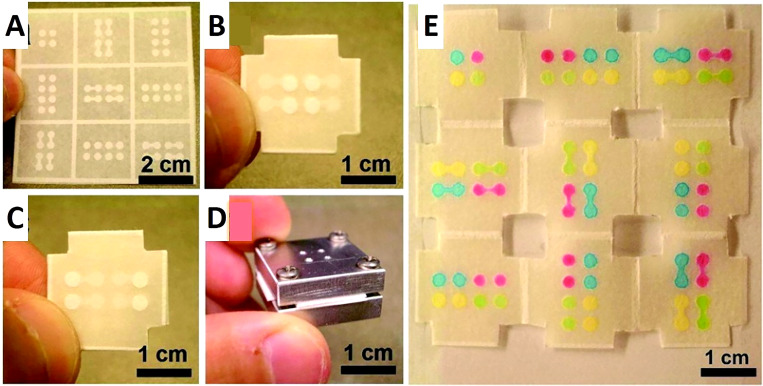
Wax printing and origami have been utilized to fabricate an origami-based electrochemical device with high sensitivity, where redox probes and antibodies were immobilized using graphene sheets as matrices.117 In another study, gold NPs were grown and a nanowires network of manganese oxide was electrodeposited on an origami microfluidic device to develop a 3D network with a large surface area. The employed enzyme label was glucose oxidase (GOx), and the redox terminator was 3,3′,5,5′-tetramethylbenzidine (TMB). This device sensitively detected PSA ranging from 0.005 ng ml−1 to 100 ng ml−1, and the detection limit was 0.0012 ng ml−1, which was validated with human serum analysis. This combination benefits from the nanocrystals' active surface area and paper's structural and electrical properties to achieve electrocatalytic activities in electrochemical sensing of biomarkers.118 Hence, nanostructures can be effectively used to create origami paper-based devices that can test human serum as well as biological samples. Paper-based devices as low-cost platforms can be integrated with a diversity of materials to broaden the scope of their applications. For instance, graphite was used as a counter electrode and to provide electrical contact to fabricate an origami paper-based device using a wax printer and double-sided tape. This device can precisely measure the concentration of p-nitrophenol in water samples with a detection limit of 1.1 μM.119 Inkjet printing and photolithography are methods that have also been combined with origami for 3D microfluidic device creation.120,121 Paper-based devices fabricated by the origami technique can be adhesive-free.121,122 For instance, a device was fabricated on a single piece of paper with one photolithographic step and simple folding. This allowed rapid fabrication without the need for tools or alignment techniques, decreasing fabrication costs. The analysis of the results was simple because the device can be simply unfolded so each of the nine layers can be analyzed separately (Fig. 6).121 Since patterns are designed and already patterned on each layer of paper, precise folding of paper along predefined lines can ensure an automatic alignment of patterns on sequential layers.123 In this study, a sample containing 5.6 mM glucose, and a sample containing 4.5 μM bovine serum albumin (BSA) were tested.121 Lastly, contamination and nonspecific adsorption were eliminated with this origami technique because there is no need for adhesive tape.124 The origami fabrication approach provides a low cost, simple, and rapid technique for creating 3D microfluidic devices.
FIG. 6.
Origami-inspired paper-based microfluidic devices. (a) 100 μm thick chromatography paper that has photolithographically patterned channels, reservoirs, and a folding frame. The channels are 900 μm wide while the reservoirs are 2.5 mm in diameter. (b) The top layer of the device after the paper is folded, depicting four inlet reservoirs in the center of the device. There are also four flanking circular features that are located within the 3D device but are visible due to the transparency of the paper. (c) The bottom layer of the folded device. (d) Aluminum housing that supports the 3D device. The four corners of the device were cut so the device could be clamped, as seen in (d). The four drilled holes on the top of the housing system are utilized to inject solutions. (e) The unfolded, nine-layer paper device after the injection of four 1.0 mM, aqueous, colored solutions through the four injection ports in the aluminum housing device. The four colored solutions (rhodamine 6G, red; erioglaucine, blue; tatrazine, yellow; and a mixture of erioglaucine and tatrazine, 1:10, green) traveled through their desired channels without mixing.121 Reproduced with permission from Liu et al., J. Am. Chem. Soc. 133(44), 17564–17566 (2011). Copyright 2011 American Chemical Society.
2. Adhesives
Besides using origami to create 3D microfluidic devices, adhesive tape has been used in device fabrication. The creation of these devices involves assembling layers of plastic, patterned filter paper with double-sided adhesive tape in alternating layers.125 The double-sided tape is used to keep the paper layers together as well as to help drive the sample fluid from the patterned paper layers to the detection zone. There are numerous ways to fabricate a 3D microfluidic device using adhesive tape. A method for the fabrication of programmable paper-based devices was shown using alternating layers of paper and double-sided adhesive tape. Implementing a single-use “on” button, the structure of the channels, the paths taken by the fluid flowing in the device, and the overall function of the device can be determined by the user after the device is fabricated. The 3D structure of the stacked paper and adhesive tape can be manipulated with an object that has a narrow tip to program the device. This approach can be considered as a simple and low-cost technique for controlling the movement of fluids as well as prioritizing the test based on the available amount of samples in 3D microfluidic devices. The presence of ketones, proteins, nitrite, and glucose can be measured using this device, which was validated using solutions of BSA, acetoacetate, glucose, and sodium nitrite.126
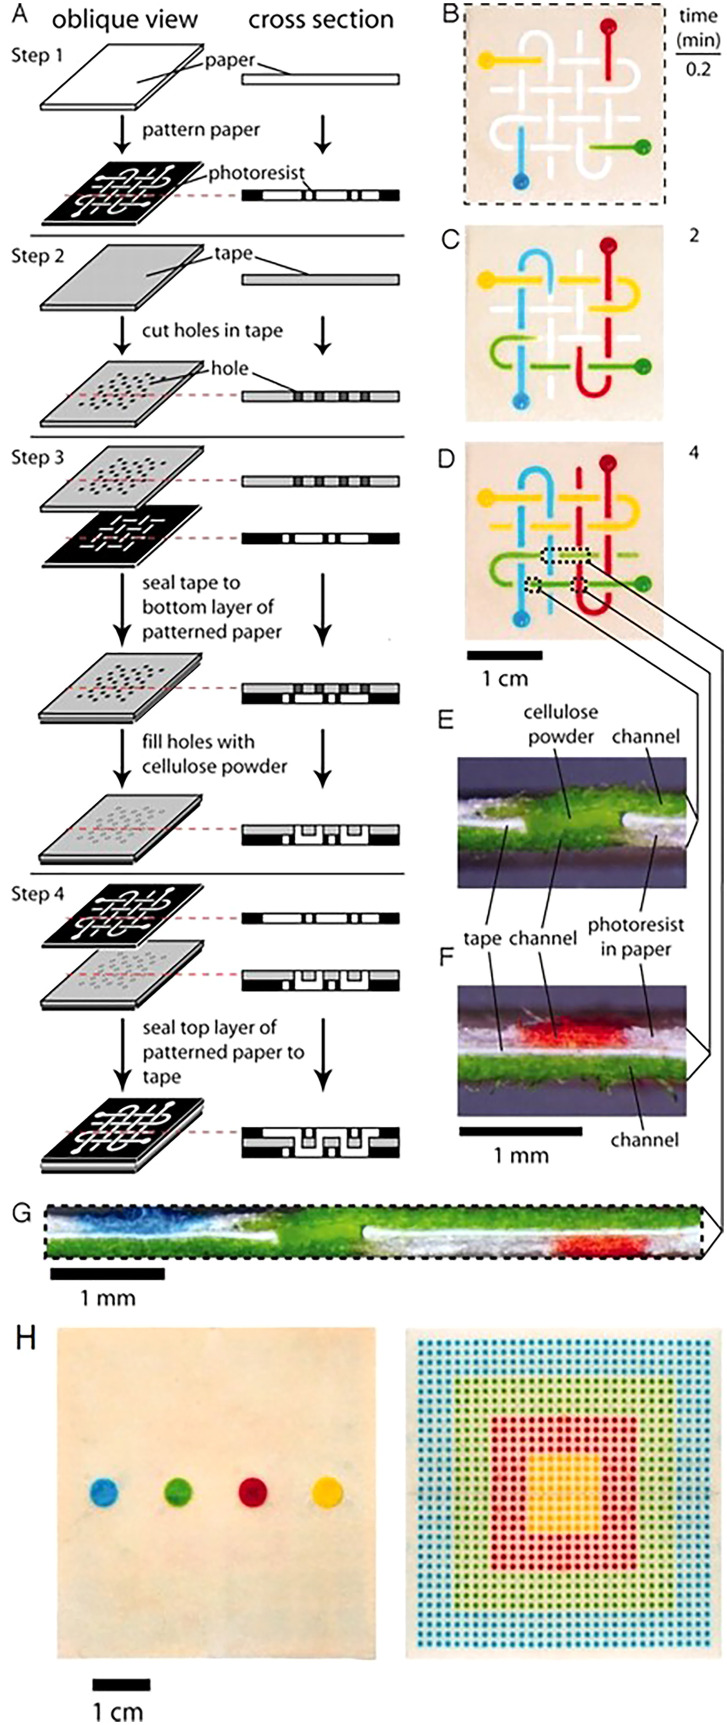
The alternating layers of paper and adhesive tape play separate roles in the movement of fluids through the device. The hydrophobic polymer that is patterned into the paper demarcates the channels for the fluid to move laterally; while, the double-sided tape separates the paper layers and the holes in the tape allow the fluid to flow vertically (Fig. 7).88 The double-sided adhesive tape tends to leave a gap between the paper layers due to the thickness of the tape; thus, this gap often needs to be filled will cellulose powder to prevent the fluid from mixing between paper layers. The use of adhesives to create paper-based point-of-care devices is not only a low-cost, but also a fast technique for achieving test results. The device displayed in Fig. 7, costs only $0.03, and the dyes are able to reach the detection zones in roughly 5min.
FIG. 7.
3D paper-based microfluidic devices. (a) Fabrication of 3D micro-paper-based analytical devices (PADs) through the process of stacking alternating layers of paper and water-impermeable double-sided adhesive tape. The fluid is able to move laterally in the channels due to the hydrophobic polymer that is patterned in the paper, and the fluid is able to move vertically in the channels because of the holes that are present in the double-sided tape. (b) The movement of the dyes (red, yellow, green, and blue aqueous solutions) 10 s after they were added to the reservoirs. (c) and (d) The results 2min and 4min after the dyes were added. The dyes crossed paths multiple times, but they did not mix. The dotted lines in (d) correlate to the cross sections depicted in (e)–(g). (e) This cross section shows the channel connecting the top and bottom of the device. (f) This cross section demonstrates the orthogonal channels in the top and bottom layers of paper that are present in the three layers of the device. (g) Cross section of the device that depicts the distribution of the fluid that is shown in (d). (h) The device effectively distributes a 100 μl fluid sample into 1024 detection zones.88 Reproduced with permission from Martinez et al., Proc. Natl. Acad. Sci. U.S.A. 105(50), 19606–19611 (2008). Copyright 2008 National Academy of Sciences, U.S.A.
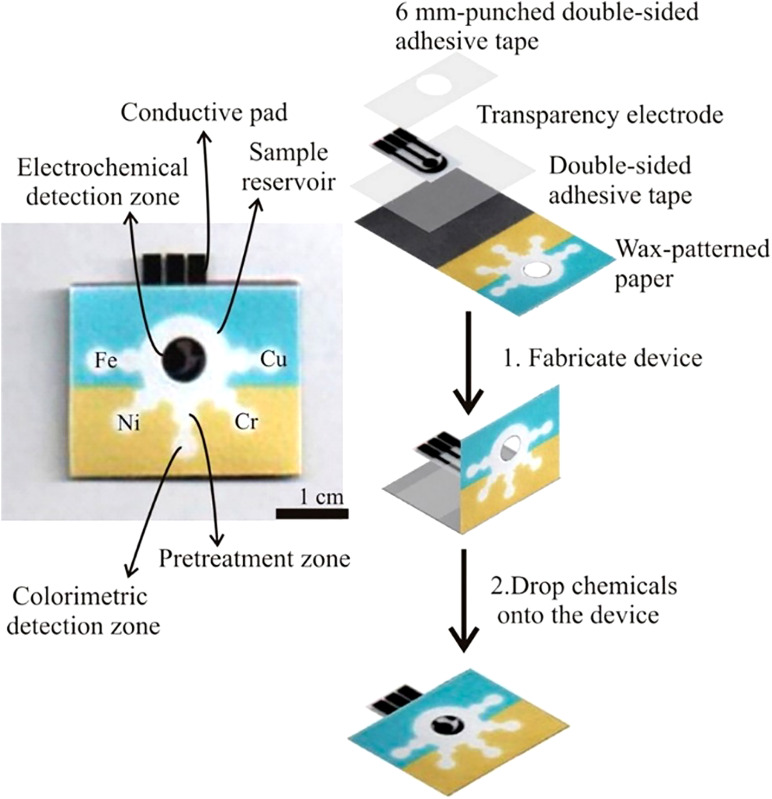
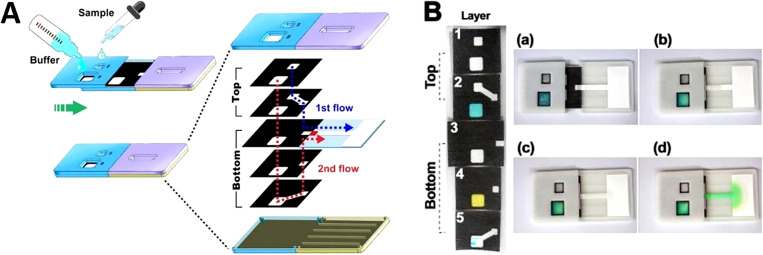
A microfluidic device was created by using multiple layers of patterned paper stacked together using a hydrophilic adhesive, precisely applied by screen-printing in the desired form. The device is a colorimetric point-of-care liver function test operating with a simple fingerstick specimen as an input sample. Aspartate aminotransferase (AST) and alanine aminotransferase (ALT) are measured in this device as two common enzymes that relate to injuries of the liver.127 Double-sided adhesive tape combined with wax printing is a common fabrication technique that allows for creating 3D devices for point-of-care testing as well as enzyme-linked immunosorbent assay (ELISA).128,129 Furthermore, the fabrication technique of wax printing and double-sided adhesive tape has a wide variety of applications in metering the capillary driven flow rate of the fluid in the device.130 Devices created with double-sided tape and wax printing have been applied for quantifying metals using colorimetry and electrochemical detection as well as detecting human norovirus infection (Figs. 8 and 9).131,132 Infectious human norovirus was detected by developing a paper-based analytical device (PAD), slip-PAD. With this configuration, multiple fluids can be delivered sequentially without the need for peripheral apparatus. These devices are able to amplify the signal by release and mix of integrated reagents in one step. Mouse IgG was targeted, where signal probe (AuNP)-labeled detection antibody and nitrocellulose membrane were employed. The limit of detection was 9.5 × 10⁴ copies ml−1 for human norovirus.132 Additionally, vertical flow assays (VFAs) are created with an interesting feature. Although the sophisticated process of sequential manual loading of reagents is one of the VFAs drawbacks, the wicking properties of paper were actuated by pressing them to program the delivery order of reagents so that reagents can be loaded simultaneously. The device performed C-reactive protein (CRP)-detection used for the prediction of cardiovascular disease risk in 15min. The detection limit was enhanced from 0.01 to 0.005 μg ml−1.133
FIG. 8.
A microfluidic paper-based analytical device and the fabrication procedure. A wax-pattern was printed onto the paper, and the hydrophobic barriers and hydrophilic channels were defined. One side of the device had clear packing tape to prevent samples from leaking. To finish the device, patterned paper, double-sided adhesive tape, a screen-printed electrode, and 6 mm punched double-sided adhesive tape were assembled through a folding process.131 Reproduced with permission from Rattanarat et al., Anal. Chem. 86(7), 3555–3562 (2014). Copyright 2014 American Chemical Society.
FIG. 9.
Fluid control in paper-based microfluidic devices. (a) The operating principles for sequential fluid manipulation in the 3D slip-Pad. Fluids are wicked onto adjacent paper layers by sliding the slip-top section to the right. This causes the sequential delivery of fluids to the detection zone through 3D paths. The back regions represent the hydrophobic wax barrier and the white regions show the hydrophilic fluidic channel. (b) The release and mixing of integrated reagents on multiple layers. The blue and yellow dyes were pre-integrated by drop-drying on layers 2 and 4; the mixing of the two dyes resulted in a green color shown in the device.132 Reproduced with permission from Han et al., Sci. Rep. 6(1), 1–7 (2016). Copyright 2016 Author(s), licensed under a Creative Commons Attribution 4.0 International (CC BY 4.0) License.
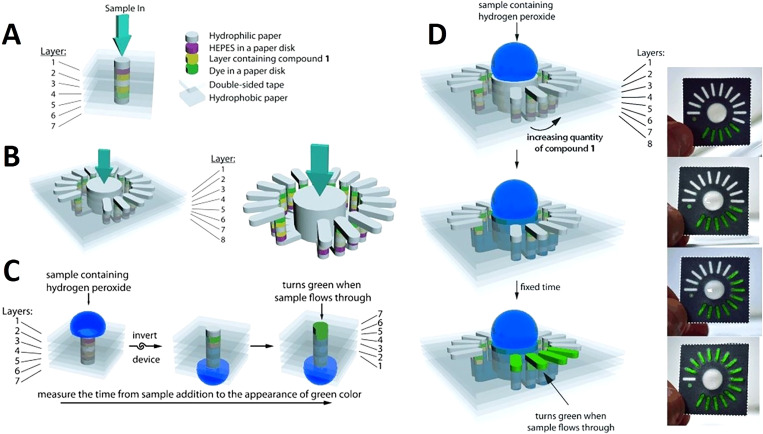
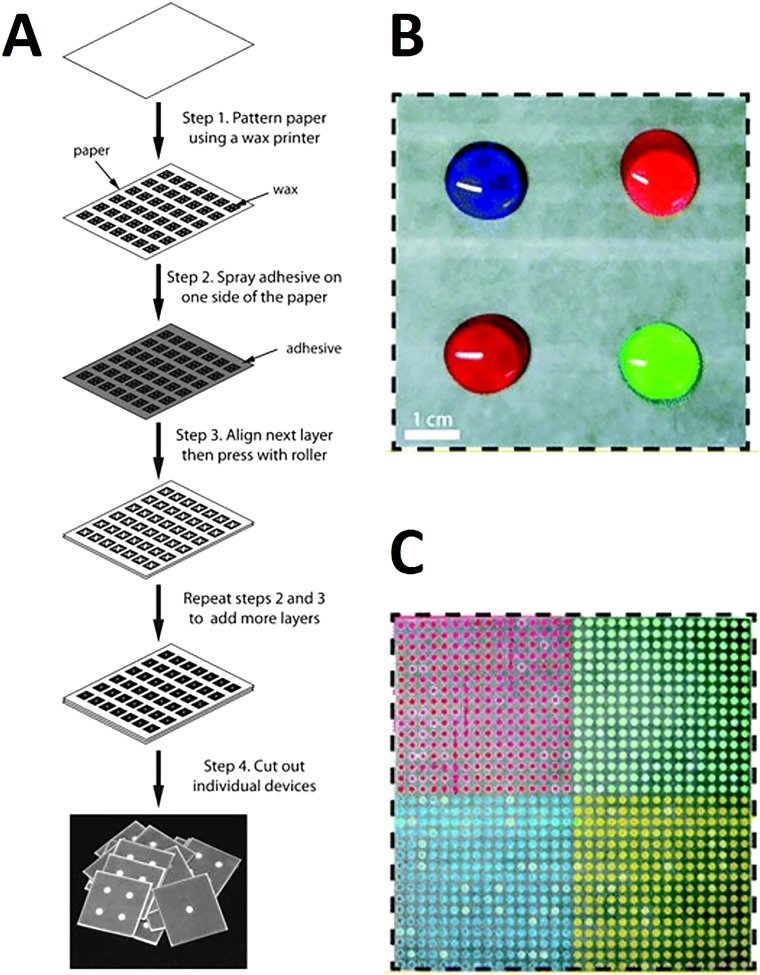
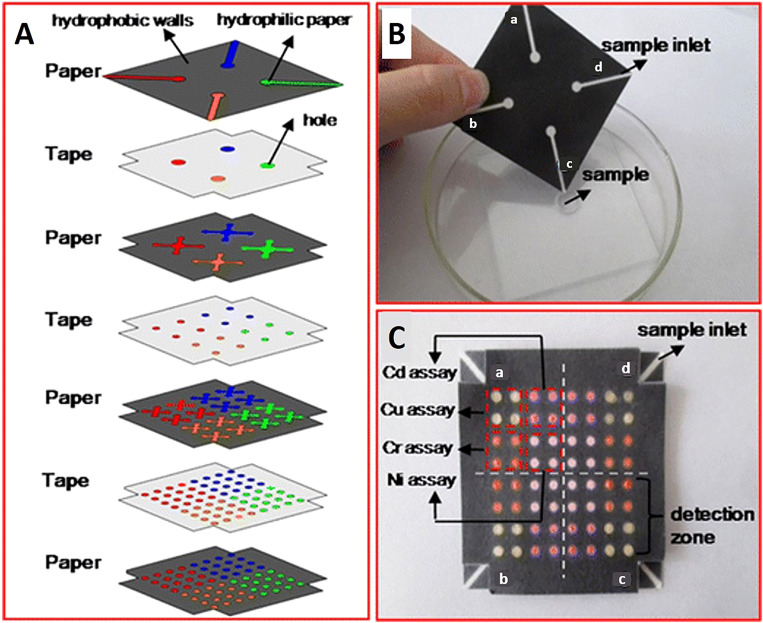
Wax patterning was used with double-sided adhesive tape to fabricate a device that did not require any external electronic readers to quantify the results. Instead, changes in wetting properties of paper were used for the quantification of hydrogen peroxide (Fig. 10).134 Spray adhesive has been used with wax printing to glue the 3D layers together which provided a simple, cost-effective approach enabling large-scale fabrication at high-throughput (Fig. 11). Using the horseradish peroxidase and glucose oxidase as reagents in colorimetric protein and glucose assays, devices produced by spray adhesive had a similar quantitative performance to that of 2D microfluidic devices.135 Requiring specialized equipment precludes ubiquitous use of fluorescence assays in deprived areas. To surmount this predicament, a device was developed to have an internal fluidic battery which allowed LEDs to be powered and the fluorescence assay to be quantified. This system can be used with a smartphone to rapidly analyze the results. For instance, the β-D-galactosidase enzyme was quantified down to 700 pM.136 There are many advantages of using adhesive tape in fabrication including that the holes in the tape can be easily patterned using manual or automated methods, the adhesive tape is not applied directly to the active zones of the device, and the strength of the adhesive can be easily varied.137 Furthermore, the adhesive fabrication technique allows for forming a complex microfluidic path for fluids to move vertically and laterally through multiple paper layers. These complex paths result in the fluid combining with different reagents in different layers subsequently reaching the complex array of detection zone leading to colorimetric results (Fig. 12).138 These devices are low cost, portable, easy to use, and have a high throughput which makes them ideal for point-of-care diagnostics.
FIG. 10.
Paper-based devices used for quantification of hydrogen peroxide. (a) By measuring the needed time for the sample to flow in the z-direction, this device can quantify the concentration of hydrogen peroxide. (b) The concentration of hydrogen peroxide can be quantified using this analog device by counting the number of bars that become colored. (c) 3D representation of the digital device. To conduct the test, the sample should be pipetted on the top; then, the device is inverted to make the detection layer visible. Seven bright green layers indicate the end of the assay. (d) Analog device assay procedure diagram. After putting the sample at the top, it wicks into the device. The number of colored bars indicates the test result.134 Reproduced with permission from Lewis et al., Angew. Chem. Int. Ed. 51(51), 12707–12710 (2012). Copyright 2012 John Wiley & Sons, Inc.
FIG. 11.
Wax-printed 3D microfluidic devices. (a) Schematic for the fabrication of microfluidic devices of any size and configuration, which requires paper, a wax printer, scissors, and spray adhesive. This technique enables a high throughput of devices by assembling entire sheets of patterned paper with adhesive. (b) 8 cm wide × 8 cm long × 0.1 cm thick microfluidic device, which distributes four different samples from the top of the device into (c) the bottom of the device, which has separate grids containing 256 output regions. This device has six layers and the four samples (1 ml each) filled the hydrophilic regions on the top of the device.135 Reproduced with permission from Lewis et al., Lab Chip 12, 2630–2633 (2012). Copyright 2012 Royal Society of Chemistry.
FIG. 12.
Multilayer 3D microfluidic devices. (A) Microfluidic chip design that has four paper layers and three tape layers. The hydrophobic walls (black areas) of the paper layers were printed with a Xerox Phaser 8560 wax printer. The blank regions (colored areas) were created with hydrophilic paper to drive the flow of samples vertically and horizontally. The tape layers were patterned by holes which connected channels of the different paper layers. (B) Photograph of top of the 3D paper-based chip which has four sample inlets (a–d), which perform four assays. (C) Photograph of the bottom of the chip dipped in metal-contaminated water. There was a color change in each of the detection zones [brown color, pink-red color, yellow-red color, and reg magenta color in the presence of Cu (II), Ni (II), Cd (II), and Cr (VI), respectively]. In each of the four detection regions (a–d), which correlate to four samples, 4 × 4 metal identifications occur in each region.138 Reproduced with permission from Wang et al., Anal. Bioanal. Chem. 406, 2799–2807 (2014). Copyright 2014 Springer Nature Switzerland AG.
3. Physical methods
3D printing is useful for the creation of 3D microfluidic devices because it has the ability to print complex structures and shapes and combine different materials during fabrication.139 In paper-based 3D printed devices, practically, paper only fills the channels that are 3D printed using different materials, such as PDMS, or a 3D printer is used to pattern hydrophobic barriers on the paper substrate, using a pen plotter, marker, to define the pattern of channels. Long chains of β linked d-glucose units (polysaccharide) are the building blocks of cellulose powder (α-cellulose). With a size of 74–125 μm, cellulose powder is an organic material which can wick fluids by capillary force, similar to ordinary paper sheets, if filled up in a channel. Therefore, filling 3D printed microfluidic channels with cellulose powder not only eradicates the need for an external power source to transfer the sample in the device but also can allow multiple usages of the fabricated device since the powder can be washed out of 3D printed PDMS channels after each test, and be filled with new powder for the next test.139 The 3D printing process is convenient to changes the design. Although the actual 3D printing process may not always be fast, this method decreases the need for third party manufacturing, outsourcing any modifications/fabrication, as well as decreasing manual time-consuming labor to create devices. The relationship between channel depth and flow time allows the flow speed of the fluids to be easily controlled, the main drawback of additive manufacturing is the resolution of the channels. The minimum size of the hydrophobic channels was determined to be about 118 μm while this number is 493 μm for hydrophobic barriers between channels, which is close to the 500 μm depth that is the typical resolution of channels (Fig. 13).139 3D printing was used for fabricating microfluidic devices for blood typing assays. A REPRAP PRUSA i3 printer with an infusion pump created hydrophobic patterns on different types of paper to fabricate PADs. The use of 3D printers has been implemented to create high-resolution hydrophobic barriers on paper for point-of-care microfluidic devices.140 Ultimately, 3D printing has numerous advantages including low waste, low cost, efficiency, ease of scalability, and convenience for the fabrication of paper-based devices.
FIG. 13.
3D printing in the fabrication of paper-based devices. (A) (a) Substrate fabrication process which involves creating a 3D model of the microfluidic device using 3D modeling software. The 3D model is transmitted to the 3D printing software using an STL file format. Once the substrate is printed, the surface is covered with PDMS until it penetrates into the flaws of the substrate (2min). The excess PDMS is wiped off and the covered substrate is then dried in the oven at 60 °C for 1 h to create a sealed, thin, hydrophobic layer. (b) The second step of the fabrication process is to fill the hollow channels on the substrate with a mixture of cellulose powder and de-ionized water. The substrate is then dried in an oven at 60 °C for 30min. After this step is complete, the fabricated device is ready to be used. (B) (a) and (b) The resolution of hydrophilic and hydrophobic channels under the microscope at 100× magnification.139 Reproduced with permission from He et al., Micromachines 7(7), 108 (2016). Copyright 2016 Author(s), licensed under a Creative Commons Attribution 4.0 International (CC BY 4.0) License.
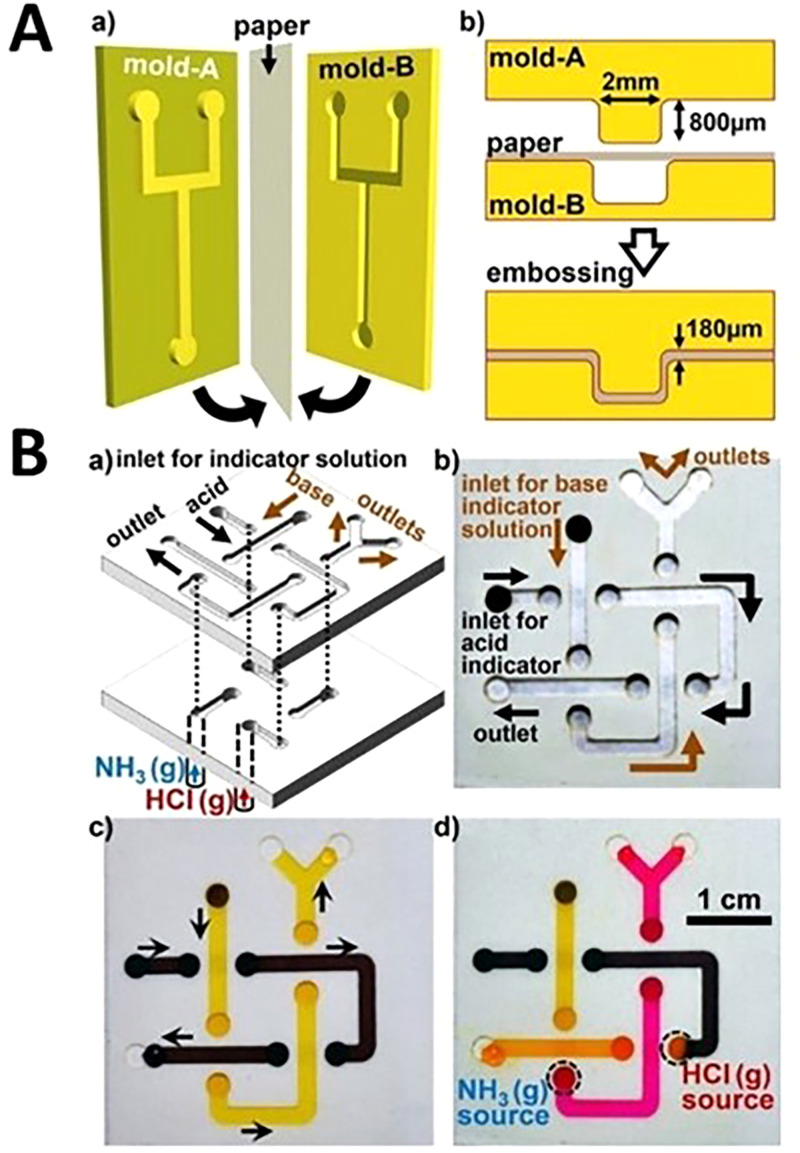
Two separate physical methods were developed for 3D microfluidic device fabrication: cut and stacking on omniphobic paper as well as embossing (Fig. 14). These devices allow fluid to flow and behave similar to fluid flow in open-channel microfluidic devices. These devices have appealing features of using paper (e.g., cost-effectiveness) and enable pressure-driven open-channel fluid flows. Embossing is a fabrication method in which the paper is compressed between two roller dies with complementary shapes. As the paper is compressed between the two dies, the desired pattern is embossed into the paper. To improve the embossing process, decrease the needed force for embossing and prevent tearing the edges, the paper is often wetted with ethanol. Embossing is a rapid fabrication method and can be easily scaled up for mass production. 3D printing, laser cutting, and selective etching are a number of conceivable methods for producing embossing dies.141 The cut and stacking method can be used to shape different paper layers that are connected using double-sided tape by a programmable knife. Cut and stacking has several advantages over embossing. For example, cut and stacking does not require any molds and the process has a higher success rate, 98%, compared to embossing (85%). The final construction for cut and stacking consists of predictable, uniform, and tunable geometries that are stacked to create the final device; thus, the depth of the channels can be controlled by the number of stacked paper layers. In this method, the flat surfaces that are fabricated make the assembly of the devices fast, the adhesive layers allow for direct sealing of channels without adapters, and these devices can also withstand bending.141 Ultimately, cut and stacking is ideal for the fabrication of 3D devices since the depth of the channels can be easily controlled by using paper with different thicknesses and this method can also be combined with origami to create complex fluid devices that provide versatility.
FIG. 14.
Embossed paper-based microfluidic devices. (A) Embossing process for 3D microfluidic devices. (a) A sheet of paper is sandwiched between two plastic molds and pressed together. (b) Cross section of embossing procedure. (B) (a) Schematic of a three-dimensional paper microfluidic device fabricated using the cut and stacking method that is complete by stacking two layers of paper patterned with channels on top of a later of nonpatterned paper. The channels are 2 mm wide and 80 mm long. The device allows an acid and base stream to cross each other without mixing. (b) The fluid inlets connect to the backside of the device which is indicated by the darker color of the channels. (c) Phenol red (yellow) and bromophenol blue sodium salt (brown) pH-indicator solutions flowing through the channels in the microfluidic device. (d) When the yellow pH-indicator is exposed to a basic gas (NH3), it changes to red and when the dark brown solution is exposed to acidic conditions (HCl) it changes color to orange. The black dotted circles represent gas inlet attachments.141 Reproduced with permission from Thuo et al., Chem. Mater. 26(14), 4230–4237 (2014). Copyright 2014 American Chemical Society.
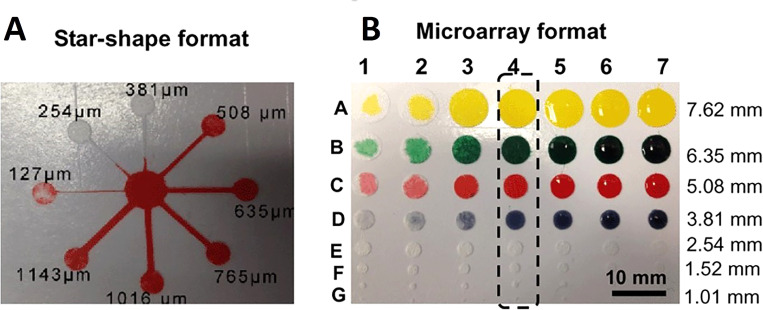
A glass fiber membrane was used instead of cellulose paper due to its fine fibers of glass with a fine capillary structure. It is also more hydrophilic than cellulose paper that allows the liquid to move rapidly throughout the microfluidic channels. The glass fiber membrane is also biochemically inert and has outstanding electrical, mechanical, and electroosmosis properties. Besides, the brittleness of glass fibers results in more precise cutting without being torn. This technique utilizes a common cutter to develop microfluidic channels with high resolution, comparable to that of conventional photolithography. A glass fiber membrane was pressed with polyvinylchloride (PVC) layer and then adhered onto the adhesive surface of a reusable cutting mat. The desired microfluidic pattern was computationally designed and an x–y knife cut the glass fiber membrane. It is beneficial to use a knife rather than a plotting pen because the knife is able to rotate freely. This free rotation results in the precise cutting of patterns including small diameter holes and corners (Fig. 15).142 The angle and the downward force of the blade can be adjusted and allows for the pattern to be created in as little as 10 s. Additionally, the resolution of this technique is comparable to photolithography, whereas this method uses less complicated and low-cost equipment. This technique is favorable for patterning because it is simple, low-cost, highly reproducible, mass-producible, and it allows the fast flow rate of liquid in the channels resulting in high loading capacity. Overall, using different materials to evaluate the performance of this device, the following detection limits are obtained: 0.25 mg ml−1 for protein, 0.05 mg ml−1 for glucose, 0.25 mg ml−1 for nitrite, and 0.5 mg ml−1 for ketone bodies.142
FIG. 15.
Characterization of the microfluidic system on a glass fiber membrane. (a) The star-shaped eight branch complex format of microfluidics and (b) microarray format of the microfluidic system.142 Reproduced with permission from Fang et al., Lab Chip 14(5), 911–915 (2014). Copyright 2014 Royal Society of Chemistry.
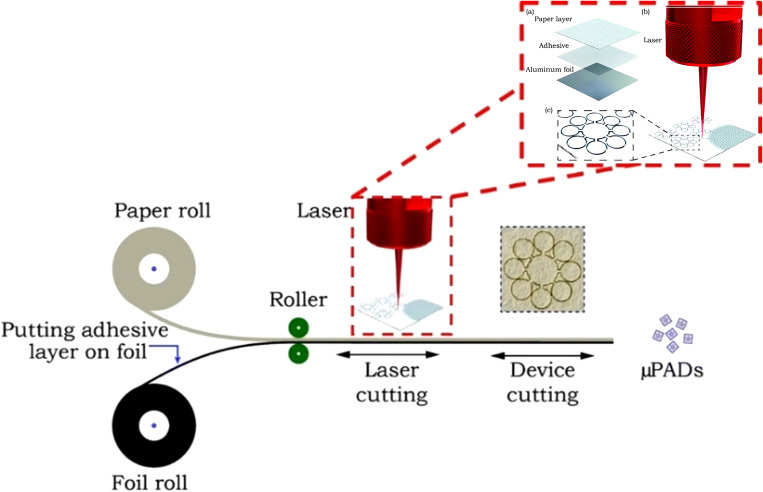
The laser cutting technique typically involves a laser that removes the outline of hydrophilic paper from the structure and creates a hydrophobic barrier. Laser cutting was used to pattern chromatography paper backed with aluminum foil. This allows for small precise features to be created with the laser. In this technique, the laser cuts through the chromatography paper layer but not the aluminum foil. Therefore, the aluminum foil acts as a support for the device and allows for the paper to be precisely cut with microscale features as well as narrow hydrophobic barriers which are formed by air where the material is removed. This method achieved channel barrier widths as small as 39 ± 15 μm (Fig. 16).44 The laser cutting method with chromatography paper is beneficial because the miniaturized device needs small sample volumes and fewer chemical reagents for bioassays. In addition, less material is needed for fabrication. These features along with lower packing cost make this approach a cost-efficient method which creates precise, narrow hydrophobic barriers, and can easily be mass-produced.
FIG. 16.
Laser cutting technique, utilizing chromatography paper backed with aluminum foil, which can be used for the mass production of microfluidic devices with compact and microscale features.44 Reproduced with permission from Mahmud et al., Analyst 141(23), 6449–6454 (2016). Copyright 2016 Royal Society of Chemistry.
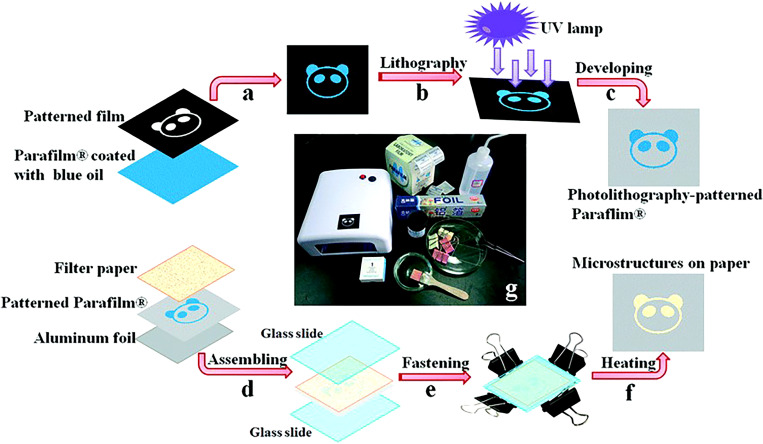
A method was developed to combine embossing and photolithography on Parafilm to create a 3D microfluidic device. Parafilm is a thermoplastic that is solid at room temperature and melts around 60 °C. The polycarbonate (PC) film placed between Parafilm and paper acts as a channel mask by preventing the melted Parafilm to penetrate the paper. Therefore, the hydrophobic boundaries of channels can be defined. The process can be performed through the use of a hot plate, ultraviolet (UV) lamp, or an oven which negates the need for high-cost equipment. Furthermore, with this method, direct photolithography on paper and subsequent immersing in photoresist step are avoided which prevents corrosion of the paper. The use of parafilm makes the fabrication of complex structures simpler and provides a method for constructing 3D microfluidic devices without the need for adhesive tape or cellulose powder (Fig. 17).143
FIG. 17.
Low-cost photolithography and embossing technique for microfluidic devices. (a) and (b) Photolithographically patterned Parafilm where the photosensitive blue ink painted Parafilm and a transparent film with the desired pattern are exposed to a UV light. (c) Embossing of Parafilm: filter paper, photolithography patterned Parafilm, and aluminum foil are assembled and sandwich between two glass slides. (d) The sandwich is pressed together and heated to 120 °C for several minutes. (e) and (f) Filter paper is removed from the assembly, and the finished patterned Parafilm is complete.143 Reproduced with permission from Yu et al., Lab Chip 15, 1642–1645 (2015). Copyright 2015 Royal Society of Chemistry.
4. Non-contact methods
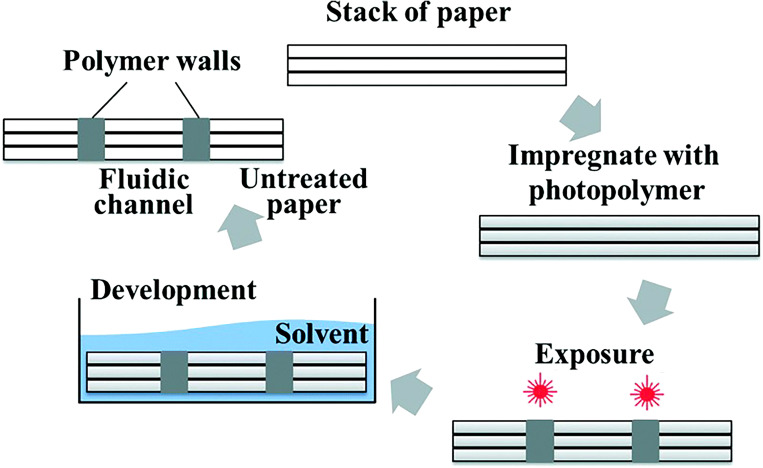
Microfluidic devices should use a small sample volume to reduce the number of chemical reagents needed and the cost of the device. Therefore, fabrication methods have been developed to generate narrow hydrophobic barriers with high resolution in microfluidic devices. A laser-based direct writing (LDW) technique was developed for creating patterns in nitrocellulose. This technique utilizes photopolymerization to create patterns. The microfluidic channels are formed with a hydrophobic photopolymer barrier which outlines the flow regions in the hydrophilic paper. Unlike other paper-based techniques, laser direct writing is a non-contact method procedure to minimize cross-contamination. Therefore, there is no need to use cleanrooms, specialty reagents, or high-cost equipment which makes this a mass-producible patterning approach. Channels were fabricated with a thickness of 60 μm; a thickness that had not been achieved by any other patterning methods.144 This method involves a laser beam focusing on the nitrocellulose substrate, mounted on an x–y–z plane, with a spherical lens. The x–y plane allows the user to control the 2D pattern; while, the z-axis positions the substrate in the optimal position under the focal point of the lens. The substrate is scanned with the laser which results in light-induced cross-linking of the photopolymer.144 Any unpolymerized photopolymer on the substrate is washed off using immersion in a solvent; the user-defined pattern remains on the substrate. Laser direct writing offers any desired pattern that can be created based on modifications of the laser parameters including laser speed and power. This technique is ideal for creating low-cost and precise point-of-care microfluidic devices.
LDW technique used for 2D devices is also used for 3D device fabrication. By controlling the laser patterning variables, the hydrophobic structure can be created partially inside a single paper layer or all the way through several paper layers. The drawbacks of fabricating 3D devices by assembling several 2D layers are (i) the tedious error-prone process of aligning layers in the microscale and (ii) interruption of flow paths as a consequence of inadequate contact between hydrophobic sections of layers. However, techniques that create 3D devices, such as LDW, are able to eradicate these concerns. Changing the patterning parameters of LDW allows for the formation of various thicknesses of the polymer backing layer. As the laser output power increased from 10 mW to 100 mW, the depth of the polymerized layers increased from 450 μm to 1050 μm. The control of the polymerized layer depth can be used to decrease the paper volume, reduce the required sample volume, increase detection limit, and alleviate the evaporation of sample which is one of the unsolved drawbacks of paper-based devices. This technique does not require any additional processing equipment, alignment, or assembly steps. Furthermore, laser direct writing can create low-cost and precise 3D fluidic devices (Fig. 18).145
FIG. 18.
The laser direct writing for fabricating 3D microfluidic devices begins with a stack of paper. The paper is impregnated with a photopolymer and then exposed to a UV laser beam with Gaussian intensity to irradiate the material. The desired pattern is then traced onto the material with the high-intensity laser. The multilayer stacks are placed in a solvent for the development of the final 3D structure.145 Reproduced with permission from He et al., Lab Chip 16, 3296–3303 (2016). Copyright 2016 Royal Society of Chemistry.
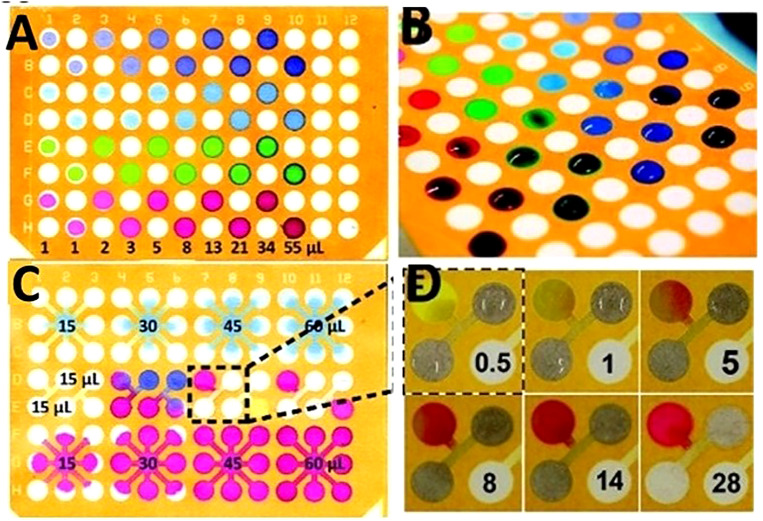
Photolithography was the first method to fabricate μPAD.7 Using photolithography on chromatography paper is convenient for small-scale prototypes. In this method, firstly, the paper is immersed in a photoresist to absorb it. The characteristics of photoresists change in the case of exposure to UV light. For instance, a photoresist material which cannot be dissolved in a certain solvent, becomes soluble after being exposed to UV light, or vice versa. Subsequently, the photoresist-saturated paper is exposed to UV light through a patterned photomask with the desired arrangement of the μPAD channels. Afterward, the cured paper is washed with a solvent to remove the unpolymerized, soluble photoresist. Finally, the remaining unsolved photoresist forms hydrophobic barriers on the paper which defines the channel walls. Unpolymerized photoresist that was under the shadow of the photomask is washed out by solvent. Therefore, the remaining paper defines hydrophilic zones for channels, reaction zones, and reservoirs.7 Two different photoresists have been used: SU-8 (photoresist base on bisphenol A diglyceryl ether resin) and SC [cyclized poly(isoprene) derivative]. SC is a cheaper photoresist and convenient to use; while, SU-8 requires extra processing steps during photolithography (Fig. 19).146 The feature size of the pattern is limited to the wavelength of light used in photolithography; this means that a smaller wavelength of light can create smaller features. Afterward, the paper plates are dried and are ready to be used. Photolithography is a common patterning technique for microfluidic devices because it can be completed rapidly (15min) and is ideal for small-scale prototypes.146
FIG. 19.
Paper plates created using photolithography for multizone assays. The procedure to pattern an SC (cyclized poly(isoprene) derivative) photoresist includes these steps: to begin, the sheets of paper were first impregnated with the SC photoresist. The photoresist was allowed to dry and was exposed to UV light through a transparency mask. After UV exposure, the paper was developed using the appropriate solvent, and then the photoresist was dried at 25 °C for 1–2min. (a) 96-zone plate after a range of volumes (1–55 μl) of solutions of different dyes were applied to alternating zones. This depicts the fluidic isolation of the various zones. (b) A 96-well plate that a volume of 55 μl of fluid was restricted from flowing over the hydrophobic barriers. (c) Alternative design for the 96-well plate that contains connection channels between zones. Every nine zones are connected with channels to a central zone. The Coomassie Brilliant Blue G250 solution was applied to the top row and the Amaranth solution was applied to the bottom row. The Amaranth spreads evenly while the G250 interacts better with the paper. The middle row, the reagents were able to interact in a third zone. (d) A time-lapse of the mixing of two solutions and the reaction in (c); the color change occurs only minutes after the application of the two different solutions.146 Reproduced with permission from Carrilho et al., Anal. Chem. 81(15), 5990–5998 (2009). Copyright 2009 American Chemical Society.
B. 2D high-resolution printing/patterning methods
There are numerous patterning techniques that are used to create microfluidic devices for the application in point-of-care diagnostics. Some of the techniques include photolithography, plotting, plasma treatment, inkjet etching/printing, and wax printing. The main principle behind these techniques is to form a hydrophilic-hydrophobic pattern on paper-based substrates using a physical method or chemical modification of the medium. There are limitations to many of these methods, for example, photolithography and wax printing require specialty equipment. Other paper-based methods result in microchannels with low resolution and are not ideal for mass production.142 Aside from the resolution of each technique, it is important to understand the substrate itself and the fact that the fiber orientation along the long axis (the surface) of the paper is often different from the fiber orientation throughout its thickness. The difference in fiber orientation on the surface and the thickness of the paper causes the liquid sample to be unevenly transported in all directions (x, y, and z). It was also determined that fiber orientation affects the imbibition speed. Ultimately, the wicking speed proved to increase by 30% with the flow that is parallel to the fibers rather than when the flow is perpendicular to the fibers.1 This demonstrates that the orientation of the fibers should be considered during the design of paper-based assays since fiber orientation directly influences wicking speed as well as fluid transport through the device.
Wax printing is a patterning technique that is used for creating microfluidic devices because it is simple, low cost, environmentally friendly, a quick process, and can easily be mass-produced.147,148 Cellulose paper is typically used for wax printing; however, Lu et al. utilized a nitrocellulose paper substrate that was made from pure cellulose-nitrate. A nitrocellulose substrate is advantageous because it has high protein binding capabilities. Due to its porous structure, this substrate can immobilize proteins effectively which can have applications in dot ELISA (enzyme-linked immunosorbent assay), and test strips based on gold nanoparticles. It also has a very small and uniform pore size (0.45μm) which allows for the wax penetration process during baking to be slower and controlled more precisely, resulting in microchannels of 100μm in resolution. The smooth and uniform surface, as well as the small pore size of nitrocellulose, leads to a channel flow that is highly stable and reproducible.149 The process of wax printing only involves two main steps: printing and baking. To begin, the wax microstructures are printed onto the nitrocellulose membrane using a wax printer. Then, the wax-printed substrate is baked in an oven for 5 min. This baking allows the printed wax to melt and penetrate through the nitrocellulose membranes to create hydrophobic patterns.149 Tenda et al. applied an adapted version of wax printing for the fabrication of microfluidic devices which involves the use of hot lamination to create melt printed wax features instead of hot plate heating. Typically, a hot plate or oven is used for the baking process; however, the printed wax vertically penetrates the substrates, but it also horizontally diffuses which blurs the originally sharp printed pattern.98 Tenda et al. discovered that using hot lamination with wax printing eliminates the evaporation of sample fluid and increases control over sample uptake. Regardless of the baking method used for wax printing, the overall patterning technique is advantageous due to its short processing time, simple fabrication technique with only two steps, and its potential for mass production at a low cost. Ultimately, the devices created were able to evaluate samples of extremely small volumes which demonstrates that these devices can be extended into the sub-microliter range.98
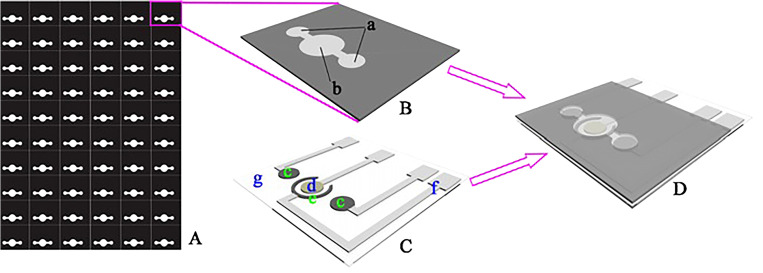
Wax printing has proven to be an effective method for fabricating devices for a wide variety of applications including electrochemical three-dimensional immunodevices. Multiplex immunoassays attracted attention recently owing to their ability to detect diseases in early stages, to determine the extent to which the disease is developed, and to evaluate the effect of remedies on the patient. Wang et al. developed a novel combination of electrochemical immunoassays with microPADs. The emanated three-dimensional microfluidic paper-based electrochemical device (3D-μPED) encompasses of a wax-printed layer, as well as a screen-printed electrode layer. According to Wang et al., the latter layer can be used multiple times with more than one wax-printed layer which paves the path for cost-efficient devices. They also utilize carbon nanotubes in order to enhance the electrical conductivity of electrochemical cells on these devices (Fig. 20).150
FIG. 20.
(A) Wax-patterned paper sheet for the three-dimensional microPAD. (B) The 3D-microPAD with (a) being the paper working zones and (b) the paper auxiliary zones. (C) schematic of the screen-printed electrodes (c) represent the carbon working electrodes, (d) Ag/AgCl reference electrode, (e) carbon counter electrode, (f) silver conductive channel, and pad (g) transparent polyethylene terephthalate substrate. (D) Once stacking is complete, the paper working zones and paper auxiliary zones are aligned with the screen-printed working electrodes, count, and reference electrode.150 Reproduced with permission from Wang et al., Biosens. Bioelectron. 32(1), 238–243 (2012). Copyright 2012 Elsevier B.V.
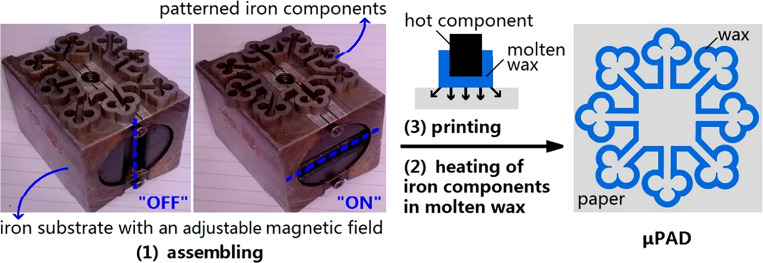
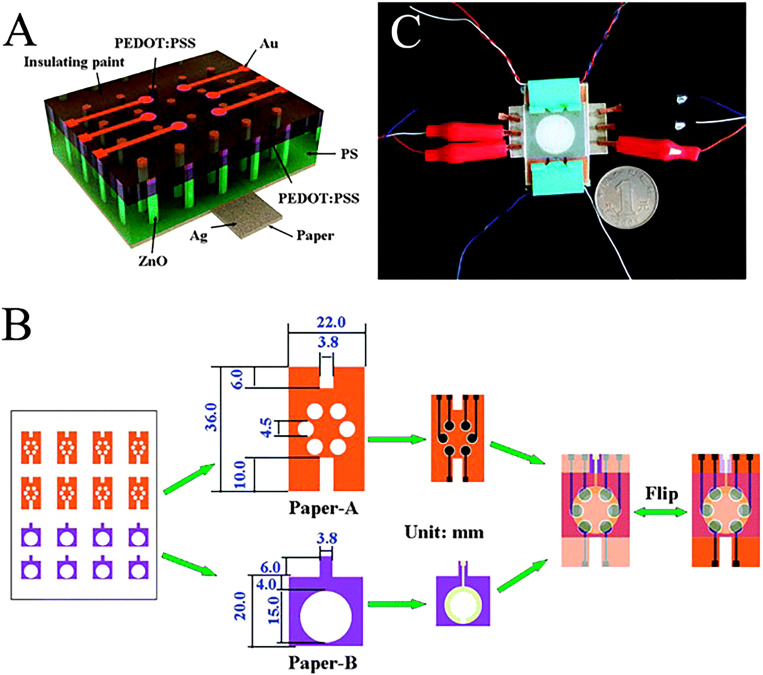
Zhang et al. depicted a slightly different wax patterning method known as movable type wax patterning (MTWP). This technique is inspired by a Chinese printing method and only requires a hot plate and homemade small movable components. MWTP is a system of typography and printing which utilizes movable components to reproduce elements onto paper. There are three main steps in this process: assembling small movable homemade iron components into the desired pattern when the magnetic field is off, using a hot plate to heat the patterned components to molten wax when the magnetic field is on, and lastly, printing the hot stamp with the support and patterned metal components onto the surface of the paper (Fig. 21).151 In this paper, to fabricate 3D assays, layers were stacked by two pieces of hollow iron slices and iron clamps. This method provides a simple, low cost, and adjustable approach for fabricating microfluidic devices that do not require expensive equipment or specialized skills. In another study, Zhang et al. combined wax printing with screen-printing which proved to be another simple and inexpensive technique for device fabrication (Fig. 22).152 Wax patterning has also been combined with other techniques such as laser cutting. As an example, Mosadegh et al. fabricated devices with this method that analyze in vitro cellular motility and viability, specifically in the laminar ventricle tissue of the heart.153
FIG. 21.
Movable Type Wax printing procedure for a 24-zone microfluidic device. (1) Assembling of the device, creating the desired pattern when the magnetic field is off. (2) Using a hot plate to heat the patterned components to molten wax when the magnetic field is on. (3) Print the hot stamp onto the surface of the paper to create microPAD..151 Reproduced with permission from Zhang et al., Anal. Chem. 86(4), 2005–2012 (2014). Copyright 2014 American Chemical Society.
FIG. 22.
(a) Schematic of ZnO nanorod LEDs on a paper substrate. (b) Schematic of the fabricated three-dimensional paper-based photoelectrochemical immunosensor array device that was prepared with LEDs as the excitation light source. (c) Photograph of paper-based nanorod LEDs excited multiplexed photoelectrochemical immunodevice.152 Reproduced with permission from Zhang et al., ChemComm 50(12), 1417–1419 (2014). Copyright 2014 Royal Society of Chemistry.
Merging electrochemiluminescent (ECL) technology with paper-based platforms leads to useful performance outcomes. Zhang et al. created a low-cost paper-based ECL device by wax printing that is able to perform environmental monitoring as well as medical diagnoses through the detection of Pb2+ and Hg2+. This device can detect Pb2+ and Hg2+ down to 10 pM and 0.2 nm, respectively.154 Yan et al. proposed a wax-printed paper-based ECL immunodevice. The high level of sensitivity and selectivity of this device stem from ECL immunoassays, where the simplicity and inexpensiveness of the device are brought about by the use of paper.155 Another application of ECL proposed by Wang et al. They detect four tumor markers concurrently and eliminate the need for expensive electrochemical workstations by a screen-printing of electrode arrays (Ag/AgCl electrodes) on a wax-printed paper.156
C. Alternative approaches
Microfluidic devices for the application of Point-of-Care (POC) are created through different processes such as patterning paper with hydrophobic ink to create hydrophilic channels and test zones that are bounded by the hydrophobic ink. The major limitation of these devices is the imprecise patterning technique. The current fabrication technique results in the hydrophobic ink diffusing across the paper and blurring the printed patterns. This results in MicroPADs that have lower resolution patterns and ultimately prevents the creation of patterns that are smaller than 1 mm.101 An ideal fabrication method would allow for the creation of the MicroPADs with high-resolution patterns. This would be beneficial because it would expand the capabilities of these devices; ultimately, allowing for the creation of high-resolution patterns as well as the fabrication of smaller devices with more precise patterns.
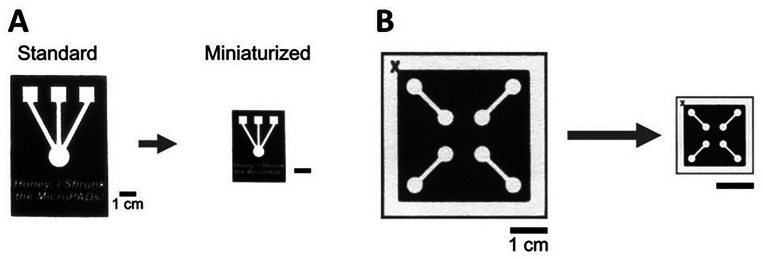
The method for creating smaller devices with higher resolution patterns, involves the shrinkage of paper. Since paper is not typically a simple material to shrink, there are only a few methods that have been extensively researched. The first method is performed through multiple cycles of soaking paper in liquid ammonium and drying. This technique has been used to successfully create miniaturized paper currency but is not as effective as other methods. 55% reduction in surface area is reported for this method.157 The other method used for paper miniaturization, studied by Strong et al., involves soaking paper in aqueous solutions of periodate. This method is known as periodate oxidation of cellulose which modifies the surface of the paper and enables molecules to be covalently linked to the surface.157 It was found that exposing the paper to varying concentrations of periodate over a period of 96 h resulted in the surface area of the paper being reduced to anywhere between 60 to 80% (Fig. 23). The average wicking velocity in these miniaturized devices was decreased by a factor of 2 due to a decrease in pore size as well as an increase in hydrophobicity compared to standard devices.101 Paper miniaturization via periodate oxidations was attributed to the reorganization of oxidized cellulose chains into non-linear conformations. This ultimately results in buckling and shrinking of the oxidized cellulose fibers.157
FIG. 23.
Comparison of microPADs before and after miniaturization. (a) Wax-printed MicroPADs which show the miniaturization process. (b) Photograph of a miniaturized microPAD with roughly a 78% reduction in the surface area.101 Reproduced with permission from Strong et al., Sci. Rep. 9(1), 1–9 (2019). Copyright 2019 Author(s), licensed under a Creative Commons Attribution 4.0 International (CC BY 4.0) License.
III. THEORETICAL ASPECTS OF HIGH-RESOLUTION PRINTING ONTO 2D PAPER SUBSTRATES
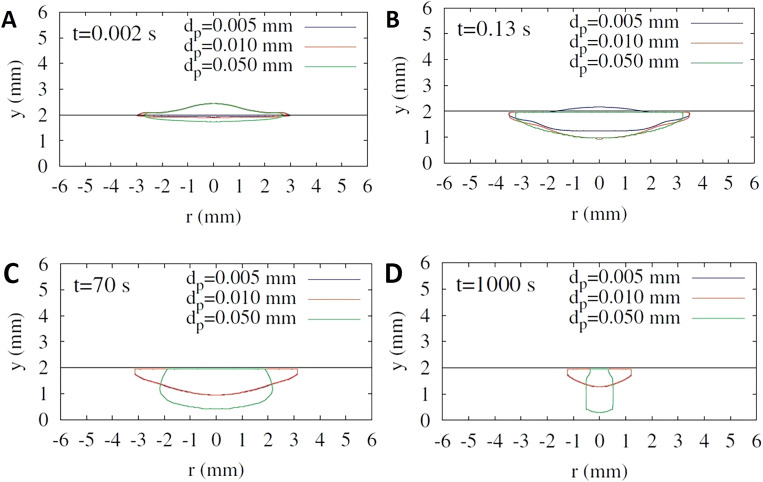
To develop new fabrication approaches and more cost-efficient novel flexible materials, a better understanding and a higher level of control in the deposition physics and fiber orientation through the thickness of paper should be developed to eliminate uncontrolled penetration and diffusion of hydrophobic liquid before it is dried out. In this context, Reis et al. computationally studied the impact of liquid droplets on porous surfaces.158 Absorption and impact dynamics of a droplet, in the liquid phase, colliding with a porous medium have been studied through a numerical model by Reis et al.,158 with the focus being on the finite volume approach. In this respect, influences of capillary forces and surface tension, the transportation of the free surface inside the porous substrate, and the connection between the fluid flow inside and outside the porous substrate are meticulously considered to acquire a precise description of fluid flow dynamics. In order to chase the position and the shape of the liquid region, the marker-particles method is employed. Also, the pressure-velocity coupling is solved by the SIMPLEC. Overall, experimental data and the computational model are acceptably conceded in the case of verification by comparing the predictions of the model with data from experimental studies, considering various aspects of their behavior. Another group, Choi et al., developed a level-set method for droplet impact and penetration into a porous substrate.159 The effects of parameters such as porosity and drag force, brought about by the porous solid matrix, are incorporated by applying the averaged conservation equation of mass and momentum. These parameters are integrated by the conservation equations in the external fluid region over the corresponding conditions of stress and velocity on the porous medium. Correlation of droplet's distribution and penetration with particle size, initial droplet radius, porosity contact angles, and impact velocity is examined. A comparison is drawn between the initial droplet penetration depth and the numerical results. The same group improved their method and studied droplet impact on a porous surface in the presence of evaporation.160 In order to track the spreading of the droplet in the presence of the effects of evaporation (that is coupled to mass and heat transfer), porosity of the medium and capillary forces, a level-set formulation is developed. Furthermore, the solution of the local volume averaged conservation equations of momentum, energy, mass, and vapor fraction for the porous part implemented concurrently with the conservation equations for the external fluid region. Concomitant temperature, flow, and vapor fraction fields are demonstrated. Moreover, how deformation and evaporation of droplets are affected by porosity, impact velocity, and particle size is numerically computed (Fig. 24).
FIG. 24.
Influence of the particle size (tuning the porosity of substrate) on the deformation of the droplet in a porous medium for V0 = 1m/s and ε = 0.2. Droplet penetrating into porous substrates at various time points: (a) t = 0.002 s, (b) t = 0.13 s, (c) t = 70 s, and (d) t = 1000 s.160 Reproduced with permission from Choi et al., Int. Commun. Heat Mass Transf. 80, 18–29 (2017). Copyright 2016 Elsevier Ltd.
IV. ONLINE DESIGN PLATFORMS FOR CREATING CLOSELY PACKED FEATURES
Designing lab on a chip (LoC) systems including paper-based diagnostics systems is not only a time and skill demanding process but also a laborious process which would greatly benefit from online platforms that could automate the iterative design process and enable widespread design and use of such devices. Furthermore, the reproduction of state-of-the-art microfluidic devices presented in the literature is often difficult because of insufficient open-source images and data accompanying the design. In some cases, despite the available online computer-aided design (CAD) files, repurposing of the design for a particular new application requires intensive further characterization to compartmentalize the design, since CAD software considers the design as a whole, instead of a combination of distinct subsystems.
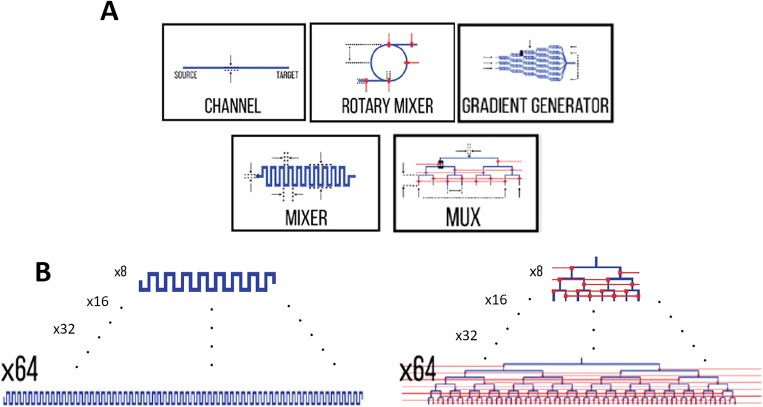
Sanka et al. presented an interactive, open-source, and web-based microfluidic system designer tool running in the browser. The assortment of libraries offered in this platform is comprised of commonly used LoC components, including but not limited to mixers, distributers, cell trappers, and so forth.89 Figure 25 depicts a number of available components in their online platform.
FIG. 25.
Commonly used components in LoC can be found and easily implemented in 3 D μF, which substantially can reduce the needed effort for designing. (a) Examples of available components. (b) Based on the size and the complexity of the design, different sizes of components are available in this platform.89 Reproduced with permission from Sanka et al., Sci. Rep. 9(1), 1–10 (2019). Copyright 2019 Author(s), licensed under a Creative Commons Attribution 4.0 International (CC BY 4.0) License.
This platform is beneficial for both component designers and system designers. While component designers can share their work with others through a component library created within this platform, system designers can take advantage of existing microfluidic technologies from this online platform to model and focus on more intricate microfluidic systems. Meanwhile, since the platform is open-source, novel components can be designed and shared with other researchers all around the world. This method is deemed as a modular design approach through which designers can design subsystems separately to evaluate the functionality of each part independently prior to assembling subsystems as a fully integrated system.89
As an infant approach, this method has some shortcomings such as the size of the component library. However, as the LoC community proceeds, more libraries can be added into this online database, which can result in transforming this platform into a powerful large-scale microfluidic systems design platform.89 Another current limitation of this platform is its adaptability to paper-based microfluidic systems. This limitation may arise since, unlike most of the microfluidic devices, paper-based devices often utilize only capillary transport and do not use external power sources, e.g., pumps, to transport the fluid and analytes inside the device. The current version of this platform does not possess modules to simulate the natural absorption and imbibition of a fluid by a porous composition like paper. Wetting can substantially affect the behavior of the fluid in a paper-based device. Hence, some further refinements seem crucial to make this platform a practical tool for the design of paper-based devices.
V. DESIGN AND FABRICATION CHALLENGES OF PAPER-BASED MICROFLUIDIC DEVICES
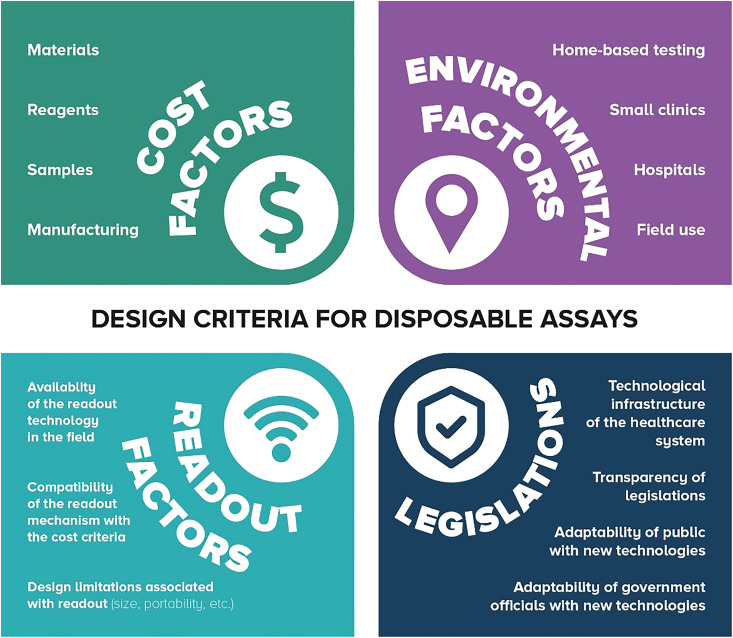
By definition, design criteria are the explicit goals that a product should achieve to be considered successful. According to the world health organization (WHO), paper-based microfluidic devices should meet ASSURED criteria (Affordable, Sensitive, Specific, User-friendly, Rapid, Equipment-free, and Deliverable).161 As a consequence of using an inexpensive, readily available substrate, paper, these devices are accessible at affordable prices. Since paper can transport fluids automatically by capillary action, no external equipment is needed, making these devices equipment-free, portable, and user-friendly. On the other hand, increasing packing density can result in devices with more compliance with ASSURED criteria. Closely packed setups perform multiple tests on a single device without considerably increasing the size of the device, resulting in less material usage and less expensive end products. Moreover, shorter channels can reduce test time, and decrease the chance of diffusion or imperfect fluid transportation, improving the ultimate sensitivity of the device by enhancing the quality as well as quantity of delivered sample to reaction zones.
Although conventional and paper-based microfluidic devices have common characteristics (e.g., portability, minute sample size, and applicable in the point-of-need), underlying principles for fluid transportation and mixing vary substantially.162 Fluid transportation relies on external power (e.g., pumps) in conventional devices, whereas capillary force is responsible for fluid flow in paper-based devices.163 Moreover, while mixing is mostly due to the diffusion in conventional microfluidic channels (e.g., polymer and glass channels), mechanical dispersion is the most dominant mixing mechanism in the porous structure of paper-based channels.164 Mechanical dispersion means that the formation of gradient depends on paper microstructure, and independent of fluid velocity. Hence, the design strategies of μPADs should be different from that of conventional microfluidic devices.164 Lateral flow assays (LFA), as the first generation of μPADs (e.g., home pregnancy test strips), use the capillary action to wick samples from inlet to the reagent-ladened test zones using absorbent pads.165 LFAs are cost-effective, easy to use, portable, and equipment free, making them a suitable candidate for point-of-care applications.166 To extend the application of LFAs beyond simple one-dimensional tests, attempts have been done to enable multiplex analytical tests with LFAs while enhancing the sensitivity as well as detection limit and reducing the fabrication cost as well as required sample/reagent.165 The main hurdle of developing LFAs to multiplex devices is test line configuration. A careful design of test line configuration is needed to prevent downstream detection areas from being affected by upstream detection areas.167 Moreover, a main drawback of LFAs is the slow testing process as a result of mass transport limitations as well as binding kinematics.168 A common method of multiplexing LFAs is drawing more than one line on a single strip, and using nanoparticles (e.g., gold nanoparticles) as the label.169 Also, converting line shaped detection areas to dot-shaped areas can increase the number of detection sites on a single strip.169 Another strategy for multiplexing LFAs is to develop individual strips and use a special holder to keep all single strips together. A single sample can be shared by all strips (with one or more detection line on each strip), while each works independent of others.170 However, the main drawback of this method is the larger volume of needed samples to feed all strips. These attempts have enabled the performance of multiple tests on a single LFA device, increasing the packing density of LFAs.
Defining hydrophobic and hydrophilic barriers on paper can guide fluid to flow in predefined pathways, mitigating the diffusion of fluid to adjacent channels.93 However, patterned hydrophobic barriers (e.g., wax or AKD) cannot withstand samples with low surface tension (e.g., biological samples with surfactant).93 Consequently, the sample can penetrate the barriers and diffuse into adjacent channels, defecting the desired guided flow in channels. Enclosing and sealing of μPADs protect samples and reagents from external contamination as well as diffusion of fluid from adjacent channels, especially in 3D devices. Also, enclosing reduces the needed fluid by slowing down the evaporation, resulting in more control over the fluid flow in channels.102 However, sealing could be a challenging process in 3D devices. Adhesives are used for sealing of μPADs owing to their low-cost, availability, and transparency, which enables visual detection of test results.31 However, prior to applying adhesives, each layer of double-sided adhesive tape should be punched to create designed hydrophilic patterns (e.g., holes), followed by an alignment step, slowing down the fabrication process.31 Moreover, cellulose powder is needed to fill the gaps produced by the thickness of the tapes to keep continuous capillary action among different layers of paper. Spray adhesives can adequately overcome these problems.45 Nonetheless, the spray may change the wettability of paper, affecting the considered parameters in the design process, and can diffuse into the channels as well as reaction zones at high ambient temperatures, chemically reacting with samples/reagents on the paper substrate.37,45
The wicking process is relatively slow in μPADs. For instance, for a 2 mm widths channel with 0.2 mm height, wicking may take hours to complete for long distances (>5 cm).92 The problem exacerbates when taking into account the evaporation of liquid from paper-based devices and drying-out as a result of long wicking time. This problem hinders the rapid tests with μPADs, augments the required amount of sample/reagent, and confines the practical length of channels, limiting the complexity as well as applications of μPADs.92 Wicking speed, according to the Lucas-Washburn equation, is proportional to surface tension, contact angle, viscosity, and effective pore size.92 Since the characteristics of working fluids are usually determined by the desired test, there were attempts to amplify the wicking speed by manipulating features of substrate paper using two-ply channels,92 sealing channels with triboelectrically charged poly(ethylene terephthalate) sheets,171 cutting grooves in the middle of the paper channel,172 hollow channels out of stacked paper,173 and sandwiching channels between two plastic films.174 The width and depth of the channel can also affect the wicking speed.139 Size features of channels can be changed deliberately to acquire a timely programmed flow for multi-step multi-analyte detection, facilitating more complex tests by μPADs.139,175 For instance, decreasing the width of the channel was resulted in reducing the final length of the device, increasing the overall flow rate while decreasing the assay time.164 Furthermore, It is demonstrated that the different surface coating and pore density can change the wicking behavior of paper, altering the migration time and distance of liquid in the channel.163 Also, a diluted sample, with a larger volume, was transported more efficiently compared to the original sample, yielding higher analytical sensitivity despite possessing a lower concentration.163 Processing time can be decreased using 3D architectures which connect inlets to reaction zones with shorter paths benefiting from channels crossing over each other.37,85
The porous medium acts as a mixer intrinsically with more efficient gradient formation and mixing performance compared to polymeric/glass channels.176 In other words, in order to obtain the same dispersion width, the length of the paper channel can be shorter than a conventional micro-channel with the same channel width, dye solution, and flow velocity.176 In multi-dimensional devices, streams join in subsequential steps from vertical and horizontal channels with different feed patterns, resulting in faster mixing.177 3D channels allow moving through the thickness as well as the surface of the paper, minimizing the sample loss as a result of swelling of paper.45 Passive mixing methods try to mix liquids by bringing multiple fluid streams to a channel, increasing interface area between flow streams, or by manipulating the flow using obstacle-based mixers (e.g., herringbone or serpentine structures) embedded in the channel, without utilizing external force.177,178 Passive mixing is appealing since no extra equipment and power sources are needed, leading to more portable and inexpensive devices. Moreover, as the number of working components reduces, the reliability of the final product increases.179 Y- and T-junctions are the most common passive mixing means.179 It was demonstrated that in order to obtain the same dispersion width, the length of the paper channel can be shorter than a conventional micro-channel with the same channel width, dye solution, and flow velocity.176 Active systems force the flow to behave in the desired manner using pumps, temperature, pressure, electrical and acoustic fields, rather than relying on the geometry of the inner structure of the paper.179 Utilizing active fluid transport techniques demand extra equipment and external power sources, contradicting the simple, portable, and low-cost nature of paper-based devices. However, active approaches offer more control over the flow (i.e., prevents nonuniformities and backflow which are common in passive capillary-based devices) and more effective mixing, amplifying the functionality of the device for a wider range of tests.165 Furthermore, recent technological advancements provide miniaturized, inexpensive battery-driven circuits to be integrated with paper-based devices without forfeiting cost-effectiveness and portability. Surface actuated waves (SAW) was integrated with paper-based devices to induce uniform mixing in a Y-junction channel.165 As a result, the flow speed was increased, shortening the processing time as well as alleviating the evaporation and assay dry-out issues. Furthermore, backflow was prevented while the mixing efficiency was improved compared to passive mixing.165 Since not all of the various aspects of flow in porous substrates are known, analytical and experimental studies of details of sample distribution in intricate 3D paper geometries could be a conceivable topic for future research to improve the performance of μPADs, as well as to increase the impact of μPADs on biomedical applications.
VI. PAPER-BASED MICROFLUIDIC DEVICES AND COMMERCIALIZATION
There are numerous challenges that are faced when designing paper-based microfluidic devices; however, in order for the creation of these devices to be successful, it is crucial that they are able to penetrate into larger markets. This requires the need for a decrease in the total fabrication costs of the device as well as larger packing densities of the assays and closely packed features and a decrease in the amount of the reagents required for the robust functioning of devices.180 To minimize the cost of these devices, streamlined fabrication techniques must be developed. In parallel with new fabrication approaches, cost-efficient flexible materials should be developed with a higher level of control in the deposition physics and fiber orientation through its thickness that can eliminate uncontrolled diffusion. Finally, the highest cost for microfluidic paper-based devices is often due to the required samples and reagents. Thus, it is important to minimize the sample size and reagents for the devices, especially while additional limitations related to the quantification of assays posed by the minimization of the assay areas are no longer an issue due to increased capabilities of smartphones.181–185
User acceptance is another challenge in commercializing a product. Although there are studies on aiding the design workflow and production of the paper-based assays through web-based interfaces,89 as for now, the end-users of these devices are not incorporated in the design process. However, there are many factors that would affect the design of these devices, such as cost and field in use (Fig. 26). Each of these factors would pose different challenges for the acceptance of the end-users. User-centered design approaches could be implemented to overcome these challenges.186 The user-centered design ensures a product meets the needs of its end-user by including them in the design process. In this regard, the researchers should conduct focus group interviews187 with their target users to learn their needs according to the presented factors and conduct participatory design workshops188 to design the proof of concept paper-based assay prototypes that are specifically designed for their end-users. Following this, the end products should be tested through usability methods189 with the target users to pinpoint if they meet the expectations. The outcome of the user-centered design process is proven to produce user adopted commercial products.190,191 As a result of the whole process, guidelines192 and a framework to design commercial paper-based assays would be created to ensure the market penetration of these devices.
FIG. 26.
Several factors should be considered in the design procedure of PADs, namely, cost, environmental issues, readout, and legislation. As for the cost factor, increasing the packing density of microfluidic assays not only reduces the used material but also decreases the needed volume of samples (e.g., blood, tear, urine) and reagents, which usually are of a high cost. Regarding the environmental viewpoint, a designer should bear in mind the availability of facilities in the test place. For example, whether the designed device is going to be used in a house, a small clinic, or a well-equipped hospital. Answering these questions in advance can determine the features of the proposed design and enable faster adoption. The readout is of great importance since the designed device should adequately display the test result by different means including quantitative, colorimetric, electrochemical, and chemiluminescent. Designers should envisage the nature of the test and the proficiency of the end-user to select the most suitable readout method. Also, extra expenses imposed by adding more complicated readout techniques as well as its impact on the final size should be considered to have a balance between the selected readout method and cost-effectiveness as well as portability. Last but not the least, legal issues should be considered. Receiving approvals from official institutions (e.g., FDA and WHO) is crucial to ensure users' health and adequate quality of products. Moreover, the privacy of users and the data obtained from them should be guaranteed.
Additionally, focusing on market entry routes and customer development methodology can be done in parallel with product development.193 Some of the other barriers for commercializing the paper-based devices are (1) process integration, (2) manufacturing at scale, (3) clinical validation, (4) recognizing the social impact, and (5) complying with medical device regulations.1 Process integration is uniting multiple basic operations into a single system which leads to a simplified operation with higher usability. For commercializing purposes, the scalability of the manufacturing technologies is a vital issue which should be considered in the early stages of product development in order to ensure a streamlined transition from the prototype to the final product.194,195 This scalability needs to be considered in the stages of material selection, device design/prototyping, and development/selection of fabrication method.1 Some of the concerns that should be considered if a device is going to be commercialized: if the device requires pumps or a voltage supply to operate, if specific computer software is needed to be learned by the user to analyze and interpret the results, and if any sample pretreatment is required for the biological assay. Devices which are not self-contained and require prior sample preparations unlikely to have high market penetration. Therefore, fully automated devices that reduce errors and minimize the need for user interpretation are more likely to be chosen by customers.196 Clinical validation is essential for translation, since patient samples can exhibit different behavior in devices compared to the model samples used for proof-of-concept testing. Certifying all facilities performing testing on human specimens is mandatory in the United States; they must be certified under the Clinical Laboratory Improvement Amendments of 1988 (CLIA). Complying with regulatory policies is a major barrier for commercialization. Besides these regulatory controls, ISO 13485 certification is also needed to ensure the quality of tests in all stages of the manufacturing process from fabrication, packaging, labeling, storage, installation, and service.1 Overall, by developing fabrication techniques that minimize costs, creating large packing densities, and decreasing the required amount of samples and reagents, paper-based microfluidic devices will be able to successfully reach larger markets and pave the way for point-of-care health monitoring in resource-limited settings.
AUTHORS' CONTRIBUTIONS
E.B. and F.G. contributed equally to this work.
ACKNOWLEDGMENTS
S.T. acknowledges Tubitak 2232 International Fellowship for Outstanding Researchers Award (No. 118C391), Alexander von Humboldt Research Fellowship for Experienced Researchers, Marie Skłodowska-Curie Individual Fellowship (No. 101003361), and Royal Academy Newton-Katip Çelebi Transforming Systems Through Partnership Award (No. 120N019) for financial support of this research. Opinions, interpretations, conclusions, and recommendations are those of the author and are not necessarily endorsed by the TÜBİTAK. The authors have no other relevant affiliations or financial involvement with any organization or entity with a financial interest in or financial conflict with the subject matter or materials discussed in the manuscript apart from those disclosed.
CONFLICT OF INTEREST
Authors do not have any conflict of interest with the material presented here.
DATA AVAILABILITY
Data sharing is not applicable to this article as no new data were created or analyzed in this study.
REFERENCES
- 1.Gong M. M. and Sinton D., Chem. Rev. 117, 8447 (2017). 10.1021/acs.chemrev.7b00024 [DOI] [PubMed] [Google Scholar]
- 2.Gates B., New Engl. J. Med. 372, 1381 (2015). 10.1056/NEJMp1502918 [DOI] [PubMed] [Google Scholar]
- 3.Noviana E., Carrão D. B., Pratiwi R., and Henry C. S., Anal. Chim. Acta 1116, 70 (2020). 10.1016/j.aca.2020.03.013 [DOI] [PubMed] [Google Scholar]
- 4.Wang L. and McCord B., Anal. Biochem. 595, 113619 (2020). 10.1016/j.ab.2020.113619 [DOI] [PubMed] [Google Scholar]
- 5.Nosrati R., Graham P. J., Zhang B., Riordon J., Lagunov A., Hannam T. G., Escobedo C., Jarvi K., and Sinton D., Nat. Rev. Urol. 14, 707 (2017). 10.1038/nrurol.2017.175 [DOI] [PubMed] [Google Scholar]
- 6.Tian L., Morrissey J. J., Kattumenu R., Gandra N., Kharasch E. D., and Singamaneni S., Anal. Chem. 84, 9928 (2012). 10.1021/ac302332g [DOI] [PMC free article] [PubMed] [Google Scholar]
- 7.Martinez A. W., Phillips S. T., Butte M. J., and Whitesides G. M., Angew. Chem. Int. Ed. 46, 1318 (2007). 10.1002/anie.200603817 [DOI] [PMC free article] [PubMed] [Google Scholar]
- 8.Xu Y., Liu M., Kong N., and Liu J., Microchim. Acta 183, 1521 (2016). 10.1007/s00604-016-1841-4 [DOI] [Google Scholar]
- 9.Ruecha N., Yamada K., Suzuki K., and Citterio D., Materials for Chemical Sensing (Springer, 2017). [Google Scholar]
- 10.Yamada K. and Citterio D., Applications of Microfluidic Systems in Biology and Medicine (Springer, 2019). [Google Scholar]
- 11.Zhang C., Su Y., Liang Y., and Lai W., Biosens. Bioelectron. 168, 112391 (2020). 10.1016/j.bios.2020.112391 [DOI] [PubMed] [Google Scholar]
- 12.Ozer T., McMahon C., and Henry C. S., Annu. Rev. Anal. Chem. 13, 85 (2020). 10.1146/annurev-anchem-061318-114845 [DOI] [PubMed] [Google Scholar]
- 13.Suntornsuk W. and Suntornsuk L., Electrophoresis 41, 287 (2020). 10.1002/elps.201900258 [DOI] [PubMed] [Google Scholar]
- 14.Ferreira F. T. S. M., Mesquita R. B. R., and Rangel A. O. S. S., Talanta 219, 121183 (2020). 10.1016/j.talanta.2020.121183 [DOI] [PubMed] [Google Scholar]
- 15.Hiraoka R., Kuwahara K., Wen Y.-C., Yen T.-H., Hiruta Y., Cheng C.-M., and Citterio D., ACS Sens. 5, 1110 (2020). 10.1021/acssensors.0c00050 [DOI] [PubMed] [Google Scholar]
- 16.Mentele M. M., Cunningham J., Koehler K., Volckens J., and Henry C. S., Anal. Chem. 84, 4474 (2012). 10.1021/ac300309c [DOI] [PubMed] [Google Scholar]
- 17.Marquez S., Liu J., and Morales-Narváez E., Curr. Opin. Environ. Sci. Health 10, 1 (2019). 10.1016/j.coesh.2019.08.002 [DOI] [Google Scholar]
- 18.Dincer C., Bruch R., Costa-Rama E., Fernández-Abedul M. T., Merkoçi A., Manz A., Urban G. A., and Güder F., Adv. Mater. 31, 1806739 (2019). 10.1002/adma.201806739 [DOI] [PubMed] [Google Scholar]
- 19.Jokerst J. C., Adkins J. A., Bisha B., Mentele M. M., Goodridge L. D., and Henry C. S., Anal. Chem. 84, 2900 (2012). 10.1021/ac203466y [DOI] [PubMed] [Google Scholar]
- 20.Zeng L., Liu L., Kuang H., Cui G., and Xu C., Mater. Chem. Front. 3, 2175 (2019). 10.1039/C9QM00429G [DOI] [Google Scholar]
- 21.Almasvandi Z., Vahidinia A., Heshmati A., Zangeneh M. M., Goicoechea H. C., and Jalalvand A. R., RSC Adv. 10, 14422 (2020). 10.1039/C9RA10918H [DOI] [PMC free article] [PubMed] [Google Scholar]
- 22.Prasad A., Tran T., and Gartia M. R., Sensors 19, 1286 (2019). 10.3390/s19061286 [DOI] [PMC free article] [PubMed] [Google Scholar]
- 23.Cramer S. M., Larson T. S., and Lockett M. R., Anal. Chem. 91, 10916 (2019). 10.1021/acs.analchem.9b02102 [DOI] [PMC free article] [PubMed] [Google Scholar]
- 24.Wang J., Li W., Ban L., Du W., Feng X., and Liu B.-F., Sens. Actuators B 254, 855 (2018). 10.1016/j.snb.2017.07.192 [DOI] [Google Scholar]
- 25.Chen Y., Chu W., Liu W., and Guo X., Sens. Actuators B 260, 452 (2018). 10.1016/j.snb.2017.12.197 [DOI] [Google Scholar]
- 26.Wei B., Mao K., Liu N., Zhang M., and Yang Z., Biosens. Bioelectron. 121, 41 (2018). 10.1016/j.bios.2018.08.067 [DOI] [PubMed] [Google Scholar]
- 27.Lim W. Y., Thevarajah T. M., Goh B. T., and Khor S. M., Biosens. Bioelectron. 128, 176 (2019). 10.1016/j.bios.2018.12.049 [DOI] [PubMed] [Google Scholar]
- 28.Parween S. and Asthana A., Sens. Actuators B 285, 405 (2019). 10.1016/j.snb.2019.01.064 [DOI] [Google Scholar]
- 29.Chiang C.-K., Kurniawan A., Kao C.-Y., and Wang M.-J., Talanta 194, 837 (2019). 10.1016/j.talanta.2018.10.104 [DOI] [PubMed] [Google Scholar]
- 30.Wu Y., Xue P., Hui K. M., and Kang Y., Biosens. Bioelectron. 52, 180 (2014). 10.1016/j.bios.2013.08.039 [DOI] [PubMed] [Google Scholar]
- 31.Cate D. M., Adkins J. A., Mettakoonpitak J., and Henry C. S., Anal. Chem. 87, 19 (2015). 10.1021/ac503968p [DOI] [PubMed] [Google Scholar]
- 32.Xia Y., Si J., and Li Z., Biosens. Bioelectron. 77, 774 (2016). 10.1016/j.bios.2015.10.032 [DOI] [PubMed] [Google Scholar]
- 33.Yang Y., Noviana E., Nguyen M. P., Geiss B. J., Dandy D. S., and Henry C. S., Anal. Chem. 89, 71 (2017). 10.1021/acs.analchem.6b04581 [DOI] [PubMed] [Google Scholar]
- 34.Lim W. Y., Goh B. T., and Khor S. M., J. Chromatogr. B 1060, 424 (2017). 10.1016/j.jchromb.2017.06.040 [DOI] [PubMed] [Google Scholar]
- 35.Carrell C., Kava A., Nguyen M., Menger R., Munshi Z., Call Z., Nussbaum M., and Henry C., Microelectron. Eng. 206, 45 (2019). 10.1016/j.mee.2018.12.002 [DOI] [Google Scholar]
- 36.Fu L.-M. and Wang Y.-N., Trends Anal. Chem. 107, 196 (2018). 10.1016/j.trac.2018.08.018 [DOI] [Google Scholar]
- 37.Yamada K., Shibata H., Suzuki K., and Citterio D., Lab Chip 17, 1206 (2017). 10.1039/C6LC01577H [DOI] [PubMed] [Google Scholar]
- 38.Park M., Kang B.-H., and Jeong K.-H., BioChip J. 12, 1 (2018). 10.1007/s13206-017-2101-3 [DOI] [Google Scholar]
- 39.Lantigua D., Kelly Y. N., Unal B., and Camci-Unal G., Adv. Healthcare Mater. 6, 1700619 (2017). 10.1002/adhm.201700619 [DOI] [PubMed] [Google Scholar]
- 40.Shrivastava S., Trung T. Q., and Lee N.-E., Chem. Soc. Rev. 49, 1812 (2020). 10.1039/C9CS00319C [DOI] [PubMed] [Google Scholar]
- 41.Li F., You M., Li S., Hu J., Liu C., Gong Y., Yang H., and Xu F., Biotechnol. Adv. 39, 107442 (2020). 10.1016/j.biotechadv.2019.107442 [DOI] [PubMed] [Google Scholar]
- 42.Morbioli G. G., Mazzu-Nascimento T., Stockton A. M., and Carrilho E., Anal. Chim. Acta 970, 1 (2017). 10.1016/j.aca.2017.03.037 [DOI] [PubMed] [Google Scholar]
- 43.Martinez A. W., Phillips S. T., Whitesides G. M., and Carrilho E., Anal. Chem. 82, 3–10 (2010). 10.1021/ac9013989 [DOI] [PubMed] [Google Scholar]
- 44.Mahmud M. A., Blondeel E. J., Kaddoura M., and MacDonald B. D., Analyst 141, 6449 (2016). 10.1039/C6AN02208A [DOI] [PubMed] [Google Scholar]
- 45.Yetisen A. K., Akram M. S., and Lowe C. R., Lab Chip 13, 2210 (2013). 10.1039/c3lc50169h [DOI] [PubMed] [Google Scholar]
- 46.Yamada K., Henares T. G., Suzuki K., and Citterio D., Angew. Chem. Int. Ed. 54, 5294 (2015). 10.1002/anie.201411508 [DOI] [PubMed] [Google Scholar]
- 47.Xie G.-L., Yu H., Deng M.-H., Zhao X.-L., and Yu P., Chem. Pap. 73, 1509 (2019). 10.1007/s11696-019-00702-3 [DOI] [Google Scholar]
- 48.Deng M., Liao C., Wang X., Chen S., Qi F., Zhao X., and Yu P., Can. J. Chem. 97, 373 (2019). 10.1139/cjc-2018-0346 [DOI] [Google Scholar]
- 49.He Q., Ma C., Hu X., and Chen H. J. A. c., Anal. Chem. 85, 1327 (2013). 10.1021/ac303138x [DOI] [PubMed] [Google Scholar]
- 50.Abe K., Suzuki K., and Citterio D., Anal. Chem. 80, 6928 (2008). 10.1021/ac800604v [DOI] [PubMed] [Google Scholar]
- 51.Olkkonen J., Lehtinen K., and Erho T., Anal. Chem. 82, 10246 (2010). 10.1021/ac1027066 [DOI] [PubMed] [Google Scholar]
- 52.Liu H., Zhou X., Liu W., Yang X., and Xing D., Anal. Chem. 88, 10191 (2016). 10.1021/acs.analchem.6b02772 [DOI] [PubMed] [Google Scholar]
- 53.Scordo G., Moscone D., Palleschi G., and Arduini F., Sens. Actuators B Chem. 258, 1015 (2018). 10.1016/j.snb.2017.11.134 [DOI] [Google Scholar]
- 54.Nie J., Liang Y., Zhang Y., Le S., Li D., and Zhang S., Analyst 138, 671 (2013). 10.1039/C2AN36219H [DOI] [PubMed] [Google Scholar]
- 55.Naseri M., Simon G. P., and Batchelor W., Anal. Chem. 92, 7307 (2020). 10.1021/acs.analchem.0c01003 [DOI] [PubMed] [Google Scholar]
- 56.He P. J. W., Katis I. N., Kumar A. J. U., Bryant C. A., Keevil C. W., Somani B. K., Mahobia N., Eason R. W., and Sones C. L., Biosens. Bioelectron. 152, 112008 (2020). 10.1016/j.bios.2020.112008 [DOI] [PubMed] [Google Scholar]
- 57.Ghaderinezhad F., Amin R., Temirel M., Yenilmez B., Wentworth A., and Tasoglu S., Sci. Rep. 7, 1 (2017). 10.1038/s41598-017-02931-6 [DOI] [PMC free article] [PubMed] [Google Scholar]
- 58.Amin R., Ghaderinezhad F., Li L., Lepowsky E., Yenilmez B., Knowlton S., and Tasoglu S., Anal. Chem. 89, 6351 (2017). 10.1021/acs.analchem.7b01418 [DOI] [PubMed] [Google Scholar]
- 59.Amin R., Ghaderinezhad F., Bridge C., Temirel M., Jones S., Toloueinia P., and Tasoglu S., Micromachines 11, 611 (2020). 10.3390/mi11060611 [DOI] [PMC free article] [PubMed] [Google Scholar]
- 60.Sharifi H., Tashkhourian J., and Hemmateenejad B., Anal. Chim. Acta 1126, 114 (2020). 10.1016/j.aca.2020.06.006 [DOI] [PubMed] [Google Scholar]
- 61.Qin X., Wu T., Zhu Y., Shan X., Liu C., and Tao N., Anal. Chem. 92, 8480 (2020). 10.1021/acs.analchem.0c01240 [DOI] [PubMed] [Google Scholar]
- 62.Rengaraj S., Cruz-Izquierdo Á, Scott J. L., and Di Lorenzo M., Sens. Actuators B Chem. 265, 50 (2018). 10.1016/j.snb.2018.03.020 [DOI] [Google Scholar]
- 63.Zhang J., Yang Z., Liu Q., and Liang H., Talanta 202, 384 (2019). 10.1016/j.talanta.2019.05.031 [DOI] [PubMed] [Google Scholar]
- 64.Shrivas K., Sahu B., Deb M. K., Thakur S. S., Sahu S., Kurrey R., Kant T., Patle T. K., and Jangde R., Microchem. J. 150, 104156 (2019). 10.1016/j.microc.2019.104156 [DOI] [Google Scholar]
- 65.Wang H., Vagin S. I., Rieger B., and Meldrum A., ACS Appl. Mater. Interfaces 12, 20507 (2020). 10.1021/acsami.0c03405 [DOI] [PubMed] [Google Scholar]
- 66.Tai H., Duan Z., Wang Y., Wang S., and Jiang Y., ACS Appl. Mater. Interfaces 12, 31037–31053 (2020). 10.1021/acsami.0c06435 [DOI] [PubMed] [Google Scholar]
- 67.Dabhade A., Jayaraman S., and Paramasivan B., Prep. Biochem. Biotechnol. 50, 849–856 (2020). 10.1080/10826068.2020.1760883 [DOI] [PubMed] [Google Scholar]
- 68.Kirk K. A. and Andreescu S., Anal. Chem. 91, 13892 (2019). 10.1021/acs.analchem.9b03385 [DOI] [PubMed] [Google Scholar]
- 69.Kasoju A., Shrikrishna N. S., Shahdeo D., Khan A. A., Alanazi A. M., and Gandhi S., RSC Adv. 10, 11843 (2020). 10.1039/D0RA00062K [DOI] [PMC free article] [PubMed] [Google Scholar]
- 70.Pena-Pereira F., Matesanz Ó, Lavilla I., and Bendicho C., J. Sep. Sci. 43, 1908 (2020). 10.1002/jssc.201901339 [DOI] [PubMed] [Google Scholar]
- 71.Puiu M. and Bala C., Trends Anal. Chem. 125, 115831 (2020). 10.1016/j.trac.2020.115831 [DOI] [Google Scholar]
- 72.Trofimchuk E., Hu Y., Nilghaz A., Hua M. Z., Sun S., and Lu X., Food Chem. 316, 126396 (2020). 10.1016/j.foodchem.2020.126396 [DOI] [PubMed] [Google Scholar]
- 73.Ma L., Nilghaz A., Choi J. R., Liu X., and Lu X., Food Chem. 246, 437 (2018). 10.1016/j.foodchem.2017.12.022 [DOI] [PubMed] [Google Scholar]
- 74.Pang B., Zhao C., Li L., Song X., Xu K., Wang J., Liu Y., Fu K., Bao H., Song D., Meng X., Qu X., Zhang Z., and Li J., Anal. Biochem. 542, 58 (2018). 10.1016/j.ab.2017.11.010 [DOI] [PubMed] [Google Scholar]
- 75.Felix F. S., Baccaro A. L., and Angnes L., Sensors 18, 4124 (2018). 10.3390/s18124124 [DOI] [PMC free article] [PubMed] [Google Scholar]
- 76.Choudhary A., Brighu U., and Saxena K., Paper Microfluidics (Springer, 2019). [Google Scholar]
- 77.Choi J. R., Yong K. W., Choi J. Y., and Cowie A. C., Sensors 19, 817 (2019). 10.3390/s19040817 [DOI] [Google Scholar]
- 78.Gao H., Yan C., Wu W., and Li J., Sensors 20, 1792 (2020). 10.3390/s20061792 [DOI] [PMC free article] [PubMed] [Google Scholar]
- 79.Tao X., Jia H., He Y., Liao S., and Wang Y., ACS Sensors 2, 449 (2017). 10.1021/acssensors.7b00060 [DOI] [PubMed] [Google Scholar]
- 80.Khiabani P. S., Soeriyadi A. H., Reece P. J., and Gooding J. J., ACS Sensors 1, 775 (2016). 10.1021/acssensors.6b00244 [DOI] [Google Scholar]
- 81.Fortunato E., Correia N., Barquinha P., Pereira L., Goncalves G., and Martins R., IEEE Electron Device Lett. 29, 988 (2008). 10.1109/LED.2008.2001549 [DOI] [Google Scholar]
- 82.Zhang L., Zhou M., Wen D., Bai L., Lou B., and Dong S., Biosens. Bioelectron. 35, 155 (2012). 10.1016/j.bios.2012.02.035 [DOI] [PubMed] [Google Scholar]
- 83.Arena A., Donato N., Saitta G., Bonavita A., Rizzo G., and Neri G., Sens. Actuators B Chem. 145, 488 (2010). 10.1016/j.snb.2009.12.053 [DOI] [Google Scholar]
- 84.Nie Z., Deiss F., Liu X., Akbulut O., and Whitesides G. M., Lab Chip 10, 3163 (2010). 10.1039/c0lc00237b [DOI] [PMC free article] [PubMed] [Google Scholar]
- 85.Schilling K. M., Lepore A. L., Kurian J. A., and Martinez A. W., Anal. Chem. 84, 1579 (2012). 10.1021/ac202837s [DOI] [PubMed] [Google Scholar]
- 86.Cheng C. M., Martinez A. W., Gong J., Mace C. R., Phillips S. T., Carrilho E., Mirica K. A., and Whitesides G. M., Angew. Chem. Int. Ed. 49, 4771 (2010). 10.1002/anie.201001005 [DOI] [PubMed] [Google Scholar]
- 87.Lappalainen T., Vento P., Teerinen T., Erho T., and Hakalahti L., Nord. Pulp Pap. Res. J. 25, 536 (2010). 10.3183/npprj-2010-25-04-p529-543 [DOI] [Google Scholar]
- 88.Martinez A. W., Phillips S. T., and Whitesides G. M., Proc. Natl. Acad. Sci. U.S.A. 105, 19606 (2008). 10.1073/pnas.0810903105 [DOI] [PMC free article] [PubMed] [Google Scholar]
- 89.Sanka R., Lippai J., Samarasekera D., Nemsick S., and Densmore D., Sci. Rep. 9, 1 (2019). 10.1038/s41598-019-45623-z [DOI] [PMC free article] [PubMed] [Google Scholar]
- 90.Bhattacharya S., Kumar S., and Agarwal A. K., Paper Microfluidics (Springer, 2019). [Google Scholar]
- 91.Hou X., Zhang Y. S., Santiago G. T.-d., Alvarez M. M., Ribas J., Jonas S. J., Weiss P. S., Andrews A. M., Aizenberg J., and Khademhosseini A., Nat. Rev. Mater. 2, 17016 (2017). 10.1038/natrevmats.2017.16 [DOI] [PMC free article] [PubMed] [Google Scholar]
- 92.Camplisson C. K., Schilling K. M., Pedrotti W. L., Stone H. A., and Martinez A. W., Lab Chip 15, 4461 (2015). 10.1039/C5LC01115A [DOI] [PubMed] [Google Scholar]
- 93.Li X., Ballerini D. R., and Shen W., Biomicrofluidics 6, 011301 (2012). 10.1063/1.3687398 [DOI] [PMC free article] [PubMed] [Google Scholar]
- 94.Walji N. and MacDonald B. D., Micromachines 7, 73 (2016). 10.3390/mi7050073 [DOI] [PMC free article] [PubMed] [Google Scholar]
- 95.Lamas-Ardisana P. J., Martínez-Paredes G., Añorga L., and Grande H.-J., Electrochem. Commun. 101, 6 (2019). 10.1016/j.elecom.2019.02.015 [DOI] [Google Scholar]
- 96.Zhang C. and Xing D., Microfluid. Nanofluid. 9, 17 (2010). 10.1007/s10404-009-0508-4 [DOI] [Google Scholar]
- 97.Renault C., Koehne J., Ricco A. J., and Crooks R. M., Langmuir 30, 7030 (2014). 10.1021/la501212b [DOI] [PubMed] [Google Scholar]
- 98.Tenda K., Ota R., Yamada K., Henares T. G., Suzuki K., and Citterio D., Micromachines 7, 80 (2016). 10.3390/mi7050080 [DOI] [PMC free article] [PubMed] [Google Scholar]
- 99.Yamada K., Takaki S., Komuro N., Suzuki K., and Citterio D., Analyst 139, 1637 (2014). 10.1039/c3an01926h [DOI] [PubMed] [Google Scholar]
- 100.Jain S., Rajasingham R., Noubary F., Coonahan E., Schoeplein R., Baden R., Curry M., Afdhal N., Kumar S., and Pollock N. R., PLoS One 10, e0128118 (2015). 10.1371/journal.pone.0128118 [DOI] [PMC free article] [PubMed] [Google Scholar]
- 101.Strong E. B., Schultz S. A., Martinez A. W., and Martinez N. W., Sci. Rep. 9, 1 (2019). 10.1038/s41598-018-37186-2 [DOI] [PMC free article] [PubMed] [Google Scholar]
- 102.Akyazi T., Basabe-Desmonts L., and Benito-Lopez F., Anal. Chim. Acta 1001, 1 (2018). 10.1016/j.aca.2017.11.010 [DOI] [PubMed] [Google Scholar]
- 103.Mace C. R. and Deraney R. N., Microfluid Nanofluid. 16, 801 (2014). 10.1007/s10404-013-1314-6 [DOI] [Google Scholar]
- 104.Nguyen D., Taylor D., Qian K., Norouzi N., Rasmussen J., Botzet S., Lehmann M., Halverson K., and Khine M., Lab Chip 10, 1623 (2010). 10.1039/c001082k [DOI] [PubMed] [Google Scholar]
- 105.Lee H. and Choi S., Nano Energy 15, 549 (2015). 10.1016/j.nanoen.2015.05.019 [DOI] [Google Scholar]
- 106.Lang R. J., Phys. World 20, 30 (2007). 10.1088/2058-7058/20/2/31 [DOI] [Google Scholar]
- 107.Morgan J., Magleby S. P., Lang R. J., and Howell L. L., in International Design Engineering Technical Conferences and Computers and Information in Engineering Conference (ASME, 2015). [Google Scholar]
- 108.Liu H., Xiang Y., Lu Y., and Crooks R. M., Angew. Chem. Int. Ed. 51, 6925 (2012). 10.1002/anie.201202929 [DOI] [PMC free article] [PubMed] [Google Scholar]
- 109.Yakoh A., Chaiyo S., Siangproh W., and Chailapakul O., ACS Sens. 4, 1211 (2019). 10.1021/acssensors.8b01574 [DOI] [PubMed] [Google Scholar]
- 110.Ding J., Li B., Chen L., and Qin W., Angew. Chem. Int. Ed. 55, 13033 (2016). 10.1002/anie.201606268 [DOI] [PubMed] [Google Scholar]
- 111.Morbioli G. G., Mazzu-Nascimento T., Milan L. A., Stockton A. M., and Carrilho E., Anal. Chem. 89, 4786 (2017). 10.1021/acs.analchem.6b04953 [DOI] [PubMed] [Google Scholar]
- 112.Luo L., Li X., and Crooks R. M., Anal. Chem. 86, 12390 (2014). 10.1021/ac503976c [DOI] [PubMed] [Google Scholar]
- 113.Lu J., Ge S., Ge L., Yan M., and Yu J., Electrochim. Acta 80, 334 (2012). 10.1016/j.electacta.2012.07.024 [DOI] [Google Scholar]
- 114.Ge L., Wang S., Song X., Ge S., and Yu J., Lab Chip 12, 3150 (2012). 10.1039/c2lc40325k [DOI] [PubMed] [Google Scholar]
- 115.Fischer C., Fraiwan A., and Choi S., Biosens. Bioelectron. 79, 193 (2016). 10.1016/j.bios.2015.12.020 [DOI] [PubMed] [Google Scholar]
- 116.Choi S., Kim S.-K., Lee G.-J., and Park H.-K., Sens. Actuators B Chem. 219, 245 (2015). 10.1016/j.snb.2015.05.035 [DOI] [Google Scholar]
- 117.Li L., Li W., Yang H., Ma C., Yu J., Yan M., and Song X., Electrochim. Acta 120, 102 (2014). 10.1016/j.electacta.2013.12.076 [DOI] [Google Scholar]
- 118.Li L., Xu J., Zheng X., Ma C., Song X., Ge S., Yu J., and Yan M., Biosens. Bioelectron. 61, 76 (2014). 10.1016/j.bios.2014.05.012 [DOI] [PubMed] [Google Scholar]
- 119.Santhiago M., Henry C. S., and Kubota L. T., Electrochim. Acta 130, 771 (2014). 10.1016/j.electacta.2014.03.109 [DOI] [Google Scholar]
- 120.Jayawardane B. M., Wei S., McKelvie I. D., and Kolev S. D., Anal. Chem. 86, 7274 (2014). 10.1021/ac5013249 [DOI] [PubMed] [Google Scholar]
- 121.Liu H. and Crooks R. M., J. Am. Chem. Soc. 133, 17564 (2011). 10.1021/ja2071779 [DOI] [PubMed] [Google Scholar]
- 122.Scida K., Li B., Ellington A. D., and Crooks R. M., Anal. Chem. 85, 9713 (2013). 10.1021/ac402118a [DOI] [PMC free article] [PubMed] [Google Scholar]
- 123.Kalish B. and Tsutsui H., Lab Chip 14, 4354 (2014). 10.1039/C4LC00730A [DOI] [PubMed] [Google Scholar]
- 124.Sechi D., Greer B., Johnson J., and Hashemi N., Anal. Chem. 85, 10733 (2013). 10.1021/ac4014868 [DOI] [PubMed] [Google Scholar]
- 125.de Oliveira R. A., Camargo F., Pesquero N. C., and Faria R. C., Anal. Chim. Acta 957, 40 (2017). 10.1016/j.aca.2017.01.002 [DOI] [PubMed] [Google Scholar]
- 126.Martinez A. W., Phillips S. T., Nie Z., Cheng C.-M., Carrilho E., Wiley B. J., and Whitesides G. M., Lab Chip 10, 2499 (2010). 10.1039/c0lc00021c [DOI] [PubMed] [Google Scholar]
- 127.Pollock N. R., Rolland J. P., Kumar S., Beattie P. D., Jain S., Noubary F., Wong V. L., Pohlmann R. A., Ryan U. S., and Whitesides G. M., Sci. Transl. Med. 4, 152ra129 (2012). 10.1126/scitranslmed.3003981 [DOI] [PMC free article] [PubMed] [Google Scholar]
- 128.Zang D., Ge L., Yan M., Song X., and Yu J., Chem. Commun. 48, 4683 (2012). 10.1039/c2cc16958d [DOI] [PubMed] [Google Scholar]
- 129.Liu X., Cheng C., Martinez A., Mirica K., Li X., Phillips S., Mascarenas M., and Whitesides G., in 2011 IEEE 24th International Conference on Micro Electro Mechanical Systems (IEEE, 2011). [Google Scholar]
- 130.Noh H. and Phillips S. T., Anal. Chem. 82, 4181 (2010). 10.1021/ac100431y [DOI] [PubMed] [Google Scholar]
- 131.Rattanarat P., Dungchai W., Cate D., Volckens J., Chailapakul O., and Henry C. S., Anal. Chem. 86, 3555 (2014). 10.1021/ac5000224 [DOI] [PubMed] [Google Scholar]
- 132.Han K. N., Choi J.-S., and Kwon J., Sci. Rep. 6, 1 (2016). 10.1038/s41598-016-0001-8 [DOI] [PMC free article] [PubMed] [Google Scholar]
- 133.Park J. and Park J.-K., Sens. Actuators B Chem. 246, 1049 (2017). 10.1016/j.snb.2017.02.150 [DOI] [Google Scholar]
- 134.Lewis G. G., DiTucci M. J., and Phillips S. T., Angew. Chem. Int. Ed. 51, 12707 (2012). 10.1002/anie.201207239 [DOI] [PubMed] [Google Scholar]
- 135.Lewis G. G., DiTucci M. J., Baker M. S., and Phillips S. T., Lab Chip 12, 2630 (2012). 10.1039/c2lc40331e [DOI] [PubMed] [Google Scholar]
- 136.Thom N. K., Lewis G. G., Yeung K., and Phillips S. T., RSC Adv. 4, 1334 (2014). 10.1039/C3RA44717K [DOI] [PMC free article] [PubMed] [Google Scholar]
- 137.Schonhorn J. E., Fernandes S. C., Rajaratnam A., Deraney R. N., Rolland J. P., and Mace C. R., Lab Chip 14, 4653 (2014). 10.1039/C4LC00876F [DOI] [PubMed] [Google Scholar]
- 138.Wang H., Li Y.-j., Wei J.-f., Xu J.-r., Wang Y.-h., and Zheng G.-x., Anal. Bioanal. Chem. 406, 2799 (2014). 10.1007/s00216-014-7715-x [DOI] [PubMed] [Google Scholar]
- 139.He Y., Gao Q., Wu W.-B., Nie J., and Fu J.-Z., Micromachines 7, 108 (2016). 10.3390/mi7070108 [DOI] [PMC free article] [PubMed] [Google Scholar]
- 140.Casals-Terré J., Farré-Lladós J., Zuñiga A., Roncero M. B., and Vidal T., 3D Print Addit. Manuf. 4, 231 (2017). 10.1089/3dp.2017.0042 [DOI] [Google Scholar]
- 141.Thuo M. M., Martinez R. V., Lan W.-J., Liu X., Barber J., Atkinson M. B., Bandarage D., Bloch J.-F., and Whitesides G. M., Chem. Mater. 26, 4230 (2014). 10.1021/cm501596s [DOI] [Google Scholar]
- 142.Fang X., Wei S., and Kong J., Lab Chip 14, 911 (2014). 10.1039/c3lc51246k [DOI] [PubMed] [Google Scholar]
- 143.Yu L. and Shi Z. Z., Lab Chip 15, 1642 (2015). 10.1039/C5LC00044K [DOI] [PubMed] [Google Scholar]
- 144.He P. J., Katis I. N., Eason R. W., and Sones C. L., Biomicrofluidics 9, 026503 (2015). 10.1063/1.4919629 [DOI] [PMC free article] [PubMed] [Google Scholar]
- 145.He P., Katis I., Eason R., and Sones C., Lab Chip 16, 3296 (2016). 10.1039/C6LC00789A [DOI] [PubMed] [Google Scholar]
- 146.Carrilho E., Phillips S. T., Vella S. J., Martinez A. W., and Whitesides G. M., Anal. Chem. 81, 5990 (2009). 10.1021/ac900847g [DOI] [PubMed] [Google Scholar]
- 147.Li B., Qi J., Fu L., Han J., Choo J., deMello A. J., Lin B., and Chen L., Biosens. Bioelectron. 165, 112282 (2020). 10.1016/j.bios.2020.112282 [DOI] [PubMed] [Google Scholar]
- 148.Jiao Y., Du C., Zong L., Guo X., Han Y., Zhang X., Li L., Zhang C., Ju Q., Liu J., Yu H.-D., and Huang W., Sens. Actuators B Chem. 306, 127239 (2020). 10.1016/j.snb.2019.127239 [DOI] [Google Scholar]
- 149.Lu Y., Shi W., Qin J., and Lin B., Anal. Chem. 82, 329 (2010). 10.1021/ac9020193 [DOI] [PubMed] [Google Scholar]
- 150.Wang P., Ge L., Yan M., Song X., Ge S., and Yu J., Biosens. Bioelectron. 32, 238 (2012). 10.1016/j.bios.2011.12.021 [DOI] [PubMed] [Google Scholar]
- 151.Zhang Y., Zhou C., Nie J., Le S., Qin Q., Liu F., Li Y., and Li J., Anal. Chem. 86, 2005 (2014). 10.1021/ac403026c [DOI] [PubMed] [Google Scholar]
- 152.Zhang Y., Ge L., Li M., Yan M., Ge S., Yu J., Song X., and Cao B., Chem. Commun. 50, 1417 (2014). 10.1039/C3CC48421A [DOI] [PubMed] [Google Scholar]
- 153.Mosadegh B., Dabiri B. E., Lockett M. R., Derda R., Campbell P., Parker K. K., and Whitesides G. M., Adv. Healthcare Mater. 3, 1036 (2014). 10.1002/adhm.201300575 [DOI] [PMC free article] [PubMed] [Google Scholar]
- 154.Zhang M., Ge L., Ge S., Yan M., Yu J., Huang J., and Liu S., Biosens. Bioelectron. 41, 544 (2013). 10.1016/j.bios.2012.09.022 [DOI] [PubMed] [Google Scholar]
- 155.Yan J., Ge L., Song X., Yan M., Ge S., and Yu J., Chem. Eur. J. 18, 4938 (2012). 10.1002/chem.201102855 [DOI] [PubMed] [Google Scholar]
- 156.Wang S., Ge L., Zhang Y., Song X., Li N., Ge S., and Yu J., Lab Chip 12, 4489 (2012). 10.1039/c2lc40707h [DOI] [PubMed] [Google Scholar]
- 157.Strong E. B., Kirschbaum C. W., Martinez A. W., and Martinez N. W., Cellulose 25, 3211 (2018). 10.1007/s10570-018-1805-4 [DOI] [Google Scholar]
- 158.Reis N. C. Jr, Griffiths R. F., and Santos J. M., J. Comput. Phys. 198, 747 (2004). 10.1016/j.jcp.2004.01.024 [DOI] [Google Scholar]
- 159.Choi M., Son G., and Shim W., Comput Fluids 145, 153 (2017). 10.1016/j.compfluid.2016.12.014 [DOI] [Google Scholar]
- 160.Choi M., Son G., and Shim W., Int. Commun. Heat Mass Transf. 80, 18 (2017). 10.1016/j.icheatmasstransfer.2016.11.002 [DOI] [Google Scholar]
- 161.Smith S., Korvink J. G., Mager D., and Land K., RSC Adv. 8, 34012 (2018). 10.1039/C8RA06132G [DOI] [PMC free article] [PubMed] [Google Scholar]
- 162.Jang I., Kim G., and Song S., Int. J. Heat Mass Transfer 120, 830 (2018). 10.1016/j.ijheatmasstransfer.2017.12.078 [DOI] [Google Scholar]
- 163.Ota R., Yamada K., Suzuki K., and Citterio D., Analyst 143, 643 (2018). 10.1039/C7AN01702B [DOI] [PubMed] [Google Scholar]
- 164.Schaumburg F., Urteaga R., Kler P. A., and Berli C. L., J. Chromatogr. 1561, 83 (2018). 10.1016/j.chroma.2018.05.040 [DOI] [PubMed] [Google Scholar]
- 165.Rezk A. R., Qi A., Friend J. R., Li W. H., and Yeo L. Y., Lab Chip 12, 773 (2012). 10.1039/C2LC21065G [DOI] [PubMed] [Google Scholar]
- 166.Joung H.-A., Ballard Z. S., Ma A., Tseng D. K., Teshome H., Burakowski S., Garner O. B., Di Carlo D., and Ozcan A., Lab Chip 19, 1027 (2019). 10.1039/C9LC00011A [DOI] [PubMed] [Google Scholar]
- 167.Jiang N., Ahmed R., Damayantharan M., Ünal B., Butt H., and Yetisen A. K., Adv. Healthcare Mater. 8, 1900244 (2019). 10.1002/adhm.201900244 [DOI] [PubMed] [Google Scholar]
- 168.Ross G., Salentijn G. I., and Nielen M. W., Biosensors 9, 143 (2019). 10.3390/bios9040143 [DOI] [PMC free article] [PubMed] [Google Scholar]
- 169.Anfossi L., Di Nardo F., Cavalera S., Giovannoli C., and Baggiani C., Biosensors 9, 2 (2019). 10.3390/bios9010002 [DOI] [PMC free article] [PubMed] [Google Scholar]
- 170.Zhao Y., Wang H., Zhang P., Sun C., Wang X., Wang X., Yang R., Wang C., and Zhou L., Sci. Rep. 6, 1 (2016). 10.1038/s41598-016-0001-8 [DOI] [PMC free article] [PubMed] [Google Scholar]
- 171.da Silva E. T., Santhiago M., de Souza F. R., Coltro W. K., and Kubota L. T., Lab Chip 15, 1651 (2015). 10.1039/C5LC00022J [DOI] [PubMed] [Google Scholar]
- 172.Giokas D. L., Tsogas G. Z., and Vlessidis A. G., Anal. Chem. 86, 6202 (2014). 10.1021/ac501273v [DOI] [PubMed] [Google Scholar]
- 173.Renault C., Li X., Fosdick S. E., and Crooks R. M., Anal. Chem. 85, 7976 (2013). 10.1021/ac401786h [DOI] [PubMed] [Google Scholar]
- 174.Jahanshahi-Anbuhi S., Chavan P., Sicard C., Leung V., Hossain S. Z., Pelton R., Brennan J. D., and Filipe C. D., Lab Chip 12, 5079 (2012). 10.1039/c2lc41005b [DOI] [PubMed] [Google Scholar]
- 175.Lim H., Jafry A. T., and Lee J., Molecules 24, 2869 (2019). 10.3390/molecules24162869 [DOI] [PMC free article] [PubMed] [Google Scholar]
- 176.Urteaga R., Elizalde E., and Berli C. L., Analyst 143, 2259 (2018). 10.1039/C8AN00149A [DOI] [PubMed] [Google Scholar]
- 177.Bayareh M., Ashani M. N., and Usefian A., Chem. Eng. Process. Process Intensif. 147, 107771 (2020). 10.1016/j.cep.2019.107771 [DOI] [Google Scholar]
- 178.Jang I., Carrão D. B., Menger R. F., Moraes de Oliveira A. R., and Henry C. S., ACS Sens. 5, 2230 (2020). 10.1021/acssensors.0c00937 [DOI] [PubMed] [Google Scholar]
- 179.Green J., Holdø A., and Khan A., Int. J. Multiphys. 1, 1 (2007). 10.1260/175095407780130544 [DOI] [Google Scholar]
- 180.Lepowsky E., Ghaderinezhad F., Knowlton S., and Tasoglu S., Biomicrofluidics 11, 051501 (2017). 10.1063/1.4996768 [DOI] [PMC free article] [PubMed] [Google Scholar]
- 181.Amin R., Knowlton S., Yenilmez B., Hart A., Joshi A., and Tasoglu S., RSC Adv. 6, 93922 (2016). 10.1039/C6RA19483D [DOI] [Google Scholar]
- 182.Knowlton S., Yu C. H., Jain N., Ghiran I. C., and Tasoglu S., PLoS One 10, e0134400 (2015). 10.1371/journal.pone.0134400 [DOI] [PMC free article] [PubMed] [Google Scholar]
- 183.Knowlton S., Joshi A., Syrrist P., Coskun A. F., and Tasoglu S., Lab Chip 17, 2839 (2017). 10.1039/C7LC00706J [DOI] [PubMed] [Google Scholar]
- 184.Knowlton S., Sencan I., Aytar Y., Khoory J., Heeney M., Ghiran I., and Tasoglu S., Sci. Rep. 5, 15022 (2015). 10.1038/srep15022 [DOI] [PMC free article] [PubMed] [Google Scholar]
- 185.Amin R., Knowlton S., Dupont J., Bergholz J. S., Joshi A., Hart A., Yenilmez B., Yu C. H., Wentworth A., and Zhao J. J., J. 3D Print. Med. 1, 155 (2017). 10.2217/3dp-2016-0007 [DOI] [Google Scholar]
- 186.Seffah A., Gulliksen J., and Desmarais M. C., Human-Centered Software Engineering—Integrating Usability in the Software Development Lifecycle (Springer, 2005). [Google Scholar]
- 187.Nuttavuthisit K., “Focus Group Interview,” in Qualitative Consumer and Marketing Research (Springer, Singapore, 2019), pp. 141–164. 10.1007/978-981-13-6142-5_6 [DOI]
- 188.Schuler D. and Namioka A., Participatory Design: Principles and Practices (CRC Press, 1993). [Google Scholar]
- 189.Dumas J. S., Dumas J. S., and Redish J., A Practical Guide to Usability Testing (Intellect Books, 1999). [Google Scholar]
- 190.Macaulay C., Sloan D., Jiang X., Forbes P., Loynton S., Swedlow J. R., and Gregor P., IEEE Software 26, 96 (2009). 10.1109/MS.2009.27 [DOI] [Google Scholar]
- 191.Sawin D. A., Yamazaki K., and Kumaki A., Int. J. Hum. Comput. Interact. 14, 307 (2002). [DOI] [Google Scholar]
- 192.Brown C. M., Human-computer Interface Design Guidelines (Intellect Books, 1999). [Google Scholar]
- 193.Amin R., Joshi A., and Tasoglu S., J. 3D Print. Med. 1, 85 (2017). 10.2217/3dp-2016-0010 [DOI] [Google Scholar]
- 194.Yenilmez B., Knowlton S., Yu C. H., Heeney M. M., and Tasoglu S., Adv. Mater. Technol. 1, 1600100 (2016). 10.1002/admt.201600100 [DOI] [Google Scholar]
- 195.Yenilmez B., Knowlton S., and Tasoglu S., Adv. Mater. Technol. 1, 1600144 (2016). 10.1002/admt.201600144 [DOI] [Google Scholar]
- 196.Volpatti L. R. and Yetisen A. K., Trends Biotechnol. 32, 347 (2014). 10.1016/j.tibtech.2014.04.010 [DOI] [PubMed] [Google Scholar]
Associated Data
This section collects any data citations, data availability statements, or supplementary materials included in this article.
Data Availability Statement
Data sharing is not applicable to this article as no new data were created or analyzed in this study.


