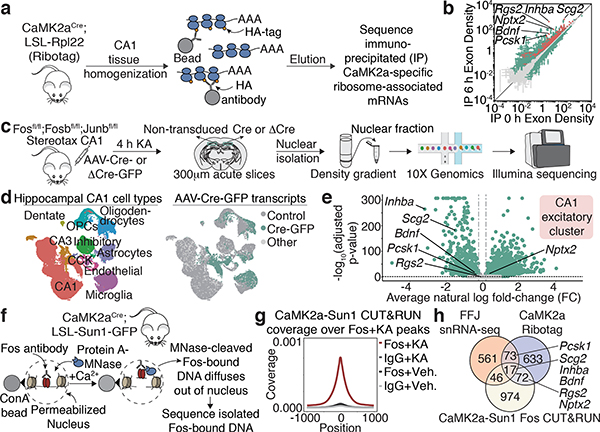
Figure 3. Fos targets in CA1 pyramidal neurons.
a,c,f. Workflow for Ribotag, FFJ snRNA-seq and Fos CUT&RUN (Methods).
b. Scatter plot showing CaMK2a-specific ARGs in 6h post-KA compared to vehicle conditions. Significantly different genes (green); FDR≤0.005. CaMK2a-enriched (IP over input) genes (red). Points represent mean±SE. n=4 mice/bioreplicate; 3 bioreplicates/condition.
d. UMAP visualization of nuclei from Cre+ and control FFJ snRNA-seq with (Left) cell type information or (Right) genotype assignments overlaid. “Control”: Cre— in control hemispheres; “Cre-GFP”: Cre+ in injected hemispheres; “Other”: Cre— or Cre+ in injected or control hemispheres, respectively. n=58,536 cells/6 mice.
e. Volcano plot for genes in CA1 excitatory cluster. Average natural-log fold-change (FC) comparing Cre+ and Cre— (x-axis); —log10 Bonferroni-corrected p-values (y-axis; Wilcoxon rank-sum, two-sided). Each point represents a gene detected in ≥5% of non-transduced cells, where light grey: p≥0.05 (n=3,429); darker grey: FC≤20% in either direction (n=42), green: p<0.05 and FC>20% (n=3,514).
g. Aggregate plot showing spike-in normalized Fos coverage per bin averaged across all Fos peaks (Methods). IgG serves as a specificity control. n=1 mouse/bioreplicate, 3 bioreplicates/condition.
h. Venn diagram showing intersection of significant CA1 PC-specific genes from CaMK2a-Ribotag (FC≥2), snRNA-seq (FC<−20%) and CUT&RUN (Fos peaks within 10 kb from TSS).
(c) Schematic images adapted with permission from Paxinos & Franklin (Elsevier), 10x Genomics and Illumina.

