



Summary
Regeneration is a complex chain of events that restores a tissue to its original size and shape. The tissue-wide coordination of cellular dynamics needed for proper morphogenesis is challenged by the large dimensions of regenerating body parts. Feedback mechanisms in biochemical pathways can provide effective communication across great distances1-5, but how they might regulate growth during tissue regeneration is unresolved6,7. Here, we report that rhythmic traveling waves of Erk activity control the growth of bone in time and space in regenerating zebrafish scales, millimetre-sized discs of protective body armour. We find that Erk activity waves travel as expanding concentric rings, broadcast from a central source, inducing ring-like patterns of osteoblast tissue growth. Using a combination of theoretical and experimental analyses, we show that Erk activity propagates as excitable trigger waves able to traverse the entire scale in approximately two days, with the frequency of wave generation controlling the rate of scale regeneration. Furthermore, periodic induction of synchronous, tissue-wide Erk activation in place of travelling waves impairs tissue growth, indicating that wave-distributed Erk activation is key to regeneration. Our findings reveal trigger waves as a regulatory strategy to coordinate cell behaviour and instruct tissue form during regeneration.
Keywords: tissue regeneration, zebrafish, bone, Erk signalling, trigger waves, live imaging, quantitative developmental biology
The ultimate size and shape of a tissue are determined by the patterns of growth and division of its cellular constituents. The challenges of visualizing dynamic cell behaviours and signalling pathways in real time have limited the ability to dissect mechanisms of regeneration in adult animals. Here, we apply transgenic tools, in vivo live imaging, quantitative analysis, and mathematical modelling to investigate how signalling dynamics regulate bone regeneration in adult zebrafish.
Zebrafish scales are disc-shaped dermal bones arranged in an array to form a skeletal armour8-13 (Fig. 1a, Extended data Fig. 1a). As in mammalian dermal bones, scale mineral matrix is directly deposited by adjacent osteoblasts14. Scale osteoblasts include two populations, a monolayer of large “central osteoblasts” and a peripheral rim of smaller “marginal osteoblasts”11 (Fig. 1b, Extended Data Fig. 1b). Each scale sits in a dermal pocket and is covered by epidermis8-13 (Fig. 1a). Scales that are dislodged and shed upon physical contact with another fish or object can regenerate completely within two weeks8-11 (Extended Data Fig. 1a). Following scale loss, a pool of new osteoblasts is established within 2 days by de novo differentiation10. For a brief period, scale growth proceeds by proliferation of this founder osteoblast pool10 (Fig 1b-d; unless differently noted, osteoblasts are visualized using a nuclear osx:H2A-mCherry marker10). After this, by around 4 days post-plucking (dpp), scales reach their final number of central osteoblasts, which continue to grow via cellular hypertrophy10,11 (Fig. 1b-d, Extended Data Fig. 1c). 5-ethynyl-2’-deoxyuridine (EdU) incorporation labelling indicated that central osteoblasts do not undergo DNA replication during scale hypertrophy (Extended Data Fig. 1d). Furthermore, we marked central osteoblasts during the hypertrophic phase using a photo-convertible protein mEos2 fused to a histone protein and traced them during the following days, finding no evidence that they were proliferative, apoptotic, or migratory (Extended Data Fig. 1e-h).
Figure 1. Scale regeneration proceeds by patterned osteoblast hypertrophy.

a, b) Zebrafish scale morphology and regeneration (n > 50 fish from > 5 independent experiments). c, d) Number of nuclei and scale area during regeneration (data from a single trial, replicated in 1 additional independent experiments). e) Tissue velocity field (tissue flow, blue arrows) and its divergence (heat-map), indicating tissue expansion and contraction (n > 10 fish from 5 independent experiments; dashed line: ring of tissue expansion; red: high tissue contraction; green: high tissue expansion). Scale-bar: 250 μm. Here and thereafter, dpp (hpp): days (hours) post plucking.
To investigate the spatial organization of osteoblast growth, we tracked osteoblast positions over 6- to 12-hour periods, reconstructed tissue movements, and used vector calculus to generate maps of tissue expansion and contraction (Methods). Unexpectedly, the expansion of the osteoblast tissue within each regenerating scale was not uniform, but occurred in disk or ring-like patterns (Fig. 1e and Extended Data Fig. 1i).
To examine a possible signalling basis for these patterns of tissue expansion, we generated a transgenic line enabling live visualization of a proxy for the activity of Erk kinase (Fig. 2a, b Kinase Translocation Reporter – Erk KTR15), which was implicated by inhibition experiments (Extended Data Fig. 2a). The Erk KTR sensor provides a readout of the spatiotemporal activation of Erk signalling through measurement of its relative cytoplasmic and nuclear levels, as its subcellular localization is controlled by Erk phosphorylation (Fig. 2a). Thus, the sensor accumulates in the nucleus at low Erk activity and shuttles to the cytoplasm at high Erk activity (Fig. 2a). By visualizing the biosensor together with a nuclear marker and applying automated image processing, we could ratiometrically quantify Erk activity in the entire population of scale osteoblasts at any given time (Fig. 2b, c, Methods).
Figure 2. Erk activity waves travel across regenerating scales.
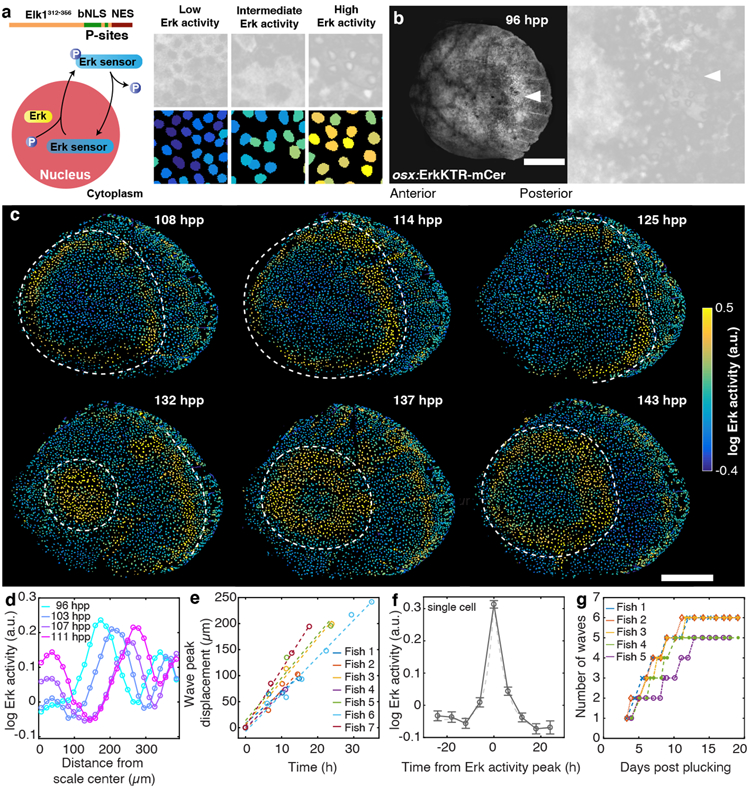
a) Schematic of the Erk sensor (Erk KTR, left). The mCerulean-tagged sensor includes a suboptimal bipartite Nuclear Localization Sequence (bNLS) and a Nuclear Export Sequence (NES). Erk binds to the sensor through its Elk1-derived docking site and phosphorylates it, favouring nuclear export (right, quantified Erk activity in scale osteoblasts, represented as in Fig. 2c). b) Erk KTR in a regenerating scale. Arrowheads: ring of Erk active cells (n > 50 fish from > 5 independent experiments; right: magnification. Image size: 150 μm). c) Quantification of Erk activity (n > 50 fish from > 5 independent experiments; dashed lines: front of active cells). Occasional activation can be observed along radii (vascularized and innervated bone canals13). d) Example of Erk wave activity profile. e) Erk wave activity peak position at 4-5 dpp (dashed lines: linear fit, n = 7 scales from 7 fish pooled from 3 independent experiments). Peak width = (70 ± 20) μm (gaussian fit, 2 SD). f) Erk activity in tracked individual central osteoblasts located in the posterior of the scale (error-bars: mean with SEM; n = 89 cells from 3 scales from 3 fish in a single trial; for each cell, t = 0 is peak Erk activity). Dashed lines: exponential fit of Erk activation/deactivation time (2.8 ± 0.5 h; 4.6 ± 0.6 h; 68% CI). g) Cumulative number of Erk activity waves as a function of time in individual regenerating scales measured longitudinally (single trial). Scale-bar: 250 μm.
Erk is activated by many ligand-receptor tyrosine kinase partners, of which Fibroblast growth factors and their receptors are candidates in scales8,10. Several pharmacological and transgenic perturbations indicated that scale osteoblast Erk activity depends on Fgf receptors and MAPKK activation (Fig. 3a, Extended Data Fig. 2c-d, 3, 4, 5j, Supplementary Notes). Erk activity decreased rapidly (~3 hours) following Fgf receptor blockade (Extended Data Fig. 3c), but not Egf receptor inhibition (Extended Data Fig. 3h-i, Methods). Furthermore, ectopic expression of an Fgf ligand was sufficient to ectopically activate Erk signalling in scales (Extended Data Fig. 4c-f).
Figure 3. Erk activity propagates as a reaction-diffusion trigger wave.

a, b) Model of Erk signalling dynamics including a diffusible Erk activator, such as Fgf and/or another potential activator, a positive feedback between Erk and the activator, and a negative feedback including an Erk inhibitor. Red shaded region: constant source of activator. c) Erk activity in a scale in which a portion of the tissue has been ablated (red dashed line). Top/middle: mathematical model. Bottom: regenerating scales in which a portion of the tissue has been ablated by laser micro-surgery in vivo. White dashed line: wave front. Quantifications: see d. Hpa: hours post ablation. d) Wave front angle with respect to a circular front (error-bars: mean with SD; Methods; control: n = 14 scales from 13 fish pooled from 3 independent experiments, ablation: n = 6 scales from 6 fish pooled from 2 independent experiments; two-sided Wilcoxon’s rank-sum test P is shown). e) Model prediction of Erk wave speed for different levels of inhibition of the Erk activator Mek (waves at null speed are unstable). f) Wave speed corrected for tissue growth and normalized to respective control, in regenerating scales (4 dpp) in fish treated with different concentrations of the Mek inhibitor PD0325901 (error-bar: mean with SEM; circles: scales from individual fish, besides 0 μM in which 10 scales from 9 fish were imaged, pooled independent experiments: 3, 1, 3, 1, 1, 2; Spearman’s correlation coefficient −0.75; P = 2. 10−4). Red dots: Erk waves completely impaired. g) Wave speed, corrected for tissue growth (circles: individual scales from 12 (regenerating, pooled from 4 independent experiments) and 3 (juvenile, single trial) fish; mean radius waves with SEM: ontogeny 130 ± 10 μm, regeneration 440 ± 40 μm, unpaired two-sided Student’s t-test P = 5. 10−4; mean wave speed with SEM: ontogeny 3.2 ± 0.6 μm h−1, regeneration 6.7 ± 0.6 μm h−1, unpaired two-sided Student’s t-test P = 0.009). Model: v=vp-D/R (see main text). Scale-bar: 250 μm.
To assess Erk signalling in regenerating osteoblasts, we imaged scales at several time points after plucking. Erk activity was high throughout the osteoblast pool from one until 2-3 days post injury (Extended Data Fig. 2e), then diminished starting near the centre of the scale before the onset of the hypertrophic phase at ~3 dpp. After this point, high Erk activity localized in ring-shaped regions (Fig. 2b, c), varying in size and localization between scales and animals (Fig. 2c, 4a, Extended Data Fig 2-8). Thus, osteoblast Erk signalling activates in a similar spatial pattern as tissue expansion during scale regeneration.
Figure 4. Erk activity waves direct tissue growth in regenerating scales.

a) Erk activity, tissue velocity field (tissue flow, blue arrows) and its divergence (heat-map; quantifications: see b). b) Expansion and Erk peaks position (n = 16 scales from 12 fish pooled from > 5 independent experiments; Pearson’s correlation coefficient 0.93, P = 2. 10−8; dashed line: bisector of the axis). c-e) Cumulative number of waves and scale area during regeneration (orange area: BGJ398 transient treatment). d: area increase (error-bars: mean with SEM; untreated: n = 5 scales from 5 fish in a single trial, BGJ398: n = 4 scales from 4 fish pooled from 2 independent experiments; partial Pearson’s correlation coefficient calculated on averages and controlling for time: ρ = 0.97, P = 2. 10−4; untreated fish: same as in Fig. 2g and Extended Data Fig. 1c). f) Scale area increase in transgenic fish and respective control siblings not carrying the transgene (error-bars: mean with SEM; fgf20a and control: 4 scales from 4 fish per condition in a single trial; fgf3 and control: 5 scales from 5 fish per condition in a single trial; Methods and Extended Data Fig. 8-9). Scale-bar: 250 μm.
To identify if Erk activity rings might be dynamic, we monitored Erk signalling longitudinally in individual regenerating scales over several days. Strikingly, we found that the rings of high Erk activity travel across the tissue as a wave, moving from one cell to the other. In particular, multiple Erk rings expand from a source region located between the centre and the anterior margin of the scale and move toward its periphery (Fig. 2c, d, Supplementary Video 1). Erk waves travel at a speed in the order of 10 μm h−1, thus one wave traverses the entire scale in about 2 days (Fig. 2c-e). Near its completion, a new wave emerges at the same source (Fig. 2c). By tracking individual cells, we observed Erk oscillations with an activation time of ~3 hours and inactivation time of ~5 hours (Fig. 2f), to establish a traveling front 50-100 μm wide (Figure 2c, d). Monitoring the entire period of regeneration longitudinally (~2 weeks), we observed 5-6 Erk waves in each scale (Fig. 2g, Supplementary Video 2). Thus, our findings indicate that Erk signalling is activated in a series of repeated, concentric waves travelling across the entire central osteoblast population.
How is Erk activity organized in travelling waves? Diffusible signals can generate excitable “trigger waves” in reaction-diffusion systems that include positive and negative feedback5,16 (Fig. 3a). For example, if a diffusible signal, e.g. an Fgf ligand, activates Erk, and Erk-active cells stimulate and/or produce a diffusible activator, this would generate a spreading activity wave. However, as Erk signalling travels as a localized peak (Fig. 2d-f), a mechanism of delayed inactivation is required, potentially adjudicated by Erk-responsive dual-specificity phosphatases (Dusp) and Sprouty proteins17. To identify the presence of potential Erk inhibitory factors during wave propagation, we developed a strategy to compare transcriptomes of sorted osteoblasts displaying either elevated or reduced Erk activity (Supplementary Notes, Extended Data Figure 5a-g). These experiments indicated that the expression levels of dusp5 and spry4 are elevated in Erk active osteoblasts (Extended Data Fig. 5h-j, and Supplementary Notes).
To further test quantitatively if these features are sufficient in principle to generate waves, we developed a mathematical model of Erk signalling involving a diffusible Erk activating signal and an Erk inhibitor, both generated by Erk-active cells (Fig. 3a). We found that a constant localized source can generate periodic Erk activity waves (Fig. 3b, Extended Data Fig. 6a, Supplementary Video 3). In an alternative “phase wave” model, Erk activity oscillates autonomously in each cell, with oscillation phases organized in a graded spatial pattern such that Erk activity appears to travel across tissue. To distinguish between these scenarios, we analysed how Erk waves behave near an ablated region of scale tissue. Modelling predicts that phase waves travel across gaps, whereas trigger waves bend and turn around them (Fig. 3c, d). Laser ablation of small regions of regenerating scale tissue (Fig. 3c, d) revealed that Erk waves do not cross disrupted tissue, but instead curve and manoeuvre around it as expected for trigger waves.
The trigger wave model further predicts that wave speed depends on the time-scale of self-sustained Erk activation16. This is likely to involve protein synthesis, as wave propagation is impaired in fish treated with the translation inhibitor cycloheximide (Extended Data Fig. 6b, c). Modelling also predicts that slowing of the Erk cascade decreases wave speed (Fig. 3e). To test this prediction, we treated regenerating animals with different concentrations of the Mek inhibitor PD0325901, including concentrations that do not completely impair waves. Erk activity waves were indeed slowed by Mek inhibition in a dose-dependent manner (Fig. 3f, Extended Data Fig. 6d). Another prediction of the theory of trigger waves is that wave geometry influences their speed18. The speed v of a 2D wave depends on its radius of curvature R as v = vp - D/R, where vp is the planar wave speed and D is the activator diffusivity, meaning that small Erk waves are slower than larger ones. To test this prediction, we examined the small, developing scales of juvenile fish for patterns of Erk activity. We identified Erk activity waves with diameters four times smaller than that of regenerating adult scales (Extended Data Fig. 6e, Fig. 3g). Wave speeds were slower than those of regenerating adult scales (Fig. 3g), consistent with the theoretical prediction. From this relationship between wave speed and curvature, we estimate the effective diffusivity of the Erk activating signal to be D ~ 0.1 μm2 s−1 (Fig. 3g). This value can be also obtained by another dimensional relationship. The speed of planar chemical waves is vp ~ (D/τ)1/2, where τ is Erk activation time (few hours, Fig. 2f); as wave speed is vp ~ 10 μm h−1, we infer again D ~ 0.1 μm2 s−1. With this diffusion constant of the activator, our model generates trigger waves that traverse a millimetre-sized tissue in only a few days (Extended Data 6f, g, Supplementary Notes). Collectively, our observations argue that Erk activity spreads as excitable trigger waves.
To test whether Erk waves instruct patterns of tissue growth, we compared tissue expansion maps, measured over timescales of several hours, with maps of Erk signalling in the same scale. We found that the ring/disk-like regions of tissue expansion correlate closely in space and time with Erk waves (Fig. 4a-b, Extended Data Fig. 7a-c). Moreover, tissue flows are strongly perturbed, and tissue expansion rings are significantly reduced upon blockade of Erk activity with PD0325901 (Extended Data Fig. 7d-f).
Multiple waves traverse the entire scale over longer timescales of several days, and our findings predict that the extent of scale growth depends on the number of experienced waves. By monitoring Erk activity for 2 weeks, we found that scale growth correlates with the generation of Erk waves - as Erk wave generation slows and stops, so does scale growth (Fig. 4c, d, Extended Data Fig. 7g, Supplementary Video 2). To further test this relationship, we perturbed wave generation by brief treatment with the Fgf receptor inhibitor BGJ398 (Fig. 4e, Extended Data Fig. 7h). After this transient block, Erk waves disappeared and were undetectable for ~4 days, with scale growth concomitantly stalled. Subsequently, Erk waves re-emerged and scale growth resumed altogether, with the same relationship between wave number and scale growth as in unperturbed regenerating scales (Fig. 4d). Collectively, these results argue that Erk waves direct osteoblast growth in both time and space.
To test if Erk regulation in the form of traveling waves is key for regeneration, we genetically modified their spatial pattern. Ectopic induction of an fgf20a transgene19 during the hypertrophic phase caused Erk activation in large portions of, if not the entire, scale osteoblast population. This tissue-wide activation was followed by global Erk inactivation (Extended Data Figure 4c, d, Extended Data Figure 8a, b). This perturbation, repeated daily for a week, impaired scale growth and caused slight morphological defects (Fig. 4f, Extended Data Fig. 8c-g). Similar experiments employing fgf320 revealed similar, but less potent effects, on Erk activation and scale growth (Fig. 4f, Extended Data Fig. 4e, f, 9). While not excluding effects of Fgf20a or Fgf3 that are independent of Erk, our observations suggest that Erk traveling waves are favourable to spatially broad pulses of Erk activation for hypertrophic growth of scales, potentially as a means to limit accumulation of mechanical stresses. Indeed, a mathematical model, postulating feedback between growth and mechanical stress21-23, can capture the reduced scale growth when Erk is activated on a broader spatial range, as well as several geometric features of tissue growth (Supplementary Notes and Extended Data Fig. 10).
In summary, we report an unexpected mechanism for tissue renewal in which periodic Erk waves orchestrate the behaviour of a cell population during regeneration (Supplementary Video 4). Our experimental data, quantitative analysis and mathematical models highlight travelling waves as an efficient mechanism for communication in tissues spanning spatial scales of millimetres or larger. Erk waves have been associated with cell migration during epidermal wound healing in mice and cultured cells24-26, and with cellular contractility during the invagination of tracheal placodes in Drosophila27. We propose that repeated waves of transmitted signals serve as a mechanism of cellular organization within large regenerating tissues, and that wave properties like number, speed and geometry can determine how injured organs and appendages recover size and shape.
Methods
Fish husbandry, scale injury and pharmacological treatments
Zebrafish of Ekkwill, Ekkwill/AB and AB strains were maintained between 26-28.5° C with a 14:10 hour light:dark cycle. Fish between 3 and 18 months old were used for experiments. To assess regenerating scales in hsp70l:dnfgfr1-EGFP; osx:ErkKTR-mCerulean; osx:H2A-mCherry animals, ~9 weeks old fish were used. To assess developing scales in juvenile fish, fish at the squamation stage were used (~4 weeks old). Scale plucking was performed essentially as described10. In brief, fish were anesthetized in 0.09% phenoxyethanol (Sigma L77699) in system water until swimming ceased and operculum movement slowed. Then, they were placed in a Petri dish, and fluorescent scales were viewed under a fluorescent dissecting scope. Three rows of 7-15 scales were plucked with forceps from the trunk of the fish, starting from the caudal peduncle and proceeding anteriorly. After scale removal, fish were returned to system water to recover from anaesthesia. No statistical method was used to predetermine sample size. Animals, mixed males and females, were randomly allocated in control and experimental groups. When possible, siblings were used for control and experimental groups. It was not possible to blind investigators during data collection, since animals from control and experimental groups can be distinguished by cell behaviours and/or fluorescent reporters. However, data quantification was performed automatically using the same computational algorithm. When necessary, human manual data curation was performed by blinded researchers, although often data from control and experimental groups can be recognized from phenotypes. Researchers were not blinded during data visualization. All animal experiments were approved by the Institutional Animal Care and Use Committee at Duke University and followed all the relevant guidelines and regulations.
Transgenic lines used in this study were:
Tg(osx:H2A-mCherry)pd310 10, Tg(hsp70l:dnfgfr1-EGFP)pd128, Tg(osx:EGFP-CAAX)pd5129, Tg(osx:mCherry-zCdt1)pd270 10, Tg(osx:Venus-hGeminin)pd271 10, Tg(osx:ErkKTR-mCerulean)pd2001 (this manuscript), Tg(osx:H2A-mEos2)pd2002 (this manuscript), Tg(hsp70l:mCherry-2a-fgf20a)19 and Tg(hsp70l:fgf3)x27 20.
Construction of transgenic zebrafish
H2A-mEos2 and ErkKTR-mCerulean were subcloned by ligation and/or Gibson assembly into a pBluescript SK plasmid, modified to contain ISceI sites flanking the multi-cloning site, and containing the osx regulatory sequence, derived from an osx::H2A-mCherry plasmid10. The ErkKTR sequence was derived from a pENTR-ErkKTR-Clover plasmid gifted by Markus Covert (Addgene plasmid # 59138 ; http://n2t.net/addgene:59138 ; RRID:Addgene_59138); the mCerulean sequence from a Cdk1 FRET sensor gifted from Jonathon Pines (Addgene plasmid #26064; http://n2t.net/addgene:26064; RRID:Addgene_26064); mEos230 sequence from mEos2-CytERM-N-17 plasmid gifted by Michael Davidson (Addgene plasmid #57366; http://n2t.net/addgene:57366; RRID:Addgene_57366).
Plasmids were linearized using I-SceI enzyme (NEB R0694S; final concentration: 0.33 U/μl) for 30 minutes at 37°C before injection into AB or EK embryos at the one-cell stage. Plasmids and plasmid sequences are available upon request.
Heat-shock and pharmacological treatments
Heat shocks were performed essentially as previously described28. Fish were placed on an aquarium system with recirculating water that maintained 26-28.5° C water for all but the 1.75 h during which the water was heated to 38°C. Water was allowed to return to temperature for at least 2 h before imaging.
In Fig. 4f, Extended Data Fig. 2b, Extended Data Fig. 4c-f, Extended Data Fig. 8a-b, e-g, Extended Data Fig. 9, fish were heat-shocked every-day at the same time starting at 4 dpp. In the case of dnfgfr1 expression in Extended Data Fig. 2b, fish were imaged after (>4 h) the start of each heat-shock. In the case of fgf3 over-expression in Fig. 4f, Extended Data Fig. 4e, f, 9, scales were imaged before and after heat-shock (see Extended Data Fig. 9b for imaging times). In the case of fgf20a over-expression in Fig. 4f, Extended Data Fig. 4c, d, Extended Data Fig. 8a-b, e-g, fish were imaged before (<6 h) and after (>4 h) the start of heat-shock at 4 dpp, while they were imaged before (<6 h) or after (>4 h) the start of heat-shock during the following days.
In the case of dnfgfr1 in Extended Data Fig. 4a-b, fish were imaged before (<6h) and 7-10 h after the start of heat-shock.
In Extended Data Fig. 10j (first heat-shock): fish were heat-shocked at ~3.5 dpp and imaged thereafter every 3 h for ~9 h. In Extended Data Fig. 8c, d and 10j (second heat-shock) fish were heat-shocked at ~3.5 dpp and ~4.5 dpp and imaged after the second heat-shock every 3 h for ~12 h. In the case of PD0325901 (10 μM) treatment followed by fgf20a over-expression (Extended Data Fig. 10j-l), fish were treated at 4 dpp for 24 h with PD0325901 (10 μM). Then, they were transferred to fresh water, heat-shocked, returned to the chemical treatment and imaged every 3 h for ~9 h. For testing if the protocol can activate Erk (Extended Data Fig. 10k), fish were imaged after heat-shock (>4h).
In each heat-shock experiment, hsp70l:mCherry-2a-fgf20a/hsp70l:fgf3/hsp70:dnfgfr1-EGFP fish were heat-shocked in the same tank and at the same time together with their respective control sibling not carrying the transgenes. In each fish, the same scale was recognized at different time-points from its position in the scale array. The correspondence between fish at different time-points was determined after imaging by scale similarity.
For pharmacological treatments, fish were first imaged and then were immersed in the pharmacological compound diluted to working concentration in fish water for the duration of the treatment (BGJ398 (Selleck-Chem S2183); Cycloheximide (Sigma-Aldrich 01810); JNJ-42756493 (Selleck Chem S8401); PD0325901 (Selleck Chem S1036); PD153035 (Selleck-Chem S6546); SU5402 (Selleck-Chem S7667). PD153035 is an inhibitor of Egf receptors known to be effective in adult zebrafish31,32. Fish were kept off the system in the dark. Treatment medium was changed roughly every 12 h. In the case of BGJ398 transient treatment (Fig. 4d, e, Extended Data Fig. 10g), scales were treated for ~3 h at 4 dpp and transferred to fresh water afterwards. Fish were fed prior to changing treatment medium. In each fish, the same scale was recognized at different time-points from its position in the scale array. The correspondence between fish at different time-points was determined before imaging by fish similarity or after imaging by scale similarity. In each experiment, control fish (siblings, when possible) were treated with the same concentration of DMSO vehicle as the treated group and imaged during the same day (when possible; otherwise, within weeks).
Laser-mediated photoconversion
For H2A-mEos2 photo-conversion, we used the same confocal-based setup used for imaging (see below); H2A-mEos2 was converted by scanning repeatedly a small Region Of Interest around a single nucleus with a 405 nm laser during the proliferative (3 dpp) or hypertrophic (4 dpp) phases; several nuclei, in the order of ten, were converted per scale. Scales bearing photo-converted nuclei were imaged daily during the following days. Nuclei were tracked manually and instances of cell division were scored manually. Represented photoconversion images in Extended Data Figure 1 were adjusted differently to compensate for different nuclear brightness immediately after photoconversion and days afterwards.
Laser microsurgery
Tissue ablation was performed using a Zeiss PALM MicroBeam 4.2 microsurgery setup (objective 10x 0.25NA Fluar, 20140-9900) including a Zeiss Axio Observer Z1 microscope for tissue visualization. Tissue ablation was performed along a manually selected path covering a rectangular region, roughly 50-300 μm x 50 μm, with a 355 nm pulsed laser (pulse energy: > 90 μJ; pulse duration: <2 ns; pulse frequency: 1 to 100 Hz).
Live Imaging
In vivo confocal imaging was performed as previously described10. A zebrafish was anesthetized in 0.01% tricaine (Sigma E10521-50G) in system water and transferred to a 1% agarose bed in a plexiglass plate. The caudal fin of the fish was set on a glass slide to bring the caudal peduncle of the trunk parallel with the platform, and diluted tricaine was placed near the head of the fish. Cooling 1% agarose was applied on the caudal fin, the trunk anterior to the imaged scale, and the areas of platform dorsal and ventral to the scale. Then, fish were immersed in diluted tricaine. Gills movements were monitored visually and, when they slowed, system water was applied using a peristaltic pump (Cole Parmer; #EW-73160-32; silicon tubing: Tygon, 0.7 mm inner diameter/2.4 mm outer diameter, B-44-4X) until regular rhythm was restored (3.5 ml/min flow rate). In each fish, the same scale was recognized at time-time points from its position in the scale array. After imaging, a system water flow was applied using the peristaltic pump, until gill movement quickened. Then, the fish was returned to system water. For longitudinal time-courses, fish were mounted, imaged and then returned to system water at each time-point. Fish were imaged at variable intervals of approximately 3, 6, 12, 24, 48 or 72 h.
Confocal images were acquired using a Leica SP8 confocal microscope and LAS X 2.01.14392 software, with a HC FLUOTAR L 25x/0.95 W VISIR water immersion lens (Leica 15506374) at 0.75x zoom. As scales are larger than the field-of-view of our microscopy setup, they were imaged with multiple overlapping z-stacks (1-9 with variable number of planes) to cover the entire osteoblast tissue. High-resolution images were acquired at 1024x1024 resolution (0.606 μm pixel size) and a z-step of 0.606 μm. Scale area in hsp70l:dnfgfr1-EGFP fish and control siblings was measured using low-resolution images at 512 x 512 resolution (1.212 μm pixel size) and a z-step of 1.2 or 1.7 μm. Fluorescent proteins were imaged using the following lasers: ErkKTR-mCerulean – 458 nm; unconverted H2A-mEos2 - 488 nm; converted H2A-mEos2 – 561 nm; Venus-hGeminin 488 or 514 nm; GFP-CAAX – 488 nm; Dnfgfr1-EGFP – 458 or 488 nm; H2A-mCherry – 561 nm; mCherry-zCdt1 – 561 nm. A variable laser power was used depending on the expression of the transgenic reporters.
ErkKTR-mCerulean in hsp70l:dnfgfr1-EGFP fish was imaged using a 458 nm laser and restricting the collected emitted spectrum to minimize Dnfgfr1-EGFP bleed-through with respect to ErkKTR-mCerulean signal. Controls experiments showed that Dnfgfr1-EGFP signal corresponded to 5% of mCerulean signal, thus not majorly biasing Erk activity measurements.
A Zeiss AxioZoom V16 and Zen Pro 2012 software was used to acquire illustrative low-magnification images (Extended Data Fig. 1a). In this case, fish were anesthetized in 0.01% tricaine in system water and transferred to a Petri dish with their heads partially submerged in diluted tricaine . Fish were imaged quickly and then returned to system water.
5-Ethynyl-2′-deoxyuridine (EdU) incorporation
10 μl of 10 mM 5-Ethynyl-2′-deoxyuridine (EdU; Tokyo Chemical Industry E1057) in PBS was injected intraperitoneally at 1.5 and 4.5 dpp. Regenerated scales were collected at 4.5 dpp or 6.5 dpp and fixed in 4% formaldehyde (Sigma-Aldrich L2525249). EdU was detected using the Click-&-Go EdU AF 488 Imaging Kit (Click Chemistry Tools # 1324).
Osteoblast dissociation and sorting. RNA extraction and sequencing
Scale regeneration was induced by plucking about 50 scales, in three rows, from each side of osx:H2A-mCherry osx:Venus-hGeminin fish. At 4 dpp, all regenerating scales were plucked as described above and collected in PBS on ice. 3-5 fish were used per sample. Tissue was pelleted by centrifugation (5 min at 600g) and resuspended in 600 μl of 13 U/ml Liberase (DH-Research Grade - Sigma #5401054001) in HBSS (Gibso #14025-092) and incubated at 37 C for 1 h. Every 15 min, 500 μl of supernatant was removed, quenched with 65 μl sheep serum (Sigma S2263) on ice, and 500 μl of fresh Liberase was added to the primary tube. All collected supernatant was filtered using 50 μm filters (Corning #431750), pelleted (5 min at 600 g) and resuspended in 1 ml DMEM + 1% BSA (UltraPure - Invitrogen AM2616). Before sorting, 1 μg/ml DAPI (Sigma D9542) was added to the tube.
Cells were analyzed and sorted using a SH800S Sony Cell Sorter using a 100 μm disposable chip. Initially, events were gated using Forward versus Side Scatter Areas (488 nm laser). Then, single cells were enriched by gating Forward Scatter Height versus Forward Scatter Area (488 nm excitation laser). Live cells were enriched by selecting a population with low DAPI emission (405 nm excitation laser). Finally, H2A-mCherry+ Venus-hGeminin− (D in Extended Data Fig. 5f) and H2A-mCherry+ Venus-hGeminin+ (E in Extended Data Fig. 5f) were sorted by gating Venus-hGeminin (488 nm excitation laser) versus H2A-mCherry (561 nm excitation laser). Cells were collected in PBS or TriReagent (Sigma T9424). RNA was extracted using TriReagent followed by RNAeasy microKit (Qiagen #74004).
Library preparation was performed by BGI Genomics (Low Input Library Preparation – BT01). Sequencing was performed by BGI Genomics using their BGISEQ-500 platform (paired end, 100 bp per read and 40 Million clean reads per sample).
Gene expression analyses by RNA-Seq
Reads were trimmed by Trim Galore (0.4.1, with -q 15 --paired) and then mapped with TopHat33 (v 2.1.1, with parameters --b2-very-sensitive --no-coverage-search and supplying the UCSC danRer10 refSeq annotation). Gene-level read counts were obtained using the featureCounts34 (v1.6.1) by the reads with MAPQ greater than 30. Bioconductor package DESeq235 (v 1.26.0) were employed for differential expression (DE) analysis. Gene Set Enrichment Analysis36,37 (GSEA - Supplementary Table 1) was used to define the enriched gene set for the pre-ranked homo sapiens homologs list by Wald statistics.
Scale RNA extraction and RT-qPCR
Scale regeneration was induced by plucking about 50 scales, in three rows, from one side of osx:H2A-mCherry or osx:H2A-mCherry hsp70l:dnfgfr1-EGFP fish. Two fish were used per sample. In the case of PD0325901 treatment, fish were treated for ~9 h with PD0325901 (10 μM) or control DMSO vector at 4 dpp; then, whole regenerating scales were plucked and collected in TriReagent on ice. In the case of dnfgfr1 expression, fish were heat-shocked as described above; then, whole regenerating scales were plucked ~11 h after the start of the heat-shock (hence, ~9 h after reaching maximum temperature) and collected in TriReagent (Sigma T9424). The tissue RNA was extracted using TriReagent followed by RNAeasy microKit (Qiagen #74004). Quantitative PCR was performed on a Roche LightCycler 480 with Software release 1.5.0 SP4 using LightCycler 480 SYBR Green I Master Mix (Roche 04707516001) with the following primers: actb2 fwd: GACAACGGCTCCGGTATG , rev: CATGCCAACCATCACTCC38; spry4 fwd: GCGGAGCAGCCCAAGATACT rev: CAGGCAGGGCAAAACCAATGAG39; dusp2 fwd: AGCCATCCACTTCATTGATTCG, rev: TGGCCCATGAATGCGAGATT; dusp5 fwd: ACTTTGTCGCACTTGACGAG rev: TGGGTTTTCATGATGTACGC40. Amplification was performed in technical triplicates and transcript expression levels was normalized to actb2 as a control. Transcript fold change was calculated with respect to the corresponding control using the DeltaDeltaCp method41, where Cp is the maximum of the second derivative of the fluorescence-cycles curve, calculated using the Roche LightCycler 480 software.
Data analysis
Image processing and data analysis were performed with custom-written MATLAB (Mathworks) 2016b software, unless stated otherwise. Each acquired z-stack contains a portion of scale, positioned diagonally with respect to the xy-plane, and several overlapping neighbouring scales. Each scale includes a monolayer of hyposquamal osteoblasts on the dermal side, the subject of this study, and a sparse population of episquamal osteoblasts on the epidermal side. Therefore, several image processing steps are required to isolate the hyposquamal layer for quantification.
First, z-stacks covering different portions of a scale were stitched in a single z-stack using a custom-written 3D stitching software based on image cross-correlation. Then, z-stacks were rotated to position the entire osteoblast tissues as parallel as possible to the xy axis (here and thereafter, H2A-mCherry nuclear signal was used as nuclear osteoblast reference; in osx:Venus-hGeminin osx:mCherry-zCdt1 fish, the Venus-hGeminin and mCherry-zCdt1 signals were combined and used as nuclear osteoblast markers instead). Overlapping neighbouring scales were computationally removed by computationally assisted manual data curation. Once neighbouring scales were removed, the z-stack was rotated again to position the isolated scale as parallel as possible to the xy axis. Then, the osteoblast tissue was segmented using intensity-based thresholding and morphological operations. Scales were computationally flattened so that the dermal side of the segmented osteoblast tissue was at the same z-position. To isolate the hyposquamal population, a z-slice was computationally isolated from the dermal side of the flattened scale. To determine the thickness of the hyposquamal z-slice, the total intensity z-profile of the flattened osteoblast tissue (nuclear signal) was calculated. Since the hyposquamal tissue contains the majority of osteoblasts in 4 dpp to mature scales, its centroid corresponds roughly to the peak of the nuclear signal z-intensity profile. Therefore, the hyposquamal slice was taken from the dermal side of the flattened scale to the peak of the total intensity z-profile (a thicker slice would include cells from the episquamal layer). For the purpose of nuclei segmentation and visualization, z-stacks were equalized by contrast-limited adaptive histogram equalization.
For osteoblast counting and Erk activity quantification, nuclei were segmented by TGGM software42 using the equalized hyposquamal nuclear signal (H2A-mCherry or combined Venus-hGeminin mCherry-zCdt1 signal). For Erk quantification, a mask corresponding to each nucleus was drawn using nuclei segmentation; the nuclear mask was dilated and the difference of the dilated mask and the nuclear mask was taken as a cytoplasmic mask. Then, average ErkKTR-mCerulean fluorescence was calculated in the nuclear and cytoplasmic regions. Erk activity was measured as the ratio of cytoplasmic and nuclear average ErkKTR-mCerulean fluorescence levels. A similar procedure, but using Venus-hGeminin/mCherry-zCdt1, was applied to calculate the normalized Venus-hGeminin/mCherry-zCdt1 signal (Extended Data Fig. 5). In that instance, each signal was also normalized by the corresponding laser power.
Erk activity profiles were calculated by averaging Erk activity along a 240-μm wide stripe passing through the source of Erk waves, manually selected, and the centroid of the osteoblast tissue. For visualization purposes, Erk activity profiles were smoothened using a Savitzky–Golay filter. The position and height of the wave peak was fitted from the unsmoothed 1D Erk activity profile using a quadratic function around a manually selected initial peak point. Wave speed was calculated from wave peaks that were located away from the source, thus around or past the centroid of the scale, and that had not reached the scale external rim yet. As waves travel at the same time as tissue grows, wave speed may include a component due to the growth on the underlying tissue. To compensate for this effect, we calculated a corrected wave velocity (see Supplementary Methods), assuming that the overall tissue was growing by an affine deformation centred in the scale centroid. Similar conclusions are drawn whether the total or corrected wave velocity are considered. In Extended Data Fig. 10i, the 1D Erk activity profile is smoothened and the inverse of its second derivative is calculated. The position of each trough is measured as for Erk activity peaks.
For the calculation of Erk wave front bending in tissue ablation experiments (Fig. 3c, d), as osteoblasts gradually repopulate the wound induced by the laser, only scales in which the Erk wave passed partially or entirely the ablated region before it had healed were used for quantification. To quantify the induced deformations of the wave front, we computed the angle between the normal to the Erk wave front at a given point and the line connecting the wave centre to the same point on the wave front (this angle would be zero for a perfectly concentric wave). “Ablated region” angles are the average of the angles computed using lines passing through the ablated region, “intact region” angles are the averages of the angles computed using lines not passing through the ablated region. In experimental images, the position of the Erk wave front was manually selected (>25 point per wave); in simulations, the location of the wave was extracted by thresholding and skeletonizing 2D Erk activity maps. As wave velocity is different in each experiment and stochastically fluctuating between experimental time points, each wave front in experimental time points was compared to the wave front in the most similar simulation time point, chosen independently for trigger and phase wave simulations. Maximum similarity between experimental and simulated time-points was computed by minimizing a discrepancy score computed as follows: the experimental and simulated wave fronts were discretized in space, each discrete point on the experimental wave front was matched to the closest points in the simulated wave front and distances between wave front couples was calculated; the discrepancy score between two experimental and simulated time-points was computed as the average of the wave front distances. The same procedure was applied to match and compare wave fronts in the trigger and phase wave simulation.
For quantification of Erk inhibition in pharmacologically/genetically perturbed scales, the relative amplitude of an Erk peak was measured before and after treatment (see Supplementary Methods). When a clear wave peak was absent due to Erk inhibition, Erk value was measured in a region similar to where to the Erk peak was before inhibition. For quantification of Erk over-activation in scales over-expressing fgf20a or fgf3, the total number of Erk-active cells was counted automatically (cytoplasmic ErkKTR signal > 1.1 nuclear ErkKTR signal).
Number of waves in Fig. 2g, 4c-e, Extended Data Fig. 7g, h was counted manually examining quantified Erk activity maps. Scale area was measured by manually selecting the scale region from raw images or from the isolated hyposquamal layer. Average cell area is calculated as the inverse of cell density. Cell density is measured by counting the number of nuclei in a central circular region (in Extended Data Fig. 1c, only the posterior portion of the circle was taken, as nuclei become too dim to be quantified reliably in the anterior region past 10 dpp) and dividing by the area of the region.
For EdU quantification, a similar procedure to the one described for Erk activity quantification was used. The hyposquamal layer was isolated computationally and a region containing only central osteoblasts in intact fixed tissue was manually selected. The transgenic H2A-mCherry marker was used to segment nuclear masks by TGGM software42. Average EdU-AFDye 488 signal was measured in each nucleus using the segmented nuclear mask and normalized by the average background signal, measured in the surrounding cytoplasm using a cytoplasmic mask. A nucleus was considered EdU+ when the normalized nuclear signal was higher than 1.6.
For the detection of converted mEos2 nuclei, the hyposquamal layer was segmented using the unconverted mEos2 signal. Then, converted mEos2 cells were manually selected and counted.
For the calculation of tissue flows, osteoblast nuclei (equalized H2A-mCherry marker, hyposquamal layer) were segmented and then tracked using Ilastik 1.3.3 software43. Nuclei velocities were calculated between frames 6-15 h apart and the overall tissue flow was calculated by averaging individual nuclei velocities in 30 μm-sized squared regions. Tissue flow maps were smoothened by an averaging filter (size: 60 μm); tissue flow 2D velocity two-point correlator was calculated using the unsmoothed velocity field; the exponential fit is performed excluding the first point, which reflects flow velocity variance. 2D divergence and curl (i.e. vorticity) of the tissue flow map were calculated using built-in MATLAB functions and smoothened by a Gaussian filter (SD: 91 μm; size: 152 μm). The position of the expansion/compression peak/trough was measured as in the case of the position of the Erk activity peak (see above). When the expansion region was organized in a disc instead of a ring, the external edge of the expansion ring was selected. To calculate the normalized total expansion rate, the scale was divided in squared regions (size: 30 μm), the expansion rate of expanding regions was summed and divided by the total number of regions throughout the scale.
To calculate scale morphology deviation, the boundary of each scale was manually selected. The boundary was transformed by a uniform dilation such that the average distance of the boundary from its centroid was unitary for each scale. Then, the boundary was expressed in polar coordinates and the morphology deviation was calculated as the average deviation of the radial coordinates between each time-point and the one before the first heat-shock.
Mathematical modelling
he biological model of Erk propagation is based on a positive feedback loop between Erk and its diffusible activator, such as Fgf, and a negative feedback loop between Erk and its inhibitor (see Fig. 3a and main text). In brief, diffusible extra-cellular activator binds to its receptor and triggers a signalling cascade leading to the activation of Erk. Active Erk increases the production and/or stimulates the diffusible activator, thus generating a self-sustaining positive feedback loop that can activate neighbouring cells. Active Erk activates its own inhibitor, thus generating a delayed negative feedback loop.
This chemical network was described mathematically as a reaction-diffusion system that was simulated using the finite differences method44. The model includes three variables: the concentration of the Erk activator, such as a growth factor ligand, (A), the fraction of active Erk (E) and the cellular concentration of the Erk inhibitor (I). The activator diffuses with a diffusion constant D, while the inhibitor and Erk are assumed to not diffuse. The positive feedback between activator concentration and fraction of active Erk is described by an activating sigmoidal function. Linear inactivation terms were used for the feedback between Erk activity and inhibitor concentration. All species linearly degrade or inactivate. The activator is produced at a constant rate in a “source” region located in the anterior half of the scale. The system of equations, parameter definitions and values are reported in the Supplementary Methods. The simulation domain is a 1090 μm x 1090 μm square (simulation grid size 2 μm) in the standard simulation. A large portion of the simulation domain is the scale region. In the standard simulation, the scale region is a disk 520 μm in radius with the surrounding region representing the extracellular space between the scale and other tissues. Erk activity and inhibitor concentrations are null outside the scale region. The activator diffuses outside the scale, but absorbing boundary conditions are set at the domain boundary; the activator degradation length is ~ 8 μm (see Supplementary Methods) which is smaller than the minimum distance between the scale and the simulation domain boundary (>25 μm). The initial condition is that Erk, activator and inhibitor are set to zero.
The simulation time-step in the standard simulation is 0.005 h. A phase wave and a trigger wave simulation are performed for each ablation experiment. The domain size in this case is 1515 μm x 1515 μm (simulation grid size 3 μm); for each simulation, the scale, source and ablated region sizes are set to match the corresponding experiment. In the trigger wave simulation, Erk and the inhibitor are set to zero in the ablated region, while the activator can diffuse freely in that region; in the phase wave simulation, as tissue ablation should not influence system dynamics, Erk, activator and inhibitor are set equal to the same quantities in a trigger wave simulation in which no region was ablated.
Extended Data
Extended Data Figure 1. Scale regeneration in zebrafish.

This Figure contains data indicating that osteoblasts display minimal proliferation after 4 dpp and that their hypertrophic growth is patterned. a) Array of regenerating scales on the trunk of a fish (n > 50 fish from > 5 independent experiments). b) Osteoblasts form a continuous monolayer in zebrafish scales (see also Supplementary Video 2; n > 50 fish from > 5 independent experiments). Scale-bar: 250 μm. c) Average cell area (error-bars: mean with SEM; n = 4 scales in 4 fish in a single trial) in scale regeneration. d) Fraction of EdU-positive nuclei during the proliferative and hypertrophic phases (error-bars: mean with SD; each circle represents the fraction of positive nuclei among 500-2000 nuclei from an individual scale; 1-4 dpp: n = 4 fish; 1-7 dpp: n = 2 fish; 4-7 dpp: n = 4 fish; single trial; two-sided Wilcoxon’s rank-sum test P is indicated). Proliferative phase: fish are injected at 1 dpp and scales are collected at 4 dpp or 7 dpp, as indicated. Hypertrophic phase: fish are injected at 4.5 dpp and scales are collected at 7 dpp. e) Osteoblast nuclei tagged with the photo-convertible protein mEos2 are photo-converted during the hypertrophic phase (4.5 dpp), imaged daily and tracked thereafter. No nuclei were observed to divide, and almost all could still be detected after 4 days (n = 55/58 cells from 5 fish tracked from 4.5 to 8 dpp pooled from 2 independent experiments. Probability of cell division is less than 2%/day at 95% confidence. Scale bar: 50 μm). f) High magnification of e. Scale bar: 25 μm. g) Osteoblast nuclei tagged with the photo-convertible protein mEos2 are photo-converted during the proliferative phase (3 dpp) and imaged the day after. Cell division can be detected (9 divisions, scored by the increase of converted nuclei, from 3 to 4 dpp in 55 converted cells from 5 scales from 2 fish (single trial); compatible with a total proliferation rate of 0.156 ± 0.003 per cell per day for the entire scale; white arrows indicates likely division events). Scale bar: 50 μm. h) High magnification of g. Scale bar: 25 μm. i) Examples of tissue velocity field (tissue flow, blue arrows) and its divergence (heat-map) indicating the pattern of tissue expansion and contraction (n > 10 fish from 5 independent experiments). Tissue flows are calculated tracking individual cell movements for ~9 h (one frame every 3 h). Scale bar: 250 μm. Dpp(hpp): days(hours) post plucking.
Extended Data Figure 2. Manipulation of Erk signalling during scale regeneration. Erk activity at 2-3 dpp.

a) Scale area increase (left) and average cell area increase (right) in fish treated with the Mek inhibitor PD0325901 and DMSO control (with SEM; n = 6 scales from 6 fish in each condition pooled from 2 independent experiments; chi-squared test P is indicated). b) Scale area increase (left) and average cell area increase (right) as function of time in fish expressing a gene encoding a dominant negative version of the Fibroblast Growth Factor Receptor 1 (Fgfr1) downstream of the heat-shock promoter hsp70l (hsp70l:dnfgfr1-EGFP) and control siblings not carrying the transgene. Fish are heat-shocked every day, starting before the first time-point at 4 dpp (with SEM; n = 12 scales from 3 fish per condition in a single trial; chi-squared test P is indicated). c, d) Example (c) and quantification (d) of Erk activity in fish treated with the Mek inhibitor PD0325901 and DMSO control (error-bars: mean with SD; each circle represents a scale from an individual fish, pooled from 2 independent experiments; unpaired two-sided log-normal test P is indicated). e) Example of Erk activity in a regenerating scale at 2 and 3 days post plucking (dpp). Erk activity is activated in a uniform pattern at 2 dpp (n = 5 scales from 5 fish in a single trial). Around 3 dpp, Erk switches off starting from the scale centre (n = 6 scales from 5 fish in a single trial). Scale-bar: 250 μm. Dpp: days post plucking.
Extended Data Figure 3. Pharmacological inhibition of Fgfr and Egfr signalling during scale regeneration.

a, b) Example (a) and quantification (b) of Erk activity in fish treated with the pan-Fgfr inhibitor BGJ398 and DMSO control (error-bars: mean with SD; n = 4 scales from 4 fish per condition (data from a single trial, replicated in 2 additional independent experiments); unpaired two-sided log-normal test P is indicated). c) Quantification of Erk activity in fish treated with the pan-Fgfr inhibitor BGJ398 for 1-3 h and DMSO control (error-bars: mean with SD; DMSO: n = 4 scales from 4 fish pooled from two independent experiments, BGJ398: n = 7 scales from 7 fish pooled from 3 independent experiments; unpaired two-sided log-normal test P is indicated). d, e) Example (d) and quantification (e) of Erk activity in fish treated with the pan-Fgfr inhibitor JNJ-42756493 and DMSO control (error-bars: mean with SD; DMSO: n = 6 scales from 6 fish in a single trial, JNJ-42756493 n = 4 scales from 4 fish in a single trial; unpaired two-sided log-normal test P is indicated). f, g) Example (f) and quantification (g) of Erk activity in fish treated with the Fgfr inhibitor SU5402 and DMSO control (error-bars: mean with SD; DMSO: n = 6 scales from 6 fish in a single trial, SU5402: n = 4 scales from 4 fish in a single trial; unpaired two-sided log-normal test P is indicated). Control fish are the same as in Extended Data Fig. 3d, e. h, i) Example (h) and quantification (i) of Erk activity in fish treated with the Egfr inhibitor PD153035 and DMSO control (error-bars: mean with SD; DMSO: n = 3 scales from 3 fish in a single trial, PD153035: n = 4 scales from 4 fish per condition in a single trial; unpaired two-sided log-normal test P is indicated). Scale-bar: 250 μm. Dpp: days post plucking.
Extended Data Figure 4. Expression of dnfgfr1 and fgf over-expression during scale regeneration.

a, b) Example (a) and quantification (b) of Erk activity in fish expressing a gene encoding a dominant negative version of the Fibroblast Growth Factor Receptor 1 (Fgfr1) downstream of the heat-shock promoter hsp70l (hsp70l:dnfgfr1-EGFP) and control siblings not carrying the transgene (error-bars: mean with SD; control: n = 3 scales from 2 fish in a single trial, dnfgfr1 : 5 scales from 3 fish in a single trial; unpaired two-sided log-normal test P is indicated). In 1/5 scales in hsp70l:dnfgfr1-EGFP fish, we observed that a new wave originated at 108 hpp. Erk peak activity after 24 h treatment could not be measured as waves reached the scale border. c, d) Example (c) and quantification (d) of Erk activity in fish over-expressing fgf20a downstream of the heat-shock promoter hsp70l (hsp70l:mCherry-2a-fgf20a) and in control siblings (error-bars: mean with SD; 4 and 7 dpp: n = 4 scales from 4 fish per condition in a single trial; 5 dpp control: n = 5, hsp70l:mCherry-2a-fgf20a: n = 4 scales from 4 fish pooled from 2 independent experiments; two-sided Wilcoxon’s rank-sum test P is indicated). Heat-shock was performed everyday starting from 4 dpp, and Erk activity was measured thereafter (approximately ~6 h after the start of the heat-shock); see also Extended Data Fig. 8a-b. e, f) Example (e) and quantification (f) of Erk activity in fish over-expressing fgf3 downstream of the heat-shock promoter hsp70l (hsp70l:fgf3) and in control siblings (error-bars: mean with SD; n = 5 scales from 5 fish per condition in a single trial; two-sided Wilcoxon’s rank-sum test P is indicated). Heat-shock was performed everyday starting from 4 dpp, and Erk activity was measured thereafter (approximately ~6 h after the start of the heat-shock); see also Extended Data Fig. 9a-b. Scale-bar: 250 μm. Dpp: days post plucking.
Extended Data Figure 5. Sequencing strategy for osteoblasts indicates increased transcript abundance of Erk inhibitors in Erk active cells.

a) Erk activity and osx:Venus-hGeminin signal in regenerating scales at different time-points are shown (n > 10 fish from > 5 independent experiments). b) Venus-hGeminin signal as a function of time from Erk peak (error-bars: mean with SEM; n = 89 cells from 3 scales from 3 fish in a single trial; for each cell track t = 0 is the time of the Erk peak; Erk data is the same presented in Fig. 2f). hGeminin nuclear signal is normalized to cytoplasmic signal. c, d) osx:hGeminin signal and osx:mCherry-zCdt1 signal (normalized for respective cytoplasmic signals) in individual cells of a representative scale (n = 4 scales from 4 fish from a single experiment, replicated in 2 additional independent experiments; quantified in e) during the proliferative (c) and hypertrophy phases (d). e) Fraction of osteoblasts in proliferative state (normalized Venus-hGeminin > normalized mCherry-zCdt) during the proliferative and hypertrophic phases of scale regeneration (error-bars: mean with SD; each circle is a scale from an individual fish in a single trial; two-sided Wilcoxon’s rank-sum test is indicated). f) Flow-cytometry strategy to sort two population of osteoblasts (H2A-mCherry+): one enriched for Venus-hGeminin−/Erk active cells (Erk−) (D, 9. 104, 8. 104, 5. 104 cells in the three samples) and one enriched for Venus-hGeminin+/Erk inactive cells (Erk+) (E, 4. 104, 5. 104, 2. 104 cells in the three samples). g) Gene Set Enrichment Analysis for KEGG MAPK Signalling Pathway, Gene Ontology Bone Mineralization, Morphogenesis and Growth. FDR: False Discovery Rate. Data from 3 samples pooled from 2 independent experiments. h) Normalized counts for expressed Erk-related dusp genes, sprouty (spry) genes and the trans-membrane proteoglycan syndecan-4 (sdc4). DeSeq2 P-adjusted is indicated. i) Fold change of Erk inhibitory gene transcripts in regenerating scales of fish treated with the Mek inhibitor PD0325901 with respect to DMSO controls (error-bars: mean with SD; unpaired two-sided log-normal test P is indicated; 4 dpp scales are used; DMSO: n = 2 samples in a single trial, PD0325901: n = 3 samples in a single trial). j) Enrichment of Erk target spry4 in scales of fish expressing a gene encoding a dominant negative version of the Fibroblast Growth Factor Receptor 1 (Fgfr1) downstream of the heat-shock promoter hsp70l (hsp70l:dnfgfr1-EGFP) with respect to control siblings (error-bars: mean with SD; unpaired two-sided log-normal test P is indicated; 4 dpp scales are used; n = 3 samples per condition in a single trial). Heat-shocked (hs) hsp70l:dnfgfr1-EGFP animals are compared with heat-shocked siblings not carrying the transgene. As an additional control, not heat-shocked (not hs) hsp70l:dnfgfr1-EGFP animals are compared with not heat-shocked siblings not carrying the transgene. Scale-bar: 250 μm. Dpp(hpp): days(hours) post plucking.
Extended Data Figure 6. Tests and consequences of trigger wave model.

This Figure contains extended details on the mathematical model of Erk waves, on the predictions of the models and their experimental tests. a) Mathematical model of Erk dynamics including a diffusible activator, such as Fgf, in turn activated by Erk, and a delayed inhibitor. Activator and inhibitor concentrations (heat map) as a function of time are shown. Red dashed region: activator source region. b, c) Examples of Erk activity and quantifications of wave speed (corrected for tissue growth) in regenerating scales in fish treated with cycloheximide at 4 dpp and controls (error-bars: mean with SD; each circle represents a scale from an individual fish; single trial.) d) Example of Erk activity in fish treated with a concentration of the Mek inhibitor PD0325901 that slows wave propagation, but does not completely impair it, and DMSO control (see Fig. 3f for Erk wave speed quantification, n = 7 scales from 7 fish pooled from 3 independent experiments). e) Example of Erk activity, organized in an expanding ring (arrow-heads), in a developing scale in a juvenile fish throughout time (n > 15 scales in 4 fish in a single trial). f) Wave width for different fold-increases of the activator diffusion constant (simulation; with respect to the standard simulation of Fig. 3, Methods). g) Simulation of growth factor concentration as a function of time in a simple diffusion model and in the Erk trigger wave model. In both models, D ~ 0.1 μm2 s−1 (see Methods). Scale-bar: 250 μm. Hpp: hours post plucking.
Extended Data Figure 7. Erk activity is required for tissue expansion during zebrafish scale hypertrophy.

a) Time delay of expansion peak position versus Erk peak position. Time delay is measured fitting the relationship between expansion peak position and Erk peak position for different lag times with a linear fit (unitary slope; error-bars: best fit with 95% CI; n = 18 expansion peaks from 16 scales from 12 fish pooled from > 5 independent experiments). The expansion peak is taken at the start of the 9 h-long time-window considered to calculate flows. For clarity, a positive lag time means that the position of the Erk peak is taken at a time subsequent to the initial point of the time window used to calculate the expansion peak. b) Average single cell area increase as a function of time from Erk peak (error-bars: mean with SEM; n = 89 cells from 3 scales from 3 fish in a single trial; for each cell track t = 0 is the time of the Erk peak; Erk data is the same presented in Fig. 2f). Each cell area is normalized with cell area at the time of Erk peak (cell area was measured manually using the ErkKTR-mCerulean signal). Dashed lines: linear fit of normalized cell areas before and after the Erk peak (slope before peak: (−0.002 ± 0.002) h−1; slope after peak: (0.006 ± 0.002) h−1; with 68% CI). c) Scale area growth as a function of Erk wave speed, corrected for tissue growth, in ontogenetic and regenerating scales (circles represent individual scales from 12 (regeneration, pooled from > 5 independent experiments) and 3 (juvenile development, single trial) fish; Spearman’s correlation coefficient 0.75, P = 2. 10−4). d) Erk activity, tissue velocity field (tissue flow, blue arrows) and its divergence (heat-map) in scales in fish treated with the Mek inhibitor PD0325901 and DMSO control (n = 4 scales from 4 fish per condition pooled from 2 independent experiments). Here and in e, f, fish are treated at 4 dpp and imaged ~24 h later for ~12 h at 3 h frame-rate. e, f) Total expansion rate of expanding regions (e), normalized for scale area, and AP-velocity component (f) in fish treated with PD0325901 (10 μM) and DMSO control (error-bars: mean with SD; n = 4 scales from 4 fish per condition pooled from 2 independent experiments; unpaired two-sided Student’s t-test is shown). Fish are treated at 4 dpp and imaged ~24 h later for ~12 h (1 frame every 3 h). g) Cumulative number of waves and scale area as a function of time throughout entire scale regeneration (single trial). h) Cumulative number of waves and scale area as a function of time in scales treated with the pan-Fgfr inhibitor BGJ398 (10 μM) for ~3 h at 4 dpp (orange area) and transferred to fresh water thereafter (2 pooled independent experiments). Dpp: days post plucking. Scale-bar: 250 μm.
Extended Data Figure 8. Effects of ectopic and tissue-wide Fgf20a pulses on scale regeneration.

This Figure indicates that tissue-wide and synchronous Erk oscillations induced by Fgf20a ectopic expression display similar temporal dynamics to baseline, wave-dependent Erk activation, and that they impair tissue growth. a) Quantification of spatial pattern of Erk activity in 4 dpp regenerating scales in fish expressing fgf20a downstream of the heat-shock promoter hsp70l (hsp70l:mCherry-2a-fgf20a) and control siblings not carrying the transgene. Erk activity is averaged along a 240 μm-wide stripe passing through the scale centre and the wave origin (n = 4 scales from 4 fish per condition, data from a single trial, replicated in 2 additional independent experiments). b) Erk activity in initially active cells (cytoplasmic ErkKTR > 1.1 nuclear ErkKTR) in hsp70l:mCherry-2a-fgf20a fish and control siblings not carrying the transgene (error-bars: mean with SEM; n = 3 scales from 3 fish per condition pooled from 2 independent experiments). Transgenic fgf20a expression was induced by heat-shock at 3.5 dpp. Scales were imaged starting 4 h after the start of heat-shock for ~12 h (1 frame every 3 h). c) Erk activity, tissue velocity field (tissue flow, blue arrows) and its divergence (heat-map) indicating tissue expansion, in regenerating scales in hsp70l:mCherry-2a-fgf20a fish and control siblings not carrying the transgene. Transgenic fgf20a expression was induced by heat-shock at 3.5 and at 4.5 dpp. Scales were imaged starting 4 h after heat-shock for ~12 h (1 frame every 3 h). Quantifications in d. d) Tissue expansion in regenerating scales in hsp70l:mCherry-2a-fgf20a fish and control siblings not carrying the transgene (error-bars: mean with SD; each circle represents a scale from an individual fish, pooled from 2 independent experiments; unpaired two-sided Student’s t-test P is indicated). Transgenic fgf20a expression was induced by heat-shock at 3.5 and at 4.5 dpp. Scales were imaged starting 4 h after heat-shock for ~9 h (first heat-shock) or ~12 h (second heat-shock) (1 frame every 3 h). e) Average cell area increase as function of time in regenerating scales in hsp70l:mCherry-2a-fgf20a fish and control siblings not carrying the transgene (error-bars: mean with SEM; n = 4 scales from 4 fish per condition in a single trial; chi-squared test P is indicated). Transgenic fgf20a expression is induced by heat-shocking fish every day at the same time (see Methods), starting after the first time-point. f, g) Example of scale morphology as a function of time in fish expressing hsp70l:mCherry-2a-fgf20a and control siblings not carrying the transgene (f, n = 4 scales from 4 fish per condition in a single trial). Average deviation of scale morphology (g, error-bars: mean with SEM, n = 4 scales from 4 fish per condition in a single trial) is measured with respect to before heat-shock by calculating the total discrepancy of the rescaled scale borders in polar coordinates (Methods, chi-squared test P is indicated). Transgenic fgf20a expression is induced by heat-shocking fish every day at the same time (see Methods), starting after the first time-point. Dpp(hpp): days(hours) post plucking; scale-bar: 250 μm.
Extended Data Figure 9. Effects of ectopic and tissue-wide Fgf3 pulses on scale regeneration.

This Figure indicates that Fgf3-induced tissue-wide and synchronous Erk oscillations lead to impaired tissue growth. a, b) Quantification of spatial (a) and temporal (b) patterns of Erk activity in regenerating scales in fish expressing fgf3 downstream of the heat-shock promoter hsp70l (hsp70l:fgf3) and control siblings not carrying the transgene (n = 5 scales from 5 fish per condition from a single trial). Transgenic fgf3 expression was induced by heat-shock every day; fish were imaged before and after heat-shock (shaded regions in b). In a, Erk activity is averaged along a 240 μm-wide stripe passing through the scale centre and the wave origin. In b, the fraction of active Erk cells with respect to total is calculated in the entire scale (cytoplasmic ErkKTR > 1.1 nuclear ErkKTR). c) Average cell area increase (with SEM) as function of time in regenerating scales in hsp70l:fgf3 fish and control siblings not carrying the transgene (error-bars: mean with SEM; n = 5 scales from 5 fish per condition in a single trial; chi-squared test P is indicated). Transgenic fgf3 expression was induced by heat-shock every day starting from 3.5 dpp. Fish were imaged before and after heat-shock (shaded regions in b). d, e) Example of scale morphology as a function of time in fish expressing hsp70l:fgf3 and control siblings not carrying the transgene (d, n = 5 scales from 5 fish per condition in a single trial). Average deviation of scale morphology (e, error-bars: mean with SEM, n = 5 scales from 5 fish per condition in a single trial) is measured with respect to before heat-shock by calculating the total discrepancy of the rescaled scale borders in polar coordinates (Methods, chi-squared test P is indicated). Transgenic fgf3 expression was induced by heat-shock every day; fish were imaged before and after heat-shock (shaded regions in b). Dpp: days post plucking; scale-bar: 250 μm.
Extended Data Figure 10. Minimal mechanical model of tissue growth and tissue flow properties.

Tissue density (a), tissue expansion rate (b, c, calculated as ) and total tissue growth (d) in the case of wave-like and uniform basal tissue growth in 1D mathematical model of tissue growth (see Supplementary Notes). e) Two-point correlator of tissue flow velocities in control scales (error-bars: mean with SD; n= 5 scales from 5 fish pooled from 2 independent experiments). λ is the flow velocity correlation length (with 95% CI). f, g, h) Vorticity of tissue velocity field (f), its two-point correlator (g, error-bars: mean with SD; n= 5 scales from 5 fish pooled from 2 independent experiments) and adimentionalised vorticity (h, v is the average flow absolute velocity and λvorticity is the vorticity correlation length, estimated to be in the order of 30 μm). Note that λvorticity is similar to the length used to calculate the vorticity itself, so it represents an upper limit; smaller values of λvorticity would further decrease adimentionalised vorticity. Average absolute tissue flow vorticity for 5 scales from 5 fish pooled from 2 independent experiments: 0.0007 h−1, 0.0009 h−1, 0.0009 h−1, 0.0008 h−1 and 0.0012 h−1. Average tissue flow speed for 5 scales from 5 fish pooled from 2 independent experiments: 0.4 μm h−1, 0.5 μm h−1, 0.5 μm h−1 , 0.4 μm h−1 and 0.5 μm h−1. i) Position of the divergence trough, i.e. compression peak, (distance from scale centroid; calculated over 9 h) as a function of the position of the trough of - where x is the distance from scale centroid (n = 16 scales from 12 fish from > 5 independent experiments; Pearson’s correlation coefficient 0.87, P = 3. 10−8; dashed line: bisector of the axis). The divergence trough has intensity (−0.002 ± 0.002) h−1 (SD; SEM: 0.0003 h−). j) Quantification of average AP-component of tissue flow velocity, normalized to the norm of the velocity vector, in regenerating scales in hsp70l:mCherry-2a-fgf20a fish and control siblings not carrying the transgene (error-bars: mean with SD; each circle represents a scale from an individual fish, besides “PD03 followed by heat-shock” in which n = 5 scales from 3 fish were imaged; 1st and 2nd heat-shock: pooled from 2 independent experiments each, PD03 followed by heat-shock: single trial; unpaired two-sided Student’s t-test P is indicated). 1st heat-shock: transgenic fgf20a expression was induced by heat-shock at 3.5 dpp; 2nd heat-shock: 3.5 and 4.5 dpp; PD03 followed by heat-shock: fish were treated with PD0325901 (10 μM) for 24 h at 4 dpp, then they were transferred to fresh water and heat-shocked. Finally, fish were returned to the chemical treatment and imaged. Scales were imaged starting 5 h after heat-shock for ~9 h (first heat-shock; PD03 followed by heat-shock) or 12 h (second heat-shock). k) Erk activity in scales treated with PD0325901 (10 μM) and then heat-shocked in fresh water, as described in j, but without returning them to chemical treatment, and imaged. Fraction of Erk active cells with respect to total from 4 scales from 2 fish in a single trial: 0.73, 0.75, 0.64, 0.45. l) Tissue velocity field (tissue flow, blue arrows) and its divergence (heat-map) indicating tissue expansion, in regenerating scales in hsp70l:mCherry-2a-fgf20a fish treated with PD0325901 (10 μM) for 24 h, then heat-shocked, returned to chemical treatment and imaged, as described in j. Quantifications: see j (single trial). Hpp: hours post plucking. Scale-bar: 250 μm.
Supplementary Material
Acknowledgements
We thank J. Burris, S. Miller, K. Oliveri, C. Dolan, L. Frauen, and D. Stutts for zebrafish care. We thank J. M. Cook and the Duke Cancer Institute Flow Cytometry Facility for help with flow cytometry; A. Kawakami and Bruce Riley for generously sharing transgenic fish; I. Rask, H. Kim, S. Li, Z. Weishampel for help with data curation, imaging, fish husbandry and genotyping; V. Cigliola for advice regarding gene expression experiments; M. Bagnat, A. Puliafito, S. Streichan, B. Shraiman, S. Streichan, and M. Vergassola for scientific discussions and advice; and P. Gönczy, B. Hogan and B. Mathey-Prevot for critical reading of the manuscript. A.D.S. was supported by Early (P2ELP3_172293) and Advanced (P300PA_177838) Postdoc.Mobility fellowships from the Swiss National Science Foundation. B.D.C. and V.A.T. were supported by NSF Graduate Research Fellowships (1106401). This work was supported by an Innovation in Stem Cell Science Award from the Shipley Foundation, Inc. to S.D.T. and N.I.H. grant (R01-AR076342) to K.D.P. and S.D.T.
Footnotes
Code availability statement
Zebrafish scale image processing, Erk activity and tissue flow quantification sample MATLAB code is available at https://github.com/desimonea/DeSimoneErkwaves2020.
Competing interests statement
The authors declare no competing interests.
Data availability statement
Reagents are available upon request. Transcriptomics data are available on Gene Expression Omnibus (GSE147551). The microscopy dataset consists of large files (>1 Tb); therefore, microscopy data are available from the authors, without limitation. Source data are provided with this paper.
References
- 1.Gelens L, Anderson GA & Ferrell JE Jr. Spatial trigger waves: positive feedback gets you a long way. Mol Biol Cell 25, 3486–3493, doi: 10.1091/mbc.E14-08-1306 (2014). [DOI] [PMC free article] [PubMed] [Google Scholar]
- 2.Hubaud A, Regev I, Mahadevan L & Pourquie O Excitable Dynamics and Yap-Dependent Mechanical Cues Drive the Segmentation Clock. Cell 171, 668–682 e611, doi: 10.1016/j.cell.2017.08.043 (2017). [DOI] [PMC free article] [PubMed] [Google Scholar]
- 3.Werner S, Vu HT & Rink JC Self-organization in development, regeneration and organoids. Curr Opin Cell Biol 44, 102–109, doi: 10.1016/j.ceb.2016.09.002 (2017). [DOI] [PubMed] [Google Scholar]
- 4.Sonnen KF et al. Modulation of Phase Shift between Wnt and Notch Signaling Oscillations Controls Mesoderm Segmentation. Cell 172, 1079–1090 e1012, doi: 10.1016/j.cell.2018.01.026 (2018). [DOI] [PMC free article] [PubMed] [Google Scholar]
- 5.Deneke VE & Di Talia S Chemical waves in cell and developmental biology. J Cell Biol 217, 1193–1204, doi: 10.1083/jcb.201701158 (2018). [DOI] [PMC free article] [PubMed] [Google Scholar]
- 6.Chara O, Tanaka EM & Brusch L Mathematical modeling of regenerative processes. Curr Top Dev Biol 108, 283–317, doi: 10.1016/B978-0-12-391498-9.00011-5 (2014). [DOI] [PubMed] [Google Scholar]
- 7.Di Talia S & Poss KD Monitoring Tissue Regeneration at Single-Cell Resolution. Cell Stem Cell 19, 428–431, doi: 10.1016/j.stem.2016.09.007 (2016). [DOI] [PMC free article] [PubMed] [Google Scholar]
- 8.Aman AJ, Fulbright AN & Parichy DM Wnt/beta-catenin regulates an ancient signaling network during zebrafish scale development. Elife 7, doi: 10.7554/eLife.37001 (2018). [DOI] [PMC free article] [PubMed] [Google Scholar]
- 9.J Bereiter-Hahn LZ Regeneration of teleost fish scale. Comparative Biochemistry and Physiology Part A: Physiology 105, 625–641, doi: 10.1016/0300-9629(93)90262-3 (1993). [DOI] [Google Scholar]
- 10.Cox BD et al. In Toto Imaging of Dynamic Osteoblast Behaviors in Regenerating Skeletal Bone. Curr Biol 28, 3937–3947 e3934, doi: 10.1016/j.cub.2018.10.052 (2018). [DOI] [PMC free article] [PubMed] [Google Scholar]
- 11.Iwasaki M, Kuroda J, Kawakami K & Wada H Epidermal regulation of bone morphogenesis through the development and regeneration of osteoblasts in the zebrafish scale. Dev Biol 437, 105–119, doi: 10.1016/j.ydbio.2018.03.005 (2018). [DOI] [PubMed] [Google Scholar]
- 12.Sire JY, Allizard F, Babiar O, Bourguignon J & Quilhac A Scale development in zebrafish (Danio rerio). J Anat 190 (Pt 4), 545–561, doi: 10.1046/j.1469-7580.1997.19040545.x (1997). [DOI] [PMC free article] [PubMed] [Google Scholar]
- 13.Rasmussen JP, Vo NT & Sagasti A Fish Scales Dictate the Pattern of Adult Skin Innervation and Vascularization. Dev Cell 46, 344–359 e344, doi: 10.1016/j.devcel.2018.06.019 (2018). [DOI] [PMC free article] [PubMed] [Google Scholar]
- 14.Pasqualetti S, Banfi G & Mariotti M The zebrafish scale as model to study the bone mineralization process. J Mol Histol 43, 589–595, doi: 10.1007/s10735-012-9425-z (2012). [DOI] [PubMed] [Google Scholar]
- 15.Regot S, Hughey JJ, Bajar BT, Carrasco S & Covert MW High-sensitivity measurements of multiple kinase activities in live single cells. Cell 157, 1724–1734, doi: 10.1016/j.cell.2014.04.039 (2014). [DOI] [PMC free article] [PubMed] [Google Scholar]
- 16.Murray JD Mathematical biology. 3rd edn, (Springer, 2002). [Google Scholar]
- 17.Lake D, Correa SA & Muller J Negative feedback regulation of the ERK1/2 MAPK pathway. Cell Mol Life Sci 73, 4397–4413, doi: 10.1007/s00018-016-2297-8 (2016). [DOI] [PMC free article] [PubMed] [Google Scholar]
- 18.Tyson JJ & Keener JP Singular Perturbation-Theory of Traveling Waves in Excitable Media. Physica D 32, 327–361, doi:Doi 10.1016/0167-2789(88)90062-0 (1988). [DOI] [Google Scholar]
- 19.Shibata E et al. Fgf signalling controls diverse aspects of fin regeneration. Development 143, 2920–2929, doi: 10.1242/dev.140699 (2016). [DOI] [PubMed] [Google Scholar]
- 20.Sweet EM, Vemaraju S & Riley BB Sox2 and Fgf interact with Atoh1 to promote sensory competence throughout the zebrafish inner ear. Dev Biol 358, 113–121, doi: 10.1016/j.ydbio.2011.07.019 (2011). [DOI] [PMC free article] [PubMed] [Google Scholar]
- 21.Shraiman BI Mechanical feedback as a possible regulator of tissue growth. Proc Natl Acad Sci U S A 102, 3318–3323, doi: 10.1073/pnas.0404782102 (2005). [DOI] [PMC free article] [PubMed] [Google Scholar]
- 22.Basan M, Risler T, Joanny JF, Sastre-Garau X & Prost J Homeostatic competition drives tumor growth and metastasis nucleation. HFSP J 3, 265–272, doi: 10.2976/1.3086732 (2009). [DOI] [PMC free article] [PubMed] [Google Scholar]
- 23.Irvine KD & Shraiman BI Mechanical control of growth: ideas, facts and challenges. Development 144, 4238–4248, doi: 10.1242/dev.151902 (2017). [DOI] [PMC free article] [PubMed] [Google Scholar]
- 24.Hiratsuka T et al. Intercellular propagation of extracellular signal-regulated kinase activation revealed by in vivo imaging of mouse skin. Elife 4, e05178, doi: 10.7554/eLife.05178 (2015). [DOI] [PMC free article] [PubMed] [Google Scholar]
- 25.Aoki K et al. Propagating Wave of ERK Activation Orients Collective Cell Migration. Dev Cell 43, 305–317 e305, doi: 10.1016/j.devcel.2017.10.016 (2017). [DOI] [PubMed] [Google Scholar]
- 26.Hino N et al. ERK-Mediated Mechanochemical Waves Direct Collective Cell Polarization. Dev Cell 53, 646–660 e648, doi: 10.1016/j.devcel.2020.05.011 (2020). [DOI] [PubMed] [Google Scholar]
- 27.Ogura Y, Wen FL, Sami MM, Shibata T & Hayashi S A Switch-like Activation Relay of EGFR-ERK Signaling Regulates a Wave of Cellular Contractility for Epithelial Invagination. Dev Cell 46, 162–172 e165, doi: 10.1016/j.devcel.2018.06.004 (2018). [DOI] [PubMed] [Google Scholar]
Additional References
- 28.Lee Y, Grill S, Sanchez A, Murphy-Ryan M & Poss KD Fgf signaling instructs position-dependent growth rate during zebrafish fin regeneration. Development 132, 5173–5183, doi: 10.1242/dev.02101 (2005). [DOI] [PubMed] [Google Scholar]
- 29.Nachtrab G, Kikuchi K, Tornini VA & Poss KD Transcriptional components of anteroposterior positional information during zebrafish fin regeneration. Development 140, 3754–3764, doi: 10.1242/dev.098798 (2013). [DOI] [PMC free article] [PubMed] [Google Scholar]
- 30.McKinney SA, Murphy CS, Hazelwood KL, Davidson MW & Looger LL A bright and photostable photoconvertible fluorescent protein. Nat Methods 6, 131–133, doi: 10.1038/nmeth.1296 (2009). [DOI] [PMC free article] [PubMed] [Google Scholar]
- 31.Wan J, Ramachandran R & Goldman D HB-EGF is necessary and sufficient for Muller glia dedifferentiation and retina regeneration. Dev Cell 22, 334–347, doi: 10.1016/j.devcel.2011.11.020 (2012). [DOI] [PMC free article] [PubMed] [Google Scholar]
- 32.Wan J, Zhao XF, Vojtek A & Goldman D Retinal injury, growth factors, and cytokines converge on beta-catenin and pStat3 signaling to stimulate retina regeneration. Cell Rep 9, 285–297, doi: 10.1016/j.celrep.2014.08.048 (2014). [DOI] [PMC free article] [PubMed] [Google Scholar]
- 33.Trapnell C, Pachter L & Salzberg SL TopHat: discovering splice junctions with RNA-Seq. Bioinformatics 25, 1105–1111, doi: 10.1093/bioinformatics/btp120 (2009). [DOI] [PMC free article] [PubMed] [Google Scholar]
- 34.Liao Y, Smyth GK & Shi W featureCounts: an efficient general purpose program for assigning sequence reads to genomic features. Bioinformatics 30, 923–930, doi: 10.1093/bioinformatics/btt656 (2014). [DOI] [PubMed] [Google Scholar]
- 35.Love MI, Huber W & Anders S Moderated estimation of fold change and dispersion for RNA-seq data with DESeq2. Genome Biol 15, doi:ARTN 550 10.1186/s13059-014-0550-8 (2014). [DOI] [PMC free article] [PubMed] [Google Scholar]
- 36.Subramanian A et al. Gene set enrichment analysis: A knowledge-based approach for interpreting genome-wide expression profiles. P Natl Acad Sci USA 102, 15545–15550, doi: 10.1073/pnas.0506580102 (2005). [DOI] [PMC free article] [PubMed] [Google Scholar]
- 37.Mootha VK et al. Integrated analysis of protein composition, tissue diversity, and gene regulation in mouse mitochondria. Cell 115, 629–640, doi: 10.1016/s0092-8674(03)00926-7 (2003). [DOI] [PubMed] [Google Scholar]
- 38.Thompson JD et al. Identification and requirements of enhancers that direct gene expression during zebrafish fin regeneration. Development 147, doi: 10.1242/dev.191262 (2020). [DOI] [PMC free article] [PubMed] [Google Scholar]
- 39.Molina G et al. Zebrafish chemical screening reveals an inhibitor of Dusp6 that expands cardiac cell lineages. Nat Chem Biol 5, 680–687, doi: 10.1038/nchembio.190 (2009). [DOI] [PMC free article] [PubMed] [Google Scholar]
- 40.Carroll KJ et al. Estrogen Defines the Dorsal-Ventral Limit of VEGF Regulation to Specify the Location of the Hemogenic Endothelial Niche. Developmental Cell 29, 437–453, doi: 10.1016/j.devcel.2014.04.012 (2014). [DOI] [PMC free article] [PubMed] [Google Scholar]
- 41.Luu-The V, Paquet N, Calvo E & Cumps J Improved real-time RT-PCR method for high-throughput measurements using second derivative calculation and double correction. Biotechniques 38, 287–293, doi:Doi 10.2144/05382rr05 (2005). [DOI] [PubMed] [Google Scholar]
- 42.Amat F et al. Fast, accurate reconstruction of cell lineages from large-scale fluorescence microscopy data. Nat Methods 11, 951–958, doi: 10.1038/nmeth.3036 (2014). [DOI] [PubMed] [Google Scholar]
- 43.Sommer C, Straehle C, Kothe U & Hamprecht FA Ilastik: Interactive Learning and Segmentation Toolkit. I S Biomed Imaging, 230–233 (2011). [Google Scholar]
- 44.Grossmann C, Roos H.-G. r. & Stynes M Numerical treatment of partial differential equations. (Springer, 2007). [Google Scholar]
Associated Data
This section collects any data citations, data availability statements, or supplementary materials included in this article.
Supplementary Materials
Data Availability Statement
Reagents are available upon request. Transcriptomics data are available on Gene Expression Omnibus (GSE147551). The microscopy dataset consists of large files (>1 Tb); therefore, microscopy data are available from the authors, without limitation. Source data are provided with this paper.