

SUMMARY
Homeostatic plasticity is hypothesized to bidirectionally regulate neuronal activity around a stable set point to compensate for learning-related plasticity, but to date only upward firing rate homeostasis (FRH) has been demonstrated in vivo. We combined chronic electrophysiology in freely behaving animals with an eye-reopening paradigm to enhance firing in primary visual cortex (V1) and found that neurons bidirectionally regulate firing rates around an individual set point. Downward FRH did not require N-methyl-D-aspartate receptor (NMDAR) signaling and was associated with homeostatic scaling down of synaptic strengths. Like upward FRH, downward FRH was gated by arousal state but in the opposite direction: it occurred during sleep, not during wake. In contrast, firing rate depression associated with Hebbian plasticity happened independently of sleep and wake. Thus, sleep and wake states temporally segregate upward and downward FRH, which might prevent interference or provide unopposed homeostatic compensation when it is needed most.
In Brief
Torrado Pacheco et al. show that neurons regulate their firing around an individual set point following perturbations of activity in either direction. Downward homeostatic regulation is restricted to sleep, whereas upward homeostatic regulation only occurs during wake. This segregation by arousal state may optimize cooperation among brain plasticity mechanisms.
INTRODUCTION
Proper functioning of neocortical networks requires that they be simultaneously plastic and stable, and these demands necessitate the expression of various Hebbian and homeostatic mechanisms that modify synaptic connections and neuronal firing rates (Turrigiano and Nelson, 2004). We use “Hebbian” here to refer to plasticity mechanisms that alter synaptic strengths as a function of correlations in pre- and postsynaptic activity (Abbott and Nelson, 2000; Caporale and Dan, 2008). The action of these plasticity mechanisms is specific to subsets of synapses, as opposed to the global effects of homeostatic synaptic plasticity. Another feature of many forms of Hebbian plasticity is that they require the activity of N-methyl-D-aspartate receptors (NMDARs) (Malenka and Bear, 2004; Lüscher and Malenka, 2012; Lisman, 2017). Hebbian plasticity mechanisms are widely considered to provide the basis for long-term storage of information in the brain, but they are also theorized to be intrinsically destabilizing when left unchecked. Modeling studies support this idea and generally conclude that neuronal networks require compensatory forces that stabilize activity during experience-dependent plasticity and learning (Miller and MacKay, 1994; Tetzlaff et al., 2011; Litwin-Kumar and Doiron, 2014). Homeostatic mechanisms are thought to provide this balance by regulating neuronal activity around a stable firing rate set point, a process known as firing rate homeostasis (FRH) (Turrigiano and Nelson, 2004). Upward FRH has been convincingly demonstrated in the mammalian visual system in vivo using various approaches (Kaneko et al., 2008; Keck et al., 2013; Hengen et al., 2013, 2016; Barnes et al., 2015) and strikingly is gated by behavioral state so that it occurs exclusively during the active wake (AW) state (Hengen et al., 2016). Here we ask whether FRH is bidirectional, as theory predicts, and whether upward and downward homeostatic plasticity are gated similarly by sleep/wake states.
It is widely accepted that sleep and wake play a key role in regulating brain plasticity, but experiments designed to understand the details of this regulation have yielded contradictory results (Puentes-Mestril and Aton, 2017). A prominent hypothesis (the synaptic homeostasis hypothesis [SHY]) posits that a net potentiation of synaptic strengths and firing rates occurs during waking, whereas the function of sleep, and in particular of non-rapid-eye-movement (NREM) sleep, is to enable homeostatic downregulation of these parameters (Tononi and Cirelli, 2003, 2014). Evidence supporting SHY has accumulated, but it remains a controversial theory (Frank and Cantera, 2014). Neuronal firing rates have been found to be higher after wake in the rat somatosensory cortex (Vyazovskiy et al., 2009) but not different across sleep or wake in visual cortex (Hengen et al., 2016), whereas other experiments find that sleep- and wake-driven changes in firing rate are not uniform across neuronal populations (Watson et al., 2016). These findings focused on firing rate dynamics in the absence of plasticity induction. Here we combine our ability to track the activity of individual neurons with a protocol that triggers robust plasticity to specifically dissect the impact of sleep and wake states on downward FRH.
To induce and observe downward FRH, we performed chronic electrophysiology in monocular visual cortex (V1m) of freely behaving rats undergoing monocular deprivation (MD) followed by eye reopening (ER) on day 5 of MD, a protocol known to increase activity within primary visual cortex (V1) (Toyoizumi et al., 2014). We found a robust increase in firing within 24 h of ER, followed by a gradual return of individual neurons’ firing rates to their pre-MD levels. Using blockade of NMDARs and measurements of synaptic strengths in acute slices, we showed that the firing rate overshoot following ER is consistent with Hebbian plasticity mechanisms, whereas the subsequent recovery of activity is consistent with homeostatic synaptic scaling. This downward FRH only occurred during sleep, in contrast to upward FRH, which happened during wake (Hengen et al., 2016). It was also significantly slower when sleep was reduced using an intermittent sleep deprivation (SD) paradigm, indicating a key role for sleep in mediating downward FRH. We wondered whether Hebbian plasticity was also gated by sleep and wake. When we analyzed the MD-induced reduction in firing rate (mainly driven by Hebbian long-term depression [LTD]), we found that it unfolded independently of sleep and wake states. Our data support a model in which downward Hebbian plasticity happens independently of sleep and wake, whereas homeostatic mechanisms are differentially gated by sleep and wake states depending on the direction of compensation. This behavioral-state segregation of upward and downward homeostasis could prevent interference between them during experience-dependent plasticity or learning.
RESULTS
Bidirectional homeostatic regulation of firing has not been demonstrated in vivo, and the role of sleep in its induction is unknown. Furthermore, it is unclear how homeostatic and Hebbian mechanisms are integrated in vivo and whether sleep and wake states play a role in their orchestration. To examine these questions, we recorded single-unit activity from V1m of freely behaving rats undergoing MD and then ER and analyzed the behavior of individual putative pyramidal neurons that could be continuously recorded during this paradigm. We monitored and manipulated sleep and wake states throughout these multi-day recordings to assess their impact on plasticity and paired this with pharmacology and ex vivo synaptic interrogation to tease apart the impact of sleep and wake states on different plasticity mechanisms.
ER after MD Causes an Overshoot in Firing Rates Followed by Homeostatic Recovery
Prolonged MD in rats induces biphasic changes in activity in V1 in vivo, consisting of an initial drop in activity, followed by an upward homeostatic rebound (Hengen et al., 2016). To determine whether the homeostatic regulation of firing is bidirectional, we sought to cause an overshoot in firing above baseline and ask whether activity would again recover. To achieve this, we bilaterally recorded single-unit activity in V1m continuously for 9–11 days in freely behaving young rats (recordings initiated at postnatal day [P] 24–P26); after 3 days of baseline recording, animals underwent MD, and then on the 5th day of MD (when the firing rates of V1m neurons have returned to baseline), we reopened the eye (ER). In this experimental design, neurons recorded from the hemisphere ipsilateral to the manipulated eye constitute a within-animal control (control hemisphere). We separated recorded units into regular spiking units (RSUs, putative pyramidal neurons) and fast-spiking units (FS, putative inhibitory interneurons) using standard methods (Niell and Stryker, 2008; Hengen et al., 2013) (Figure S1B) and restricted our analysis to RSUs. We reproduced our previous finding that firing rates drop after 2 days of MD and subsequently recover to baseline (Figure S1A). ER on day 5 after MD caused a similar biphasic pattern of change in the opposite direction, namely, an overshoot of activity above baseline levels, followed by a downward recovery (Figures 1A–1D and S1A). To analyze this, we focused on the time around ER. We analyzed the activity of neurons starting on the 4th day after MD (MD4), when firing rates are back to baseline levels, on average (Figure S1A). To measure the change in firing induced by ER, we normalized each cell’s activity to its mean during the 12 h before ER (i.e., dark phase on MD4), taking this period as our new baseline. ER increased firing in individual neurons with different baseline firing rates, followed by a slow recovery back to baseline (Figure 1B). Neurons in the control hemisphere were unaffected by ER (Figure 1A). The same pattern was observed when firing rates across the population were normalized and averaged (reopened hemisphere, n = 36 neurons from 5 animals; control hemisphere, n = 31 neurons from 5 animals) (Figures 1C and 1D). The same results were obtained when computing the geometric rather than arithmetic mean (Figures S1G and S1H).
Figure 1. Eye Reopening after MD Causes an Overshoot in Firing Followed by Homeostatic Recovery.
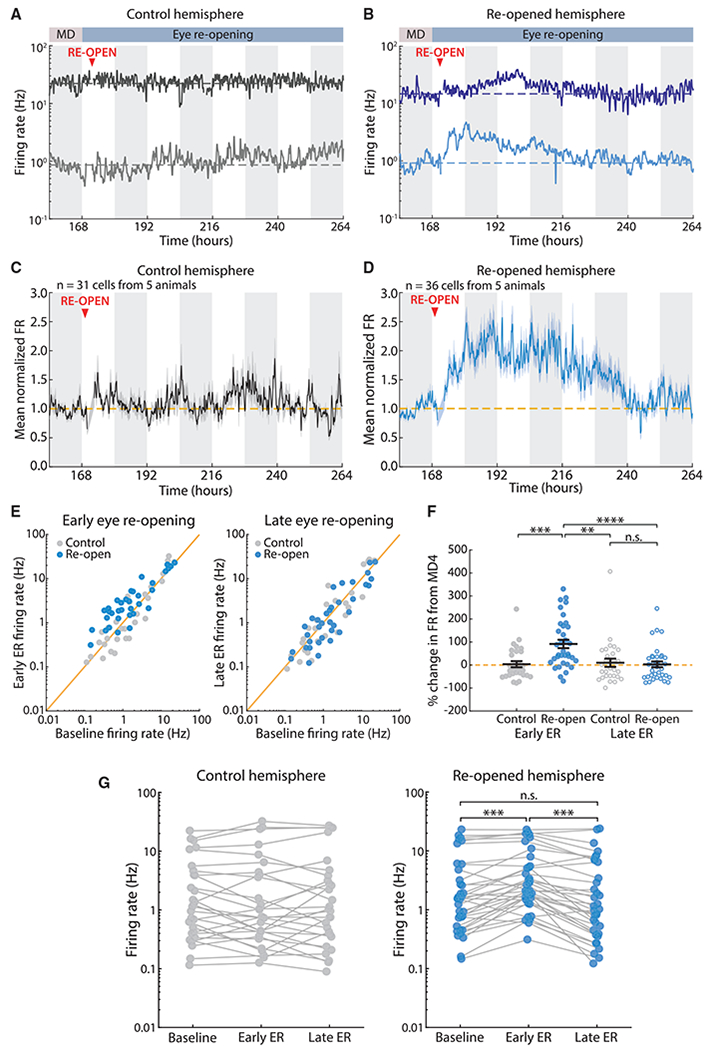
(A) Example neurons recorded continuously from the control hemisphere for 5 days. Here and below, solid lines represent the firing rate of a single neuron, the dashed line indicates the mean firing rate (FR) of the neuron during the baseline (MD4) period, white and gray bars in the background indicate 12 h of light and dark, and the artifact from unplugging animals for ER surgery has been removed.
(B) Example neurons recorded continuously from the reopened hemisphere for 5 days.
(C and D) Average firing rate traces for all neurons recorded in control and reopened hemispheres, normalized to baseline (MD4) for each cell.
(E) Comparison of individual neuronal firing rates between baseline (MD4) and early ER (left) or late ER (right). Each dot is the mean firing rate of a neuron averaged over the corresponding 12-h period. The yellow line indicates unity.
(F) Percentage of change in firing rate from baseline at early ER and late ER for recorded neurons. Black lines indicate mean ± SEM. Control, n = 31; reopen, n = 36; Kruskal-Wallis test (p < 0.0001) with Tukey-Kramer post hoc; n.s. (not significant) p = 0.99, **p = 0.003, ***p = 0.002, ****p = 0.0004.
(G) Mean firing rate of every cell at baseline (MD4), early ER, and late ER. Each dot represents the mean firing rate of a neuron over the corresponding 12-h period, and mean firing rates for the same neuron are connected via solid lines. Control, n = 31; reopen, n = 36; Wilcoxon sign-rank test with Bonferroni correction; ***p < 0.001.
V1 RSUs have mean firing rates that span several orders of magnitude. To examine activity patterns across the population, we compared the firing rate on MD4 (baseline) to firing rates on day 2 or day 4 after ER (early ER [ER2] or late ER [ER4]) for each neuron (Figures 1E–1H). On ER2, most neuronal firing rates from the reopened hemisphere were elevated compared with controls (Figure 1E), whereas the two distributions were similar by ER4 (Figure 1E). We quantified the changes at these time points by computing the percentage of change in firing rate from the MD4 baseline (Figure 1F). The firing rates of reopened hemisphere neurons roughly doubled on ER2 (114% ± 23% change from MD4), but by ER4, the mean change from MD4 was near 0% (2% ± 13%) and similar to the mean change for control neurons (10% ± 18%). Examining the behavior of individual neurons across time showed a significant change only in the reopened hemisphere, where most neurons increase and then decrease firing (30/36 neurons, i.e., 83.3%, showed an increase of more than 1 standard deviation from baseline in their mean firing rate calculated in 12-h bins) (Figure 1G). We used a bootstrap analysis to show that the mean change between baseline and ER4 of close to 0% in the reopened hemisphere cannot be explained unless each neuron’s firing rate returns close to its initial baseline rate (Figures S2A–S2D), suggesting that—in agreement with upward FRH (Hengen et al., 2016)—neurons regulate firing around an individual set point.
These data demonstrate that neuronal firing rates are homeostatically regulated in vivo in a bidirectional manner and that during downward FRH, neurons return close to an individual firing rate set point.
ER-Induced Firing Rate Overshoot, but Not Downward Recovery, Is NMDAR-Dependent
Long-lasting changes in firing can be driven by various plasticity mechanisms mediated by distinct signaling pathways. We set out to test whether the changes caused by ER depended on the activity of NMDARs, which are required for many forms of Hebbian plasticity (Malenka and Bear, 2004), but not for homeostatic synaptic scaling (Turrigiano et al., 1998). To this effect, we used systemic injections of 3-(2-carboxypiperazin-4-yl)propyl-1-phosphonic acid (CPP), a potent NMDAR antagonist that has been shown to block induction of long-term potentiation (LTP) up to 24 h after administration without affecting visual function (Villarreal et al., 2002; Sato and Stryker, 2008; Toyoizumi et al., 2014). When CPP was injected at the time of ER, it blocked the increase in firing (Figures 2A and 2C; n = 15 neurons from 3 animals). We found no change in the distribution of firing rates between MD4 and ER2 in this case and a slight decrease between ER2 and ER4 (Figure 2E). Neurons in this condition showed no change in firing at ER2 (Figure 2F; 6% ± 16%), and a slight decrease from ER2 to ER4 (Figure 2F; −32% ± 6%). Thus, CPP can block the firing rate overshoot induced by ER, suggesting that ER potentiates firing via NMDAR-dependent plasticity, as suggested previously (Toyoizumi et al., 2014).
Figure 2. ER-Induced Firing Rate Overshoot, but Not Downward Recovery, Is NMDAR-Dependent.
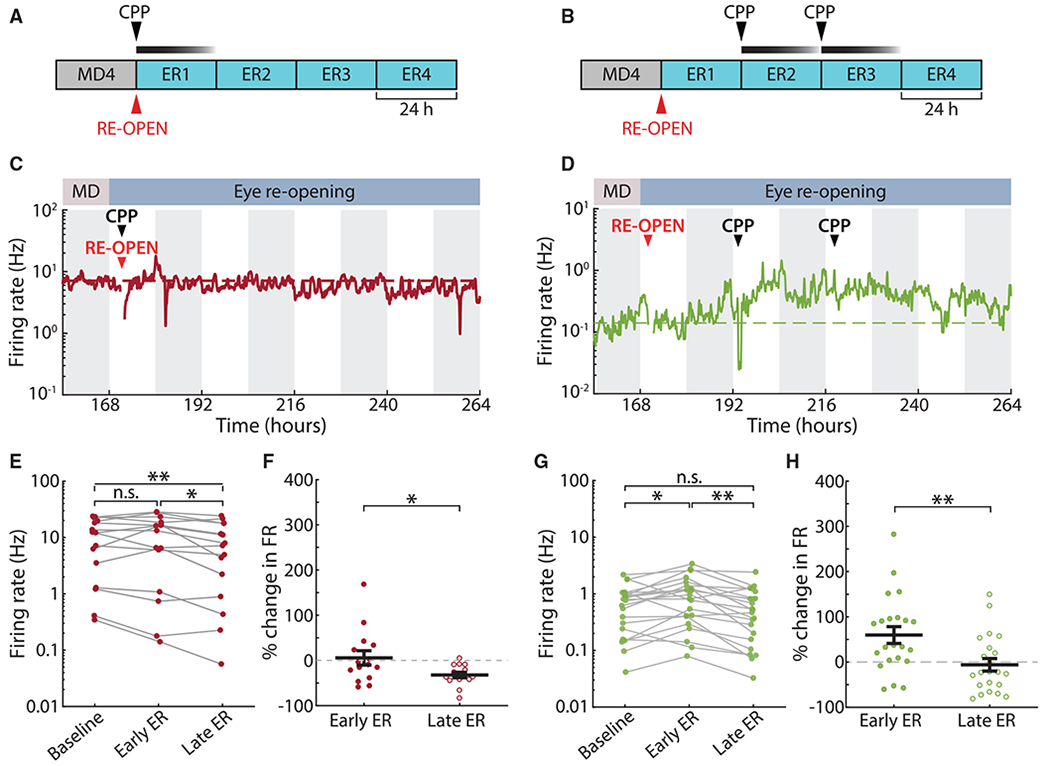
(A and B) Experiment schematic: the NMDAR antagonist CPP (15 mg/kg) was injected subcutaneously once at the time of eye reopening (A) or twice after that at 24-h intervals (B).
(C and D) Example firing rates of neurons recorded in each of the CPP experiments.
(E) Change in firing rate from baseline to early ER to late ER for neurons recorded in the first CPP condition (one injection at time of ER). n = 15; Wilcoxon sign-rank test with Bonferroni correction; *p = 0.0251, **p = 0.0026.
(F) Percentage of change in firing rate from baseline in the first CPP condition. One-sample t test compared with mean = 0; ER2, p = 0.723; ER4, p < 10−4. n = 15; two-sample t test; *p = 0.0293.
(G) As in (E), but for the second CPP condition (two injections, 24 and 48 h after ER). n = 22; Wilcoxon sign-rank test with Bonferroni correction; *p = 0.0269, **p = 0.0014.
(H) As in (F), but for the second CPP condition. One-sample t test compared with mean = 0; ER2, p = 0.003; ER4, p = 0.657. Two-sample t test; **p = 0.0058.
Many homeostatic plasticity mechanisms do not require NMDAR activity (Turrigiano, 2008). If downward FRH results from NMDAR-independent homeostatic plasticity, we should see little effect on the downward homeostatic recovery of firing rates if we administered CPP after ER potentiates firing. We tested this by injecting CPP twice, at 24-h intervals, starting 24 h after ER (Figure 2B). Despite a small and acute depressive effect of CPP on activity immediately following administration in both hemispheres (Figures S2E and S2F), we observed a normal ER-induced increase before CPP administration (firing rate change at ER2: 60% ± 18%) and then a recovery of firing in this condition, similar to un-injected animals (Figures 2D, 2G, and 2H; n = 22 neurons from 3 animals). Relevant to our sleep/wake analysis given later, CPP did not affect the total amount of sleep (Figure S8; see STAR Methods for more details).
We conclude that the increase in firing rate following ER does not simply result from increased sensory drive but is instead an active process that requires NMDAR-dependent plasticity. Conversely, the subsequent downward FRH is independent of NMDAR activity, consistent with it being driven by homeostatic plasticity mechanisms.
Downward Firing Rate Recovery Is Associated with Synaptic Scaling Down
After establishing that downward FRH is NMDAR independent, we wished to know whether it is accompanied by synaptic scaling down, one of the principal forms of homeostatic plasticity within V1 (Turrigiano et al., 1998; Turrigiano, 2008). We performed MD and ER as described earlier, took acute slices of V1m either 24 h (ER2) or 72 h (ER4) after ER, and recorded miniature excitatory postsynaptic currents (mEPSCs) from layer 2/3 pyramidal neurons in V1m (Figures 3A and 3B). Neurons in the control hemispheres of the same animals were used as controls. Although mEPSC amplitudes were stable in the control condition (ER2:10.82 ± 0.35 pA, n = 27 neurons, 11 animals; ER4:10.32 ± 0.24 pA, n = 17 neurons, 7 animals), neurons in the reopened hemisphere showed a significant increase in mEPSC amplitudes at ER2 (11.56 ± 0.21 pA, n = 25 neurons, 11 animals) and then depression by ER4 (10.51 ± 0.23 pA, n = 22 neurons, 4 animals) (Figure 3C). There were no changes in mEPSC frequency, passive neuronal properties, or waveform kinetics for any conditions (Figures S3A–S3G). Analysis of the cumulative distribution function (CDF) for all recorded mEPSC events revealed a significant shift to higher amplitudes in the ER2 reopened condition, compared with both ER4 reopened (p < 10−5) and ER4 control (p < 10−6) (Figure 3D).
Figure 3. Downward Firing Rate Recovery Is Associated with Synaptic Scaling Down.
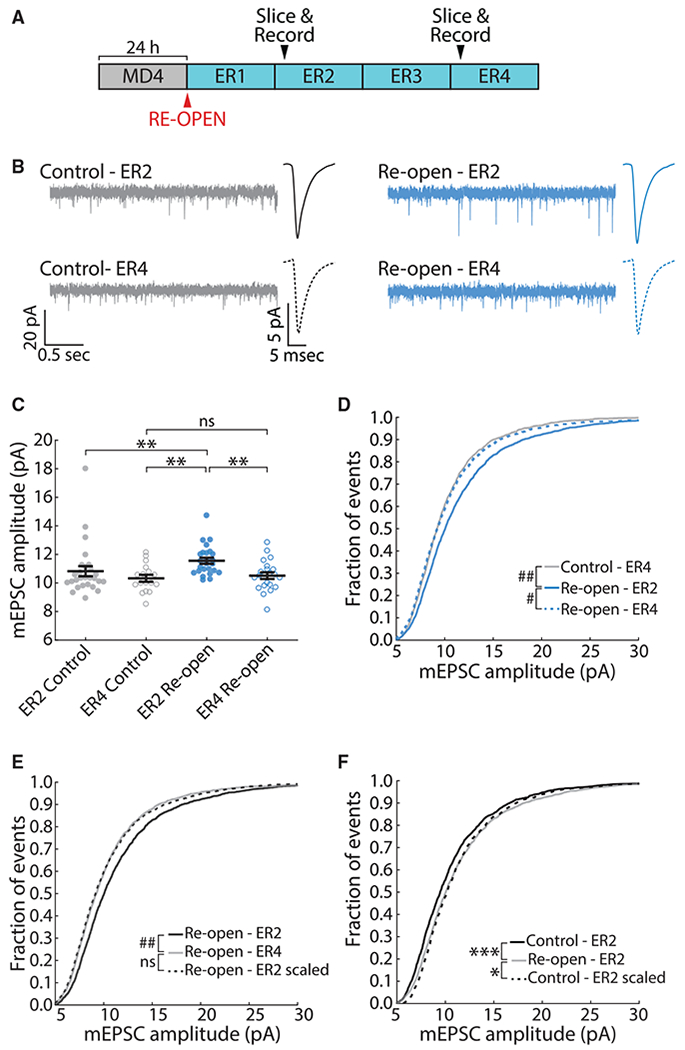
(A) Schematic of experimental timeline. Slices were taken 24 h (ER2) or 72 h (ER4) after ER.
(B) Example recordings of mEPSCs in L2/3 pyramidal neurons in V1. Average peak-aligned mEPSC waveforms for each condition are also shown.
(C) Average mEPSC amplitude in each condition. Each dot represents one neuron. Black lines represent mean ± SEM. Kruskal-Wallis test (p < 0.001); ER2 control, n = 27; ER4 control, n = 17; ER2 reopen, n = 25; ER4 reopen, n = 22; **p < 0.01.
(D) Cumulative distribution of mEPSC amplitudes. Kuiper test with Bonferroni correction; # p < 10−5, ## p < 10−6.
(E) Cumulative distribution of mEPSC amplitudes. The black dotted line represents ER2 reopen distribution scaled according to the linear function f(x) = 0.877x + 0.318. Kuiper test; ## p < 10−6.
(F) As in (E) but comparing the amplitude distribution at ER2 in control versus reopen conditions. The ER2 control distribution has been scaled according to the linear function f(x) = 0.999x + 0.692. Kuiper test; *p = 0.0377, ***p < 0.001.
Homeostatic synaptic scaling affects mEPSC amplitudes in a uniform manner (Turrigiano et al., 1998). To test whether the change in mEPSC amplitude between ER2 and ER4 is consistent with synaptic scaling down, we plotted ranked ER2 reopened amplitudes against ranked ER4 reopened amplitudes and fit a linear function to the resulting plot (Figures S3H and S3I). We then scaled the ER2 distribution using this function (Figure 3E). Although the unscaled CDFs are significantly smaller on ER4 than ER2 (p < 10−6), the scaled-down ER2 CDF was almost identical to the ER4 CDF, and the two are statistically indistinguishable (p = 0.575), consistent with synaptic scaling. We next asked whether the potentiation of synaptic strength on ER2 was also consistent with synaptic scaling; in this case, we found that the scaled control CDF did not recapitulate the ER2 reopened CDF and remained statistically distinct (p = 0.038), indicating a nonuniform change in strength across synapses, consistent with a non-homeostatic form of synaptic plasticity.
It has been suggested that this procedure cannot accurately detect multiplicative synaptic scaling (Hanes et al., 2020). We therefore simulated perfect multiplicative scaling to assess the reliability of this standard approach (Turrigiano et al., 1998; Blackman et al., 2012; Kim et al., 2012). To do this, we generated two artificial distributions of mEPSC amplitudes based on realistic synaptic parameters, scaled one of them by a known factor, and applied the preceding analysis method (see STAR Methods). The results of our linear fit procedure for this artificial perfect multiplicative scaling are indistinguishable from those obtained when analyzing real data (Figures S3H and S4). Thus, our procedure can reliably detect multiplicative scaling.
Together with the effects of NMDAR blockade, these data support the conclusion that a Hebbian, LTP-like mechanism contributes to firing rate potentiation following ER, whereas synaptic scaling down contributes to downward FRH.
Downward FRH Is Gated by Sleep
We have previously shown that upward FRH is expressed only during periods of wake (Hengen et al., 2016), but it is unknown whether homeostatic changes in the downward direction are regulated in this same way. We took advantage of our ability to record continuously from neurons during downward FRH, when animals naturally cycle between periods of sleep and wake, to investigate this. Animals’ behavioral state was classified with the aid of a supervised learning algorithm using a combination of local field potential (LFP), electromyogram (EMG), and video analysis (Figure S5A; see STAR Methods). We first examined sleep- or wake-dense periods (2.5 h with at least 70% sleep or wake) (Figure 4A) over the 36-h period when neuronal firing rates on average are decreasing. Consistent with our previous results (Hengen et al., 2016), sleep and wake had no impact on firing rate in the control hemisphere. In contrast, in the ER hemisphere, decreases in firing rate occurred exclusively during sleep-dense periods (Figure 4B). Results remained similar when key analysis parameters (such as window size and density percentage threshold) were changed (Figure S6A). The activity of most neurons in the reopened hemisphere decreased across sleep-dense periods, but not during periods of wake (Figure 4C).
Figure 4. Downward FRH Occurs during Sleep-Dense, but Not Wake-Dense, Periods.
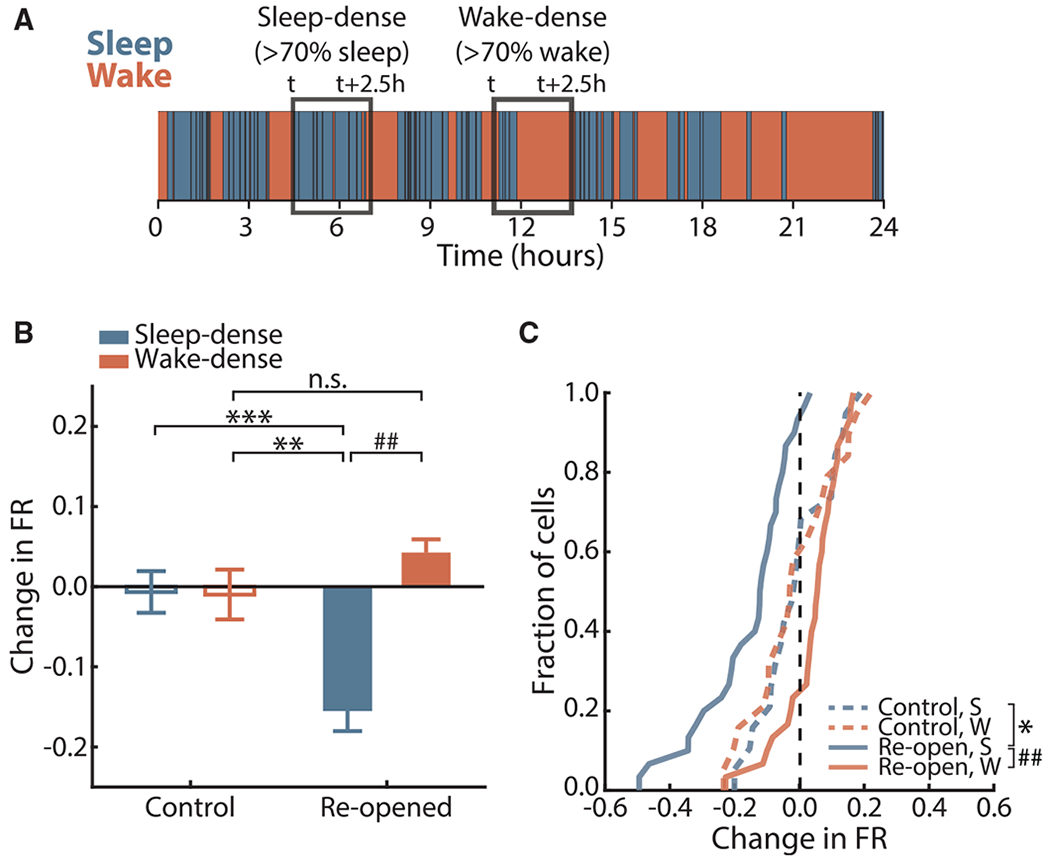
(A) Schematic of state-dense analysis.
(B) Average change in firing rate over sleep-dense (S) or wake-dense (W) windows in control and reopened hemispheres. Bars represent mean ± SEM. Kruskal-Wallis test (p < 10−6) with Tukey-Kramer post hoc; control S, n = 19 neurons, 13 windows; control W, n = 19 neurons, 10 windows; reopen S, n = 36 neurons, 13 windows; reopen W, n = 36 neurons, 14 windows; **p = 0.0051, ***p = 0.0031, ## p < 10−7.
(C) Cumulative distribution function of mean change in firing rate across S or W windows for all neurons. Vertical dashed line indicates no change. Two-sample Kolmogorov-Smirnov test with Bonferroni correction; control, n = 19; reopened, n = 36; *p =0.0380, ## p < 10−6.
We further classified behavior into four vigilance states: rapid eye movement (REM) sleep, NREM, quiet wake (QW), and active wake (AW). Comparisons of mean firing rates across these states are complicated by small but consistent differences in activity between them (Figures S5D and S5E). We therefore used an approach based on analysis of extended sleep or wake (defined as at least 30 min of sleep/wake without interruptions greater than 1 min; see Miyawaki and Diba, 2016). In each of these periods, we measured the mean firing rate of neurons in a given state (e.g., NREM). This allowed us to compare firing rates in one state as a function of time spent asleep/awake (Figures 5A and 5B). We plotted the mean firing rate of each neuron (same dataset as Figure 1) in the behavioral state of interest as a function of the time from the start of the extended sleep/wake episode, Z scored to the mean of the whole episode. In the reopened hemispheres, there was a significant negative correlation between neuronal activity in NREM and time from the start of extended sleep (r = −0.192, p < 10−34), and a similar pattern in REM (r = −0.119, p < 10−10) (Figure 5C). These correlations were absent from both NREM and REM in control neurons (Figure 5E), as well as in reopened neurons during both wake states (Figure 5G), indicating that the decrease in firing was specific to extended sleep episodes in the reopened hemisphere. Corroborating these results, we found a decrease in firing rate between the first and the last NREM and REM episodes in the reopened hemisphere (Figure 5D) but not in the other two conditions (Figures 5F and 5H). To determine whether the cumulative change in firing measured across many sleep states can account for the recovery in firing rates during downward FRH, we measured the slope of the relationship in Figure 5C and calculated the expected recovery for each neuron based on the time the animal spent asleep during ER2-ER4; this simulation matched the data well (Figure S7; see STAR Methods).
Figure 5. During Downward FRH, Firing Rates Depress as a Function of Time Spent Asleep.
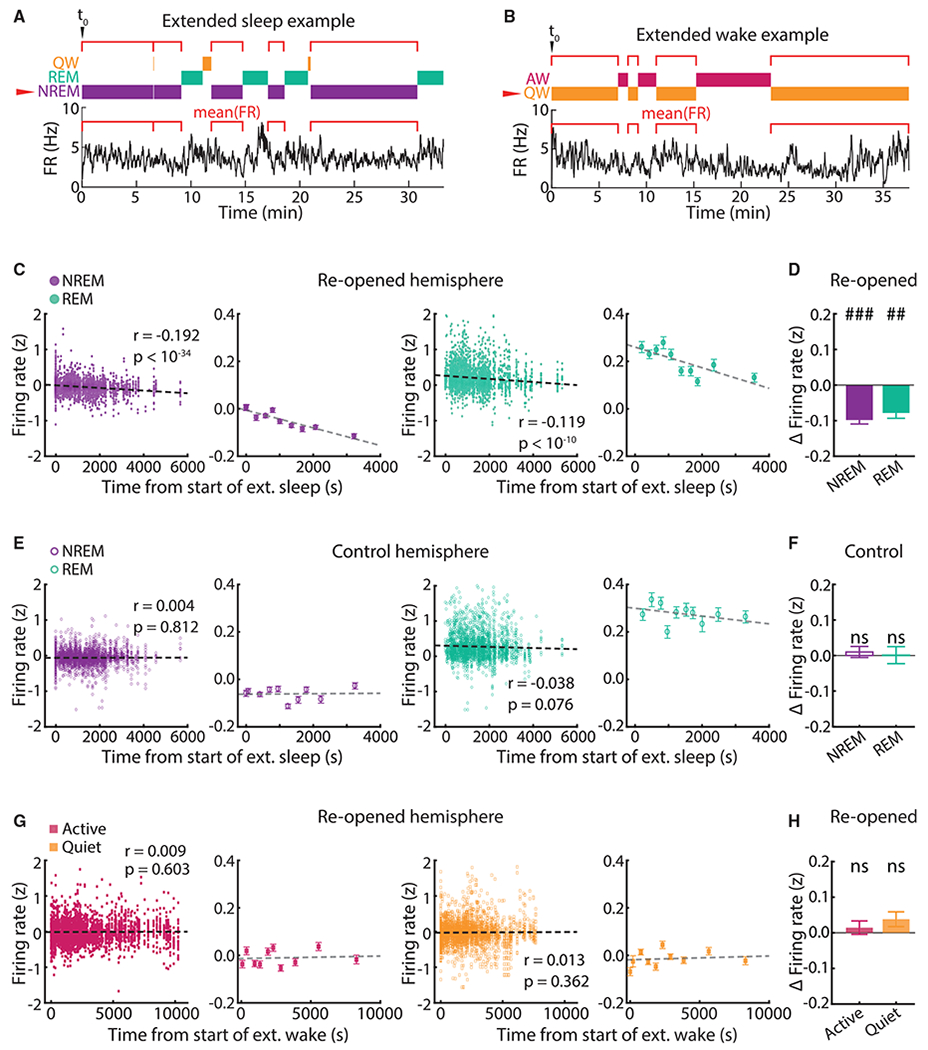
(A) Schematic of extended sleep analysis for one neuron. Individual epochs of a state (NREM in this example) are found within an extended sleep episode, and the neuron’s mean firing rate is calculated in each one; these values are then plotted against the start time of that epoch, aligned to the start of the whole episode (t0).
(B) As in (A), but showing an example extended wake episode.
(C) Correlation between firing rate in NREM and REM and time from start of extended sleep in the reopened hemisphere. All data points are shown in the left panels; the right panels show data in 10 groups of equal size for ease of visualization (dots show mean ± SEM). Pearson r and associated p values were computed on the ungrouped data (NREM, n = 4,036 data points; REM, n = 3,161 data points). Firing rates were Z scored to the extended sleep episode.
(D) Difference in firing rate between the last and the first NREM (left) or REM (right) epoch within an extended sleep episode, averaged across all episodes. Bars show mean ± SEM. One-sample t test compared with mean = 0; n = 74 episodes; ## p < 10−6, ### p < 10−17.
(E and F) As in (C) and (D), but for NREM and REM in the control hemisphere (NREM, n = 2,933 data points; REM, n = 2,249 data points). In (F), one-sample t test compared with mean = 0; n = 47 episodes.
(G and H) As in (C) and (D), but for active wake (AW, n = 4,156 data points) and quiet wake (QW, 5,131 data points) in the reopened hemisphere. In (H), one-sample t test compared with mean = 0; n = 70 episodes.
Importantly, we asked whether circadian effects play a role. We calculated the Z scored firing rate change between the last and the first NREM episode in each period of extended sleep and plotted these against the time of day at which that extended sleep period started. Firing rate decreases were visible in extended sleep epochs at all circadian times with no discernable circadian oscillation (Figure S6B). In addition, all findings in Figure 5 were nearly identical when we repeated the analysis separately for periods of extended sleep occurring in the light phase or the dark phase (Figures S6C and S6D). Altogether, these analyses suggest that circadian effects are negligible. An interesting discrepancy is the significant (though weak) negative correlation for REM sleep in the control hemisphere, specifically in the light (Figure S6D). Whether this effect is meaningful is hard to say: the difference between last and first REM states within extended sleep was not significant for these data (Figure S6D).
Altogether, these results show that downward FRH is happening exclusively during periods of sleep. Furthermore, control neurons show no consistent decrease in firing during sleep, which demonstrates that sleep does not constitutively drive changes in firing rate but rather enables the expression of downward FRH.
Sleep Deprivation Prevents Downward FRH after ER
To establish a causal link between sleep and downward FRH, we used an intermittent SD paradigm to reduce sleep during the homeostatic recovery phase and determine whether this slowed downward FRH. Animals were kept awake for a full hour at a time via introduction of new toys and gentle handling (prolonged wake epochs). Rats were then allowed to sleep (recovery sleep epochs), and a new session of SD was started when they naturally awoke again. This intermittent deprivation avoids excessive stress while producing a significant reduction in sleep. Animals were sleep deprived in this manner during two 12-h periods, corresponding to the light phases of ER2 and ER3 (the 2nd and 3rd day after ER), when animals normally sleep the most (Figure 6A). This protocol resulted in a significant decrease in the total time spent asleep during those 12-h periods (Figure 6D, SD1 and SD2), but not in the following 12 h of light (Figure 6D, no SD) or in any dark periods (Figure 6E).
Figure 6. Sleep Deprivation (SD) during Downward FRH Slows the Restoration of Firing Rates.
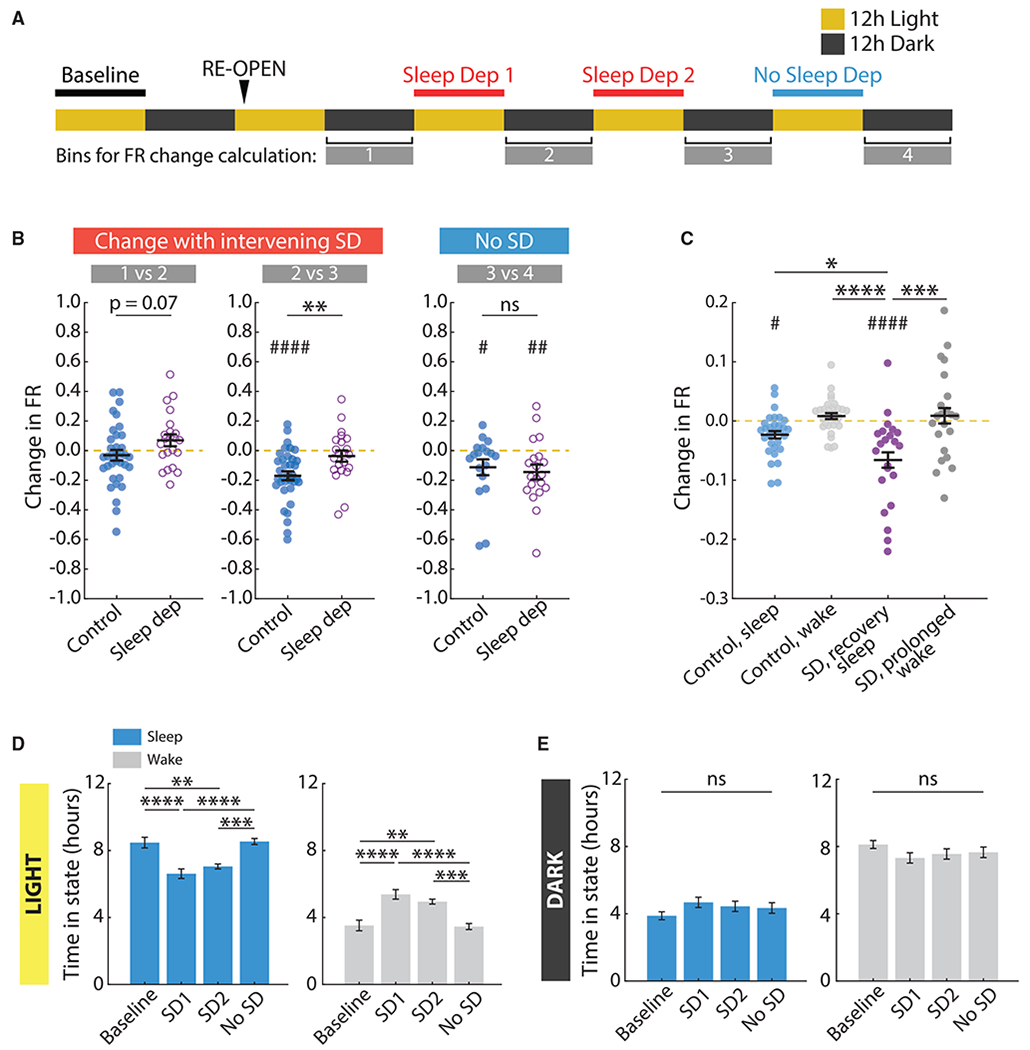
(A) Diagram of the SD paradigm and analysis. Yellow and gray rectangles represent 12 h of light and dark, respectively. Animals were sleep deprived during two 12-h periods during the light phase of ER2 and ER3. The 12-h bins corresponding to the dark phases were used to calculate average firing rates for individual neurons. The change in firing rate was then calculated across each SD period and for the last light period (no SD).
(B) Change in firing rate for each recorded neuron in the SD condition (n = 22 neurons from 4 animals) and control condition (n = 36 neurons from 5 animals). Left, effect of SD on ER2 (change in firing rate between time points 1 and 2). Middle, effect of SD on ER3 (change in firing rate between time points 2 and 3). Right, effect of last light period (change in firing rate between time points 3 and 4, when no SD occurred). Yellow dashed lines indicate no change. **p = 0.0079, two-sample t test; # p = 0.0449, ## p = 0.0084, #### p < 10−5; one-sample t test versus mean of 0.
(C) Average change in firing rate for each neuron across periods of sleep and wake for the control group, and periods of prolonged wake and recovery sleep for the SD group. Only data for the two 12-h SD periods (and corresponding times in the control dataset) were used. Data for both periods were pooled. The yellow dashed line indicates no change. *p = 0.0374, ***p = 0.0001, ****p < 10−4; one-way ANOVA (p < 10−4) with Tukey-Kramer post hoc; # p = 0.0247, #### p < 10−6; linear model comparing all group means to a mean of 0.
We hypothesized that this paradigm would reduce downward FRH during the 12-h periods of SD and that FRH would resume when animals were allowed to sleep naturally again. To quantify any such effect, we first measured the change in firing rate between the 12-h dark periods on either side of a 12-h SD session (Figure 6A). We compared the change in firing rate for SD animals (n = 22 neurons from 4 animals) to the change in firing rate over the same period for reopened hemisphere data in the non-sleep-deprived (non-SD) animals (same dataset as Figure 1, labeled control in Figure 6). Overall, there was a consistently larger decrease in firing rate in non-SD animals. Particularly during the light phase of ER3, firing rates decreased significantly in the non-SD group but remained unchanged in the SD group (Figure 6B, middle panel). We also examined the last light period in the experiment (light phase of ER4) (Figure 6, no SD), during which no SD occurred, and found that firing rates in the SD animals significantly decrease over this period (Figure 6B, right panel). In both the non-SD and the SD cases, the decreases in firing rate were driven by periods of sleep (Figure 6C).
These data establish a direct link between the amount of sleep and the degree of downward FRH, supporting the hypothesis that sleep is necessary for the recovery of activity following ER.
Both NREM and REM Sleep Contribute to Homeostatic Recovery
An important question that our data and analyses so far do not address is the impact of different sleep states on FRH. Both REM and NREM sleep have been proposed to play key roles in driving plasticity (Diekelmann and Born, 2010; Abel et al., 2013; Tononi and Cirelli, 2014). To determine whether either state plays a principal role in driving FRH, we analyzed all NREM-REM-NREM episodes (sleep triplets) (Figure 7A) that occurred during the two days of homeostatic recovery and then estimated the effect of the intervening REM episode by comparing for each triplet the mean firing rate at the end of the first NREM episode to the mean firing rate at the beginning of the second NREM episode. We averaged firing rates over 5 min and took care to avoid transition effects by excluding 1 min of data at every transition. This analysis confirmed that REM sleep has no basal effect on firing rate in control neurons, whereas a significant decrease in firing rate was evident for neurons in the reopened hemisphere (Figures 7B and 7C). To quantify the effect of NREM, we next performed the same analysis but for REM-NREM-REM triplets; because of the short duration of REM episodes, we computed mean firing rates in 90-s bins at the end and start of the first and second REM episodes, excluding 30 s at the transition (Figure 7D). Again, we saw no effect in control neurons and a decrease in firing rate in reopened neurons (Figures 7E and 7F). These findings show that FRH occurs during both NREM and REM sleep states, suggesting that the feature or features of brain states that enable downward FRH are likely common to both REM and NREM sleep.
Figure 7. Downward FRH Occurs during Both NREM and REM Sleep.
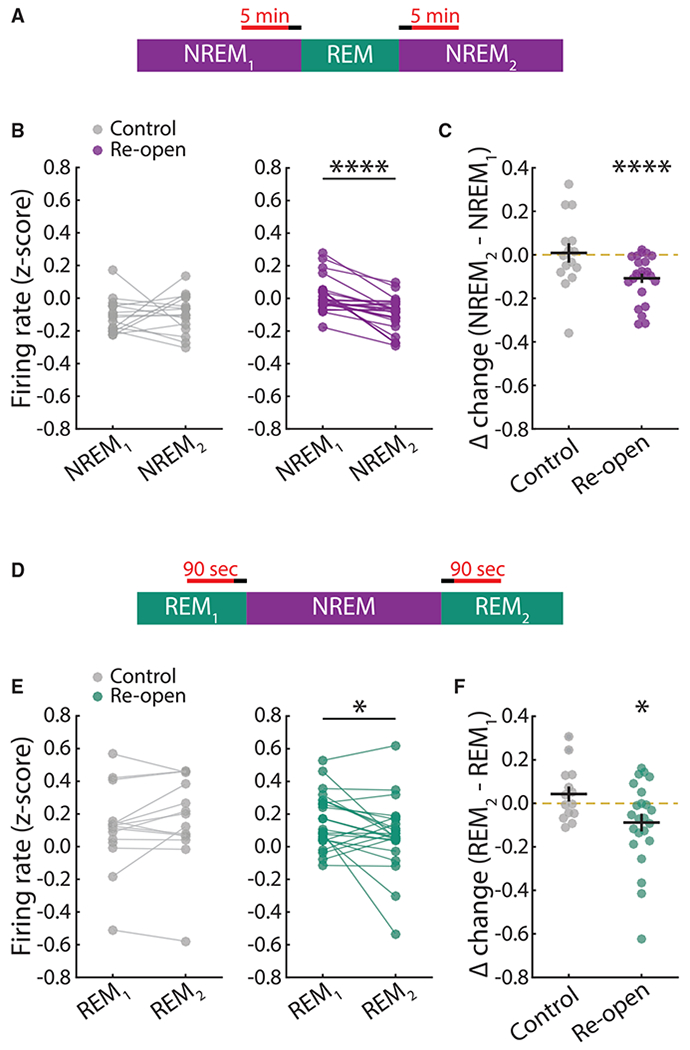
(A) Schematic for the analysis of NREM1-REM-NREM2 triplets.
(B) Firing rate values are Z scored within each triplet and then averaged across all triplets for a given neuron. Each dot represents a neuron, and mean firing rate values for the same neuron are linked by horizontal lines. ****p < 0.0001; Wilcoxon sign-rank test.
(C) Difference in mean firing rate values between the first 5 min of NREM2 and the last 5 min of NREM1. Black lines indicate mean ± SEM. The yellow dashed line indicates no change. ****p < 0.0001; one-sample t test versus mean of 0.
(D) As in (A), but for REM1-NREM-REM2 triplets.
(E) As in (B), but for REM1-NREM-REM2 triplets. *p = 0.05; Wilcoxon sign-rank test.
(F) As in (C), but for REM1-NREM-REM2 triplets. *p = 0.0383; one-sample t test versus mean of 0.
Non-homeostatic Firing Rate Changes Happen Independently of Animals’ Behavioral State
MD initially depresses firing rates over the first 2 days of MD, via LTD at thalamocortical synapses and additional changes at intracortical synapses (Heynen et al., 2003; Maffei et al., 2006; Miska et al., 2018). This allowed us to test whether sleep and wake states also gate this non-homeostatic form of plasticity. During early MD, neuronal firing rates are stable for a variable period before starting to decline. Using an automated algorithm to detect the start of the drop for each neuron, we found that it happened quickly (over 6–12 h) in individual neurons (Figures 8A and 8B) but that the timing was variable: all our recorded regular spiking neurons could be classified as early-drop neurons, in which most of the drop occurred during the first 12-h light period after MD (Figures 8A and 8C), or late-drop neurons, in which most of the drop occurred during the second 12-h light period after MD (Figures 8B and 8D). When we analyzed the relationship between sleep/wake behavior and the drop in neuronal firing rates during the first or second 12-h light periods (for early-drop and late-drop neurons, respectively) we found that neither group had a bias toward wake or sleep. The magnitude of the decrease in firing rate was similar across both behavioral states (Figure 8E), and it was not correlated with the amount of time spent asleep (Figure 8F). Thus, we conclude that sleep specifically enables a reduction in firing rate driven by homeostatic plasticity.
Figure 8. Non-homeostatic Firing Rate Changes Happen Independently of Animals’ Behavioral State.
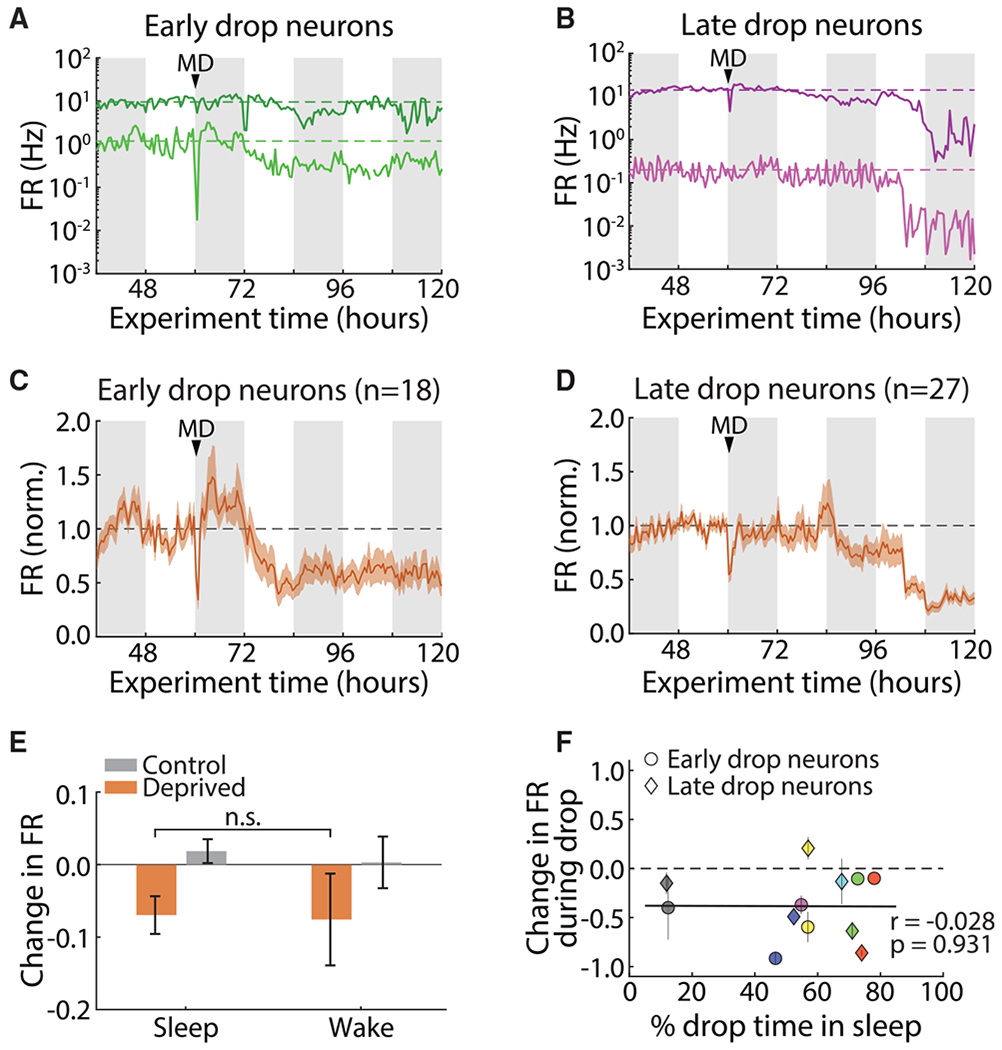
(A) Two example neurons whose activity begins decreasing in the first light period after MD (early drop). Dashed lines indicate the baseline firing rate for each neuron. White/gray bars in the background indicate 12 h of light/dark.
(B) As in (A), but for two neurons whose drop-in firing rate begins during the second light period after MD (late drop).
(C) Average baseline-normalized firing rate of all early-drop neurons. The dashed line indicates the baseline firing rate.
(D) As in (C), but for late-drop neurons.
(E) Change in firing rate across sleep- or wake-dense epochs for all neurons in their respective 12-h drop period. Control S, n = 38 epochs; control W, n = 12 epochs; deprived S, n = 38 epochs; deprived W, n = 26 epochs.
(F) Correlation between change in firing rate during drop and percentage of time spent asleep in the same period. Each data point represents the average change in firing rate across early-drop (circles) or late-drop (diamonds) neurons, and each color represents a different animal (n = 6 animals). Percentage of time asleep is calculated per animal in the early-drop or late-drop 12-h period. The black dashed line represents no change. The black solid line shows the linear fit to the data.
DISCUSSION
It has been theorized that bidirectional stabilization of firing rates around a set point is a critical feature that allows developmental or experience-dependent synaptic changes to refine network architecture without fatally destabilizing activity (Abbott and Nelson, 2000; Marder and Prinz, 2002; Tetzlaff et al., 2011; Turrigiano, 2012; Litwin-Kumarand Doiron, 2014). Although upward FRH is known to occur in vivo, whether this process is indeed bidirectional and whether upward and downward homeostasis share mechanistic features have been open questions. Here we used MD followed by ER to potentiate firing in V1 and then analyzed the behavior of individual neurons over time in freely behaving animals. MD-ER produced a ~2-fold potentiation of firing that was NMDAR dependent and accompanied by nonuniform changes in synaptic strengths. This was followed by downward FRH, which slowly returned individual firing rates close to their initial values independently of NMDAR signaling, and was accompanied by a scaling down of synaptic strengths. This is consistent with homeostatic synaptic scaling, although we cannot rule out the involvement of additional non-NMDAR-dependent mechanisms. We found that downward FRH is promoted by sleep, the opposite of upward FRH (Hengen et al., 2016). This does not reflect a general role for sleep in all forms of synaptic depression, because the early phase of MD (driven by LTD-like mechanisms) unfolded independently of sleep and wake states. Our data show that the role of sleep/wake states in promoting circuit plasticity is nuanced and that the induction of upward and downward FRH is segregated by behavioral state.
Although sensory deprivation is a venerable paradigm for inducing neocortical plasticity (Espinosa and Stryker, 2012; Gainey and Feldman, 2017), there has been a dearth of approaches for increasing, rather than decreasing, neocortical firing to study downward homeostasis. Prolonged dark exposure has been proposed to induce homeostatic plasticity within V1 (Goel and Lee, 2007), but more recent work has shown that changes in mEPSC amplitude during dark exposure unfold via metaplastic rules that are distinct from those that induce synaptic scaling (Bridi et al., 2018; Chokshi et al., 2019). Dark exposure does not affect firing rates in V1 over the first day or so (Torrado Pacheco et al., 2019) and thus would not be expected to induce synaptic scaling, and light reexposure after 60 h in the dark only elevates firing for ~20 min, not long enough to trigger slow forms of homeostatic plasticity (Torrado Pacheco et al., 2019). In contrast, MD followed by ER induces a robust and long-lasting increase in firing in V1 that develops over several hours and is blocked by NMDAR antagonists, suggesting (consistent with previous work by Toyoizumi et al., 2014) that it is a consequence of Hebbian synaptic plasticity induced by the restoration of correlated visual drive through the previously closed eye.
The process of downward FRH revealed here bears several similarities to upward FRH (Hengen et al., 2016). They both unfold slowly over ~2 days, are accompanied by synaptic scaling of excitatory synapses in the correct direction to contribute to restoration of firing, and bring individual neuronal firing rates back to an individual set point. It was thus surprising to find that they have a diametrically opposite dependence upon behavioral state: upward FRH occurs during active waking, whereas downward FRH occurs during sleep. These findings show that upward and downward homeostatic compensation do not operate simultaneously within neuronal circuits and add complexity to the idea that the function of sleep is to provide a window of opportunity for homeostatic plasticity (Wang et al., 2011).
SHY proposes that wakefulness drives learning-related increases in synaptic strengths and firing rates, whereas sleep renormalizes activity by downregulating synaptic strengths, a process dependent on activity patterns during NREM sleep (Tononi and Cirelli, 2014). A combination of structural, electrophysiological, and molecular evidence has been put forward in support of SHY (de Vivo et al., 2017; Vyazovskiy et al., 2008, 2009; Liu et al., 2010; Diering et al., 2017), but contradictory data have also been reported (Yang et al., 2014; Chauvette et al., 2012; Aton et al., 2014; Durkin and Aton, 2016), and in some cases the interpretation of these findings has been questioned (Frank, 2012; Frank and Cantera, 2014; Timofeev and Chauvette, 2017; Puentes-Mestril and Aton, 2017). In particular, it has been unclear whether sleep and wake cause global oscillations in firing rates under baseline conditions, when animals have not experienced a dramatic plasticity or learning event. Such oscillations have been observed in the hippocampus and frontal cortex but were not uniform across the neuronal population (Miyawaki and Diba, 2016; Watson et al., 2016; Miyawaki et al., 2019). In the absence of plasticity induction, we observe stable firing during relatively long, consolidated sleep/wake states in V1, both here and previously (Hengen et al., 2016), indicating that in V1, sleep and wake do not by themselves drive global changes in excitability. Furthermore, we find that downward firing rate changes driven by Hebbian plasticity during early MD unfold independently of sleep and wake states. Thus, it is not the case that all decreases in synaptic strength and firing preferentially occur during sleep.
NREM and REM sleep have been proposed to serve distinct roles in the regulation of neuronal firing and plasticity, so it is interesting that downward FRH occurs during both sleep states (Figure 7). REM sleep has been implicated in firing rate decreases in hippocampus and cortex (Grosmark et al., 2012; Niethard et al., 2016), in pruning and maintenance of dendritic spines (Li et al., 2017), and more broadly in memory consolidation (Boyce et al., 2017). SHY instead proposes that slow wave activity during NREM sleep is the specific driver of homeostatic decreases in synaptic strength (Tononi and Cirelli, 2014), whereas other studies highlight a role for NREM sleep in synaptic potentiation following learning (Yang et al., 2014; Aton et al., 2014; Durkin and Aton, 2016). In this context, the similar effects of REM and NREM on downward FRH could be explained in two ways. First, the plasticity mechanism or mechanisms driving downward FRH in V1 may be equally enabled during both brain states, which would put interesting constraints on the mechanisms of the gating process. The second possibility is that distinct plasticity mechanisms expressed in REM and NREM cooperate to restore activity to baseline levels. This might be advantageous if these mechanisms act on different parameters of neuronal plasticity, such as structural and functional synaptic changes. More precise manipulations of behavioral state, such as deprivation restricted to REM sleep, would help shed light on this question.
Our results paint a nuanced and complex picture of the impact of sleep and wake on neuronal plasticity. The effect of sleep on firing rate changes is not uniform but instead depends on the particular forms of synaptic plasticity activated, which may help explain the diversity of outcomes in experiments designed to test the role of sleep in the induction of plasticity (Raven et al., 2018; Frank and Seibt, 2018). Although our data argue against a constitutive role of sleep in reducing circuit excitability (Figure 5) (see Hengen et al., 2016), we find that when it is induced through manipulations of experience, downward FRH (and presumably the underlying downscaling of synapses) occurs preferentially during sleep. This finding is consistent with data showing that SD interferes with molecular signaling cascades that are important for scaling down (Diering et al., 2017). The most parsimonious explanation for our data is that rather than constitutively inducing downscaling, sleep is permissive for the expression of downward homeostatic plasticity when it is induced by perturbations to the circuit.
A surprising finding of this study is that upward and downward FRH are gated by distinct sleep/wake states. What is the mechanism by which this is achieved, and what is the purpose of this segregation? One promising lead may be the starkly contrasting neuromodulatory environments that neocortical neurons are exposed to during sleep and wake (Lee and Dan, 2012). Neuromodulators may regulate plasticity mechanisms by modulating neuronal activity (Goard and Dan, 2009; Herrero et al., 2008) or by directly acting on signaling pathways involved in plasticity induction, such as the Homer1-mGluR complex (Diering et al., 2017). The molecular pathways that regulate synaptic scaling up and down are mostly divergent but show some overlap (Turrigiano, 2017; Styr et al., 2019). One possible reason forthe temporal segregation of upward and downward homeostasis could be to reduce interference or saturation of the molecular pathways that mediate homeostatic plasticity. A complementary possibility is that behavioral state gating ensures strong unidirectional homeostatic compensation for defined periods; this may have benefits in terms of computation and learning by providing strong compensation when it is needed most and perhaps by allowing unopposed Hebbian changes during limited windows of time.
STAR★METHODS
RESOURCE AVAILABILITY
Lead Contact
All further information and requests for resources should be directed to the Lead Contact, Gina G. Turrigiano (turrigiano@brandeis.edu).
Materials Availability
This study did not generate new unique reagents.
Data and Code Availability
The code used for this study is available in the public repository at the following URL: https://github.com/alejandrotorrado/ATP2020_paper. Data are available upon request from the Lead Contact.
EXPERIMENTAL MODEL AND SUBJECT DETAILS
All animal care as well as surgical and experimental procedures were approved by the Animal Care and Use Committee (IACUC) of Brandeis University and complied with the guidelines of the National Institutes of Health. All experiments were performed on Long-Evans rats of both sexes (Charles River Laboratories, Wilmington, MA, USA; strain code: 006) aged P21-P36. No differences were noted between sexes so the data were combined. Rats underwent electrode implant surgeries at P21. Recordings were started at P24-26, MD was performed at P27-28, and recordings lasted until P35-36. This period corresponds to the critical period for visual plasticity. We chose to use animals of this age to increase our chances of inducing strong plasticity with our visual manipulations, resulting in firing rate changes large enough to observe homeostatic recovery, should it happen. Timed pregnant female Long-Evans rats were obtained and housed on a 12h/12h light/dark cycle with free access to food and water. For each in vivo electrophysiology experiment, 2 subjects from the same litter were weaned at post-natal day 21 (P21) for electrode implant surgeries and then housed together in a satellite facility. For slice physiology, rats were weaned at P21, housed in the main animal facility along with littermates, and returned there after every surgical procedure.
Number of neurons and animals for each experiment are as follows:
Main MD/Eye Re-opening experiment n = 36 neurons, 5 animals (reopened hemisphere; 3 males, 2 females); n = 31 neurons, 6 animals (control hemisphere; 3 males, 3 females). Relevant to Figures 1,4, 5, 6, and 7.
CPP experiments: n = 15 neurons, 3 animals (one CPP injection on ER1; 3 males); n = 22 neurons, 3 animals (two CPP injections, on ER2 and ER3; 2 males, 1 female). Relevant to Figure 2.
Slice physiology: control ER2, n = 27 neurons, 11 animals (4 males, 7 females); re-open ER2, n = 25 neurons, 11 animals (4 males, 7 females); control ER4, n = 17 neurons, 7 animals (4 males, 3 females); re-open ER4, n = 22 neurons, 4 animals (4 males, 3 females). Relevant to Figure 3.
MD/ER and sleep deprivation experiments: n = 22 neurons from 4 animals (3 males, 1 female). Relevant to Figure 6.
Analysis of sleep/wake effects on the drop in firing during early MD: n = 45 neurons, 7 animals (3 males, 4 females). Relevant to Figure 8.
METHOD DETAILS
Surgical procedures
Electrode implants
Rats were implanted with electrode arrays as described previously (Hengen et al., 2013). Briefly, custom 16-channel tungsten wire (33 μm tip diameter, Tucker-Davis Technologies, TDT, Alachua, FL, USA) arrays were implanted bilaterally in V1m. Anesthesia was induced with an intraperitoneal injection of ketamine/xylazine/acepromazine (KXA) cocktail (70 mg/kg ketamine; 3.5 mg/kg xylazine; 0.7 mg/kg acepromazine) and maintained with isoflurane (1.0% - 2.0% concentration in air) delivered via an anesthesia system with integrated digital vaporizer (Somnosuite, Kent Scientific, Torrington, CT, USA) through a stereotaxic head holder (Model 923-B with Model 1924-C-11.5 mask, Kopf Instruments, Tujunga, CA, USA). The skull was exposed, cleaned with hydrogen peroxide, and any bleeding spots were lightly cauterized. Three small holes were drilled in the bone, one above the cerebellum and two above motor/somatosensory cortex, and miniature machine screws (Antrin Inc., Fallbrook, CA, USA) were inserted in each. A craniotomy was drilled above V1m on the left hemisphere and the dura mater was pulled back using a 25G needle. The electrode array was then slowly lowered into the brain and the exposed craniotomy was covered with a silicone elastomer (Kwik-Cast, World Precision Instruments, Sarasota, FL, USA). The array was secured using dental cement, then grounded to both front screws using steel wire and soldering paste. The same procedure was repeated for the right hemisphere, and both arrays were secured to the screws and bone surface using dental cement. Total headcap weight was approximately 2g. Finally, two braided steel wires were implanted deep in the nuchal muscle for EMG recordings.
Monocular deprivation
For MD, rats were briefly (~20 s) administered 4% isoflurane, then transferred to a heating pad and placed in a nose cone that delivered 1.0 - 3.0% isoflurane in air. Ophthalmic ointment was applied to the eye not being sutured to prevent desiccation. The other eyelid was cleaned 3 times with betadine followed by flushing with sterile saline. Lidocaine cream was applied to the eyelid. The bottom and top part of the eyelid were then sutured together using 6-0 nylon or polyester sutures (4 mattress sutures). The sutured eye was covered in antibiotic ointment and lidocaine, and analgesic (meloxicam, 1 mg/kg) was administered subcutaneously. The lidocaine, antibiotic and analgesic were given again 24 hours after surgery. Sutures were checked daily and animals were excluded if sutures were not intact at the time of ER.
Eye re-opening
Rats were anesthetized as for MD. Ophthalmic ointment was applied to the non-sutured eye. The sutured eye was cleaned with betadine and saline thrice. Sutures were then carefully cut with fine-tipped surgical scissors, and removed using small forceps. The re-opened eye was flushed with saline until it was free of any extraneous tissue and looked clean. Ophthalmic antibiotic ointment was applied, and the animal returned to the cage. Occasionally (3 animals), the eye was found to have developed infection or a cataract during the lid suture period. These animals were excluded from the study.
Continuous single-unit recordings in freely behaving animals
Following electrode implant surgery rats were allowed to recover for 2 days in separate cages with ad lib access to food and water. During this time animals were handled twice daily by experimenters or assistants, placed in the same cage for 10 minutes twice daily to allow for social interaction, and given treats (Froot Loops). The evening before the recording started animals were transferred to a clear plexiglass cage of dimensions 18”x12”x18” (length, depth, height) and separated into two arenas by a clear plastic divider with 1” holes to allow for tactile and olfactory interaction between siblings while preventing aggressive play and jostling of headcaps. Animals were kept on a 12h/12h light/dark cycle in a temperature- and humidity-controlled room (lights on 7:30am, 21°C, 30%–55% humidity). The arrays were connected to TDT commutators via ZIF-clip headstages to allow animals to behave freely. Data were recorded continuously for 9–12 days (up to ~250 hours). Animals were only disconnected for MD and ER procedures (~20 min each animal). Data were acquired at 25 kHz, digitized and streamed to disk online using a TDT Neurophysiology Workstation and Data Streamer. Spike extraction, clustering and sorting were done using custom MATLAB and Python code (see below).
Automated spike extraction, clustering and sorting
Spike extraction, clustering and sorting were done as previously described (Hengen et al., 2016; Torrado Pacheco et al., 2019). Spikes were detected in the raw signal as threshold crossings (−4 standard deviations from mean signal) and re-sampled at 3x the original rate. Principal component analysis (PCA) was done on all spikes from each channel, and the first four principal components were used for clustering using KlustaKwik software (Harris et al., 2000). Due to memory constraints, clustering was done on a subset of 5 million spikes if the number of spikes on a given channel exceeded 5 million. A random forest classifier implemented in python was used to classify clusters according to a model built on a dataset of 1200 clusters manually scored by expert observers. A set of 19 features, including ISI contamination (% of ISIs < 3 msec), similarity to regular spiking unit (RSU) and fast-spiking unit (FS) waveform templates, amount of 60 Hz noise contamination and kinetics of the mean waveform. Cluster quality was also ensured by thresholding of L-ratio and isolation distance (Schmitzer-Torbert et al., 2005). Clusters were classified as noise, multi-unit or single-unit. Only single-unit clusters with a clear refractory period were used for firing rate analysis. We classified units as RSU or FS based on established criteria (mean waveform trough-to-peak and tail slope, Hengen et al., 2016; see also Figure S1B). Only RSUs (putative excitatory neurons) were used for analysis.
Some neurons were lost during the recording, presumably due to electrode drift or gliosis. To establish “on” and “off” times for neurons, we used ISI contamination: when hourly % of ISIs < 3 msec was above 4%, unit was considered to be offline. Based on these “on” and “off” times, only units that were online for 80% of the experiment were used for analysis. Additionally, we used a stringent post hoc bootstrap analysis (Figures S1C–S1E) of daily average waveforms to discriminate between units that were followed continuously for 5 days versus multi-unit signal. Daily mean waveforms (WFs) for 5 days (MD4 to ER4) were computed for all putative single-units; then for each unit we randomly picked 3 of its WFs and mixed them with two other WFs from a randomly selected cell in the dataset. Based on these 5 WFs, calculated the daily mean-squared error (MSE) between them, and found the maximum MSE for shuffled units. This process was repeated 1000 times per cell, to obtain a distribution of random unit maximum MSEs. We chose maximum as opposed to summed or average MSE to increase stringency: this method results in a high MSE for a WF that is stable for 4 days but changes in the last day, for example. To obtain an MSE threshold, we chose the lower bound of the 95% confidence interval for the mean of the distribution of random unit maximum MSEs. Putative units with maximum MSE across days greater than this value were excluded from analysis. The resulting real units had very similar WFs across days and low maximum MSE (Figures S1C and S1D).
Transcardial perfusions
Animals were deeply anesthetized with a double dose of KXA (see above for full dose). The heart was exposed and a 21G needle inserted in the left ventricle. After cutting a small hole in the right atrium, 0.9% saline was perfused through the circulatory system using a peristaltic pump for 5-7 minutes. The perfusion was switched to 3.7% paraformaldehyde (PFA) for another 5-7 minutes. The brain was extracted taking care not to damage the electrode insertion site, and preserved in a solution of 3.7% PFA and 30% sucrose for at least 7 days for cryo-protection.
Histology
Fixed brains were blocked using a razor blade and mounted on a freezing microtome platform kept cold by dry ice. Brains were embedded in O.C.T. compound (Tissue-Tek, Sakura, Japan) and 60 μm thick sections were taken and placed in phosphate-buffered saline (PBS) overnight. Slices were then stained with cresyl violet to dye the Nissl substance in neurons. Stained sections were mounted and coverslipped, then imaged at 4x or 10x on a digital microscope (Keyence, Belgium) to confirm the location of each electrode wire.
CPP injections
All CPP injections were done on animals that were undergoing chronic electrophysiological recordings. Animals were not unplugged for this procedure, unless eye re-opening surgery was also performed. After weighing, animals were administered a 15 mg/kg dose of (RS)-CPP (Tocris, Bio-Techne corp., Minneapolis, MN, USA) dissolved in bacteriostatic 0.9% saline subcutaneously. The CPP solutions were prepared on the day of injection, and re-used the next day when applicable (storing overnight at 4°C).
CPP has been shown to impact sleep architecture, though to a lesser extent than other NMDAR antagonists (Campbell et al., 2002). We asked whether we could detect an effect of CPP on the behavioral state of injected animals. For animals injected twice (on ER2 and ER3) we found no effect of CPP on total time spent in sleep, or in the total duration of sleep episodes (Figures S8A and S8B). We also computed the duration of and time spent in NREM and REM states, in 12-hour periods corresponding to the light/dark phases. We grouped data from the two light periods without CPP injections (MD4 and ER1) and with CPP injections (ER2 and ER3), and compared CPP injected animals with un-injected animals from our main dataset. We found a small increase in the time spent in NREM in the light for both datasets (Figure S8C), indicating this is not an effect specific to CPP. We also found a slight increase in the duration of NREM episodes in CPP injected animals (Figures S8D–S8F).
Sleep deprivation
Sleep deprivation experiments were carried out on rats bilaterally implanted with electrode arrays in V1m (n = 4). The experiments were identical to the main recordings, with rats undergoing monocular deprivation followed by eye re-opening 5 days later. To probe the role of sleep, we deprived rats of sleep during two 12-hour periods, both corresponding to the 12-hour light phase, on the second and third day after eye re-opening (ER2 and ER3; in other words, during hours 24-36 and 48-60 after ER; Figure 6A). The animals’ behavioral state was monitored continuously via live video and EMG signal. Animals were allowed to cycle naturally between wake and sleep, but every wake episode was extended so as to last at least one hour (“Prolonged Wake”). We achieve this via introduction of novel objects into the cage (toys) as well as gentle stimulation with a paintbrush or gloved hand, usually after novel object introduction stopped being effective toward the end of the hour. Following a prolonged wake episode, animals were allowed to sleep freely (“Recovery Sleep”). When they next woke up, another session of sleep deprivation began. Periods of wake lasting less than 2 minutes were ignored, i.e., animals had to be naturally awake for at least 2 minutes to trigger the start of a new prolonged wake episode. Sleep and wake states were classified post hoc as described below to determine the impact of this procedure on the duration of sleep and wake.
Slice electrophysiology
Solutions
Standard ACSF (in mM): 126 NaCl, 25 NaHCO3, 3 KCl, 2 CaCl2, 2 MgSO4, 1 NaH2PO4, 0.5 Na-Ascorbate, with dextrose added to bring osmolarity to 310-315 mOsm, and titrated with HCl to bring pH to 7.35.
TTX-ACSF: standard ACSF with added tetrodotoxin (TTX), 0.2 μM.
Choline solution (in mM): 110 Choline-Cl, 25 NaHCO3, 11.6 Na-Ascorbate, 7 MgCl2, 3.1 Na-Pyruvate, 2.5 KCl, 1.25 NaH2PO4, and 0.5 CaCl2, with dextrose added to bring osmolarity to 315 mOsm, and titrated with HCl to bring pH to 7.35.
K-gluconate internal solution (in mM): 100 K-gluconate, 10 KCl, 10 HEPES, 5.37 Biocytin, 10 Na-Phosphocreatine, 4 Mg-ATP, and 0.3 Na-GTP, with sucrose added to bring osmolarity to 295 mOsm and KOH added to bring pH to 7.35.
Acute brain slice preparation
Coronal brain slices (300 μm) containing V1 from both hemispheres were prepared using a procedure similar to one used in previous studies (Miska et al., 2018). Animals were placed in a sealed container with 4% isoflurane in air and deeply anesthetized. They were then quickly decapitated and the front part of the brain (excluding the cerebellum and part of the brainstem) was extracted within 60 s and placed in cold (~1 °C) carbogenated (95% O2, 5% CO2) TTX-ACSF for 4 min. Once the brain was cold and firm, it was cut coronally through frontal cortex to obtain a flat mounting surface, and mounted to a slicing chamber using cyanoacrylate adhesive. Slices were immediately cut on a vibratome (Leica VT1000S, Diegem, Belgium) in cold carbogenated TTX-ACSF. Immediately after cutting, each slice was transferred to an incubation chamber placed in warm (34°C) continuously carbogenated choline solution for protective recovery. After 10 min, slices were transferred to warm (34°C) continuously carbogenated TTX-ACSF for 40 min. They were then removed from the incubator, placed in room temperature TTX-ACSF and allowed to return to room temperature before recording. TTX-ACSF was used throughout to prevent additional plasticity due to activity in the slice after cutting. Slices were used for recordings for up to 6 post-slicing.
mEPSC recordings
Borosilicate glass pipettes were pulled on a Sutter P-97 Micropipette puller. Pipettes were used if they had tip resistances ranging from 4-6 MΩ, and filled with K-gluconate internal solution. V1m was identified in acute slices using the rat brain atlas (Paxinos and Watson, 1998) based on morphology of the hippocampus and white matter, and a high-contrast band corresponding to layer 4 (L4). Pyramidal L2/3 neurons were identified by their position (dorsal to L4), teardrop-shaped soma and presence of an apical dendrite. This was confirmed by post hoc reconstruction of biocytin fills. On any given recording day cells were patched from both re-opened and control hemispheres. All recordings were performed in submerged slices continuously perfused with carbogenated ACSF at 32°C. Cells were visualized on an upright microscope (Olympus BX51WI) using a 10x air (NA 1.13) or 40x water-immersion (NA 0.8) objective and an infrared CCD camera. Cells were patched using pipettes filled as above and with a chlorided silver electrode. Data were low-pass filtered at 5 kHz acquired at 10 kHz using a National Instruments Data Acquisition Board (DAQ, National Instruments, Woburn, MA, USA) and custom MATLAB software. All post hoc analyses were done using in-house software written in MATLAB. For mEPSC recordings, TTX-ACSF with added AP-5 (50 μM) and picrotoxin (25 μM) was used to block action potentials and NMDA and GABA currents, and isolate AMPA currents. Neurons were held in voltage clamp at −70 mV while at least 20 traces (10 s duration) were recorded at 10x gain. Neurons were excluded from analysis if series resistance was above 25 MΩ, if resting membrane potential (Vm) was above −60 mV, or if Vm changed by more than 10% during trace acquisition. For event detection, 3 traces with stable baseline were selected. In order to both reliably detect mEPSC events above noise and to limit bias in selection, we used an in-house program written in MATLAB that employs a semi-automated template-based detection method contained in a GUI. In brief, the program first filters the raw current traces and then applies a canonical mEPSC event shaped template to detect regions of best fit. Multiple tunable parameters for template threshold and event kinetics that aid in detection were optimized and then chosen to stay constant for all analyses. Putative events are then analyzed for hallmark features of mEPSC (risetime kinetics, decay time, minimum amplitude cutoffs, etc.). Finally, the results of the automated detection are reviewed with minor manual revisions made (< 5%) for the inclusion/exclusion of events. We performed all of this analysis (including the manual revisions) blind to experimental conditions. Neurons were excluded from analysis post hoc if they were determined to be non-pyramidal based upon biocytin reconstruction.
Semi-automated behavioral state scoring
Local field potentials (LFPs) were extracted from the raw in vivo electrophysiology traces by low-pass filtering data from 3 channels at 300 Hz, resampling at 200 Hz, and averaging. We computed power spectral densities using MATLAB’s fast-fourier transform (FFT) implementation in 10 s bins and frequency bins from 0.3 to 15 Hz (0.1 Hz steps). Power in the delta (0.3 – 4 Hz) and theta (5 – 8 Hz) bands was calculated in each 10 s bin as a fraction of total power. EMG signals from the two wires were averaged and resampled at 200 Hz. Animal movement was tracked in recorded videos (recoded using an infrared camera) using open-source software written in C++ (Video BlobTracking, Open Source Instruments, Watertown, MA, USA; Github: https://github.com/OSI-INC/VBT) and modified in-house to suit our needs (adding video cropping, tracking in both light and dark conditions). For sleep classification, we built a custom graphical user interface (GUI) in MATLAB. Data was presented to an observer in 1-hour blocks and scored in 10 s bins. Scoring of the first 10 blocks was manual, based on previously published criteria (Hengen et al., 2016; Torrado Pacheco et al., 2019), and included 4 states: NREM sleep (high delta power, low theta power; low EMG and movement); REM sleep (low delta power; high theta power; lowest EMG and movement); quiet wake (low delta and theta; low EMG and movement); active wake (low delta and theta; higher EMG and movement). After block 10, a random forest classifier model (Python Scikit-Learn implementation) was built based on scoring of blocks 1–10. The features used in the model were power in the delta, theta and gamma (40 – 100 Hz) bands, theta-delta power ratio, z-scored EMG and movement signal. The model was used to classify new data (blocks 11 and above), and the result was displayed in the GUI. Trained human scorers were then able to check LFP power, EMG and movement traces, as well as view video recordings, to correct the classification. The model was updated with each new scored block until the training set reached 10,000 bins (limit set for efficiency and speed). Thereafter, the training set was continuously updated to contain the most recently coded 10,000 bins. The GUI also allowed experimenters to exclude a block for training (in case of corrupted data, or animal unplugging for surgery). This algorithm reached an OOB error of < 10% and real error (i.e., % of bins that had to be corrected) of 1%–4% in sleep-heavy blocks, and 5%–15% in wake-heavy blocks, the main difficulty being distinguishing quiet versus active wake.
Firing rate analyses
Estimation of neuronal firing rates and change in firing rate
To obtain firing rates estimates for individual RSUs from spike timestamps we computed spike counts in 60 s bins and applied a Gaussian kernel with σ = 300 s (Figures 1, 2, 4, and 6), or we computed the spike rate in non-overlapping 1 s bins (Figure 5). To calculate mean firing rates in 12-hour periods we took the average firing rate across all bins in that period (Figures 1 and 2). firing rates were normalized to baseline by dividing all firing rate bins by the mean firing rate in the chosen 12-hour baseline period (Figures 1, 2, and 6). To calculate firing rate z-scores over an episode of extended sleep or wake (Figure 5) we computed the mean and SD of the non-normalized firing rate over that episode and applied the formula zFR = (FR − μ)/σ, where μ and σ are the mean and SD and firing rate is the non-normalized firing rate. To estimate the change between first and last epochs of a state in extended sleep or wake (Figure 5) we subtracted the mean z-scored firing rate of the first epoch from the last one. To estimate the changes in firing rate in sleep- and wake-dense windows we used the formula (B − A)/(A + B). For the result in Figure 4, we defined A and B as the mean firing rate in the first and last 15 minutes of the S- or W-dense window. For the MD-induced drop (Figure 8E) we defined A and B as the mean firing rate in the first and last 40% of the window. To estimate the total change in firing rate across the drop we used the same approach, but with A being the mean baseline firing rate and B being the mean firing rate in last 20% of the drop period (Figure 8F).
Estimating start of MD-induced drop
To estimate the start of the drop for each neuron in an unbiased way, we designed the following algorithm. A 2-hour window was stepped through the data in 15-minute increments and the neuron’s firing rate in that window was fit with a linear function to calculate the slope. Negative and positive slopes at least one s.d. from the mean slope were selected, and a kernel density estimate (KDE) was calculated separately for the positive and negative ones. The drop start time was identified as the first time that the difference between the negative and positive KDE went above 70%. This start time was then used to classify neurons as “early drop” or “late drop” depending on whether it fell within the first or second light period after MD.
Bootstrap analysis of firing rate recovery
For the results in Figure S2, we used two separate bootstrap methods to analyze the firing rate recovery. We set out to ask whether the change in firing rate observed for the re-opened hemisphere data on ER4 (Figure 1F, right) is consistent with cell-autonomous recovery of activity, or if it could arise from a non-cell-autonomous process. To do this we modeled what the result of the analysis in Figure 1F would look like in the non-cell-autonomous case. Our starting distributions were the data in Figure 1G. We hypothesize that to achieve an average % change close to 0, as we observed in our data (Figure 1F), each cell must return close to its baseline firing rate value; in other words, neurons in the distribution at ER4 are largely in the same order as they were in the MD4 distribution. To simulate non-cell-autonomous homeostasis we kept the real MD4 distribution as our starting point and used either a “shuffle” or a “sample” strategy to create simulated ER4 distributions. The “sample” bootstrap strategy (Figure S2A, middle) consists in sampling at random from the empirical distribution of firing rates at late ER, and randomly matching to baseline values. Note that this results in a mean population firing rate different than that of real data. The “shuffle” bootstrap strategy (Figure S2A, right) does not resample the late ER distribution, but simply shuffles the matching between baseline and late ER data points. This preserves the real mean population firing rate, but not the % change of individual neurons. Both the shuffling and sampling analyses were done 10,000 times to obtain 10,000 bootstrap means and corresponding confidence intervals (Figure S2B). The results in Figure S2C show that the value obtained in our experiments is outside the 99% confidence interval for both analyses. We also aimed to determine the range of variation of firing rate in the real data. In other words, how precisely do neurons return to their baseline firing rate? To do this we calculated the fraction of neurons returning to within X% of their baseline firing rate, where X was varied from 10% to 100%, in both our real data and for both bootstrap methods. We used the bootstrap distributions to obtain 99% CIs for the fraction of neurons at each % threshold value. We find that more than 50% of real neurons return to within 50% of their baseline firing rate, and the real value diverges from the bootstrap results at the 40% threshold (Figure S2D).
Sleep analyses
Sleep- and wake-dense windows
For the results in Figure 4, we scanned hours 192–240 of the experiment (ER2-ER4) in 15 min steps for 2.5 h periods of time where animals had been awake or asleep for at least 70% of the time. When a dense window was found the algorithm restarted scanning at the end of that window (i.e., windows were not double-counted). The firing rate change was calculated for each unit as (B − A)/(B + A), where A and B represent the mean firing rate in the first and last 15 min of the window. We repeated this analysis with different parameters to confirm that our results were not spurious: similar results were obtained when changing the size of the window and the density % threshold (Figure S6).
Extended sleep and wake analyses
For the results in Figure 5, we scanned hours 192-240 of the experiment for periods of extended wake or sleep, defined as at least 30 min of wake or sleep without interruptions greater than 1 min. Only states that were 30 s or longer were considered for this analysis. The firing rate for each cell was z-scored to the mean and s.d. of the firing rate for the whole extended sleep or wake episode.
Sleep triplets analyses
For the results in Figure 7, we scanned hours 192-240 (during downward FRH) of the experiment to detect cycling between sleep states matching either the NREM-REM-NREM pattern (NRN triplets), or the REM-NREM-REM pattern (RNR triplets). Behavioral states shorter than 50 s were not included for analysis. To analyze the change in firing rate across triplets we computed, for each neuron, the mean firing rate in the last “packet” of state 1 and the mean firing rate in the first “packet” of state 3. Packets were defined to be 5-minutes long for NRN triplets and 90 s long for RNR triplets. To avoid effects due to firing rates undergoing dramatic changes at the transition between sleep states, we excluded 1 minute of data adjacent to the transition for NRN triplets, and 30 s for RNR triplets. We also only considered triplets in which the REM episodes were at least 3 minutes long.
QUANTIFICATION AND STATISTICAL ANALYSIS
All data analysis was done using custom code written in MATLAB. Values are reported in the text body as mean ± SEM. For statistical analyses n’s, p values and the kind of test used are provided in the figure caption. Normality was assessed using an Anderson-Darling test (MATLAB implementation), with α = 0.05. To compare means across groups for normally distributed data we used one-way ANOVA followed by Tukey-Kramer post hoc for pairwise comparisons, or 2-sample t tests to compare two groups only. For non-normally distributed data we used a Kruskal-Wallis test followed by Tukey-Kramer post hoc for pairwise comparisons. For non-normal paired data we used Wilcoxon sign-rank tests followed by Bonferroni corrections for multiple comparisons. To compare cumulative distributions we used a two-sample Kolmogorov-Smirnov (K-S) test or a two-sample Kuiper test with Bonferroni corrections for multiple comparisons. Correlations strength and significance were estimated using Pearson’s r. To compare multiple groups to a fixed mean (usually 0) we either used one-sample t tests, or fit the data using a linear model with no intercept and with group membership coded as a dummy variable, then used a one-way ANOVA to estimate significance.
Supplementary Material
KEY RESOURCES TABLE
| REAGENT or RESOURCE | SOURCE | IDENTIFIER |
|---|---|---|
| Chemicals, Peptides, and Recombinant Proteins | ||
| (RS)-CPP | Tocris | Cat#0173 |
| Tetrodotoxin | Abcam | Cat# ab120055 |
| AP5 | Tocris | Cat#0105 |
| Picrotoxin | Tocris | Cat#1128 |
| Experimental Models: Organisms/Strains | ||
| Rat: Crl:LE Long-Evans Rat | Charles River Laboratory | RRID:RGD_2308852 |
| Software and Algorithms | ||
| KlustaKwik | Harris et al., 2000 | https://klusta.readthedocs.io/en/latest/ |
| Video Blob Tracking | Open Source Instruments | https://github.com/OSI-INC/VBT |
| MATLAB | Mathworks | https://www.mathworks.com/products/matlab.html |
Highlights.
The firing rates of V1 neurons are homeostatically regulated in the downward direction
This process does not require NMDA receptors and is mediated by synaptic scaling down
Downward firing rate homeostasis is restricted to periods of sleep
Downward firing rate homeostasis is enabled during both REM and NREM sleep
ACKNOWLEDGMENTS
Funding sources were R01-EY025623 and R35-NS111562 (to G.G.T.). Computational resources were provided by NSF XSEDE computing resources (MCB090163) and the Brandeis high-performance computing cluster (HPCC), which is partially supported by DMR-1420382.
Footnotes
SUPPLEMENTAL INFORMATION
Supplemental Information can be found online at https://doi.org/10.1016/j.neuron.2020.11.001.
DECLARATION OF INTERESTS
G.G.T. is a member of the Neuron advisory board. The authors declare no competing interests.
REFERENCES
- Abbott LF, and Nelson SB (2000). Synaptic plasticity: taming the beast. Nat. Neurosci 3 (Suppl), 1178–1183. [DOI] [PubMed] [Google Scholar]
- Abel T, Havekes R, Saletin JM, and Walker MP (2013). Sleep, plasticity and memory from molecules to whole-brain networks. Curr. Biol 23, R774–R788. [DOI] [PMC free article] [PubMed] [Google Scholar]
- Aton SJ, Suresh A, Broussard C, and Frank MG (2014). Sleep promotes cortical response potentiation following visual experience. Sleep (Basel) 37, 1163–1170. [DOI] [PMC free article] [PubMed] [Google Scholar]
- Barnes SJ, Sammons RP, Jacobsen RI, Mackie J, Keller GB, and Keck T (2015). Subnetwork-Specific Homeostatic Plasticity in Mouse Visual Cortex In Vivo. Neuron 86, 1290–1303. [DOI] [PMC free article] [PubMed] [Google Scholar]
- Blackman MP, Djukic B, Nelson SB, and Turrigiano GG (2012).Acritical and cell-autonomous role for MeCP2 in synaptic scaling up. J. Neurosci 32, 13529–13536. [DOI] [PMC free article] [PubMed] [Google Scholar]
- Boyce R, Williams S, and Adamantidis A (2017). REM sleep and memory. Curr. Opin. Neurobiol 44, 167–177. [DOI] [PubMed] [Google Scholar]
- Bridi MCD, de Pasquale R, Lantz CL, Gu Y, Borrell A, Choi S-Y, He K,Tran T, Hong SZ, Dykman A, et al. (2018). Two distinct mechanisms for experience-dependent homeostasis. Nat. Neurosci 21, 843–850. [DOI] [PMC free article] [PubMed] [Google Scholar]
- Campbell IG, Gustafson LM, and Feinberg I (2002). The competitive NMDA receptor antagonist CPPene stimulates NREM sleep and eating in rats. Neuropsychopharmacology 26, 348–357. [DOI] [PubMed] [Google Scholar]
- Caporale N, and Dan Y (2008). Spike timing-dependent plasticity: a Hebbian learning rule. Annu. Rev. Neurosci 31, 25–46. [DOI] [PubMed] [Google Scholar]
- Chauvette S, Seigneur J, and Timofeev I (2012). Sleep oscillations in the thalamocortical system induce long-term neuronal plasticity. Neuron 75, 1105–1113. [DOI] [PMC free article] [PubMed] [Google Scholar]
- Chokshi V, Gao M, Grier BD, Owens A, Wang H, Worley PF, and Lee G-K (2019). Input-Specific Metaplasticity in the Visual Cortex Requires Homer1a-Mediated mGluR5 Signaling. Neuron 104, 736–748.e6. [DOI] [PMC free article] [PubMed] [Google Scholar]
- de Vivo L, Bellesi M, Marshall W, Bushong EA, Ellisman MH, Tononi G, and Cirelli C (2017). Ultrastructural evidence for synaptic scaling across the wake/sleep cycle. Science 355, 507–510. [DOI] [PMC free article] [PubMed] [Google Scholar]
- Diekelmann S, and Born J (2010). The memory function of sleep. Nat. Rev. Neurosci 11, 114–126. [DOI] [PubMed] [Google Scholar]
- Diering GH, Nirujogi RS, Roth RH, Worley PF, Pandey A, and Huganir RL (2017). Homer1a drives homeostatic scaling-down of excitatory synapses during sleep. Science 355, 511–515. [DOI] [PMC free article] [PubMed] [Google Scholar]
- Durkin J, and Aton SJ (2016). Sleep-Dependent Potentiation in the Visual System Is at Odds with the Synaptic Homeostasis Hypothesis. Sleep (Basel) 39, 155–159. [DOI] [PMC free article] [PubMed] [Google Scholar]
- Espinosa JS, and Stryker MP (2012). Development and plasticity of the primary visual cortex. Neuron 75, 230–249. [DOI] [PMC free article] [PubMed] [Google Scholar]
- Frank MG (2012). Erasing synapses in sleep: is it time to be SHY? Neural Plast. 2012, 264378. [DOI] [PMC free article] [PubMed] [Google Scholar]
- Frank MG, and Cantera R (2014). Sleep, clocks, and synaptic plasticity. Trends Neurosci. 37, 491–501. [DOI] [PMC free article] [PubMed] [Google Scholar]
- Frank MG, and Seibt J (2018). Sleep and plasticity: Waking from a fevered dream. Sleep Med. Rev 39, 1–2. [DOI] [PubMed] [Google Scholar]
- Gainey MA, and Feldman DE (2017). Multiple shared mechanisms for homeostatic plasticity in rodent somatosensory and visual cortex. Philos. Trans. R. Soc. Lond. B Biol. Sci 372, 20160157. [DOI] [PMC free article] [PubMed] [Google Scholar]
- Goard M, and Dan Y (2009). Basal forebrain activation enhances cortical coding of natural scenes. Nat. Neurosci 12, 1444–1449. [DOI] [PMC free article] [PubMed] [Google Scholar]
- Goel A, and Lee H-K (2007). Persistence of experience-induced homeostatic synaptic plasticity through adulthood in superficial layers of mouse visual cortex. J. Neurosci 27, 6692–6700. [DOI] [PMC free article] [PubMed] [Google Scholar]
- Grosmark AD, Mizuseki K, Pastalkova E, Diba K, and Buzsáki G (2012). REM sleep reorganizes hippocampal excitability. Neuron 75, 1001–1007. [DOI] [PMC free article] [PubMed] [Google Scholar]
- Hanes AL, Koesters AG, Fong MF, Altimimi HF, Stellwagen D, Wenner P, and Engisch KL (2020). Divergent Synaptic Scaling of Miniature EPSCs following Activity Blockade in Dissociated Neuronal Cultures. J. Neurosci 40, 4090–4102. [DOI] [PMC free article] [PubMed] [Google Scholar]
- Harris KD, Henze DA, Csicsvari J, Hirase H, and Buzsáki G (2000). Accuracy of tetrode spike separation as determined by simultaneous intracellular and extracellular measurements. J. Neurophysiol 84, 401–414. [DOI] [PubMed] [Google Scholar]
- Hengen KB, Lambo ME, Van Hooser SD, Katz DB, and Turrigiano GG (2013). Firing rate homeostasis in visual cortex of freely behaving rodents. Neuron 80,335–342. [DOI] [PMC free article] [PubMed] [Google Scholar]
- Hengen KB, Torrado Pacheco A, McGregor JN, Van Hooser SD, and Turrigiano GG (2016). Neuronal Firing Rate Homeostasis Is Inhibited by Sleep and Promoted by Wake. Cell 165, 180–191. [DOI] [PMC free article] [PubMed] [Google Scholar]
- Herrero JL, Roberts MJ, Delicato LS, Gieselmann MA, Dayan P, and Thiele A (2008). Acetylcholine contributes through muscarinic receptors to attentional modulation in V1. Nature 454, 1110–1114. [DOI] [PMC free article] [PubMed] [Google Scholar]
- Heynen AJ, Yoon B-J, Liu C-H, Chung HJ, Huganir RL, and Bear MF (2003). Molecular mechanism for loss of visual cortical responsiveness following brief monocular deprivation. Nat. Neurosci 6, 854–862. [DOI] [PubMed] [Google Scholar]
- Kaneko M, Stellwagen D, Malenka RC, and Stryker MP (2008). Tumor necrosis factor-α mediates one component of competitive, experience-dependent plasticity in developing visual cortex. Neuron 58, 673–680. [DOI] [PMC free article] [PubMed] [Google Scholar]
- Keck T, Keller GB, Jacobsen RI, Eysel UT, Bonhoeffer T, and Hubener M (2013). Synaptic scaling and homeostatic plasticity in the mousevisual cortex in v/Vo. Neuron 80, 327–334. [DOI] [PubMed] [Google Scholar]
- Kim J,Tsien RW, and Alger BE (2012). An improved test for detecting multiplicative homeostatic synaptic scaling. PLoS ONE 7, e37364. [DOI] [PMC free article] [PubMed] [Google Scholar]
- Lee S-H, and Dan Y (2012). Neuromodulation of brain states. Neuron 76, 209–222. [DOI] [PMC free article] [PubMed] [Google Scholar]
- Li W, Ma L, Yang G, and Gan W-B (2017). REM sleep selectively prunes and maintains new synapses in development and learning. Nat. Neurosci 20, 427–437. [DOI] [PMC free article] [PubMed] [Google Scholar]
- Lisman J (2017). Glutamatergic synapses are structurally and biochemically complex because of multiple plasticity processes: long-term potentiation, long-term depression, short-term potentiation and scaling. Philos. Trans. R. Soc. Lond. B Biol. Sci 372, 20160260. [DOI] [PMC free article] [PubMed] [Google Scholar]
- Litwin-Kumar A, and Doiron B (2014). Formation and maintenance of neuronal assemblies through synaptic plasticity. Nat. Commun 5, 5319. [DOI] [PubMed] [Google Scholar]
- Liu Z-W, Faraguna U, Cirelli C, Tononi G, and Gao X-B (2010). Direct evidence for wake-related increases and sleep-related decreases in synaptic strength in rodent cortex. J. Neurosci 30, 8671–8675. [DOI] [PMC free article] [PubMed] [Google Scholar]
- Lüscher C, and Malenka RC (2012). NMDA receptor-dependent long-term potentiation and long-term depression (LTP/LTD). Cold Spring Harb. Perspect. Biol 4, a005710. [DOI] [PMC free article] [PubMed] [Google Scholar]
- Maffei A, Nataraj K, Nelson SB, and Turrigiano GG (2006). Potentiation of cortical inhibition by visual deprivation. Nature 443, 81–84. [DOI] [PubMed] [Google Scholar]
- Malenka RC, and Bear MF (2004). LTP and LTD: an embarrassment of riches. Neuron 44, 5–21. [DOI] [PubMed] [Google Scholar]
- Marder E, and Prinz AA (2002). Modeling stability in neuron and network function: the role of activity in homeostasis. BioEssays 24, 1145–1154. [DOI] [PubMed] [Google Scholar]
- Miller KD, and MacKay DJC (1994). The Role of Constraints in Hebbian Learning. Neural Comput 6, 100–126. [Google Scholar]
- Miska NJ, Richter LM, Cary BA, Gjorgjieva J, and Turrigiano GG (2018). Sensory experience inversely regulates feedforward and feedback excitation-inhibition ratio in rodent visual cortex. eLife 7, e38846. [DOI] [PMC free article] [PubMed] [Google Scholar]
- Miyawaki H, and Diba K (2016). Regulation of Hippocampal Firing by Network Oscillations during Sleep. Curr. Biol 26, 893–902. [DOI] [PMC free article] [PubMed] [Google Scholar]
- Miyawaki H, Watson BO, and Diba K (2019). Neuronal firing rates diverge during REM and homogenize during non-REM. Sci. Rep 9, 689. [DOI] [PMC free article] [PubMed] [Google Scholar]
- Niell CM, and Stryker MP (2008). Highly selective receptive fields in mouse visual cortex. J. Neurosci 28, 7520–7536. [DOI] [PMC free article] [PubMed] [Google Scholar]
- Niethard N, Hasegawa M, Itokazu T, Oyanedel CN, Born J, and Sato TR (2016). Sleep-Stage-Specific Regulation of Cortical Excitation and Inhibition. Curr. Biol 26, 2739–2749. [DOI] [PubMed] [Google Scholar]
- Paxinos G, and Watson C (1998). The Rat Brain in Stereotaxic Coordinates,, Fourth Edition (Academic Press; ). [Google Scholar]
- Puentes-Mestril C, and Aton SJ (2017). Linking Network Activity to Synaptic Plasticity during Sleep: Hypotheses and Recent Data. Front. Neural Circuits 11, 61. [DOI] [PMC free article] [PubMed] [Google Scholar]
- Raven F, Van der Zee EA, Meerlo P, and Havekes R (2018). The role of sleep in regulating structural plasticity and synaptic strength: Implications for memory and cognitive function. Sleep Med. Rev 39, 3–11. [DOI] [PubMed] [Google Scholar]
- Sato M, and Stryker MP (2008). Distinctive features of adult ocular dominance plasticity. J. Neurosci 28, 10278–10286. [DOI] [PMC free article] [PubMed] [Google Scholar]
- Schmitzer-Torbert N, Jackson J, Henze D, Harris K, and Redish AD (2005). Quantitative measures of cluster quality for use in extracellular recordings. Neuroscience 131, 1–11. [DOI] [PubMed] [Google Scholar]
- Styr B, Gonen N, Zarhin D, Ruggiero A, Atsmon R, Gazit N, Braun G, Frere S, Vertkin I, Shapira I, et al. (2019). Mitochondrial Regulation of the Hippocampal Firing Rate Set Point and Seizure Susceptibility. Neuron 102, 1009–1024.e8. [DOI] [PMC free article] [PubMed] [Google Scholar]
- Tetzlaff C, Kolodziejski C, Timme M, and Worgotter F (2011). Synaptic scaling in combination with many generic plasticity mechanisms stabilizes circuit connectivity. Front. Comput. Neurosci 5, 47. [DOI] [PMC free article] [PubMed] [Google Scholar]
- Timofeev I, and Chauvette S (2017). Sleep slow oscillation and plasticity. Curr. Opin. Neurobiol 44, 116–126. [DOI] [PubMed] [Google Scholar]
- Tononi G, and Cirelli C (2003). Sleep and synaptic homeostasis: a hypothesis. Brain Res. Bull 62, 143–150. [DOI] [PubMed] [Google Scholar]
- Tononi G, and Cirelli C (2014). Sleep and the price of plasticity: from synaptic and cellular homeostasis to memory consolidation and integration. Neuron 81, 12–34. [DOI] [PMC free article] [PubMed] [Google Scholar]
- Torrado Pacheco A, Tilden EI, Grutzner SM, Lane BJ, Wu Y, Hengen KB, Gjorgjieva J, and Turrigiano GG (2019). Rapid and active stabilization of visual cortical firing rates across light-dark transitions. Proc. Natl. Acad. Sci. USA 116, 18068–18077. [DOI] [PMC free article] [PubMed] [Google Scholar]
- Toyoizumi T, Kaneko M, Stryker MP, and Miller KD (2014). Modeling the dynamic interaction of Hebbian and homeostatic plasticity. Neuron 84, 497–510. [DOI] [PMC free article] [PubMed] [Google Scholar]
- Turrigiano GG (2008). The self-tuning neuron: synaptic scaling of excitatory synapses. Cell 135, 422–435. [DOI] [PMC free article] [PubMed] [Google Scholar]
- Turrigiano G (2012). Homeostatic synaptic plasticity: local and global mechanisms for stabilizing neuronal function. Cold Spring Harb. Perspect. Biol 4, a005736. [DOI] [PMC free article] [PubMed] [Google Scholar]
- Turrigiano GG (2017). The dialectic of Hebb and homeostasis. Philos. Trans. R. Soc. Lond. B Biol. Sci 372, 20160258. [DOI] [PMC free article] [PubMed] [Google Scholar]
- Turrigiano GG, and Nelson SB (2004). Homeostatic plasticity in the developing nervous system. Nat. Rev. Neurosci 5, 97–107. [DOI] [PubMed] [Google Scholar]
- Turrigiano GG, Leslie KR, Desai NS, Rutherford LC, and Nelson SB (1998). Activity-dependent scaling of quantal amplitude in neocortical neurons. Nature 391, 892–896. [DOI] [PubMed] [Google Scholar]
- Villarreal DM, Do V, Haddad E, and Derrick BE (2002). NMDA receptor antagonists sustain LTP and spatial memory: active processes mediate LTP decay. Nat. Neurosci 5, 48–52. [DOI] [PubMed] [Google Scholar]
- Vyazovskiy VV, Cirelli C, Pfister-Genskow M, Faraguna U, and Tononi G (2008). Molecular and electrophysiological evidence for net synaptic potentiation in wake and depression in sleep. Nat. Neurosci 11, 200–208. [DOI] [PubMed] [Google Scholar]
- Vyazovskiy VV, Olcese U, Lazimy YM, Faraguna U, Esser SK, Williams JC, Cirelli C, and Tononi G (2009). Cortical firing and sleep homeostasis. Neuron 63, 865–878. [DOI] [PMC free article] [PubMed] [Google Scholar]
- Wang G, Grone B, Colas D, Appelbaum L, and Mourrain P (2011). Synaptic plasticity in sleep: learning, homeostasis and disease. Trends Neurosci. 34, 452–463. [DOI] [PMC free article] [PubMed] [Google Scholar]
- Watson BO, Levenstein D, Greene JP, Gelinas JN, and Buzsaki G (2016). Network Homeostasis and State Dynamics of Neocortical Sleep. Neuron 90, 839–852. [DOI] [PMC free article] [PubMed] [Google Scholar]
- Yang G, Lai CSW, Cichon J, Ma L, Li W, and Gan W-B (2014). Sleep promotes branch-specific formation of dendritic spines after learning. Science 344,1173–1178. [DOI] [PMC free article] [PubMed] [Google Scholar]
Associated Data
This section collects any data citations, data availability statements, or supplementary materials included in this article.
Supplementary Materials
Data Availability Statement
The code used for this study is available in the public repository at the following URL: https://github.com/alejandrotorrado/ATP2020_paper. Data are available upon request from the Lead Contact.