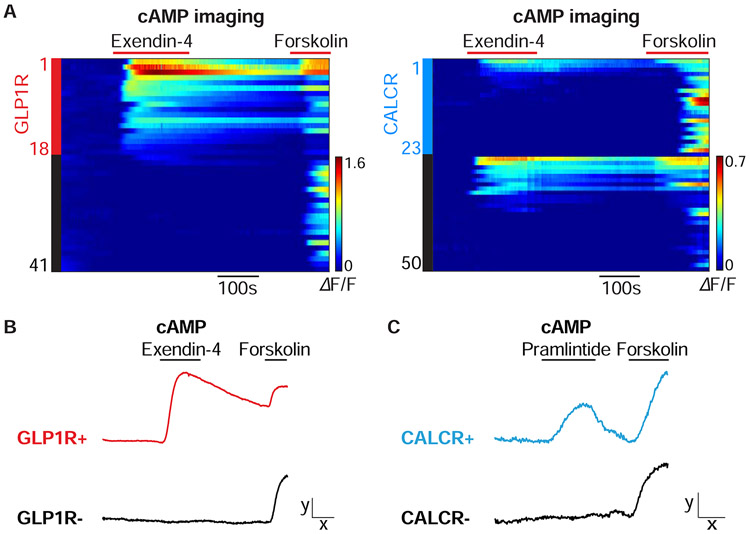
Figure 2. Imaging responses of area postrema neurons.
(A) Area postrema neurons of Glp1r-ires-Cre; Rosa26-LSL-tdTomato (left) or Calcr-ires-Cre; Rosa26-LSL-tdTomato (right) mice were acutely dissociated and transfected with the cAMP sensor cADDis. Rows indicate responses (ΔF/F, color scale) of individual neurons over time, with exendin-4 (100 nM) and forskolin (25 μm) applied at times indicated (red bars). Y-axis colored bars (left: red; right: blue) and black bars indicated tdTomato-positive and tdTomato-negative neurons respectively. (B, C) Area postrema neurons were harvested from Glp1r-ires-Cre; Rosa26-LSL-tdTomato (B) or Calcr-ires-Cre; Rosa26-LSL-tdTomato mice (C) for transfection-based cAMP imaging. Representative responses of GLP1R-positive (red), CALCR-positive (blue), and reporter-negative (black) neurons are shown to exendin-4 (100 nM), pramlintide (100 nM), and forskolin (25 μM) x: 100 seconds, y: 0.5 ΔF/F.

