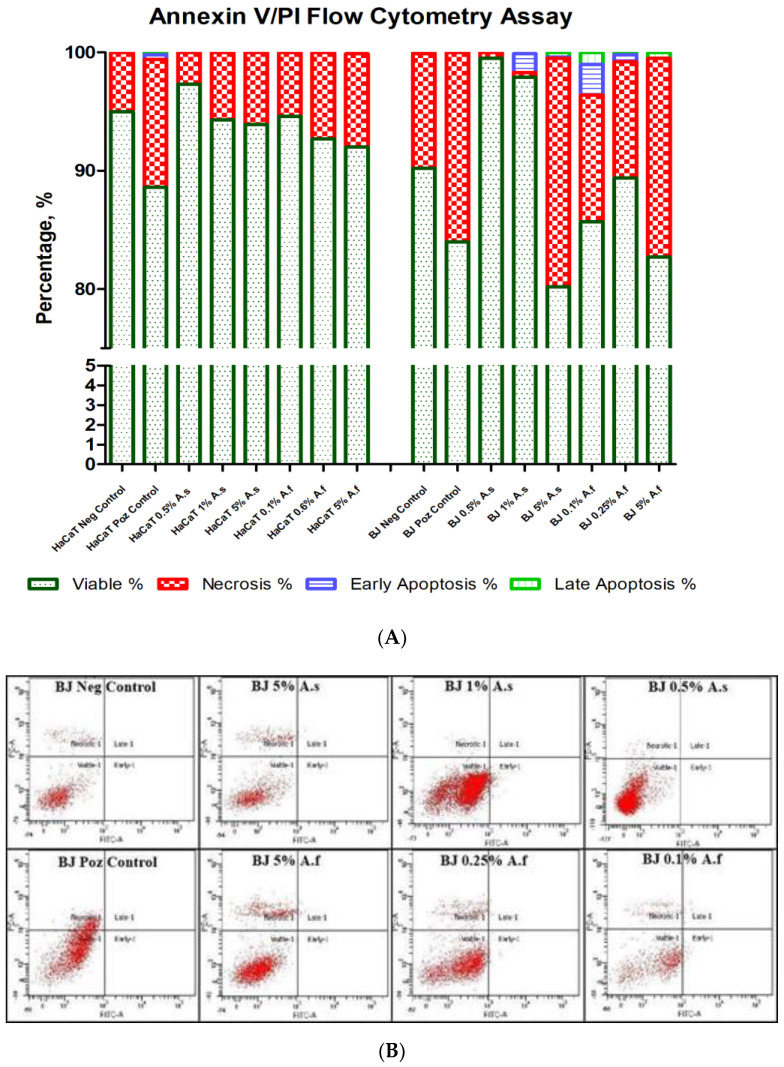
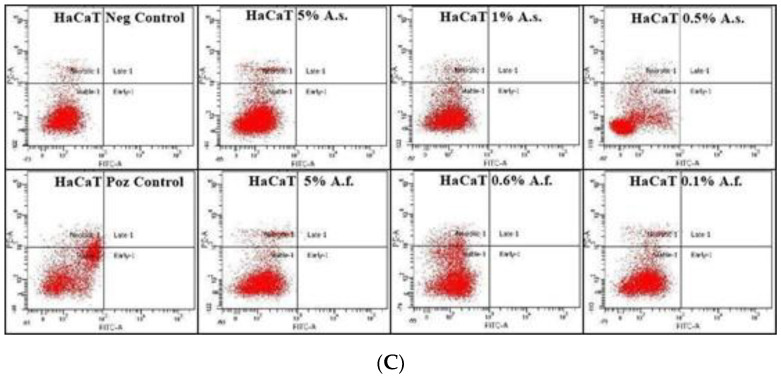
Figure 8.
Annexin V/PI Flow Cytometry Assay for BJ and HaCaT cell lines treated with different concentrations of Allium sativum and A. fistulosum extracts. Annexin V and PI were added to each sample. Negative controls were not treated with extracts and positive controls were supplemented with DMSO at a final volume of 10% in growth media. All extract concentrations were selected to be similar to other concentrations that were used for other determinations. Both cell lines were incubated for 24 h with certain Allium extracts. (A)—graph representing population percentages; (B)—BJ scatter plot; (C)—HaCaT scatter plot. A.s—Allium sativum; A.f.—Allium fistulosum; Neg Control—negative control; Poz Control—positive control.


