Abstract.
Data on liver and spleen stiffness by 2-D shear wave elastography (2-D SWE) in hepatosplenic schistosomiasis (HES) remain scarce. We aimed to assess the correlation between single to multiple measurements of liver and spleen stiffness and to evaluate inter-hepatic lobe variability of liver stiffness measurement (LSM) using 2-D SWE in HES patients. Liver and spleen elastography were performed in HES patients in this cross-sectional study. A total of four stiffness measurements were performed in the right lobe (RL), left lobe (LL), and spleen. The correlation between the first measurement and the median of four measurements was assessed. Liver stiffness measurement of both hepatic lobes was compared. Twenty-six HES patients were included. Liver stiffness measurement was higher in the left than in the right hepatic lobe (17.9 kPa [11.3–92.0] versus 14.9 kPa [5.6–44.4]; P = 0.019). The first measurement was similar to the median of the four measurements for the RL (14.6 [5.6–60.8] versus 14.9 kPa [5.6–44.4]; P = 0.87), LL (17.4 [8.0–128.1] versus 17.9 kPa [11.3–92.0]; P = 0.54), and spleen (50.5 [10.0–157.0] versus 55.7 kPa [19.1–119.4]; P = 0.48). An excellent correlation between the first measurement and the median of four measurements for the RL (r = 0.93; P < 0.001), LL (r = 0.88; P < 0.001), and spleen (r = 0.89; P < 0.001) was observed. In HES, LSM of the LL seems to be higher than that of the right hepatic lobe. Considering the excellent correlation between the first measurement and the median of four measurements in both hepatic lobes and spleen, a single measurement would be sufficient to evaluate liver and splenic stiffness in patients with HES.
INTRODUCTION
Schistosomiasis is a neglected tropical disease prevalent in low- to middle-income countries. The WHO estimates that more than 206 million individuals required preventive treatment worldwide in 2016.1 The intestinal form of schistosomiasis caused by the species Schistosoma mansoni remains endemic in rural or geographically dispersed regions in Brazil.2 Up to 10% of infected individuals might develop the severe form of the disease known as hepatosplenic schistosomiasis (HES), which is characterized by portal hypertension and hepatic periportal fibrosis.3
Historically, liver biopsy has been considered the reference for staging hepatic fibrosis. However, this invasive method has been challenged by low acceptance by patients, potential complications, and low quality of the specimen.4,5 Liver stiffness measurement (LSM) by transient elastography (TE) has been validated as an alternative to stage liver fibrosis in chronic liver diseases.6 In addition, LSM and spleen stiffness measurement (SSM) by TE have been used to detect portal hypertension in patients with chronic liver diseases.7 Moreover, in patients with HES, abdominal ultrasound (US)8 and TE9 seem accurate to stage liver fibrosis. Two-dimensional shear wave elastography (2-D SWE) by Aixplorer® (Supersonic Imagine, Aix-en-Provence, France) is a novel, noninvasive method to assess LSM and SSM using a conventional US machine. This technique allows the choice of the region of interest (ROI) in B-mode by the operator to avoid vascular structures and nodules.10 In the last years, the diagnostic value of 2-D SWE has been extensively validated for liver fibrosis staging10 and detection of portal hypertension.7 However, standard recommendations for reliability and validity criteria for LSM by 2-D SWE are still unclear.11 In addition, this imaging method was not evaluated in patients with HES. The aim of the study was to evaluate the feasibility of liver fibrosis staging using 2-D SWE by a single measurement compared with multiple measurements and to assess the inter-hepatic lobe variability of LSM in patients with HES.
MATERIALS AND METHODS
This cross-sectional study included consecutive patients with HES followed in a single center in Rio de Janeiro, Brazil. Data of individuals with portal hypertension, who had US signs of periportal fibrosis and positive epidemiology for S. mansoni, were collected by a trained investigator in a spreadsheet for analysis. Patients with alcohol intake higher than 20 g/day, previous surgery for portal hypertension, splenectomy, portal vein thrombosis, hepatocellular carcinoma, or other chronic liver disease were excluded. Blood analysis for liver function tests and liver/spleen elastography were performed on a maximal interval of 30 days. This study was approved by the Ethical Committee from the Federal University of Rio de Janeiro (IRB number 214/09). All participants signed informed consent on enrollment in the study.
Definition of HES.
Schistosomiasis was defined by the presence of periportal fibrosis in subjects with an epidemiological history of exposure to contaminated waters in endemic regions (Northeast macro-region or Minas Gerais state) associated with at least one of the following criteria: 1) positive parasitological identification in stool samples (Kato–Katz [KK]); 2) identification of amplified Schistosoma DNA by PCR in stool samples; 3) positive rectal biopsy, or 4) positive serology defined by the detection of specific IgG1 and/or type E immunoglobulin (IgE) anti–S. mansoni. Two slides/samples were collected and examined for the presence of S. mansoni eggs using the KK technique. In addition, specific IgG1 and IgE or DNA detection was applied in the absence of egg excretion (KK negative). Patients with positive rectal biopsy were not submitted to serology or PCR in stool samples. Specific IgG1 and IgE anti-adult worm membrane-soluble antigen were measured using an ELISA as described by Gonçalves et al.12 Real-time PCR was performed as described by Gentile et al.13 For the detection of S. mansoni DNA, the technique described by Cavalcanti et al.14 was performed. The hepatosplenic form of the schistosomiasis was defined by the presence of portal hypertension characterized by gastrooesophageal varices in upper gastrointestinal endoscopy or splenomegaly (spleen diameter > 12 cm) in US.
Liver and spleen stiffness using 2D SWE.
Liver and spleen stiffness measurements were performed after 3-hour fasting patients by a single experienced operator blinded to clinical and laboratorial data using 2-D SWE by Aixplorer® (SuperSonic Imagine). In brief, patients were placed in dorsal decubitus with the right arm in maximal abduction. The probe was placed perpendicularly in an intercostal space where liver biopsy would be performed for right lobe (RL) evaluation and immediately below the xiphoid process for left lobe (LL) LSM. For SSM, the probe was placed in the left side intercostal space in a dorsal decubitus patient with the left arm in maximal abduction.
For LSM, all 2-D SWE measurements were performed using a 35 × 25-mm Q-box with its upper edge placed at least 2 cm far from the liver capsule and avoiding large vascular structures. Measurements were obtained in a 20-mm diameter ROI placed in the most homogeneous area of the Q-box during an expiratory phase. Each measurement provided the mean liver stiffness, as well as minimum, maximal, and its SD values. Measurements were classified as unreliable when no or little signal was obtained in the SWE box, or mean LSM values were lower than 1 kPa.15
Statistical analysis.
Categorical variables were expressed as absolute (n) and relative frequencies (%), and continuous variables as mean (SD) or median (range). Paired nonparametric tests were used for comparison of measurements, and correlations between variables were reported using Spearman’s rho coefficient. A P-value less than 0.05 was considered to be significant using bilateral tests. Statistical analysis was carried out using the SPSS software, version 21.0 (SPSS inc., Chicago, IL).
RESULTS
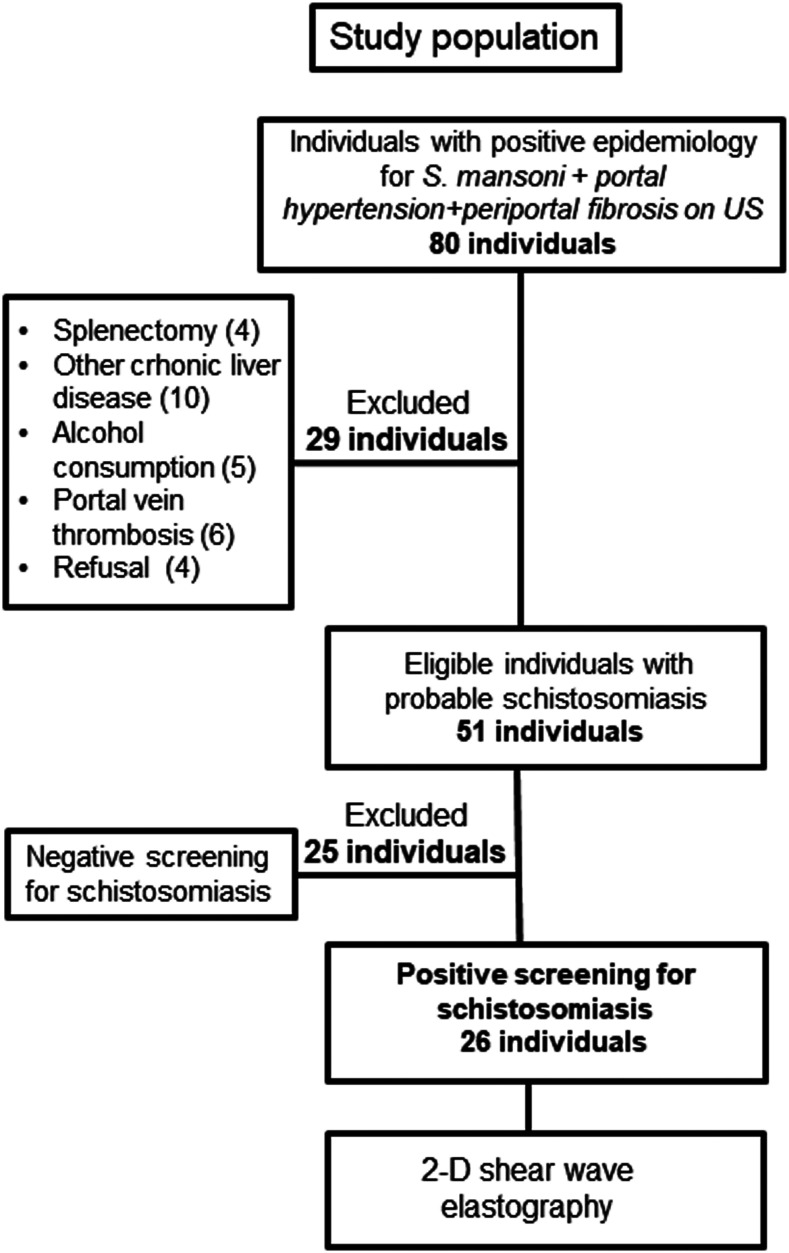
A total of 80 patients with portal hypertension, US signs of periportal fibrosis, and positive epidemiological history for S. mansoni evaluated from October 2016 to June 2017 were eligible. However, 29 patients were excluded (other chronic liver diseases [n = 10], portal vein thrombosis [n = 6], abusive alcohol intake [n = 5], splenectomy [n = 4], and refusal to participate [n = 4]), and 25 patients had a negative screening for schistosomiasis (Figure 1). Therefore, a convenience sample (non-probabilistic) size of 26 patients was included. Serology for schistosomiasis was positive in 81% of patients (n = 21/26). However, schistosomiasis was also detected in by PCR-DNA assay (n = 7), positive parasitological stool test (n = 3), and positive rectal biopsy (n = 2) in 12 of 26 patients (46%). In a total of 14 patients, schistosomiasis was defined by positive serology with specific ultrasonographic imaging of HES and a strong epidemiological history for S. mansoni. All patients included were from endemic areas in Brazil. However, they had been out of the endemic areas for over 20 years. None of them had undergone prior treatment for S. mansoni infection. Among the 26 patients included, the mean age was 54 years (±10.6), 62% were female, and mean alanine aminotransferase was 46 (±17.2). All patients had portal hypertension expressed by the presence of esophageal varices (n = 22; 85%), isolated gastric varices (n = 1; 4%), or splenomegaly without gastroesophageal varices (n = 3; 11%). Table 1 describes clinical, demographic, and laboratory characteristics of included patients.
Figure 1.
Study flowchart.
Table 1.
Baseline characteristics of the patients (N = 26)
| Characteristics of patients | Median (range) |
|---|---|
| Female (%) | 62 |
| Age (years) ± SD | 54 ± 10.6 |
| Body mass index (kg/m2) | 26.9 (19.8–39.8) |
| Esophageal varices (%) | 85 |
| Aspartate aminotransferase (U/L) | 38 (19–92) |
| Alanine aminotransferase (U/L) | 47 (15–91) |
| Albumin (mg/dL) | 3.8 (3.3–4.8) |
| International normalized ratio | 1.23 (1.0–1.6) |
| Total bilirubin (mg/dL) | 1.2 (0.3–4.9) |
| Platelet count (109/L) | 64 (25–318) |
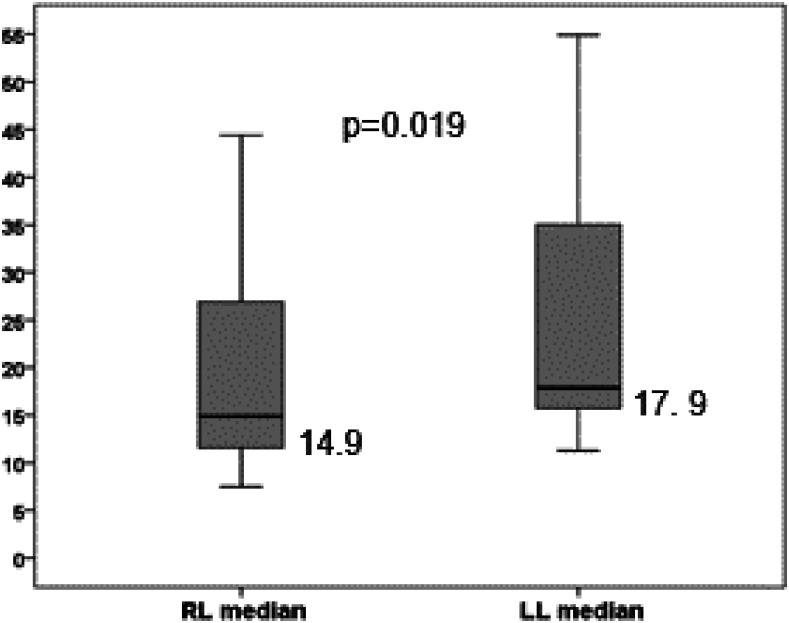
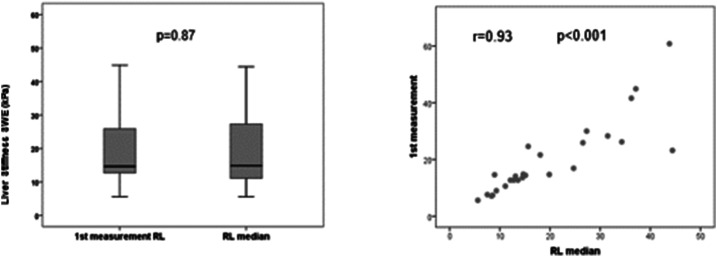
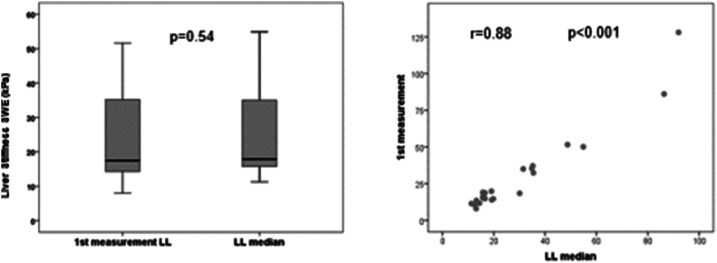
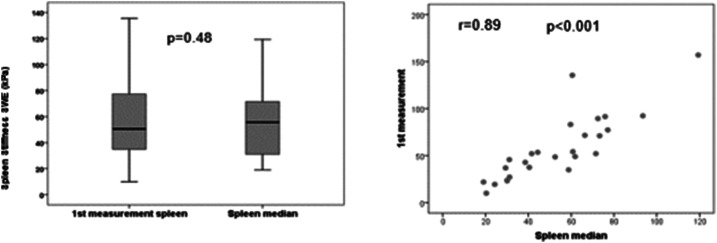
Liver elastography was reliable in all patients for the right hepatic lobe, and it was unreliable in two patients (10%) for the left hepatic lobe. Liver stiffness measurement (median [range] of four measurements) was significantly higher in the left than in right hepatic lobe (17.9 kPa [11.3–92.0] versus 14.9 kPa [5.6–44.4]; P = 0.019) (Figure 2). When comparing the first measurement with the median of the four acquisitions, no statistical differences were observed neither for the right (14.6 [5.6–60.8] versus 14.9 kPa [5.6–44.4]; P = 0.87) nor for the left hepatic lobe (17.4 [8.0–128.1] versus 17.9 kPa [11.3–92.0]; P = 0.54). The median value of splenic elastography was 55.7 kPa (19.1–119.4), and the first measurement was similar to the median of four measurements (50.5 [10.0–157.0] versus 55.7 kPa [19.1–119.4]; P = 0.48) (Table 2). In addition, we observed an excellent correlation between the values of the first measurement and the median of four measurements for the right hepatic lobe (r = 0.93; P < 0.001) (Figure 3), left hepatic lobe (r = 0.88; P < 0.001) (Figure 4), and spleen (r = 0.89; P < 0.001) (Figure 5).
Figure 2.
Comparative analysis between median values of the right lobe (RL) and left lobe (LL). The length of the boxes represents the interquartile range where 50% of values occur. Bars shows the minimum and maximum values, median, and quartiles. The line through the middle of each box represents the median.
Table 2.
Comparison between first measurement and median of four measurements
| First measurement | Median (range) of four measurements | P-value | |
|---|---|---|---|
| Right lobe (kPa) | 14.6 (5.6–60.8) | 14.9 (5.6–44.4) | 0.87 |
| Left lobe (kPa) | 17.4 (8.0–128.1) | 17.9 (11.3–92.0) | 0.54 |
| Spleen (kPa) | 50.5 (10.0–157.0) | 55.7 (19.1–119.4) | 0.48 |
Figure 3.
Comparative analysis between the first measurement of the right lobe (RL) and median of the RL.
Figure 4.
Comparative analysis between the first measurement of the left lobe (LL) and median of the LL.
Figure 5.
Comparative analysis between the first measurement of the spleen and median of the spleen.
DISCUSSION
This study highlighted that there was no significant difference of first compared with multiple stiffness measurements in the right and left hepatic lobes, as well as in the spleen. Moreover, excellent correlation values were observed between first and the median of four measurements for LSM and SSM. On the other hand, a non-negligible inter-hepatic lobe variability of LSM by 2-D SWE was reported in patients with HES. LSM in the LL seems to be higher than that in the right hepatic lobe.
Schistosomal hepatopathy is a peculiar form of chronic liver disease, with structural features and vascular changes that differ from cirrhosis.16 Although both diseases present liver fibrosis, the main characteristic of hepatic schistosomiasis is periportal fibrosis in the absence of bridging, nodular formation, or significant hepatocellular injury.5 In contrast to cirrhotic portal hypertension, the normal architecture of liver parenchyma is usually preserved in HES. The histologic lesion results from egg-induced chronic granulomatous inflammation in periportal tissues leading to fibrotic expansion of the portal spaces and intrahepatic portal vein obstruction.5 Obstruction is essentially presinusoidal in contrast to findings of cirrhosis, in which fibrosis affects liver parenchyma with nodular regeneration and fibrous septa.
A recent study9 showed significantly lower LSM by TE in patients with HES than in those with cirrhosis because of chronic hepatitis C. Lower than 30% of patients with HES had LSM higher than 12.5 kPa which is the threshold for F4 fibrosis stage by METAVIR score in chronic hepatitis C. These findings reflect the difference of fibrosis distribution in the liver parenchyma of those diseases.
The hypertrophy of the left hepatic lobe associated with the atrophy of the right liver lobe has been described in most patients with HES.17 The splenic blood flow increases because of splenomegaly, and the blood supply is higher to the LL leading to its hypertrophy in HES. The present study reported a higher LSM in the left than in the right hepatic lobe. However, it is still unclear whether this finding is due to the different blood flow for either hepatic lobes, influence of heart pulse in LSM, or higher periportal fibrosis in the LL. Controversial results showed an association with higher fibrosis in the left hepatic lobe of patients with HES.18–20 When analyzing LL hypertrophy on US in patients with HES, Cerri et al.18 and Kardorff et al.19 detected correlation with portal fibrosis, a finding not confirmed by other authors.20 Houston et al.21 compared US findings with abdominal palpation in 492 patients with schistosomiasis mansoni. They found that liver enlargement showed high specificity (94%) but low (28%) sensitivity as a surrogate marker for fibrosis.
It is important to highlight that in these reported studies, liver fibrosis was evaluated by US and not by liver biopsy. Although the gold-standard method for evaluating HES-related liver fibrosis is wedge liver biopsy,5 it is not feasible in clinical practice for staging and assessing liver fibrosis in HES. Therefore, abdominal US has become the surrogate for the diagnosis and classification of hepatic fibrosis in HES because of its availability and sensitivity, especially in studies conducted in endemic areas with difficult access to health care.8,22,23
Spleen stiffness measurement in patients with HES has been evaluated by TE in a previous study9 that showed similar median values for patients with HES and cirrhosis. This finding suggests that SSM might not be useful to differentiate cirrhotic from non-cirrhotic portal hypertension. The upper limit of 75.0 kPa for TE examination by FibroScan remains a major limitation in studies that assessed SSM. In the present study, as 2D SWE presents a wider range (1–150 kPa), we observed higher median and maximum values of spleen stiffness than those obtained in patients with cirrhosis enrolled in previous studies.24–26 To the best of our knowledge, this study is the first that evaluated SSM by 2D SWE in patients with HES. Further studies should validate rather these findings could be useful to differentiate HES from cirrhotic patients.
To date, there is no clear recommendation regarding quality criteria and the number of measurements necessary for reliable results of liver elastography by 2-D SWE. Most of the studies were performed considering 3–10 measurements as the standard of care.15,22–27 First, Ferraioli et al.15 evaluated the accuracy of 2-D SWE using the median of four consecutive measurements. However, Choi et al.28 described that five 2-D SWE measurements could replace the conventional 10-repetition protocol, with the exception of patients with fatty liver disease or an LSM value higher than 10 kPa. In addition, Procopet et al.24 reported an excellent correlation between the median of the first three measurements and the median of all five measurements suggesting that three stiffness measurements might be considered sufficient in the assessment of portal hypertension. In our study, no significant difference was observed between the first stiffness measurements compared with the median of the four measurements (standard of care) for both hepatic lobes and the spleen. Furthermore, we reported an excellent correlation between the values of the first measurement and the standard-of-care protocol (median of four measurements) for LSM and SSM. Our findings suggest that a single measurement would be sufficient to evaluate LSM and/or SSM in patients with HES.
The main limitations of this study are the reduced sample size, the absence of correlation between Niamey US classification and LSM, and the lack of liver biopsy to assess liver fibrosis. Although endemic in few Brazilian regions, HES remains a rare disease. In addition, we included only patients with strong evidence of infection by S. mansoni. We acknowledge that our sample might be influenced by a selection bias because of the strict inclusion criteria. Niamey classification was performed in 88% (n = 23) of our sample up to 2 years before 2-D SWE. The Niamey classification B, C, and D were observed in 26% (n = 6), 30% (n = 7), and 44% (n = 10) of those patients, respectively. However, we could not correlate Niamey pattern with LSM because of this relatively high delay between both examinations. Liver fibrosis assessment by liver biopsy is not recommended in clinical practice for management of HES, and it might be unethical to perform liver biopsy in these patients. Liver elastography might be influenced by several conditions, such as necro-inflammatory activity, extrahepatic cholestasis, or non-fasting status.29 However, all 2-D SWE elastographies were performed in 3-hour fasting status, and none of the patients had flare of transaminases or extrahepatic cholestasis. The main strengths of the study were the use of 2-D SWE performed by an experimented operator as an additional tool to evaluate patients with HES. Although it was not the aim of the study, 2-D SWE allows to assess periportal fibrosis by Niamey classification and LSM simultaneously, which facilitates both the radiological diagnosis and the staging of liver fibrosis related to Schistosomiasis mansoni. In addition, all examinations were performed by an experimented operator (> 1,000 examinations), and patients had a well-defined infection by S. mansoni. We also found that a single measurement would be sufficient to evaluate hepatic and splenic elastography. We acknowledge that the experimented operator was aware of all 2-D SWE measures when performing the liver/spleen elastography. In addition, this hypothesis might not be true for all elastography systems because the AixPlorer system is the only that provides the mean, minimum, maximum, and SD of the pixel values in the ROI for each measurement11,30.
In conclusion, in patients with HES, LSM by 2-D SWE of the left hepatic lobe seems to be higher than that of the RL, suggesting that both hepatic lobes might be assessed to stage liver fibrosis. Moreover, the value of the first measurement was well correlated with the median of the four measurements in both hepatic lobes and spleen, suggesting that a single measurement would be sufficient to evaluate the hepatic and splenic elastography. However, further studies that compare the number of measurements using other 2-D SWE systems are needed to generalize these results.
REFERENCES
- 1.World Health Organization , 2017. Schistosomiasis: Fact Sheet No 115. Geneva, Switzerland: WHO; Avaliable at: http://www.who.int/mediacentre/factsheets/fs115/en/. Accessed January 5, 2018. [Google Scholar]
- 2.Ministry of Health , 2014. Surveillance of Schistosomiasis Mansoni-Guidelines, 4th edition Brasília, Brazil, DF. [Google Scholar]
- 3.WHO , 1993. WHO Technical Report Series 830. The Control of Schistosomiasis – Second Report of WHO Experts Committee. Geneva, Switzerland: World Health Organization, 42–43. [PubMed] [Google Scholar]
- 4.Bedossa P, Dargère D, Paradis V, 2003. Sampling variability of liver fibrosis in chronic hepatitis C. Hepatology 38: 1449–1457. [DOI] [PubMed] [Google Scholar]
- 5.Lambertucci JR, 2014. Revisiting the concept of hepatosplenic schistosomiasis and its challenges using traditional and new tools. Rev Soc Bras Med Trop 47: 130–136. [DOI] [PubMed] [Google Scholar]
- 6.Bota S, Herkner H, Sporea I, Salzl P, Sirli R, Neghina AM, Peck-Radosavljevic M, 2013. Meta-analysis: ARFI elastography versus transient elastography for the evaluation of liver fibrosis. Liver Int 33: 1138–1147. [DOI] [PubMed] [Google Scholar]
- 7.Berzigotti A, 2017. Non-invasive evaluation of portal hypertension using ultrasound elastography J Hepatol 67: 399–411. [DOI] [PubMed] [Google Scholar]
- 8.Lambertucci JR, dos Santos Silva LC, Andrade LM, de Queiroz LC, Carvalho VT, Voieta I, Antunes CM, 2008. Imaging techniques in the evaluation of morbidity in schistosomiasis mansoni. Acta Trop 108: 209–217. [DOI] [PubMed] [Google Scholar]
- 9.Veiga ZST, et al. 2017. Transient elastography evaluation of hepatic and spleen stiffness in patients with hepatosplenic schistosomiasis. Eur J Gastroenterol Hepatol 29: 730–773. [DOI] [PubMed] [Google Scholar]
- 10.Jiang T, Tian G, Zhao Q, Kong D, Cheng C, Zhong L, Li L, 2016. Diagnostic accuracy of 2D-shear wave elastography for liver fibrosis severity: a meta-analysis. PLoS One 11: e0157219. [DOI] [PMC free article] [PubMed] [Google Scholar]
- 11.Barr RG, 2018. Shear wave liver elastography. Abdom Radiol (NY) 43: 800–807. [DOI] [PubMed] [Google Scholar]
- 12.Gonçalves MM, Barreto MG, Peralta RH, Gargioni C, Gonçalves T, Igreja RP, Soares MS, Peralta JM, 2006. Immunoassays as an auxiliary tool for the serodiagnosis of Schistosoma mansoni infection in individuals with low intensity of egg elimination. Acta Trop 100: 24–30. [DOI] [PubMed] [Google Scholar]
- 13.Gentile R, Gonçalves MM, daCostaNeto SF, da Costa MM, Peralta RH, Peralta JM, 2011. Evaluation of immunological, parasitological and molecular methods for the diagnosis of Schistosoma mansoni infection before and after chemotherapy treatment with praziquantel in experimentally infected Nectomys squamipes. Vet Parasitol 180: 243–249. [DOI] [PubMed] [Google Scholar]
- 14.Cavalcanti MG, Silva LF, Macedo HW, Peralta RHS, Igreja RP, Barreto MGM, Peralta JM, 2016. Real-time PCR improves detection of active infection in human feces and treatment failure following multiple chemotherapeutic rounds in Schistosoma mansoni low endemic area. Annals Clin Pathol 2: 1092–1100. [Google Scholar]
- 15.Ferraiolli G, Tinelli C, Dal Bello Z, Zicchetti M, Filice G, Filice C; Liver Fibrosis Study Group , 2012. Accuracy of real-time shear wave elastography for assessing liver fibrosis in chronic hepatitis C: a pilot study. Hepatology 56: 2125–2133. [DOI] [PubMed] [Google Scholar]
- 16.Andrade ZA, 2004. Schistosomal hepatopathy. Mem Inst Oswaldo Cruz 99 (Suppl 1): 51–57. [DOI] [PubMed] [Google Scholar]
- 17.Pinto-Silva RA, Queiroz LC, Azeredo LM, Silva LC, Lambertucci JR, 2010. Ultrasound in schistosomiasis mansoni. Mem Inst Oswaldo Cruz 105: 479–484. [DOI] [PubMed] [Google Scholar]
- 18.Cerri GG, Alves VAF, Magalhães A, 1984. Hepatosplenic schistosomiasis mansoni: ultrasound manifestations. Radiology 153: 777–780. [DOI] [PubMed] [Google Scholar]
- 19.Kardorff R, et al. 1997. Schistosoma mansoni-related morbidity on Ukerewe Island, Tanzania: clinical, ultrasonographical and biochemical parameters. Trop Med Intern Health 2: 230–239. [DOI] [PubMed] [Google Scholar]
- 20.Prata A, Guevara RR, Antunes FCM, Marinho CC, Queiroz LC, Voieta I, Lambertucci JR, 2010. Comparison between clinical and ultrasonographic findings in cases of periportal fibrosis in an endemic area for schistosomiasis mansoni in Brazil. Revista da Sociedade Brasileira de Medicina Trop 43: 129–134. [DOI] [PubMed] [Google Scholar]
- 21.Houston S, Munjoma M, Kanyimo K, Davidson RN, Flowerdew G, 1993. Use of ultrasound in a study of schistosomal periportal fibrosis in rural Zimbabwe. Acta Trop 53: 51–58. [DOI] [PubMed] [Google Scholar]
- 22.Lambertucci JR, Cota GF, Pinto-Silva RA, Serufo JC, Gerspacher-Lara R, Costa Drummond S, Antunes CM, Nobre V, Rayes A, 2001. Hepatosplenic schistosomiasis in field based studies: a combined clinical and sonographic definition. Memórias Do Instituto Oswaldo Cruz 96: 147–150. [DOI] [PubMed] [Google Scholar]
- 23.Voieta, et al. 2010. Imaging techniques and histology in the evaluation of liver fibrosis in hepatosplenic schistosomiasis mansoni in Brazil: a comparative study. Mem Inst Oswaldo Cruz 105: 414–421. [DOI] [PubMed] [Google Scholar]
- 24.Procopet B, Berzigotti A, Abraldes JG, Turon F, Hernandez-Gea V, García-Pagán JC, Bosch J, 2015. Real-time shear-wave elastography: applicability, reliability and accuracy for clinically significant portal hypertension. J Hepatol 62: 1068–1075. [DOI] [PubMed] [Google Scholar]
- 25.Grgurevic I, Puljiz Z, Brnic D, Bokun T, Heinzl R, Lukic A, Luksic B, Kujundzic M, Brkljacic B, 2015. Liver and spleen stiffness and their ratio assessed by real-time two dimensional-shear wave elastography in patients with liver fibrosis and cirrhosis due to chronic viral hepatitis. Eur Radiol 25: 3214–3221. [DOI] [PubMed] [Google Scholar]
- 26.Elkrief L, et al. 2015. Prospective comparison of spleen and liver stiffness by using shear-wave and transient elastography for detection of portal hypertension in cirrhosis. Radiology 275: 589–598. [DOI] [PubMed] [Google Scholar]
- 27.Leung VY, et al. 2013. Quantitative elastography of liver fibrosis and spleen stiffness in chronic hepatitis B carriers: comparison of shear-wave elastography and transient elastography with liver biopsy correlation. Radiology 269: 910–918. [DOI] [PubMed] [Google Scholar]
- 28.Choi SH, Jeong WK, Kim Y, Lim S, Kwon JW, Kim TY, Kim MY, Sohn JH, 2016. How many times should we repeat measuring liver stiffness using shear wave elastography?: 5-repetition versus 10-repetition protocols. Ultrasonics 72: 158–164. [DOI] [PubMed] [Google Scholar]
- 29.Perazzo H, Veloso VG, Grinsztejn B, Hyde C, Castro R, 2015. Factors that could impact on liver fibrosis staging by transient elastography. Int J Hepatol 2015: 624596. [DOI] [PMC free article] [PubMed] [Google Scholar]
- 30.Barr RG, Wilson SR, Rubens D, Garcia-Tsao G, Ferraioli G, 2020. Update to the society of radiologists in ultrasound liver elastography consensus statement. Radiology 2020: 192437. [DOI] [PubMed] [Google Scholar]


