

Abstract
Previous work by ourselves and others showed that mitoquinone (mitoQ) reduced oxidative damage and prevented hepatic fat accumulation in mice made obese with high‐fat (HF) feeding. Here we extended these studies to examine the effect of mitoQ on parameters affecting liver function in rats treated with HF to induce obesity and in rats treated with HF plus streptozotocin (STZ) to model a severe form of type 2 diabetes. In prior reported work, we found that mitoQ significantly improved glycemia based on glucose tolerance data in HF rats but not in the diabetic rats. Here we found only non‐significant reductions in insulin and glucose measured in the fed state at sacrifice in the HF mice treated with mitoQ. Metabolomic data showed that mitoQ altered several hepatic metabolic pathways in HF‐fed obese rats toward those observed in control normal chow‐fed non‐obese rats. However, mitoQ had little effect on pathways observed in the diabetic rats, wherein diabetes itself induced marked pathway aberrations. MitoQ did not alter respiration or membrane potential in isolated liver mitochondria. MitoQ reduced liver fat and liver hydroperoxide levels but did not improve liver function as marked by circulating levels of aspartate and alanine aminotransferase (ALT). In summary, our results for HF‐fed rats are consistent with past findings in HF‐fed mice indicating decreased liver lipid hydroperoxides (LPO) and improved glycemia. However, in contrast to the HF obese mice, mitoQ did not improve glycemia or reset perturbed metabolic pathways in the diabetic rats.
Keywords: antioxidants, glucose, insulin, liver, mitochondria, obesity, oxidative stress, steatosis
High fat fed obese and high fat fed streptozotocin (STZ) diabetic rats were treated with mitoquinone (MQ) or vehicle.

Abbreviations
- 2DOG
2‐deoxyglucose
- 2DOGP
2‐deoxyglucose phosphate
- ALT
alanine aminotransferase
- AST
aspartate aminotransferase
- GC‐MS
gas chromatography‐mass spectroscopy
- HF
high fat
- LPO
lipid hydroperoxide
- MitoQ
mitoquinone
- NF
normal fat
- NMR
nuclear magnetic resonance
- ROS
reactive oxygen species
- STZ
streptozotocin
- TBARS
thiobarbituric acid reactive substances
- TPP+
tetraphenylphosphonium
- ΔΨ
mitochondrial inner membrane potential
1. INTRODUCTION
Mitoquinone (mitoQ) is a derivative of endogenous coenzyme Q (CoQ) consisting of the quinone moiety and a saturated 10 carbon side chain, unlike the 50 carbon (ten 5‐five carbon isoprenoid units) unsaturated side chain of endogenous human CoQ or the nine 5‐carbon isoprenoid units of rat CoQ. 1 A cationic moiety, triphenylphosphonium (TPP+), is appended to the side chain to target mitochondria through the negative charge in the matrix. MitoQ has antioxidant properties through its capacity to block lipid peroxidation. 2 Moreover, our laboratory and others 3 , 4 , 5 , 6 have provided evidence that mitoQ or related molecules have metabolic properties and may act as an uncoupler of mitochondrial oxidative phosphorylation. MitoQ may also suppress appetite and increase insulin sensitivity, suggesting action as an anti‐obesity and/or antidiabetic agent. 7 , 8 , 9
We previously reported that mitoQ mitigated weight gain 8 , 10 and decreased 10 or did not change 8 liver fat and decreased liver hydroperoxides 8 in C57BL/6 mice fed high fat (HF) to induce obesity. We also found improvement or no change in liver function as assessed in HF‐fed mice by circulating aspartate aminotransferase (AST) and alanine aminotransferase (ALT) levels. 8 , 10 Interestingly, Rehman et al. recently reported that mitoQ may limit liver fibrosis. 11 MitoQ may also increase whole body energy expenditure in HF‐fed mice. 10
As opposed to mice, little is known about the effect of mitoQ on liver function in rat models of obesity or about the effect of mitoQ on diabetes as modeled by either rodent. Recently, we reported that mitoQ favorably altered multiple parameters of polyneuropathy in rats made obese by HF feeding and in rats fed HF but also treated with streptozotocin (STZ) to induce diabetes. 12 In this current study, we looked further at these rodent groups to assess hepatic function and fat accumulation, liver metabolites, and liver mitochondrial function. We also carried out further analyses of liver oxidative damage and of whole‐body insulin and glucose dynamics.
2. MATERIALS AND METHODS
2.1. Reagents and supplies
Synthesis of mitoQ mesylate and preparation of the cyclodextrin (CD) complex of mitoQ mesylate are described in detail in Supporting Information. All other reagents, kits, and supplies were as specified or purchased from standard sources. The molecular structure of mitoQ is shown in its oxidized state in Figure 1A. MitoQ undergoes redox cycling within mitochondria existing in an oxidized form (mitoQ), a reduced form (mitoquinol), and in an intermediate free radical or semiquinone form; the latter possessing antioxidant capacity by inhibiting chain elongation of lipid peroxides. 2
FIGURE 1.
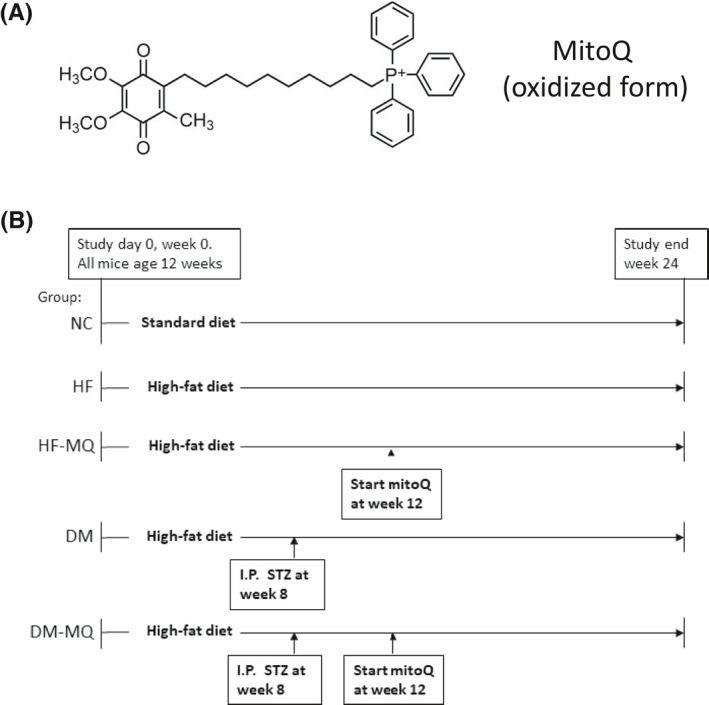
Schematic depicting the structure of mitoQ and the study protocol. (A) Structure of mitoQ in oxidized form. (B) Five groups of rats designated as shown were studied over a 24‐week period with interventions as indicated. Streptozotocin (STZ) (30 mg/kg) was administered by the intraperitoneal route. Mitoquinone (mitoQ) 0.93 g/kg diet was added at the time indicated and continued until sacrifice
2.2. Animals, diets, and experimental design
In this work, we carried out further investigation of the rats utilized in our abovementioned study 12 that addressed the effect of mitoQ on polyneuropathy. The study protocol is depicted in Figure 1B. Male Sprague–Dawley (Harlan Sprague Dawley) rats were obtained at 10–11 weeks of age and housed in our certified animal care facility. A normal rodent diet with 13% of calories from fat, 34% from protein, and 53% from carbohydrate (Harlan Teklad, #7001) was administered until day 0 of the study and water was provided ad libitum throughout. Food intake was measured at 2‐week intervals. All institutional (ACORP #1691101) and NIH guidelines for use of animals were followed.
At age 12 weeks, as indicated in Figure 1B, rats were divided into five groups designated as NC, HF, HF‐MQ (HF fed, mitoQ), DM (diabetes, HF fed), and DM‐MQ (diabetes, HF fed, mitoQ). NC rats were continued on the normal rodent diet indicated above. HF feeding consisted of a diet with 45% of calories from fat, 20% from protein, and 35% from carbohydrate (D12451; Research Diets). STZ was administered at 30 mg/kg as a single intraperitoneal injection, a dose we previously found effective at modeling type 2 diabetes in obese rats in a manner not requiring insulin for survival. 13 MitoQ was administered orally by adding to the diet at 0.93 g/kg diet. This dose of mitoQ was based on a prior report showing that mitoQ increased mitochondrial cardiolipin content in HF‐fed obese rats. 14 At the conclusion of the treatment periods, rats were anesthetized with sodium pentobarbital (50 mg/kg, i.p., Abbott Laboratories), tissues were harvested, and blood was obtained from the heart. The anesthetized rats were then euthanized by cardiac puncture.
2.3. Hepatic fat content and lipid hydroperoxides
To determine hepatic total lipid content, liver tissue was homogenized for 30 sec using an Omni TH hand‐held homogenizer and extracted with chloroform/methanol (2:1 ratio, respectively). Then 0.5 mL of lipid extracts were placed in microfuge tubes and evaporated overnight for complete solvent removal. Lipid weight was determined as the difference in tube weight before addition of extract and after solvent evaporation. Lipid hydroperoxides (LPO) were determined in liver tissue using an assay kit by Cayman Chemicals (Ann Arbor, MI, USA) according to the manufacturer's instructions.
2.4. Isolation of mitochondria
Liver mitochondria were prepared by differential centrifugation and purified on a self‐generating Percoll (Sigma‐Aldrich) gradient as we described previously. 15 Mitochondria were suspended in isolation medium (0.25 M sucrose, 5 mM HEPES pH 7.2, 0.1 mM EDTA, and 0.1% defatted bovine serum albumin, BSA), layered over a solution of 3 parts Percoll/7 parts isolation medium, and centrifuged at 4°C for 30 min at 90 000g. The purified mitochondrial band near the bottom of the tube was transferred to 1.5 mL centrifuge tubes containing isolation medium lacking BSA, spun at 4°C in a microfuge at 8500g for 5 min at, and the pellet was washed a second time. The protein content of the final suspension was determined using the method of Bradford.
2.5. Mitochondrial respiration and inner membrane potential
Respiration and potential (ΔΨ) were determined using an Oxygraph‐2 k high‐resolution respirometer (Oroboros Instruments) fitted with a potential sensitive tetraphenylphosphonium (TPP) electrode. To calibrate potential, a TPP standard curve was performed in each run by adding TPP chloride at concentrations of 0.25, 0.50, and 0.75 µM before the addition of mitochondria to the chamber. Mitochondria (0.25 mg/mL) were fueled by combined substrates consisting of 5 mM succinate +5 mM pyruvate +1 mM malate and incubated at 37°C in 2 mL of ionic respiratory buffer (105 mM KCl, 10 mM NaCl, 5 mM Na2HPO4, 2 mM MgCl2, 10 mM HEPES pH 7.2, 1 mM EGTA, and 0.2% defatted BSA). ADP was added sequentially to final concentrations shown with plateaus in respiration and potential achieved after each addition. ADP concentrations were clamped at each sequential level using an ADP energy clamp as we described in the past. 15 , 16 Briefly, incubations are carried out in the presence of hexokinase and 2‐deoxyglucose (2DOG), so that any ATP generated is rapidly recycled back to ADP as ATP is utilized for irreversible conversion of 2DOG to 2DOG phosphate.
2.6. Blood/serum determinations
Glucose and insulin were measured at the time of sacrifice in the non‐fasted state. Blood glucose was determined on tail vein blood using Accu‐Chek Aviva strips. Insulin was determined on serum from blood drawn by cardiac puncture by ELISA using a commercial kit (EMD Millipore). Serum was also used to determine thiobarbituric acid reactive substances (TBARS) as previously described. 12 Using the same serum, ALT and AST determinations were performed by our clinical chemistry laboratory (Iowa City VA Medical Center) by standard automated clinical methods.
2.7. Metabolomics
Liver tissue was snap‐frozen in liquid nitrogen and sent to our University of Iowa Metabolomics Core (https://medicine.uiowa.edu/diabetes/metabolomics‐core‐facility). GC‐MS was used to assess a targeted panel of 72 compounds including TCA cycle and glycolytic/gluconeogenic intermediates, aspartate and other AAs, sugars, and fatty acids.
2.8. Statistics
Data were analyzed by one‐way ANOVA with the Holm‐Sidak test for multiple comparisons using GraphPad Prism software. Nine rats in each study group entered the study protocol. The numbers of rats in each group at sacrifice were: nine for the NC group, eight for HF, nine for HF‐MQ, nine for DM, and eight for DM‐MQ. One rat in the HF and one in the DM‐MQ group died prior to completion of the study protocol. No serum or mitochondrial samples from animals sacrificed at study end were omitted from the data analysis. However, due to lack of an adequate blood sample at sacrifice, the number of replications presented for the liver function data (ALT and AST) and the insulin and glucose data were less than the number of rats at sacrifice (n values listed in figure legends and shown graphically as individual data points).
GC‐MS‐based metabolomic data were generated for pathway analysis using the MetaboAnalyst 4.0 software application. 17 Individual metabolite results are presented in Supporting Information as compared between groups by multiple t‐tests but clearly prone to false discovery. Due to cost, only four liver samples per group were submitted for metabolomic analyses. One sample in the DM‐MQ group was inadequate for analyses (n = 4 for metabolomic data for the NC, HF, HF‐MQ, and DM groups, n = 3 for the DM‐MQ group).
3. RESULTS
3.1. Body weight and food consumption
As we previously reported, 12 initial weights (g) were (mean ± SEM): NC 327 ± 2, HF 323 ± 4, HF‐MQ 320 ± 7, DM 329 ± 3, and DM‐MQ 325 ± 3. Weight gain (g) from initial to weight at sacrifice was (mean ± SEM): NC 176 ± 13, HF 212 ± 11, HF‐MQ 230 ± 12, DM 129 ± 24, and DM‐MQ 91 ± 14. MitoQ did not significantly alter weight gain in either the HF‐fed or HF‐fed diabetic rats. The amount of diet consumed (measured every 2 weeks and calculated as kcal/day/kg rat) by rats in each of the five groups was (mean ± SEM): NC 155 ± 5, HF 141 ± 8, HF‐MQ 143 ± 5, DM 273 ± 16, and DM‐MQ 269 ± 13.
3.2. Hepatic fat content and lipid hydroperoxides
MitoQ significantly reduced liver LPO by one‐way ANOVA (Figure 2A). MitoQ also appeared to reduce liver fat content and LPO per unit liver fat (Figure 2B and C), but these effects fell short of significance.
FIGURE 2.
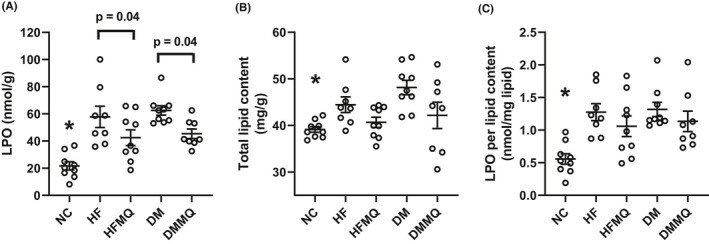
Liver fat and liver lipid hydroperoxide (LPO) content. (A) LPO per gram liver tissue, *p < .001 versus the HF and DM groups, p < .01 versus DM‐MQ, and p < .05 versus HF‐MQ. Brackets depict significance of additional comparisons. (B) Liver fat content per gram liver tissue, *p < .01 versus DM. (C) LPO per unit liver fat, *p < .001 versus DM, p < .01 versus HF, and p < .05 versus HF‐MQ and DM‐MQ. Data are shown as individual values and as mean ± SEM, n = 8–9 for each group. Data were analyzed by one‐way ANOVA and the Holm‐Sidak test for multiple comparisons
3.3. Circulating markers of liver function and oxidative stress
MitoQ did not improve liver function as assessed by the enzyme markers, ALT or AST (Figure 3A and B). In fact, ALT and AST were, if anything, non‐significantly increased (Figure 3A and B). MitoQ resulted in only a slight and non‐significant decrease in TBARS in the HF‐fed and diabetic rats (Figure 3C).
FIGURE 3.
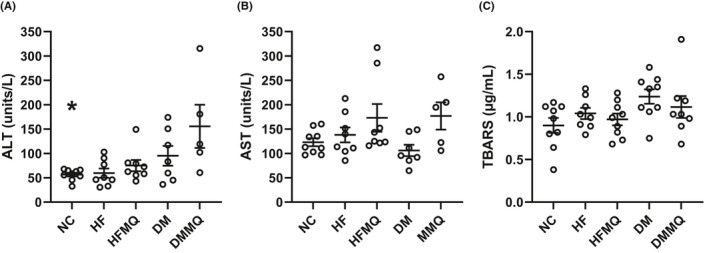
Circulating serum markers of liver function (ALT and AST) and of thiobarbituric acid reactive substances (TBARS) as a marker of whole body systemic oxidative stress. (A) ALT, *p < .001 versus the DM‐MQ group. (B) AST. (C) TBARS. Data are shown as individual values and mean ± SEM. For ALT and AST, nine for the NC group, eight for HF and HF‐MQ, seven for DM, and five for DM‐MQ. For TBARS, eight or nine for each group. Data were analyzed by one‐way ANOVA and the Holm‐Sidak test for multiple comparisons
3.4. Glycemic effects
MitoQ decreased both insulin and glucose in HF‐fed rats; however, these results missed significance (Figure 4A and B). As expected, glucose concentrations were markedly elevated and insulin concentrations suppressed in the HF‐fed STZ‐treated rats. In our abovementioned previous study that focused on the neurologic effects of mitoQ, 12 we reported the results of glucose tolerance tests done in these rats. Those data were shown in graphic form and analyzed as area under the curve (AUC) by one‐way ANOVA, revealing significantly reduced AUC for the HF rats treated with mitoQ compared to the HF rats treated with vehicle. The previously reported values for AUC were (mean ± SEM): NC 43 838 ± 3458, HF 69 875 ± 2997, HF‐MQ 52 503 ± 2874, DM 115 118 ± 6317, and DM‐MQ 122 115 ± 2005.
FIGURE 4.
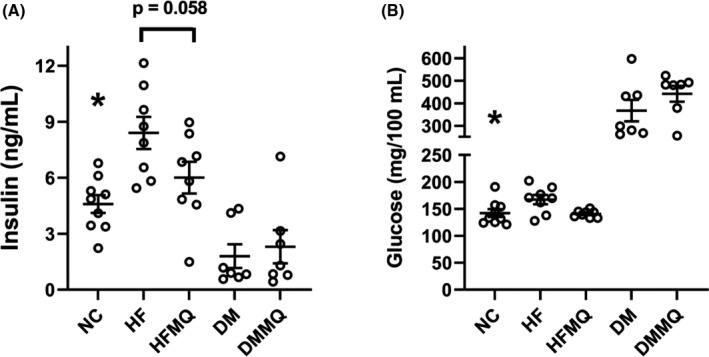
Effect of mitoQ in HF‐fed (HF) and diabetic (DM) rats on circulating insulin and glycemia. (A) Insulin, *p < .01 versus the HF group. Bracket depicts near significance of HF versus HF‐MQ. (B) Glucose, *p < .0001 versus DM and DM‐MQ. Data are shown as individual values and as mean ± SEM. For both insulin and glucose, nine for the NC group, eight for HF and HF‐MQ, and seven for DM and DM‐MQ. Data were analyzed by one‐way ANOVA and the Holm‐Sidak test for multiple comparisons
3.5. Mitochondrial respiration and membrane potential
Respiration and ΔΨ were assessed in isolated mitochondria at varying concentrations of clamped [ADP] ranging from state 4 respiration (zero added ADP) to intermediate ADP levels, and to high levels as seen under state 3 conditions (Figure 5A and B). Neither mitoQ nor the diabetic state had significant effects on O2 flux or ΔΨ assessed as AUC (Figure 5C and D).
FIGURE 5.
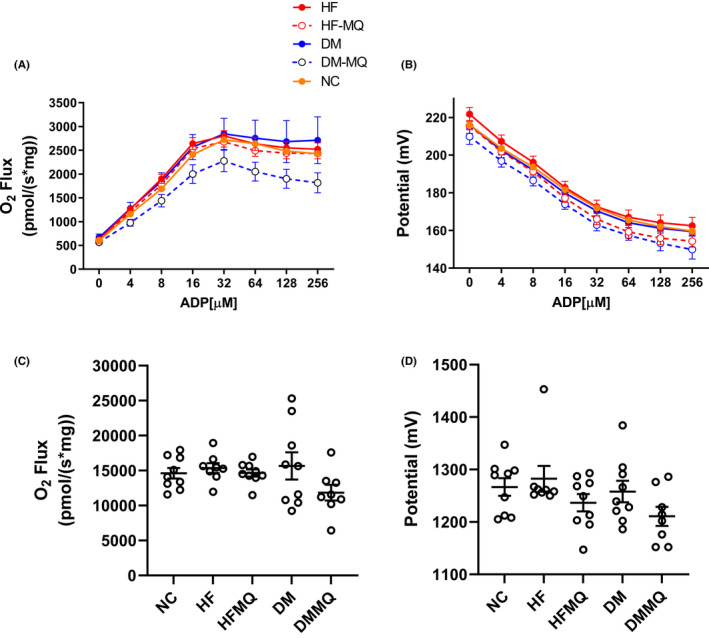
Effect of mitoQ in HF‐fed (HF) and diabetic (DM) rats on respiration and membrane potential in isolated liver mitochondria. Mitochondria were energized by combined substrates including pyruvate (5 mM), malate (1 mM), and succinate (5 mM) and incubated at sequentially incremented clamped concentrations of ADP. (A and B) Respiration and membrane potential (mean ± SEM). (C and D) Area under the curves (AUC, mean ± SEM) depicted in panels A and B, respectively. Eight to nine for all data points. Data were analyzed by one‐way ANOVA and the Holm‐Sidak test for multiple comparisons
3.6. Metabolomics
We used GC‐MS to compare the relative amounts of 72 liver tissue metabolites among the five rat study groups using individual t‐tests. Specific metabolite data are listed in Supporting Information. Expected changes were seen as a result of the diabetic state, wherein hepatic β‐hydroxybutyrate was markedly elevated while glucose 6‐phosphate and its downstream metabolites trended lower. The metabolite data were examined for pathway analyses using the MetaboAnalyst software application. 17 Fifty‐six pathways were examined using the Kegg database. 18 When the HF rats were compared to the NC rats (Figure 6A, column headed NC vs. HF), several pathway changes were similar to those observed when the HF rats were compared to the HF‐MQ rats (Figure 6A, column headed HF vs. HF‐MQ), suggesting that mitoQ returned the activity of certain pathways of the HF group back toward the NC group. Notably, this included glutathione metabolism as the top listed pathway in Figure 6A, a pathway of obvious importance in redox physiology. In contrast, when pathway changes between the DM rats and NC rats (Figure 6B, column headed NC vs. DM) were compared to pathway changes between the DM and DM‐MQ rats (Figure 6B, column headed DM vs. DM‐MQ), no such tendencies were observed. Rather we observed that pathway changes between the NC and DM rats (Figure 6B, column headed NC vs. DM) more closely resembled pathway changes between the NC and DM‐MQ rats (Figure 6B, column headed NC vs. DM‐MQ), implying that diabetes substantially altered many pathways in ways that were not affected by mitoQ.
FIGURE 6.
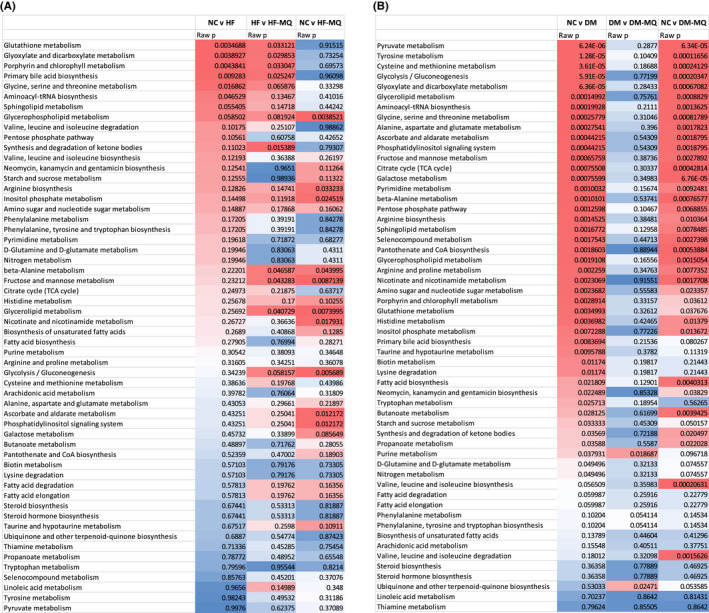
Heat maps depicting pathway analyses based on 72 metabolites measured in liver tissue and entered into the software application, MetaboAnalyst. (A) Data comparing pathways determined by liver metabolites between the following groups: NC to HF, HF to HF‐MQ, and NC to HF‐MQ. (B) Data comparing pathways determined by liver metabolites between the following groups: NC to DM, DM to DM‐MQ, and NC to DM‐MQ. For each panel, the pathways are listed in order of the significance of differences in the NC versus HF groups (panel A) and the NC versus DM groups (panel B). Heat map from red to blue indicates the magnitude of p‐values reflecting differences between the groups in question
4. DISCUSSION
Previously we reported that mitoQ improved neuropathic parameters in obese and diabetic rats. 12 Here we extended our studies of these animals. We present entirely new data regarding liver mitochondrial respiration and inner membrane potential, liver metabolomics, liver fat content, markers of liver function, and insulin and glucose levels at sacrifice.
MitoQ significantly reduced liver LPO and non‐significantly reduced total liver fat (Figure 2A and B). However, a question arises as to whether the reduction in liver hydroperoxides could have been due to less fat and, therefore, less oxidized fat. When the data were normalized to fat content (Figure 2C), the effect of mitoQ on LPO lost its significance. The normalized data did trend in the same direction as the LPO data per se but with more variability, not unexpected as the normalized data are a ratio requiring two measured parameters. The reduction in LPO is consistent with the mode of action of mitoQ. Specifically, the antioxidant effect of mitoQ is not to scavenge free radicals but rather to generate a semiquinone intermediate acting as a chain breaking agent, thus protecting against lipid peroxide chain extension. 19
Although liver fat improved with mitoQ treatment, liver function as assessed by circulating AST and ALT (Figure 3A and B) did not improve and actually showed a non‐significant increase (Figure 3B). It is possible that these data are confounded by a drug effect independent of its antioxidant properties. Several drugs and supplements are well known to increase the activities of liver enzymes, for example, the widely used statin agents were utilized to reduce cholesterol. 20 Serum TBARS, as opposed to LPO, were not significantly reduced by mitoQ. Of course, systemic TBARS measured this way derive from all tissues and, hence, difficult to compare to liver‐specific markers.
Although mitoQ did not significantly alter serum glucose or insulin, there was a non‐significant reduction of both parameters (Figure 4A and B) in the HF rats. Moreover, as we previously reported for these same rats in our past report, 12 mitoQ reduced the AUC on glucose tolerance testing for the HF‐MQ rats compared to the HF group. The lack of effect of mitoQ on insulin and glucose in the STZ‐treated rats (Figure 4A and B) is not surprising in view of the profound effect of STZ alone. Overall, the improvement in glycemia as AUC by GTT along with at least a decrease (although non‐significant) in both glucose and insulin at sacrifice in the HF versus HF‐MQ rats is consistent with results previously reported by ourselves 10 and others. 7 , 21 , 22 , 23 Those studies carried out in obese rodents or isolated islets showed that mitoQ improved glucose‐stimulated insulin secretion, glycemia, and insulin sensitivity.
Liver respiration and potential were assessed in isolated rat liver mitochondria on a combination of complex I and complex II substrates and measured over a range of clamped concentrations of ADP. Hence, our findings are not confined to state 3 or state 4 respiration (states wherein mitochondria do not function in vivo), but cover a range of intermediate states better reflecting in vivo physiology. As shown in Figure 5C and D, O2 flux and ΔΨ in these rat mitochondria were not significantly altered by mitoQ. This is consistent with our past studies of liver mitochondria in HF‐fed mice. 8 The lack of reduction in membrane potential noted here is at odds with evidence that mitoQ and related compounds may induce mild respiratory uncoupling in isolated cells, 3 , 24 suggesting that findings in cell culture, at least in liver, may not be carried forward in vivo.
We performed a targeted analysis of 72 metabolites including compounds involved in mitochondrial and cellular nutrient utilization. The metabolite data alone were not remarkable, largely showing the expected changes in β‐hydroxybutyrate, glucose 6‐phosphate, and downstream metabolites expected in diabetes compared to the NC group. Pathway analyses using MetaboAnalyst were more revealing providing an interesting contrast between the effects of mitoQ in HF versus HF‐MQ rats compared to DM versus DM‐MQ rats. In comparing HF to NC rats, certain pathway changes were shared with those in comparing HF to HF‐MQ mice (Figure 6A), suggesting that MQ returned certain pathways toward normal non‐obese rats, notably including top‐listed glutathione metabolism important in mitigating oxidative stress. In contrast, in examining pathways in the DM versus NC groups with the DM versus DM‐MQ rats (Figure 6B), mitoQ had little, if any, effect in returning pathway activity toward NC. Moreover, the changes in NC versus DM rats compared to NC versus DM‐MQ shared several pathways, implying very substantial effects of the diabetic state that were not amenable to changes induced by mitoQ. These findings are consistent with the lack of effect of mitoQ on glucose metabolism in the DM compared to the DM‐MQ rat groups.
A limitation to this study is that we cannot be sure of the extent to which mitoQ was absorbed and distributed to liver. However, as we observed in our previous manuscript, 12 food intake, which reflects oral intake of mitoQ, did not differ between mitoQ‐treated and mitoQ‐untreated rats. The diabetic rats (DM and DM‐MQ groups) did consume more food, even normalized to weight, and therefore more mitoQ than the HF obese rats (HF and HF‐MQ groups). However, there was no difference as an effect of mitoQ in either circumstance. Another limitation is that we assessed mitochondrial function in the isolated organelles, and we cannot be sure that this accurately reflects mitochondrial function in vivo. Finally, the diabetes model we examined, by human standards, represents an advanced and relatively severe form of type 2 diabetes which might not manifest mitoQ effects seen in milder type 2 diabetes.
In summary, our current results in the HF rat model are consistent with past findings in HF‐fed mice indicating decreased liver LPO and improved glycemia and insulin sensitivity. However, our results for the diabetic rats showed that mitoQ had no effect to improve glycemia or to restore metabolic pathways toward non‐diabetic rats. These finding may have implications for the potential use of mitoQ or related compounds in human obesity and type 2 diabetes.
5. ETHICS STATEMENT
Animal studies were carried out in accordance with the Guide for the Care and Use of Laboratory Animals as adopted and promulgated by the U.S. National Institutes of Health and were approved by the Institution's Animal Care and use Committee. This article does not contain any studies involving human participants performed by any of the authors.
CONFLICT OF INTEREST
The authors declare no conflict of interest.
AUTHOR CONTRIBUTIONS
Author Contribution: Participated in research design: Sivitz, Fink, Yu, and Yorek. Conducted experiments: Fink, Coppey, Shevalye, Obrosov, and Yu. Contributed new reagents or analytic tools: Kerns. Performed data analysis: Sivitz, Yu, Yorek, and Fink. Wrote or contributed to the writing of the manuscript: Sivitz, Yorek, Yu, and Fink.
Supporting information
Supplementary Material
ACKNOWLEDGMENTS
These studies were supported by resources and the use of facilities at the Department of Veterans Affairs Iowa City Health Care System, Iowa City, IA 52246. WIS was supported by the Veterans Health Administration (I01BX000285) and by the Iowa Fraternal Order of the Eagles. MAY was supported by Veterans Health Administration, Office of Research and Development, Rehabilitation Research and Development (RX000889‐05), and by National Institute of Diabetes and Digestive and Kidney Diseases Grant DK107339‐04 and DK115256‐02 from NIH.
Fink BD, Yu L, Coppey L, et al. Effect of mitoquinone on liver metabolism and steatosis in obese and diabetic rats. Pharmacol Res Perspect. 2021;9:e00701 10.1002/prp2.701
DATA AVAILABILITY STATEMENT
Data that support the findings of this study are available in the supplementary material of this article. Data that support the findings of this study are available from the corresponding author upon reasonable request.
References
- 1. James AM, Cocheme HM, Smith RA, Murphy MP. Interactions of mitochondria‐targeted and untargeted ubiquinones with the mitochondrial respiratory chain and reactive oxygen species. Implications for the use of exogenous ubiquinones as therapies and experimental tools. J Biol Chem. 2005;280(22):21295‐21312. PubMed PMID: 15788391. [DOI] [PubMed] [Google Scholar]
- 2. Kelso GF, Porteous CM, Hughes G, et al. Prevention of mitochondrial oxidative damage using targeted antioxidants. Ann NY Acad Sci. 2002;959:263‐274. PubMed PMID: 11976201. [DOI] [PubMed] [Google Scholar]
- 3. Fink BD, Herlein JA, Yorek MA, Fenner AM, Kerns RJ, Sivitz WI. Bioenergetic effects of mitochondrial‐targeted coenzyme Q analogs in endothelial cells. J Pharmacol Exp Ther. 2012;342(3):709‐719. Epub 2012/06/05. doi: 10.1124/jpet.112.195586. PubMed PMID: 22661629; PubMed Central PMCID: PMC3422527. [DOI] [PMC free article] [PubMed] [Google Scholar]
- 4. Fink BD, O'Malley Y, Dake BL, Ross NC, Prisinzano TE, Sivitz WI. Mitochondrial targeted coenzyme Q, superoxide, and fuel selectivity in endothelial cells. PloS One. 2009;4(1):e4250. PubMed PMID: 19158951. [DOI] [PMC free article] [PubMed] [Google Scholar]
- 5. Skulachev VP. Functions of mitochondria: from intracellular power stations to mediators of a senescence program. Cell Mol Life Sci. 2009;66(11–12):1785‐1793. PubMed PMID: 19387546. [DOI] [PMC free article] [PubMed] [Google Scholar]
- 6. Skulachev VP, Anisimov VN, Antonenko YN, et al. An attempt to prevent senescence: a mitochondrial approach. Biochim Biophys Acta. 2009;1787(5):437‐461. PubMed PMID: 19159610. [DOI] [PubMed] [Google Scholar]
- 7. Feillet‐Coudray C, Fouret G, Ebabe Elle R, et al. The mitochondrial‐targeted antioxidant MitoQ ameliorates metabolic syndrome features in obesogenic diet‐fed rats better than Apocynin or Allopurinol. Free Rad Res. 2014;48(10):1232‐1246. Epub 2014/07/30. 10.3109/10715762.2014.945079 [DOI] [PubMed] [Google Scholar]
- 8. Fink BD, Herlein JA, Guo DF, et al. A mitochondrial‐targeted coenzyme q analog prevents weight gain and ameliorates hepatic dysfunction in high‐fat‐fed mice. J Pharmacol Exp Ther. 2014;351(3):699‐708. Epub 2014/10/11. 10.1124/jpet.114.219329. PubMed PMID: 25301169; PubMed Central PMCID: PMCPmc4244581. [DOI] [PMC free article] [PubMed] [Google Scholar]
- 9. Imai Y, Patel HR, Doliba NM, Matschinsky FM, Tobias JW, Ahima RS. Analysis of gene expression in pancreatic islets from diet‐induced obese mice. Physiol Genomics. 2008;36(1):43‐51. Epub 2008/10/16. 10.1152/physiolgenomics.00050.2008. PubMed PMID: 18854371; PubMed Central PMCID: PMCPMC2604788. [DOI] [PMC free article] [PubMed] [Google Scholar]
- 10. Imai Y, Fink BD, Promes JA, Kulkarni CA, Kerns RJ, Sivitz WI. Effect of a mitochondrial‐targeted coenzyme Q analog on pancreatic β‐cell function and energetics in high fat fed obese mice. Pharmacol Res Perspect. 2018;6(3):e00393 Epub 2018/06/05. 10.1002/prp2.393. PubMed PMID: 29864244; PubMed Central PMCID: PMCPMC5980123. [DOI] [PMC free article] [PubMed] [Google Scholar]
- 11. Rehman H, Liu Q, Krishnasamy Y, et al. The mitochondria‐targeted antioxidant MitoQ attenuates liver fibrosis in mice. Int J Physiol Pathophysiol Pharmacol. 2016;8(1):14‐27. Epub 2016/05/18. PubMed PMID: 27186319; PubMed Central PMCID: PMCPMC4859875. [PMC free article] [PubMed] [Google Scholar]
- 12. Fink B, Coppey L, Davidson E, et al. Effect of mitoquinone (Mito‐Q) on neuropathic endpoints in an obese and type 2 diabetic rat model. Free Rad Res. 2020;54(5):311‐318. Epub 2020/04/25. 10.1080/10715762.2020.1754409. PubMed PMID: 32326763; PubMed Central PMCID: PMCPMC7329571. [DOI] [PMC free article] [PubMed] [Google Scholar]
- 13. Davidson EP, Coppey LJ, Holmes A, Dake B, Yorek MA. Effect of treatment of high fat fed/low dose streptozotocin‐diabetic rats with Ilepatril on vascular and neural complications. Eur J Pharmacol. 2011;668(3):497‐506. Epub 2011/08/06. 10.1016/j.ejphar.2011.07.016. PubMed PMID: 21816138; PubMed Central PMCID: PMCPMC3185159. [DOI] [PMC free article] [PubMed] [Google Scholar]
- 14. Fouret G, Tolika E, Lecomte J, et al. The mitochondrial‐targeted antioxidant, MitoQ, increases liver mitochondrial cardiolipin content in obesogenic diet‐fed rats. Biochim Biophys Acta. 2015;1847(10):1025‐1035. Epub 2015/06/02. 10.1016/j.bbabio.2015.05.019 [DOI] [PubMed] [Google Scholar]
- 15. Yu L, Fink BD, Sivitz WI. Simultaneous quantification of mitochondrial ATP and ROS production. Methods Mol Biol. 2015;1264:149‐159. Epub 2015/01/30. 10.1007/978-1-4939-2257-4_14 [DOI] [PubMed] [Google Scholar]
- 16. Yu L, Fink BD, Herlein JA, Sivitz WI. Mitochondrial function in diabetes: novel methodology and new insight. Diabetes. 2013;62(6):1833‐1842. Epub 2013/01/19. 10.2337/db12-1152. PubMed PMID: 23328129; PubMed Central PMCID: PMC3661643. [DOI] [PMC free article] [PubMed] [Google Scholar]
- 17. Chong J, Soufan O, Li C, et al. MetaboAnalyst 4.0: towards more transparent and integrative metabolomics analysis. Nucleic Acids Res. 2018;46(W1):W486‐W494. Epub 2018/05/16. 10.1093/nar/gky310. PubMed PMID: 29762782; PubMed Central PMCID: PMCPMC6030889. [DOI] [PMC free article] [PubMed] [Google Scholar]
- 18. Kanehisa M, Sato Y, Furumichi M, Morishima K, Tanabe M. New approach for understanding genome variations in KEGG. Nucleic Acids Res. 2019;47(D1):D590‐D595. Epub 2018/10/16. 10.1093/nar/gky962. PubMed PMID: 30321428; PubMed Central PMCID: PMCPMC6324070. [DOI] [PMC free article] [PubMed] [Google Scholar]
- 19. Skulachev VP. How to clean the dirtiest place in the cell: cationic antioxidants as intramitochondrial ROS scavengers. IUBMB Life. 2005;57(4–5):305‐310. PubMed PMID: 16036614. [DOI] [PubMed] [Google Scholar]
- 20. Leise MD, Poterucha JJ, Talwalkar JA. Drug‐induced liver injury. Mayo Clin Proc. 2014;89(1):95‐106. Epub 2014/01/07. 10.1016/j.mayocp.2013.09.016. PubMed PMID: 24388027 [DOI] [PubMed] [Google Scholar]
- 21. Lim S, Rashid MA, Jang M, et al. Mitochondria‐targeted antioxidants protect pancreatic beta‐cells against oxidative stress and improve insulin secretion in glucotoxicity and glucolipotoxicity. Cell Physiol Biochem. 2011;28(5):873‐886. Epub 2011/12/20. 10.1159/000335802 [DOI] [PubMed] [Google Scholar]
- 22. Escribano‐Lopez I, Bañuls C, Diaz‐Morales N, et al. The mitochondria‐targeted antioxidant MitoQ modulates mitochondrial function and endoplasmic reticulum stress in pancreatic β cells exposed to hyperglycaemia. Cell Physiol Biochem. 2019;52(2):186‐197. Epub 2019/03/01. 10.33594/000000013 [DOI] [PubMed] [Google Scholar]
- 23. Marín‐Royo G, Rodríguez C, Le Pape A, et al. The role of mitochondrial oxidative stress in the metabolic alterations in diet‐induced obesity in rats. FASEB J. 2019;33(11):12060‐12072. Epub 2019/08/03. 10.1096/fj.201900347RR. PubMed PMID: 31370681; PubMed Central PMCID: PMCPMC6902682. [DOI] [PMC free article] [PubMed] [Google Scholar]
- 24. Antonenko YN, Khailova LS, Knorre DA, et al. Penetrating cations enhance uncoupling activity of anionic protonophores in mitochondria. PloS One. 2013;8:e61902‐e61910. Epub 2013/04/30. 10.1371/journal.pone.0061902. PubMed PMID: 23626747; PubMed Central PMCID: PMCPMC3633956. [DOI] [PMC free article] [PubMed] [Google Scholar]
Associated Data
This section collects any data citations, data availability statements, or supplementary materials included in this article.
Supplementary Materials
Supplementary Material
Data Availability Statement
Data that support the findings of this study are available in the supplementary material of this article. Data that support the findings of this study are available from the corresponding author upon reasonable request.