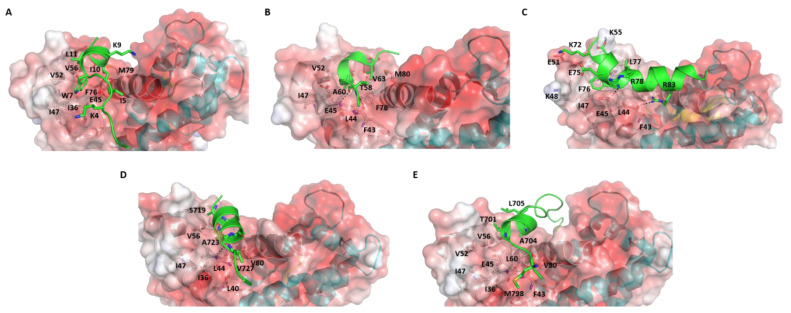
Figure 2.
Structures of S100B(ββ)-peptide complexes. Structures of S100B(ββ)—(A) TRTK12, (B) RAGE, (C) NDR, (D) RSK_PEP2 and (E) RSK_PEP1 complexes are shown. The S100B(ββ) protein dimer is shown as an electrostatic surface (red to blue colours represent electrostatic potentials ranging from −5 to +5 kcal/mol) with the two monomers coloured separately (grey, cyan). The bound peptide is shown as cartoon (green) and peptide-protein interacting residues and h-bond interactions are highlighted in sticks and dashed lines, respectively.

