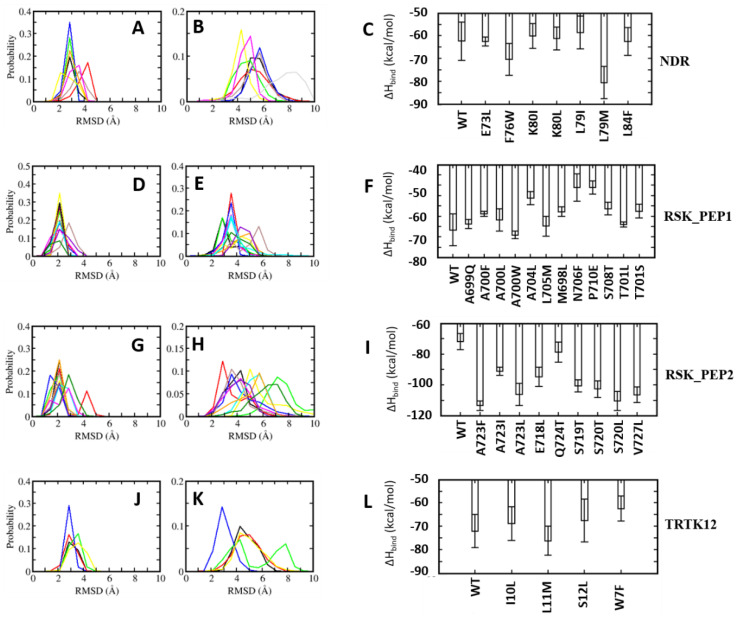
Figure 6.
Distribution of root mean square deviation (RMSD) of (A,D,G,J) S100B(ββ) and (B,E,H,K) the bound peptides ((A,B): S100B(ββ)-NDR; (D,E): S100B(ββ)-RSK_PEP1; (G,H): RSK_PEP2; (J,K): S100B(ββ)-TRTK12 complexes). Different colours correspond to the different mutations in the peptide (NDR (black: WT, red: E73L, green: F76W, blue: K80I, yellow: K80L, brown: L79I, magenta: L79M, grey: L84F), RSK_PEP1 ( black: WT, red: A699Q, green: A700F, blue: A700L, yellow: A700W, brown: A704L, magenta: L705M, orange: M698L, cyan: N706F, violet: P710E, dark green: S708T, turquoise: T701L, maroon: T701S), RSK_PEP2 (black: WT, red: A723F, green: A723I, blue: A723L, yellow: A723W, brown: E718L, cyan: Q724T, magenta: S719T, orange: S720I, violet: S720L, dark green: V727L), TRTK12 (black: WT, red: I10L, green: L11M. blue: S12L, orange: W7F)). (C,F,I,L) Binding free energies of the interactions of S100B(ββ) with each peptide were calculated with the MMPBSA approach (see Methods) using the conformations sampled during the MD simulations of the S100B(ββ)-stapled peptide complexes.

