

Abstract
Wild fruits and vegetables (WFV) are believed to contain substantial quantities of micronutrients and are commonly consumed in rural areas of developing countries endowed with natural vegetation. Previous studies that provided evidence on the contribution of WFV to household micronutrient intake in a developing country setting did not consider the effect of antinutritional factors. Therefore, applying the in vitro bioavailability assessment technique and using the Acholi subregion of Uganda a case area, this study examined the contribution of commonly consumed WFV to the pooled annual household dietary requirement for iron. Laboratory analysis showed that the concentration of antinutrients varied with plant species but the pool was dominated by phytate (10.5–150 mg/100 g) and phenolic substances (38.6–41.7 mg GAE/g). In vitro iron bioavailability varied with plant species was quantitatively higher from vegetables than fruits by 27% although total concentration of the micronutrient was higher in fruits than vegetables by 142%. Nutritional computation, taking into account, household composition, and physiological status revealed that consumption of WFV resulted in a median contribution of 1.8% (a minimum of 0.02 and a maximum of 34.7%) to the pooled annual household dietary iron requirements on the basis of bioavailable iron fraction. These results demonstrate that WFV contributes meagerly to household iron needs but may serve other dietary and non‐nutrient health purposes.
Keywords: antinutrients, household annual dietary iron requirements, iron bioavailability, wild fruits and vegetables
The contribution of wild fruits and vegetables to household micronutrient needs has not been adequately quantified in a developing country setting. Using Achali subregion of Uganda as a case area, and applying the in vitro bioavailability assessment technique, nutritional computation of household nutrient needs revealed that consumption of wild food plants contributes meagerly to household dietary iron needs.

1. INTRODUCTION
Hunger remains a major global development challenge as articulated under the 2030 sustainable development goals agenda of the United Nations (SDG number 2) (UN, 2015a). It is estimated that 9.3% of the global population (689 million people) suffer from chronic hunger with the highest prevalence occurring in food insecure developing regions of the world such as East Asia and Sub‐Saharan Africa (SSA) (FAO et al., 2017; FAO et al., 2015; Rosen et al., 2016; Godfray et al., 2010; FAO, 2019). Investment in actions that improve food security situation has been recognized as effective strategies to ameliorate hunger (Godfray et al., 2010), and a number of positive outcomes have been achieved over the last decades. A typical example is the reduction in the prevalence of food insecurity from 32.8% to 26.8% observed in SSA between 1990 and 2012 (FAO et al., 2012; Fraval et al., 2019). Despite this achievement, SSA remains the region with the highest proportion of hunger affected population globally (1 in every 5 people) (FAO, 2019).
In SSA and other developing regions of the world, food insecurity is highly associated with both macro‐ and micronutrient undernutrition (Engelbert et al., 2013; Xie et al., 2018). Among micronutrients, iron deficiency remains the most common nutritional challenge of public health importance with 43% of children under 5 years and 29% of women of reproductive age being iron deficient (Stevens et al., 2012; Baker & Greer, 2010; Dupont, 2017; Sharma & Dhandoria, 2019). Besides causing developmental consequences (e.g., stunting, impaired cognitive development, increased childhood, and maternal morbidity), iron deficiency in the context of nutrition transition may present additional deleterious health consequences when combined with obesity and other related noncommunicable chronic diseases (Eckhardt, 2006; Nazia et al., 2019).
Despite the well‐known negative health consequences associated with inadequate iron availability in the human body, intake of iron is one of the lowest among essential micronutrients in developing countries. This situation predisposes vulnerable human groups (pregnant women, children, adolescents, and the elderly) in such countries to iron deficiency health complications (Loh & Khor, 2010; Means, 2020). For instance, in Uganda, 53% of children under five are iron deficient, and 32% of women are anemic, while iron deficiency anemia accounts for 75% of all anemia during pregnancy (UBOS, 2017; Horowitz et al., 2013). Low intake of micronutrients such as iron has been found to be critical most especially among the poor segments of the population that live in rural areas in developing countries (Angeles‐Agdeppa et al., 2019; Biesalski & Black, 2016). This is notwithstanding the fact that the majority (62%) of the population in such countries live in rural areas (World Bank, 2018) and lack financial resources to access highly bioavailable iron‐rich animal source foods (Aguilar & Sumner, 2020).
Wild fruits and vegetables (WFV) are still abundantly present in rural areas of many countries in developing parts of the world (Ahmed, 2019; Bvenura & Sivakumar, 2017) and an estimated one billion people, especially those in SSA include edible WFV in their diets (Bharucha & Pretty, 2010; Cordeiro, 2012; Shumsky, 2012; Sunderland & Rowland, 2019). Uganda ranks high among African countries where households utilize WFV for human nutrition (Ojelel et al., 2019; Smith & Ezyaguirre, 2007), and the Acholi and Karamoja subregions in particular are well‐known for that nutrition behavior (Loki & Ndyomugyenyi, 2016; Okidi et al., 2018; Okori et al., 2009; Oryema et al., 2013). Consumption of WFV in these regions is largely guided by traditional ecological knowledge (Arenas & Scarpa, 2007; Pardo‐de‐Santayana et al., 2005). Economically, the significance of WFV on household nutrition lies on the fact that they are regarded as low‐input, low‐cost option for improving household nutrition and reducing the need to spend limited financial resources during incidences of crop failure, drought, or conflict‐driven famine (Fentahun & Hager, 2009; Gordon & Enfors, 2008; Jama et al., 2008; Asprilla‐Perea & Diaz‐Puente, 2019).
Information available in literature indicates that WFV, in areas where they are consumed, contribute significantly to household intake of essential micronutrients such as iron (Borelli et al., 2020; Okidi et al., 2018). This is because wild plant species have been found to be richer in micronutrients compared to the cultivated variants (Mavengahama et al., 2013). Nonetheless, the occurrence of unacceptably high prevalence of anemia among children under five (71%) and women of childbearing age (47%) in certain areas such as the Acholi subregion (UBOS, 2017) raises question on the effective contribution of WFV to household nutritional iron needs in areas where they are consumed. Previous studies that assessed the contribution of WFV to household nutrition in Acholi subregion focused on total iron without due attention to bioavailability of the nutrient (Okidi et al., 2018) and yet plant species in general contain antinutritional factors such as phytates, oxalate, tannins, and saponin that potentially reduce iron bioavailability from plant‐based foods (Mihrete, 2019; Natesh et al., 2017) thereby exposing resource constrained rural communities that rely on plant‐based foods to high risk of iron deficiency and related health complications. Using the Acholi subregion of Uganda as a microcosm for rural areas in developing countries where WFV are consumed and applying the in vitro bioavailability‐based technique and household nutritional needs computation, this study examined the contribution of WFV to household requirement for bioavailable iron. This information is necessary for planning nutritional interventions to improve micronutrient intake in areas where WFV are consumed.
2. MATERIALS AND METHODS
2.1. Study design and study area
A cross‐sectional study design that made use of primary data from the current study and secondary data from Okidi et al. (2018) was applied. Samples of WFV used for laboratory analyses as well as households that participated in nutritional contribution evaluation were drawn from Amuru and Gulu districts (Figure 1).
Figure 1.

A map showing location of study area
Primary data were collected on the level of antinutritional factors and in vitro bioavailability of iron, whereas secondary data on household consumption of WFV were obtained from Okidi et al. (2018). The two districts were purposively selected because previous studies that documented the consumption of WFV were conducted in them (Okidi et al., 2018; Oryema et al., 2013). Second, these two districts are located in Northern region of Uganda where the highest iron deficiency anemia prevalence prevails (UBOS, 2017; Obai et al., 2016; FANTA & USAID, 2010). The two districts cover a total land area of 11,732 km2, comprised of open water and swamps (180 km2), arable land (10,301 km2), national park and game reserves (982 km2), and forest covers (371 km2) (ACF, 2007).
The main agro ecological zone in the two districts is savannah grassland and characteristically experience both wet and dry seasons (Langdale‐Brown et al., 1964). The average annual rainfall received is approximately 1,500 mm. The wet season extends from April to October with peaks in May, August, and October. The dry season starts in November and lasts up to March (ACF, 2007). The main economic activity in the study area is subsistence agriculture (57.8%). Amuru and Gulu districts have a total population of 634,249 of which 291,457 and 180, 670 live in rural areas of Gulu and Amuru, respectively (Uganda Bureau of Statistics: UBOS, 2014).
2.2. Determination of levels of antinutritional factors and in vitro iron bioavailability
2.2.1. Sample collection and preparation
Samples of 16 wild fruits and vegetables reported to be mostly consumed in Amuru and Gulu districts (Okidi et al., 2018) were collected between October and December 2018 (Table 1).
Table 1.
Wild fruits and vegetables used in the study (adopted from Okidi et al. (2018))
| Wild fruits | Wild vegetables | ||
|---|---|---|---|
| Local name | Scientific name | Local name | Scientific name |
| Oywello | Vitex doniana Sweet | Gwanya | Hibiscus acetosella |
| Tugu | Borassus aethiopum Mart | Ayuyu | Acalypha bipartita |
| Oceyo | Aframomum angustifolium (Sonn.) K.Schum. | Oyado | Senna obtusifolia |
| Cwaa | Tamarindus indica L. | Otigo lum/nyim | Corchorus trilocularis |
| Kalara | Capsicum frutescens L. | Obuga lum | Amaranthus spinosus |
| Tongogwal Madito | Physalis macrantha Link | Pot kalara | Capsicum frutescens L. |
| Kano | Syzygium malaccense (L.) Merr. & L.M.Pe | Malakwang Odwonga | NA |
| Layika | Corchorus olitorius | ||
| Boo ayom/ lok | NA | ||
NA means scientific name is not available.
Three sets of samples were collected randomly from various locations in the two study districts. For each set, approximately 1,500 g of fresh samples of each of the WFV species under investigation was collected. Samples were transported and stored in the refrigerator at 4°C till used. Fruit samples were washed with clean tap water and depulped. The fresh pulps were then oven‐dried at 45°C for 72 hr as described by Okullo et al. (2010) and ground to fine powder using an electric grinder (Brooks Crompton Series 2000, Bradford, UK). For vegetable samples, leaves were picked from stems, washed with tap water, rinsed, oven‐dried, and ground using the same electric grinder already stipulated with cleaning in between samples. Ground samples of each fruit and vegetable species were packed in airtight high‐density poly ethylene (HDPE) for laboratory analyses.
2.2.2. Determination of antinutritional factors
The antinutritional factors considered in this study were phytate, oxalate, tannins, saponin, and total phenols. These antinutritional factors were chosen because of their potential to bind and interfere with bioavailability of iron from plant‐based foods (Natesh et al., 2017). Phytate was determined using high‐performance liquid chromatography (HPLC) procedure previously developed by Lehrfeld (1987). The HPLC equipment used was HPLC‐8100 (Spectra‐physics, San Jose, USA) coupled to SP8440 UV‐vis detector (Beckman instruments, California, USA). For specific separation of phytate, a PRP‐1 5Nm (150 × 4.1 mm) reverse‐phase analytical column was used. The mobile phase consisted of methanol–formic acid solution (1:1.2 ratio). Oxalate content of samples was determined using an enzymatic spectrophotometric method as previously applied by Milardovic et al. (2000). The enzymes were obtained from Boehringer (Mannheim, Germany). The spectrophotometer used was Spectrod 2000 (Jena, Mannheim, Germany). Measurements (absorbance) were performed at 340 nm. Tannin was analyzed using the spectrophotometric method that applies the Folin–Denis reagent for color development (Schanderi, 1970). The spectrophotometer used for oxalate detection was also applied except that absorbance measurements were performed at 700 nm. The content of tannin was expressed as a percentage. Saponin was determined using the weight difference method previously used by Obadoni and Ochuko (2002) and as slightly modified by Rout and Basak (2015). All the reagents used (ethanol, n‐butanol, and sodium chloride) were of analytical grade and obtained from BDH (BDH, Kampala, Uganda). Total phenols were determined using the Folin–Ciocalteu spectrophotometric assay method as previously described by Marinova et al. (2005). Measurements of absorbance were performed at 750 nm using the same spectrophotometer model used for oxalate and tannin quantification. All reagents used (Na2CO3, Folin–Ciocalteu's phenols) were also of analytical grade and obtained from BDH. The total phenolic content was expressed as mg gallic acid equivalents (GAE)/g dry weight. All analyses were performed in duplicates.
2.2.3. Determination of in vitro bioavailability of iron
Before bioavailability could be assessed, total iron concentration in the samples had to be determined. This was achieved using the flame atomic absorption spectrophotometer (FAAS) (Analytik Jena, Überlingen, Germany) according to Association of Official Analytical Chemists (AOAC) method number 985.35 (AOAC, 2006). Standards for development of standard curve were AAS grade chemicals (Merck, Malaysia), while other reagents (HCl, LiCl) were of analytical grade and obtained from BDH. Absorbance measurements were performed at 450 nm. Following the determination of total iron content, bioavailability of the micronutrient was determined using in vitro dialysability method. This method determines the fraction of dialysable iron following sequential digestion of the sample in simulated gastric and pancreatic medium (Luten et al., 1996). Digestive enzymes consisting of pepsin and pancreatin and bile salts were obtained from Sigma (St Louis, MO, USA). Pepsin solution was prepared by dissolving 16 g of pepsin (P‐7000, from porcine stomach mucosa) in 100 ml of 0.1M HCl. Pancreatin solution containing 4 g of pancreatin (P‐1750, from porcine pancreas) and 25 g of bile extract (B‐8631, porcine) with 1,000 ml of 0.1M NaHCO3 were used. Both the pancreatic and gastric processes were performed according to Chiocchetti et al. (2018). The only modification was that for pancreatic digestion, a segment of dialysis tubing (Ø = 20.4 mm; MMCO of 10k Da; Sigma‐Aldrich, Malaysia) containing NaHCO3 (an amount equivalent to the moles of NaOH needed for the pancreatic digestion) was used.
2.3. Determination of the contribution of bioavailable iron to household iron requirements
To determine the contribution of bioavailable iron from WFV to the annual household iron requirements, a three‐stage process was followed. First, RDAs for the micronutrient for healthy members in the age groups of 7–12 months, 1–3 years, 4–8 years, 9–13 years, 14–18 years, 19–30 years, 31–50 years, 51–70 years, and >70 years segregated by physiological status in terms of pregnancy or lactation (age groups of 14–18 years, 19–30 years, 31–50 years) and sex (male or female) in a given household were aggregated for a day and converted to annual requirement (365 days) as previously reported by Okidi et al. (2018). The RDA reference for the United States of America and Canadian population first published by Institute of Medicine (2001) and later adopted by Brown et al. (2011) was used. This RDA reference has been applied before in other studies conducted in Uganda (Isabirye et al., 2020; Okidi et al., 2018). Second, secondary data on the aggregated annual consumption levels of various WFV species (quantities in grams) by each household that participated in a previous study (Okidi et al., 2018) and primary data on iron content and bioavailability levels determined in the current study were used to derive the quantity of bioavailable iron consumed by each household over a one‐year period. Third, the contribution of bioavailable iron from WFV to the pooled annual household dietary requirement for iron was computed as a fraction (proportion) of the expected pooled annual household RDA for the nutrient.
2.4. Data analysis
Data were analyzed using IBM Statistical Package for the Social Sciences (SPSS) software version 22.0. Kolmogorov–Smirnov and Shapiro–Wilk tests were performed to check for normality of data for various aspects. Normality tests revealed that data on levels of antinutritional factors, levels of total iron, and levels of bioavailability of iron were normally distributed. However, data on percentage contribution of WFV to the pooled household annual RDA for the micronutrient were not normally distributed. On this basis, differences in the level of each antinutritional factor, total iron, and bioavailable iron among fruits or vegetables species studied were determined using one‐way analysis of variance (ANOVA). Means were separated using Tukey's honestly significant difference (HSD) test. Pooled antinutritional factor content, total iron, and bioavailable iron between fruits and vegetables were compared using independent sample t test. Finally, the contribution of WFV to the pooled annual RDA for iron among households in the study area was estimated by calculating the median of the percentage contribution attained for the sample size of 192 households that were involved in the study. For all statistical analysis, the level of significance was fixed at 5%.
3. RESULTS
3.1. Levels of antinutritional factors in wild Fruits and Vegetables
Table 2 presents the levels of antinutritional factors in various wild fruits studied. Generally, the contents of antinutritional factors were dependent on fruit species and the specific antinutritional factor in question. All fruits had tannin contents less than 1% and in some cases not detectable, except in Capsicum frutescens which was above that level by approximately 0.6%. The contents of phytate in the fruits ranged from 2.36 to 17.26 mg/100 g, with most of them having at least 10 mg/100 g except for Borassus aethiopum, Aframomum angustifolium, and Physalis macrantha.
Table 2.
Concentration of antinutritional factors in wild fruits
| Fruit | Tannins (%) | Phytate (mg/100 g) | Oxalates (%) | Saponin (%) | Total phenolics (mg GAE.g−1) |
|---|---|---|---|---|---|
| Oywello (Vitex domiana Sweet) | 0.21 ± 0.03cb | 17.26 ± 2.52a | 0.31 ± 0.03b | 0.27 ± 0.10cb | 15.60 ± 0.71c |
| Oceyo (Aframomum angustifolium/Sonn.) | 0.36 ± 0.11b | 5.18 ± 0.20c | 1.18 ± 0.06a | 0.34 ± 0.12cb | 44.92 ± 1.63ba |
| Kalara (Capsicum frutescens L.) | 1.59 ± 0.27a | 10.30 ± 0.86ba | 0.21 ± 0.04c | 5.51 ± 1.71a | 56.41 ± 1.58a |
| Tongongwal Madito (Physalis macrantha Link) | 0.00 ± 0.00c | 5.83 ± 0.81b | 0.00 ± 0.00d | 1.19 ± 0.26b | 30.77 ± 0.69cb |
| Kano (Syzygium malaccense L./Merr. & L.M.Pe) | 0.26 ± 0.08a | 17.26 ± 7.11a | 0.00 ± 0.00d | 0.02 ± 0.00cb | 52.20 ± 1.18ba |
| Cwa (Tamarindus indica L.) | 0.04 ± 0.02c | 15.41 ± 1.46a | 0.04 ± 0.01d | 0.03 ± 0.01cb | 60.30 ± 1.45a |
| Tugu (Borassus aethiopum Mart) | 0.00 ± 0.00c | 2.36 ± 0.00c | 0.00 ± 0.00d | 0.00 ± 0.00c | 9.93 ± 1.65c |
Values indicate mean ± SD (n = 6). Each plant material was collected from three different locations and analyzed in duplicates. Values with different superscripts in the same column are significantly different (p < .05).
There was some clustering of fruit species in terms of the levels of the antinutritional factors. The levels of phytates were the same in Vitex doniana, Syzygium malaccense, and Tamarindus indica (cluster 1), Physalis macrantha and Capsicum frutescens (cluster 2), and Borassus aethiopum and Aframomum angustifolium (cluster 3). Among all the fruits examined, oxalates were detected only in Aframomum angustifolium, Vitex doniana, and Capsicum frutescens. In species where detection occurred, the concentration of oxalate ranged from 0.21% to 1.18%, with the highest concentration found in Aframomum angustifolium, followed by Vitex doniana, and least in Capsicum frutescens in decreasing order of magnitude. Saponin content of all the fruits examined was less than 1% except in Capsicum frutescens and Physalis macrantha which had levels above one but less than 7%. The total phenolic content of the fruits ranged from 9.93 to 60.30 mg GAE.g−1. However, most (71%) of them had total phenolic concentration above 30 mg GAE.g−1. The highest total phenolic content was detected in Tamarindus indica, followed by Capsicum frutescens, and Syzygium malaccense in decreasing order of magnitude.
The concentrations of antinutritional factors in wild vegetables investigated are presented in Table 3. As was observed for wild fruits, in this case, the contents of antinutritional factors also varied across the vegetable species and specific antinutritional factors. For antinutritional factors whose contents were expressed in percentage points (tannins, oxalates, and saponin), their levels in the plants were generally less than 1% and were observed in 78, 89, and 56% of the vegetables examined for tannins, oxalates, and saponin, respectively. Among the three antinutritional factors, saponin was the most widely distributed and the highest concentration was detected in Amaranthus spinosus at a level of about 10 times above other vegetable species. Phytate was detected in all the vegetable species examined with concentration ranging from 75.7 to 227 mg/100 g depending on the vegetable species. At least half of the vegetable species examined had phytate at concentration above 150 mg/100 g. For those vegetable species that had phytate concentration above 150 mg/100 g, the highest concentration was detected in Corchorus trilocularis (227 mg/100 g), Hibiscus acetosella (218.52 mg/100 g), Corchorus olitorius (217.45 mg/100 g), Acalypha bipartita (188.45 mg/100 g), and Malakwang odwonga (173.62 mg/100 g) in decreasing order of magnitude. Total phenolics were also detected in all the vegetable species examined. The levels varied with the vegetable species and ranged from 14 to 66 mg GAE.g−1.
Table 3.
Concentration of antinutritional factors in wild vegetables
| Vegetables | Tannins (%) | Phytate (mg/100g) | Oxalates (%) | Saponin (%) | Total phenolics (mg GAE.g−1) |
|---|---|---|---|---|---|
| Oyado (Senna obtusifolia) | 4.28 ± 0.43a | 83.30 ± 2.30c | 0.18 ± 0.03b | 2.11 ± 0.27b | 38.19 ± 1.86cd |
| Pot kalara (Capsicum frutescens L.) | 1.53 ± 0.10b | 75.66 ± 1.56c | 0.22 ± 0.02b | 1.58 ± 0.37b | 31.58 ± 2.81d |
| Otigo lum/nyim (Corchorus trilocularis) | 0.39 ± 0.03c | 226.96 ± 2.60a | 0.02 ± 0.00c | 0.38 ± 0.06b | 65.76 ± 1.91a |
| Ayuyu (Acalypha bipartita) | 0.23 ± 0.01c | 188.45 ± 4.62ab | 0.13 ± 0.00bc | 0.23 ± 0.06b | 58.07 ± 1.54ab |
| Gwanya (Hibiscus acetosella) | 0.14 ± 0.03c | 218.52 ± 4.45a | 0.20 ± 0.03b | 1.98 ± 0.51b | 44.71 ± 0.87bcd |
| Obuga lum (Amaranthus spinosus) | 0.05 ± 3.23c | 94.06 ± 2.16c | 1.08 ± 0.17a | 15.55 ± 0.91a | 40.06 ± 2.81cd |
| Layika (Corchorus olitorius) | 0.02 ± 0.00c | 217.45 ± 6.00a | 0.01 ± 0.00c | 0.10 ± 0.08b | 52.05 ± 1.57abc |
| Boo ayom/ lok (NA) | 0.00 ± 0.00c | 79.67 ± 1.72c | 0.12 ± 0.02bc | 0.00 ± 00b | 14.38 ± 0.55e |
| Malakwang Odwonga (NA) | 0.00 ± 0.00c | 173.62 ± 2.70b | 0.15 ± 0.04bc | 0.00 ± 00b | 30.40 ± 0.68d |
Values indicate mean ± SD (n = 6). Each plant material was collected from three different locations and analyzed in duplicates. Values with different superscripts in the same column are significantly different (p < .05). NA means scientific name is not available.
Comparison of pooled concentration of specific antinutritional factors between wild fruits and vegetables is presented in Table 4. Generally, the levels of all antinutritional factors were not different between fruits and vegetables except phytate which was higher in vegetables than fruits by a factor of 14.
Table 4.
Comparison of pooled concentration of antinutritional factors between wild fruits and vegetables
| Antinutritional factors | Fruits | Vegetables | p‐value |
|---|---|---|---|
| Tannin (%) | 0.35 ± 0.03 | 0.74 ± 0.04 | .09 |
| Phytate (mg/100 g) | 10.51 ± 2.46 | 150.86 ± 6.27 | .00 |
| Oxalate (%) | 0.25 ± 0.04 | 0.23 ± 0.01 | .85 |
| Saponin (%) | 1.05 ± 0.04 | 2.43 ± 0.19 | .09 |
| Total phenolics (mg GAE.g−1) | 38.59 ± 2.08 | 41.69 ± 1.50 | .43 |
Values indicate mean ± SD (n = 54 for vegetables, n = 42 for fruits).
3.2. Bioavailability of Iron from wild Fruits and Vegetables
With regard to fruits, generally, the concentration of total iron varied with the plant species and ranged from 0.81 to 5.97 mg/100 g (Table 5). All fruits except those from Borassus aethiopum and Physalis macrantha had iron content above 2 mg/100 g. Specifically, Capsicum frutescens and Vitex doniana had the highest level of iron, followed by Aframomum angustifolium, Tamarindus indica, Syzygium malaccense, Physalis macrantha, and Borassus aethiopum in decreasing order of magnitude. Bioavailability of iron from fruits was also dependent on the plant species and ranged from 2.7% to 23%. The degree of bioavailability was not corresponding to the level of total iron in the fruit but randomly distributed. Nevertheless, bioavailability was highest in fruits of Capsicum frutescens (22.91%), followed by Vitex doniana (17.93%), Syzygium malaccense (15.61%), and Aframomum angustifolium (15.14%), while the rest had bioavailability levels below 5%.
Table 5.
Concentration and bioavailability status of iron from wild fruits and vegetables
| Wild fruits | Wild vegetables | ||||
|---|---|---|---|---|---|
| Total iron (mg/100 g) | Bioavailability (%) | Total iron (mg/100 g) | Bioavailability (%) | ||
| Oywello (Vitex doniana Sweet) | 5.16 ± 0.61a | 17.93 ± 3.14b | Gwanya (Hibiscus acetosella) | 0.49 ± 0.04c | 9.80 ± 0.530ed |
| Oceyo (Aframomum angustifolium/Sonn.) | 3.88 ± 0.40b | 15.14 ± 2.81b | Obuga lum (Amaranthus spinosus) | 1.06 ± 0.03c | 22.65 ± 3.23b |
| Kalara (Capsicum frutescens L.) | 5.97 ± 1.01a | 22.91 ± 2.49a | Oyado (Senna obtusifolia) | 2.35 ± 0.40b | 10.15 ± 1.43ed |
| Tongogwal Madito (Physalis macrantha Link) | 0.99 ± 0.08d | 2.65 ± 0.08c | Pot kalara (Capsicum frutescens L.) | 0.25 ± 0.01c | 6.15 ± 1.10e |
| Kano (Syzygium malaccense L./Merr. & L.M.Pe) | 2.15 ± 0.16c | 15.61 ± 3.02b | Otigo lum/nyim (Corchorus trilocularis) | 5.67 ± 1.25a | 18.37 ± 0.80cb |
| Cwa (Tamarindus indica L.) | 2.99 ± 0.13cb | 4.09 ± 0.11c | Malakwang Odwonga (NA) | 0.26 ± 0.01c | 12.36 ± 1.15d |
| Tugu (Borassus aethiopum Mart) | 0.81 ± 0.01d | 3.56 ± 0.68c | Boo ayom (NA) | 0.25 ± 0.02c | 12.51 ± 2.16d |
| Layika (Corchorus olitorius) | 0.94 ± 0.01c | 27.65 ± 1.72a | |||
| Ayuyu (Acalypha bipartita) | 0.25 ± 0.02c | 13.83 ± 0.93cd | |||
Values indicate mean ± SD (n = 6). Each plant material was collected from three different locations and analyzed in duplicates. Values with different superscripts in the same column are significantly different (p < .05). NA means scientific name is not available.
In the case of vegetables, iron was detected in all the vegetable species investigated (Table 5). As was the case for fruits, iron content in vegetables was also dependent on plant species and ranged from 0.25 to 5.7 mg/100 g. Iron content was generally below 1% and at the same level on average (p > .05) except for Corchorus trilocularis, Senna obtusifolia, and Amaranthus spinosus. In situation where iron content was above 1%, the highest concentration was detected in Corchorus trilocularis, followed by Senna obtusifolia, and Amaranthus spinosus in decreasing order of magnitude. Iron bioavailability among vegetables varied between 6.15% and 27.65%. Iron bioavailability among vegetables was highest and least in Corchorus olitorius and Capsicum frutescens, respectively. Estimated 78% of the vegetables studied contained biologically available iron above 10%. As observed in the case of fruits, the degree of bioavailability of iron was not concomitant with the level of total iron. Pooled concentration of total iron and iron bioavailability in fruits or vegetables is presented in Table 6. Generally, iron was more abundant in fruits than in vegetables by a factor of about 2 (p < .05). However, iron was more bioavailable in vegetables than in fruits by approximately 3.2% (p < .05).
Table 6.
Pooled concentration and bioavailability of iron from wild fruits and vegetables
| Parameter | Fruits | Vegetables | p‐value |
|---|---|---|---|
| Total iron (mg/100 g) | 3.14 ± 0.15 | 1.30 ± 0.04 | .00 |
| Iron bioavailability (%) | 11.69 ± 1.03 | 14.86 ± 1.88 | .04 |
Values indicate mean ± SD (n = 42 for fruits, n = 54 for vegetables).
3.3. Contribution of bioavailable iron by wild fruits and vegetables to household iron requirements
The distribution of the level of intake of total iron, bioavailable iron from wild fruits against the expected annual pooled household RDA for iron as stipulated under section 2.3 among households (192) that participated in the study is presented in Figure 2.
Figure 2.

Total and biologically available iron derived from wild fruits. RDA indicates the annual pooled value for the household from members aged 7–12 months, 1–3 years, 4–8 years, 9–13 years, 14–18 years, 19–30 years, 31–50 years, 51–70 years, and >70 years
Generally, for most of the households, intake of total and bioavailable iron from wild fruits was all below the pooled annual household RDA. In terms of total iron, the median contribution of wild fruits to the pooled annual household RDA was 7.6% (a minimum of 0.04 and a maximum of 118%). On the other hand, in terms of bioavailable iron, wild fruits had a median contribution of 0.8% (a minimum of 0.00 and a maximum of 19.5%) to the pooled annual RDA among households. Approximately 3.6% of the households had the contribution from wild fruits at or above the pooled annual RDA for iron on the basis of total iron. However, none of the households had contribution from wild fruits matching the pooled annual RDA for the micronutrient in terms of the bioavailable fraction.
Distribution of the level of total and bioavailable iron from wild vegetables matched against the expected pooled annual RDA among households (192) that participated in the study is presented in Figure 3. As was observed in the case of fruits, for the case of vegetables, majority of households had the pooled annual RDA above total and bioavailable iron derived from wild vegetables.
Figure 3.
Total and biologically available iron derived from wild vegetables. RDA indicates the annual pooled value for the household from members aged 7–12 months, 1–3 years, 4–8 years, 9–13 years, 14–18 years, 19–30 years, 31–50 years, 51–70 years, and >70 years
Generally, in terms of total iron intake, 4.3% of the households had the contribution from wild vegetables matching the pooled annual RDA for the micronutrient. The wild vegetables studied had a median contribution of 4.6% (a minimum of 0.05 and a maximum of 144%) to the pooled annual RDA among households on the basis of total iron. In terms of bioavailable iron, a median contribution of 0.60% (minimum of 0.00 and a maximum of 18.8%) to the pooled annual RDA was achieved among households through consumption of wild vegetables. However, none of the households had contribution from wild vegetables matching the pooled annual RDA for iron in terms of the bioavailable fraction.
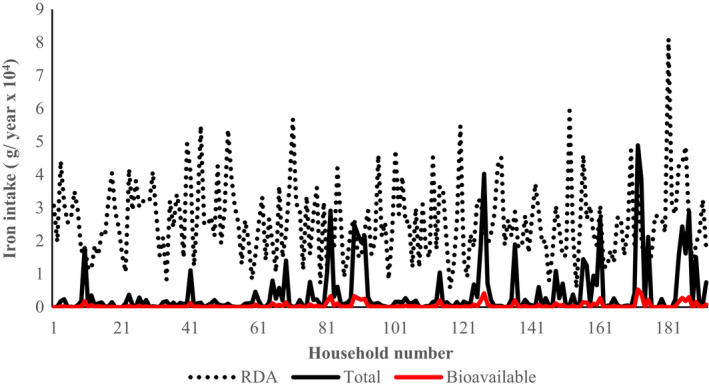
The distribution of the level of pooled intake of total and bioavailable iron from WFV in comparison to the annual pooled RDA among households (192) that participated in the study is presented in Figure 4. In general, majority of the households (91%) had total iron intake from WFV below the pooled annual RDA, while none of the households had contribution from the same matching the pooled annual RDA in terms of bioavailable iron. Nonetheless, WFV had a median contribution of 14.9% (a minimum of 0.11 and a maximum of 150.2%) and 1.8% (a minimum of 0.02 and a maximum of 34.7%) to the pooled annual RDA for total and bioavailable iron, respectively, among households.
Figure 4.

Total and biologically available iron derived from wild fruits and vegetables. RDA indicates the annual pooled value for the household from members aged 7–12 months, 1–3 years, 4–8 years, 9–13 years, 14–18 years, 19–30 years, 31–50 years, 51–70 years, and >70 years
4. DISCUSSION
In the current study, the levels of antinutritional factors in WFV commonly consumed in Acholi subregion of Uganda were examined (Table 1). It is apparent that the concentration of the antinutritional factors varied with plant species as well as the antinutritional factor under consideration (Table 2 and 3). This observation is not peculiar to this study but has also been reported in previous studies conducted elsewhere (Agbaire & Emoyan, 2012; Rout & Basak, 2015). Comparing the results of this study with the findings from other studies reveals two interesting scenarios. First, the tannin, oxalate, and saponin contents of the wild food plants investigated being less than 1% as revealed by the study concurs with the findings on wild food plants reported in previous studies conducted in Kolhapur and Odisha districts of India and Benue, Oyo, Osum, and Abeokuta states of Nigeria, respectively (Rathod & Valvi, 2011; Rout & Basak, 2015; Anhwange et al., 2015; Ajala, 2009; Bello et al., 2008; Adeboye & Babajide, 2007). Second, there is a contrasting scenario with respect to the content of phytate and oxalate in the sense that while Rout and Basak (2015) reported similar tannin and saponin content as is the case with the present study, the content of both phytate and oxalate was greater than the levels reported in the present study. Similarity between the results of the current study and that of Rout and Basak (2015) with respect to particular antinutritional factors but not all of them can be attributed to random variation of plant components among different plant species (Chattoo et al., 2011; Schuldt et al., 2019). This fact can be justified by the work of Rathod and Valvi (2011) which showed similar tannin and oxalate contents but not saponin content with that recorded in the present study.
The levels of oxalate, tannin, and saponin in WFV species detected in the current study are comparable to those reported for conventional plant species such as Pumpkins (Cucurbita spp.), Spinach (Spinacia oleracea), Okra (Abelmoschus esculentus), and Chick peas (Cicer arietinum) (Nwogwugwu et al., 2016; Sinha & Khare, 2017). This observation challenges the common belief that WFV contain higher contents of antinutritional factors than the domesticated variants (Natesh et al., 2017). Comparing the pooled content of each antinutritional factor between fruits and vegetables indicates identical levels except phytate which was significantly higher in vegetables than in fruits (Table 4). This suggests that wild vegetables would provide less bioavailable iron due to the high content of the phytate, a principal antinutritional factor that binds iron (Natesh et al., 2017). A critical look at individual wild vegetables studied revealed that Corchorus trilocularis, Hibiscus acetosella, Corchorus olitorius, Acalypha bipartita, and Malakwang Odwonga had much higher content of phytate. This suggests that diets consisting of them would dramatically reduce iron utilization.
Bioavailability is one of the critical factors important in ascertaining nutrient intake adequacy from a given diet (Delimont et al., 2017; Rousseau et al., 2019). Whereas wild food plants are reported to be essential for micronutrient nutrition among disadvantaged communities in developing countries, understanding the status of bioavailability of micronutrients from wild food plant resources such as those consumed in Acholi subregion of Uganda is necessary to provide indications on what households derive from them. With specific reference to iron, competitive nutrient absorption studies indicate that several other nonessential metals (e.g., Pb2+ and Cd2+) share iron intestinal absorption pathway, a factor which makes understanding its availability for absorption critical (Chijioke et al., 2019; Meltzer et al., 2010).
The results of this study have revealed that bioavailability of iron was dependent on plant species (Table 5). This variation can be attributed to differences in the composition of antinutritional factors and their respective levels in various plant species investigated (Table 2 and 3). Average iron absorption from heme food sources such as meat range from 15% to 35%. However, it varies from 40% during iron deficiency to 10% during iron repletion (Hurrell & Egli, 2010). On the other hand, for plant‐based diets iron bioavailability can be as low as 5%–12% (Hurrell & Egli, 2010; Blanco‐Rojo & Vanquero, 2018). This low level of iron bioavailability from plant‐based diets expose resource constrained households especially those in rural areas of developing countries to persistent iron deficiency and related complications.
There is sufficient evidence to suggest that antinutritional factors in plant‐based foods contribute to low iron bioavailability (Biesalski & Black, 2016; Natesh et al., 2017; Welch & Graham, 2009). Among antinutritional factors that lower iron bioavailability, the most cited include tannins, phytate, oxalate, saponin, and total phenolics that were all considered in the present study (Table 2). The present study recorded iron bioavailability of 11.7% from fruits and 14.8% from vegetables (Table 6). These values are supported by the work of Scheers et al. (2015), but lower than the values reported by Chiocchetti et al. (2018) for pumpkin peels (20% bioavailability). The lower bioavailability observed in the present study can be attributed to higher antinutritional factors content especially phytate and total phenolics which were greater in plant species used in the present study (Table 2 and 3) than reported in previous studies (Banjari et al., 2013; Ajala, 2009; Ndlovu & Afolayan, 2008; Adeboye & Babajide, 2007; Castro‐ Alba et al., 2019). This further justifies the rationale for the current study thus signifying limited application of literature information when evaluating nutritional efficacy of wild food plants among studies conducted in different geographical locations.
Other nutritional‐related studies have revealed that addition of certain fruits or vegetables containing ascorbic acid to a meal may double or even triple the absorption of iron depending on the amount of ascorbic acid present (Wanling et al., 2019). This suggests that beside the levels of antinutritional factors in the studied fruits and vegetables, the levels of ascorbic acid in individual fruit and/or vegetable may have contributed to the variation in iron bioavailability. However, ascorbic acid levels were not considered in the present study. Future studies should consider ascorbic acid levels in wild fruits and vegetables to better understand the contribution of antinutritional factors alone to bioavailability of iron.
On the other hand, it has been shown that bioavailability of nonheme iron (in terms of absorption) such as those found in plant foods increases in the presence of heme iron (Kumar et al., 2020; Young et al., 2018). This implies that consumption of food groups that contain heme iron such as meat together with WFV could potentially increase bioavailability of iron from them. However, an important question that has largely remained unanswered is the quantity of heme iron food group that is required to substantially improve bioavailability of nonheme iron from plant foods. This question is important considering the fact that heme iron food sources such as meat are rather expensive and are only limitedly affordable by economically disadvantaged households that are major consumers of wild food resources (Asprilla‐Perea & Diaz‐Puente, 2019; Zulu et al., 2019).
It was noted that whereas wild fruits had more iron than the vegetable species, iron bioavailability was higher in vegetables than in fruits (Table 6). This observation is not peculiar to the current study. Previous studies have shown that bioavailability of iron decreased with increase in the concentration of iron in plant foods (Hurrel & Egli, 2010) ostensibly due to higher contents of antinutritional factors (Natesh et al., 2017; Acipa et al., 2013). From a nutritional point of view, nutrients in any food source are useful to the body if they can be utilized by the cells and tissues to support body functions (Moughan, 2018). Whereas nutrient bioavailability is a proximate indicator of the nutritional value of a food source to the human body (Baree et al., 2018), knowledge of bioavailability alone may not be adequate to construe nutrient adequacy at household level, unless meaningfully translated to reflect RDA of household members. Indeed, in this study, the fraction of total iron in WFV available for metabolism over a one‐year period was assessed. Contrary to the general belief that wild food plants are essential to households’ nutrition among rural households in developing country setting such as the Acholi subregion of Uganda (Okidi et al., 2018), the contribution of bioavailable iron to household annual RDA was very marginal (Figure 4). This indicates that wild food plants cannot be relied upon to support iron needs of households in a developing country setting such as the Acholi subregion of Uganda. Despite this limitation, it is important to appreciate that wild food plants contain other nutrients such as vitamin A (in the form of provitamin, β‐carotene) for which bioavailability is not constrained by antinutritional factors. Therefore, the limited nutritional value of WFV in terms of iron should not limit households from consuming them.
From a nutritional point of view, it is well known that no food type contains all nutrients in adequate quantities but nutrient complementarity can be achieved through diet composites derived from various food sources. This is indeed the fundamental basis for emphasis on dietary diversity (Alowo et al., 2018). Therefore, households should be encouraged to include other high iron‐bioavailable food sources such as meat in the diet. Relatedly, whereas dietary diversity is believed to be a good indicator of diet adequacy (Alowo et al., 2018), information on optimal combination of food types to ensure diet adequacy for micronutrients of public health importance such as iron, vitamin A, and zinc for use by economically disadvantaged households in developing countries such as those in Acholi subregion of Uganda is largely lacking. This is a potential subject for future research.
In looking at these results, it should be appreciated that calculation of the contribution of bioavailable iron from WFV to household RDA did not take into account processing methods (practiced in Acholi subregion such as sun drying, boiling, and sun drying, and salting and sun drying) that can improve bioavailability of iron from plant foods (Bighaghire, 2019). Thus, the abysmal contribution observed in the current study may be an underestimation. Future studies should evaluate the effect of those processing methods on iron bioavailability from WFV. When segregated botanically, the contribution of bioavailable iron to household RDA was below 2% for both fruits and vegetables although contribution in terms of total iron intake was more for fruits than vegetables by a difference of 13.3%. This observation is not surprising because iron from fruits was less bioavailable than from vegetables (Table 6).
Generally, majority of rural households such as those living in Acholi subregion of Uganda depend mostly on plant‐based foods for which bioavailability of iron and other essential micronutrients such as zinc is largely constrained by the presence of antinutritional factors (Biesalski & Black, 2016). Okidi et al. (2018) reported that WFV contributed adequately to household iron requirement in Acholi subregion on the basis of total iron content of the wild food plants. An important argument that formed the basis of the current study was that contribution based on total iron content of wild food plants would be an overestimation because plant foods contain antinutritional factors that reduce bioavailability of iron. Indeed, at least at in vitro scale the results concur with the initial argument. On the other hand, the level of contribution based on total iron content of the plant foods investigated is far much lower than what was reported by Okidi et al. (2018). The differences could be attributed to the fact that Okidi et al. (2018) used literature values for iron, disregarding the fact that iron content of foods is critically dependent on geographical location with varying soil and climatic conditions (Abdelgawad et al., 2014; Kumar & Sangwan, 2019; Uusiku et al., 2010). This indicates that literature values did not reflect real iron contents of the WFV in Acholi subregion of Uganda.
On the other hand, it should be noted that fruits and vegetables also contain bioactive compounds that are essential for human health. The health promoting effects of fruits and vegetables are believed to be due to two main factors: (a) their contents of natural dietary phytochemicals (Liu, 2013) which can potentially reduce the chances of occurrence of noncommunicable diseases such as hypertension and diabetes (Tsuda, 2016; Marrelli et al., 2014; Koss‐Mikołajczyk et al., 2019) and (b) their high content of water and low metabolizable energy levels which can retard the development of conditions that exacerbate the occurrence of noncommunicable diseases such as high body weight and high blood sugar accumulation (Marrelli et al., 2014; Koss‐Mikołajczyk et al., 2019). Thus, because of these health benefits, the World Health Organization recommends daily consumption of at least 400 g of fruits and vegetables or five servings per day (FAO & WHO, 2004). Therefore, despite the abysmal contribution of wild fruits and vegetables to household iron needs, their consumption should be encouraged because of the afore‐stated health benefits. This is particularly important during lean seasons when other cultivated plant food sources are only limitedly available (Aberoumand & Deokule, 2009; Agea et al., 2011).
This study encountered two limitations. First, nutrient interactions are one of the factors that interfere with iron bioavailability. However, this study did not assess the effect of nutrient interaction on iron bioavailability. Future studies should design methods that allow examination of the contribution of antinutritional factors and other nutrients to iron bioavailability separately. Second, this study used secondary data built on the assumption that food distribution in households is in accordance with individual household member food needs which may not be the case. Therefore, nutrient adequacy determined based on pooled household estimate may not reflect the intrahousehold nutrient adequacy.
5. CONCLUSIONS
This study has demonstrated that the pool of antinutritional factors in wild food plants in Acholi subregion is dominated by phytate and total phenolics, while bioavailability of iron is higher from wild vegetables than from wild fruits despite the later having higher content of iron than the former. Taking into consideration the limitations of this study, the contribution of bioavailable iron to household annual requirement for the micronutrient was very marginal. Thus, wild fruits and vegetables alone cannot be relied upon to guarantee adequate intake of iron among rural households in Acholi subregion of Uganda. Future studies should consider establishing optimal food combinations that can enhance uptake of iron from WFV, the effect of bioenhancers such as vitamin C and nutrient interaction on bioavailability of iron from wild food plants as well as the effect of traditional processing methods on levels of antinutritional factors, bioavailability, and annual intake of bioavailable iron at individual household member level.
CONFLICT OF INTEREST
The authors declare no conflict of interest.
ETHICAL APPROVAL
Ethical clearance was obtained from Gulu University Research Ethics Committee (Approval number: GUREC‐079–18). Permission from Chief Administrative Officers was also sought before data collection in the respective districts. Last but not least, informed consent of residents who helped in the identification and collection of study samples was obtained prior to sample collection.
ACKNOWLEDGMENTS
The authors are grateful to local leaders of Gulu and Amuru districts, research assistants, and rural communities in the two districts for their active participation in the study. We extend our appreciation to the Regional Universities Forum for Capacity Building in Agriculture (RUFORUM) for funding the research work (Grant number: RU/2017/NG‐MCF‐01). RUFORUM had no role in the design, analysis, or writing of this article.
Tuyizere JD, Okidi L, Elolu S, Ongeng D. In vitro bioavailability‐based assessment of the contribution of wild fruits and vegetables to household dietary iron requirements among rural households in a developing country setting: The case of Acholi Subregion of Uganda. Food Sci Nutr. 2021;9:625–638. 10.1002/fsn3.1977
DATA AVAILABILITY STATEMENT
Data that support the findings of this study are available from the corresponding author upon reasonable request.
REFERENCES
- FAO & WHO . (2004). Expert Consultation on Human Vitamin and Mineral Requirements, Vitamin and mineral requirements in human nutrition: Report of joint FAO/WHO expert consolation; p. 341. [Google Scholar]
- ACF . (2007). Nutritional Anthropometric survey final report IDP camps and resettlement areas of Gulu & Amuru districts, northern Uganda. May 2007. [Google Scholar]
- Uganda Bureau of Statistics (UBOS) . (2014). National Population and Housing Census. https://unstats.un.org/unsd/demographic/.../census/wphc/Uganda/UGA‐2016‐05‐23.pd. [Google Scholar]
- Uganda Bureau of Statistics (UBOS) . (2017). Uganda Demographic and Health Survey. Key Indicators Report. https://www.ubos.org/onlinefiles/uploads/ubos/.../Uganda_DHS_2016_KIR.pdf. [Google Scholar]
- FAO . (2019). New UN Report Reveals that Hunger in Africa Continues to Rise. https://Www.Fao.Org/News/Story/En/Item/1180443/Icode/. [Google Scholar]
- AbdElgawad, H. , Peshev, D. , Zinta, G. , Van den Ende, W. , Janssens, I. A. , & Asard, H. (2014). Climate extreme effects on the chemical composition of temperate grassland species under ambient and elevated CO2: A comparison of fructan and non‐fructan accumulators. PLoS One, 9(3), e92044 10.1371/journal.pone.0092044 [DOI] [PMC free article] [PubMed] [Google Scholar]
- Aberoumand, A. , & Deokule, S. S. (2009). Studies on nutritional values of some wild edible plants from Iran and India. Pakistan Journal of Nutrition, 8(1), 26–31. 10.3923/pjn.2009.26.31 [DOI] [Google Scholar]
- Agbaire, P. , & Emoyan, O. (2012). Nutritional and antinutritional levels of some local vegetables from Delta State, Nigeria. African Journal of Food Science, 6(1), 8–11. 10.5897/AJFS11.175 [DOI] [Google Scholar]
- Agea, J. G. , Okia, C. A. , Abohassan, R. A. A. , Kimondo, J. M. , Obua, J. , Hall, J. , & Klehaimanot, Z. (2011). Wild and semi‐wild food plants of Bumyoro‐Kitara Kingdom of Uganda: Growth froms, collection niches, parts consumed, consumption patterns, main gatherers and consumers. Environmental Research Journals, 5(2), 74–86. [Google Scholar]
- Aguilar, R. G. , & Sumner, A. (2020). Who are the World’s Poor? A new profile of global multidimensional poverty. World Development, 126, 104716 10.1016/j.worlddev.2019.104716 [DOI] [Google Scholar]
- Ahmed, R. M. A. (2019) Contribution of Wild Edible Fruits to Rural Peoples Income In: Mariod A. (eds) Wild Fruits: Composition, Nutritional Value and Products. Springer, . 10.1007/978-3-030-31885-7. [DOI] [Google Scholar]
- Alowo, D. , Muggaga, C. , & Ongeng, D. (2018). The effect of traditional malting technology practiced by an ethnic community in northern Uganda on in‐vitro nutrient bioavailability and consumer sensory preference for locally formulated complementary food formulae. Food Science & Nutrition, 6(8), 2491–2498. 10.1002/fsn3.856 [DOI] [PMC free article] [PubMed] [Google Scholar]
- Angeles‐Agdeppa, I. , Denney, L. , Toledo, M. B. , Obligar, V. A. , Jacquier, E. F. , Carriquiry, A. L. , & Capanzana, M. V. (2019). Inadequate nutrient intakes in Filipino schoolchildren and adolescents are common among those from rural areas and poor families. Food & Nutrition Research, 63, 3435 10.29219/fnr.v63.3435 [DOI] [PMC free article] [PubMed] [Google Scholar]
- Anhwange, B. , Tyohemba, R. , Tukura, B. , & Ogah, P. (2015). Screening of Some Indigenous Wild Fruits for Anti‐nutritional Factors. Journal of Scientific Research & Reports, 5(3), 220–227. 10.9734/JSRR/2015/13899 [DOI] [Google Scholar]
- Arenas, P. , & Scarpa, G. (2007). Edible wild plants of the Chorote Indians, Gran Chaco, Argentina. Botanical Journal of the Linnean Society, 153(1), 73–85. 10.1111/j.1095-8339.2007.00576.x [DOI] [Google Scholar]
- Asprilla‐Perea, J. , & Díaz‐Puente, J. M. (2019). Importance of wild foods to household food security in tropical forest areas. Food Security, 11, 15–22 (2019). 10.1007/s12571-018-0846-8. [DOI] [Google Scholar]
- AOAC . (2006). Official methods of analysis of the AOAC (18th ed.). (Horwit W., Ed.). : Association of Official Analytical Chemists. ISBN: 0935584773 9780935584776. [Google Scholar]
- Baker, R. D. , & Greer, F. R. (2010). Diagnosis and prevention of iron deficiency and iron‐deficiency anemia in infants and young children (0–3 years of age). Pediatrics, 126(5), 1040–1050. 10.1542/peds.2010-2576 [DOI] [PubMed] [Google Scholar]
- Banjari, I. , Kenjerie, D. , & Milena, L. M. (2013). Intake of Tannic Acid From Tea and Coffee as a Risk Factor For Low Iron Bioavailability in Pregnant Women. https://hrcak.srce.hr/file/166731. [Google Scholar]
- Bello, M. O. , Falade, O. S. , Adewusi, S. R. A. , & Olawore, N. O. (2008). Studies on the chemical compositions and anti‐ nutrients of some lesser known Nigerian fruits. African Journal of Biotechnology, 7(21), 3972–3979. [Google Scholar]
- Bharucha, Z. , & Pretty, J. (2010). The roles and values of wild foods in agricultural systems. Philosophical Transactions of the Royal Society, 36, 2913–2926. 10.1098/rstb.2010.0123 [DOI] [PMC free article] [PubMed] [Google Scholar]
- Biesalski, H. K. , & Black, R. E. (2016). Hidden hunger. Malnutrition and the first 1,000 days of life: Causes, consequences and solutions. Future of Food: Journal on Food, Agriculture and Society, 5(1).86–87. [Google Scholar]
- Bighaghire, R. (2019). Effect of traditional preservations methods on household micronutrients intake from selected cultivated vegetables in Gulu District. MSc, Gulu University. [Google Scholar]
- Blanco‐Rojo, R. , & Vaquero, M. P. (2018). Iron bioavailability from food fortification to precision nutrition. A review. Innovative Food Science & Emerging Technologies, 51, 126–138. 10.1016/j.ifset.2018.04.015 [DOI] [Google Scholar]
- Borelli, T. , Hunter, D. , Padulosi, S. , Amaya, N. , Meldrum, G. , de Oliveira Beltrame, D. M. , Samarasinghe, G. , Wasike, V. W. , Güner, B. , Tan, A. , Koreissi Dembélé, Y. , Lochetti, G. , Sidibé, A. , & Tartanac, F. (2020). Local solutions for sustainable food systems: the contribution of orphan crops and wild edible species. Agronomy, 10(2), 231 10.3390/agronomy10020231 [DOI] [Google Scholar]
- Bvenura, C. , & Sivakumar, D. (2017). The role of wild fruits and vegetables in delivering a balanced and healthy diet. Food Research International, 99, 15–30. 10.1016/j.foodres.2017.06.046 [DOI] [PubMed] [Google Scholar]
- Castro‐ Alba, V. , Lazarte, C. E. , Perez‐Rea, D. , Carlsson, N. , Almgren, A. , Bergenståhl, B. , & Granfeldt, Y. (2019). Fermentation of pseudocereals quinoa, canihua, and amaranth to improve mineral accessibility through degradation of phytate. Journal of the Science of Food and Agriculture, 99(11), 5239–5248. [DOI] [PMC free article] [PubMed] [Google Scholar]
- Chattoo, M. A. , Khan, S. H. , Anjum, A. R. A. , & Makhdoomi, M. I. (2011). Antinutritional Factors in Vegetables. Rashtriya Krishi, 6(1), 9–11. [Google Scholar]
- Chijioke, N. O. , Uddin‐Khandaker, M. , Tikpangi, K. M. , & Bradley, D. A. (2019). Metal Uptake in Chicken Giblets and Human Health Implications. Journal of Food Composition and Analysis, 85, 103332 10.1016/j.jfca.2019.103332 [DOI] [Google Scholar]
- Chiocchetti, G. M. , Fernandes, E. A. N. , Wawer, A. A. , Fairweather, S. T. , & Christides, T. (2018). In Vitro Iron Bioavailability of Brazilian Food‐Based by‐Products. Medicines, 45(5), 1–12. 10.3390/medicines5020045 [DOI] [PMC free article] [PubMed] [Google Scholar]
- Cordeiro, L. (2012). Household dietary diversity, wild edible plants and diarrhea among rural households in Tanzania. Journal of Medicinal Active Plants, 1(3), 98–105. [Google Scholar]
- Delimont, N. M. , Mark, D. H. , & Lindshield, B. H. (2017). The impact of tannin consumption on iron bioavailability and status: A narrative review. Current Developments in Nutrition, 1(2), e000042. [DOI] [PMC free article] [PubMed] [Google Scholar]
- Dupont, C. (2017). Prevalence of iron deficiency. Archives De Pédiatrie, 24(5), 5S45‐5S48. 10.1016/S0929-693X(17)24009-3 [DOI] [PubMed] [Google Scholar]
- Eckhardt, C. L. (2006). Micronutrient malnutrition, obesity, and chronic disease in countries undergoing the nutrition transition: Potential links and program/policy implications. FCND Discussion Paper 213, (November), 1–40. [Google Scholar]
- Engelbert, A. L. , Paschal, K. A. , Ngia, G. , Njem, P. K. , Yelena, S. , Nsah, B. , & Ajime, T. T. (2013). Malnutrition in Subsaharan Africa: Burden, Cause and Prospects. The Pan African Medical Journal, 15(120), 1–9. 10.11604/pamj.2013.15.120.2535. [DOI] [PMC free article] [PubMed] [Google Scholar]
- FANTA & USAID . (2010). The Analysis of the Nutrition Situation in Uganda. Food and Nutrition Technical Assistance II Project (FANTA‐2), (May), 1–94. [Google Scholar]
- FAO, IFAD, & WFP , (2015). The State of Food Insecurity in the World: Meeting the 2015 international hunger targets: Taking stock of uneven progress. FAO, IFAD and WFP. doi.org/I4646E/1/05.15 [DOI] [PMC free article] [PubMed] [Google Scholar]
- FAO, IFAD, and WFP . (2012). The State of Food Insecurity in the World 2012. http://www.fao.org/3/a‐i3027e.pdf. [Google Scholar]
- FAO, Ifad, UNICEF, WFP, WHO . (2017). The State of Food Security and Nutrition in the World. http://www.fao.org/3/a‐i7695e.pdf. [Google Scholar]
- Fentahun, M. T. , & Hager, H. (2009). Exploiting locally available resources for food and nutritional security enhancement: wild fruits diversity, potential and state of exploitation in the Amhara region of Ethiopia. Food Security. 1, 207–219. 10.1007/s12571-009-0017-z [DOI] [Google Scholar]
- Fraval, S. , Oosting, S. J. , de Boer, I. J. M. , Lannerstad, M. , & van Wijk, M. T. (2019). Food Security in Rural Sub‐Saharan Africa: A Household Level Assessment In Trade‐offs in Science ‐ Keeping the Balance: Abstracts of the WIAS Science Day 2019 (pp. 14‐14). Wageningen University & Research; https://library.wur.nl/WebQuery/wurpubs/549261. [Google Scholar]
- Godfray, H. C. J. , Beddington, J. R. , Crute, I. R. , Haddad, L. , Lawrence, D. , Muir, J. F. , Pretty, J. , Robinson, S. , Thomas, S. M. , & Toulmin, C. (2010). Food Security: The Challenge of Feeding 9 Billion People. Science, 327(5967), 812–818. 10.1126/science.1185383 [DOI] [PubMed] [Google Scholar]
- Gordon, L. J. , & Enfors, E. I. (2008). Land degradation, ecosystem services and resilience of smallholder farmers in Makanya catchment, Tanzania. Conserving Land, Protecting Water, 33–50. 10.1079/9781845933876.0033 [DOI] [Google Scholar]
- Horowitz, K. M. , Ingardia, C. J. , & Borgida, A. F. (2013). Anemia in pregnancy. Clinics in Laboratory Medicine. 33, 281–291. 10.1016/j.cll.2013.03.016 [DOI] [PubMed] [Google Scholar]
- Hurrell, R. , & Egli, I. (2010). Iron bioavailability and dietary reference values. The American Journal of Clinical Nutrition, 91(5), 1461S–1467S. 10.3945/ajcn.2010.28674F.Am [DOI] [PubMed] [Google Scholar]
- Institute of Medicine (2001). Dietary Reference Intakes for Vitamin A, Vitamin K, Arsenic, Boron, Chromium, Copper, Iodine, Iron, Manganese, Molybdenum, Nickel, Silicon, Vanadium, and Zinc. The National Academies Press; 10.17226/10026. [DOI] [PubMed] [Google Scholar]
- Isabirye, N. , Ezeamama, A. E. , Kyeyune‐Bakyayita, R. , Bagenda, D. , Fawzi, W. W. , & Guwatudde, D. (2020). Dietary Micronutrients and Gender, Body Mass Index and Viral Suppression Among HIV‐Infected Patients in Kampala, Uganda. International Journal of Maternal and Child Health and AIDS, 9(3), 337. [DOI] [PMC free article] [PubMed] [Google Scholar]
- Jama, B. A. , Mohamed, A. M. , Mulatya, J. , & Njui, A. N. (2008). Comparing the “big five”: A framework for the sustainable management of indigenous fruit trees in the drylands of East and Central Africa. Ecological Indicators, 8(2), 170–179. 10.1016/j.ecolind.2006.11.009 [DOI] [Google Scholar]
- Koss‐Mikołajczyk, I. , Baranowska, M. , Todorovic, V. , Albini, A. , Sansone, C. , Andreoletti, P. , Cherkaoui, M. M. , Lizard, G. , Noonan, D. , Sobajic, S. , & Bartoszek, A. (2019). Prophylaxis of non‐communicable diseases: why fruits and vegetables may be better chemopreventive agents than dietary supplements based on isolated phytochemicals? Current Pharmaceutical Design, 25(16), 1847–1860(14). 10.2174/1381612825666190702093301. [DOI] [PubMed] [Google Scholar]
- Kumar, R. , & Sangwan, P. S. (2019). Distribution of iron fractions and their relationship with soil properties in different soil series of Haryana. Journal of Plant Development Sciences, 11(10), 601–606. [Google Scholar]
- Kumar, S. , Anukiruthika, T. , Dutta, S. , Kashyap, A. V. , Moses, J. A. , & Anandharamakrishnan, C. (2020). Iron deficiency anemia: A comprehensive review on iron absorption, bioavailability and emerging food fortification approaches. Trends in Food Science & Technology, 99, 58–75. 10.1016/j.tifs.2020.02.021 [DOI] [Google Scholar]
- Langdale‐Brown, I. , Osmaston, H. A. , & Wilson, J. G. (1964). The vegetation of Uganda and its bearing on land‐ use. Government of Uganda; https://trove.nla.gov.au/version/44482583. [Google Scholar]
- Lehrfeld, J. (1987). High‐performance liquid chromatography analysis of phytic acid on a pH‐stable. Macroporous Polymer Column, 1–6. [Google Scholar]
- Liu, R. H. (2013). Health‐Promoting Components of Fruits and Vegetables in the Diet. Advances in Nutrition, 4(3), 384S–392S. 10.3945/an.112.003517 [DOI] [PMC free article] [PubMed] [Google Scholar]
- Loh, S. P. , & Khor, G. L. (2010). Iron Intake and Iron Deficiency Anaemia among young women in Kuala Lumpur. Malasian Journal of Medicine and Health Sciences, 6(1), 63–70. [Google Scholar]
- Loki, R. B. O. , & Ndyomugyenyi, E. K. (2016). Diversity and nutritional values of wild edible leaves of Acholi sub‐region, North Uganda. Journal of Environmental Science, Toxicology and Food Technology, 10(11), 79–85. 10.9790/2402-1011017985 [DOI] [Google Scholar]
- Luten, J. , Crews, H. , Flynn, A. , Van Dael, P. , Kastenmayer, P. , Hurrell, R. , Deelstra, H. , Shen, L.‐H. , Fairweather‐Tait, S. , Hickson, K. , Farré, R. , Schlemmer, U. , & Frøhlich, W. (1996). Interlaboratory trial on the determination of the in vitro iron dialysability from food. Journal of the Science of Food and Agriculture, 72(4), 415–424. [DOI] [Google Scholar]
- Marinova, D. , Ribarova, F. , & Atanassova, M. (2005). Total phenolics and total flavonoids in bulgarian fruits and vegetables. Journal of the University of Chemical Technology and Metallurgy, 40(3), 255–260. [Google Scholar]
- Marrelli, M. , Loizzo, M. R. , Nicoletti, M. , Menichini, F. , & Conforti, F. (2014). In vitroinvestigation of the potential health benefits of wild Mediterranean dietary plants as anti‐obesity agents with α‐amylase and pancreatic lipase inhibitory activities. Journal of the Science of Food and Agriculture, 94(11), 2217–2224. 10.1002/jsfa.6544 [DOI] [PubMed] [Google Scholar]
- Mavengahama, S. , McLachlan, M. , & De Clercq, W. (2013). The role of wild vegetable species in household food security in maize based subsistence cropping systems. Food Security, 5, 227–233. 10.1007/s12571-013-0243-2 [DOI] [Google Scholar]
- Means, R. T. (2020). Iron deficiency and iron deficiency anemia: implications and impact in pregnancy, fetal development, and early childhood parameters. Nutrients, 12, 447 10.3390/nu12020447 [DOI] [PMC free article] [PubMed] [Google Scholar]
- Meltzer, H. M. , Brantsæter, A. L. , Iohnsen, B. B. , Ellingsen, D. G. , Jan, A. , Yngvar, T. , Stigum, H. , & Trond, A. Y. (2010). Low iron stores are related to higher blood concentrations of manganese, cobalt and cadmium in non‐smoking, Norwegian women in the HUNT 2 study. Environmental Research, 110(5), 497–504. 10.1016/j.envres.2010.03.006 [DOI] [PubMed] [Google Scholar]
- Mihrete, Y. (2019). Review on anti nutritional factors and their effect on mineral absorption. Acta Scientific Nutritional Health, 3(2), 84–89. [Google Scholar]
- Moughan, P. J. (2018). Holistic properties of foods: A changing paradigm in human nutrition. Journal of the Science of Food and Agriculture, 100(14), 5056–5063. 10.1002/jsfa.8997 [DOI] [PubMed] [Google Scholar]
- Natesh, H. N. , Abbey, L. , & Asiedu, S. K. (2017). An overview of nutritional and anti‐nutritional factors in green leafy vegetables. Horticulture International Journal, 1(2), 58–65. 10.15406/hij.2017.01.00011 [DOI] [Google Scholar]
- Nazia, A. , Tanvir, H. , Sajia, I. , Dibley, M. , Masudur, R. , Shahreen, R. , Rahman, Q. S. , Bhuiya, S. , & Arifeen, S. E. (2019). The Prevalence and Risk Factors of Overweight and Obesity Among Women of Reproductive Age with Iron Deficiency Anaemia in Urban Bangladesh (P10–064‐19). Global Nutrition 825. [Google Scholar]
- Ndlovu, J. , & Afolayan, A. J. (2008). Nutritional analysis of the South African wild vegetable Corchorus olitorius L. Asian Journal of Plant Sciences, 7, 615–618. 10.3923/ajps.2008.615.618 [DOI] [Google Scholar]
- Nwogwugwu, N. U. , Abu, G. O. , & Akaranta, O. (2016). Chemical composition of calabash (Cresentia cujete) and fluted pumpkin (Telfaria occidentalis Hook. F) Pulp and their potential for use in the industry. Archives of Applied Sciences Research, 8(8), 24–30. [Google Scholar]
- Obadoni, B. O. , & Ochuko, P. O. (2002). Phytochemical Studies and Comparative Efficacy of the Crude Extracts of some Haemostatic Plants in Edo Delta States of Nigeria. Global Journal of Pure and Applied Sciences, 8(2), 203–208. 10.4314/gjpas.v8i2.16033 [DOI] [Google Scholar]
- Obai, G. , Odongo, P. , & Wanyama, R. (2016). Prevalence of anaemia and associated risk factors among pregnant women attending antenatal care in Gulu and Hoima Regional Hospitals in Uganda: A cross sectional study. BMC Pregnancy and Childbirth, 16(1), 1–7. 10.1186/s12884-016-0865-4 [DOI] [PMC free article] [PubMed] [Google Scholar]
- Ojelel, S. , Mucunguzi, P. , Katuura, E. , Kakudidi, E. K. , Namaganda, M. , & Kalema, J. (2019). Wild edible plants used by communities in and around selected forest reserves of Teso‐Karamoja region, Uganda. Journal of Ethnobiology and Ethnomedicine, 15(1). 10.1186/s13002-018-0278-8 [DOI] [PMC free article] [PubMed] [Google Scholar]
- Okidi, L. , Odongo, W. , & Ongeng, D. (2018). The mix of good nutritional attitude and poor nutritional knowledge is associated with adequate intake of vitamin A and iron from wild fruits and vegetables among rural households in Acholi subregion of Northern Uganda. Food Science & Nutrition, 6(8), 2273–2284. 10.1002/fsn3.800 [DOI] [PMC free article] [PubMed] [Google Scholar]
- Okori, W. , Obua, J. , & Baryamureeba, V. (2009). Famine disaster caueses and management based on local community's perception in Northern Uganda. Research Journal of Social Sciences, 4, 21–32. [Google Scholar]
- Okullo, J. B. L. , Omujal, F. , Agea, J. G. , Vuzi, P. C. , Namutebi, A. , Okello, J. B. A. , & Nyanzi, S. A. (2010). Proximate and mineral composition of shea (Vitellaria paradoxa C.F. Gaertn) fruits pulp in Uganda. African Journal of Food, Agriculture, Nutrition and Development, 10(11).4430–4443. [Google Scholar]
- Oryema, C. , Oryem‐Origa, H. , & Nanna, R. (2013). Edible Wild Fruits Species of Gulu District, Uganda. International Journal of Biology and Biological Sciences, 2(4), 68–82. [Google Scholar]
- Pardo‐de‐Santayana, M. , Tardio, J. , & Morales, R. (2005). The gathering and consumption of wild edible plants in the campoo (Cantabria, Spain). International Journal of Food Sciences and Nutrition, 56(7), 529–542. 10.1080/09637480500490731 [DOI] [PubMed] [Google Scholar]
- Rathod, V. S. , & Valvi, S. R. (2011). Antinutritional factors of some wild edible fruits from Kolhapur district. Recent Research in Science and Technology, 3(5), 68–72. [Google Scholar]
- Rosen, S. , Thome, K. , & Meade, B. (2016). International Food Security Assessment, 2016–2026. Outlook Report, (GFA‐27), 2016–2026. http://www.ers.usda.gov/media/2109786/gfa27.pdf. [Google Scholar]
- Rousseau, S. , Kyomugasho, C. , Celus, M. , Hendrickx, M. E. G. , & Grauwet, T. (2019). Barriers Impairing Mineral Bioaccessibility and Bioavailability in Plant‐Based Foods and the Perspectives for Food Processing. Critical Reviews in Food Science and Nutrition, 60(5), 826 10.1080/10408398.2018.1552243 [DOI] [PubMed] [Google Scholar]
- Rout, P. , & Basak, U. C. (2015). Screening of antinutritional factors of nine underutilized wild edible fruits of Odisha. Annals of Biological Sciences, 3(4), 21–27. [Google Scholar]
- Schanderi, S. H. (1970). Methods in food analysis. Academic Press. [Google Scholar]
- Scheers, N. , Rossander‐Hulthen, L. , Torsdottir, I. , & Sandberg, A. S. (2015). Increased iron bioavailability from lactic‐fermented vegetables is likely an effect of promoting the formation of ferric iron (Fe3+). European Journal of Nutrition, 55(1), 373–382. 10.1007/s00394-015-0857-6 [DOI] [PMC free article] [PubMed] [Google Scholar]
- Schuldt, A. , Ebeling, A. , Kunz, M. , Staab, M. , Guimarães‐Steinicke, C. , Bachmann, D. , Buchmann, N. , Durka, W. , Fichtner, A. , Fornoff, F. , Härdtle, W. , Hertzog, L. R. , Klein, A.‐M. , Roscher, C. , Schaller, J. , von Oheimb, G. , Weigelt, A. , Weisser, W. , Wirth, C. , … Eisenhauer, N. (2019). Multiple Plant Diversity Components Drive Consumer Communities Across Ecosystems. Nature Communications, 10, 1460 10.1038/s41467-019-09448-8 [DOI] [PMC free article] [PubMed] [Google Scholar]
- Sharma, C. , & Dhandoria, R. (2019). Assessment of Prevalence of Iron Deficiency Anemia Among Known Population. Journal of Advanced Medical and Dental Sciences Research, 7(7), 175–177. [Google Scholar]
- Shumsky, S. (2012). Food Security from the Forest: Regulating Wild Edible Plants for Household Food Security in Sub‐Saharan Africa. https://www.mcgill.ca/isid/files/isid/pb_2012_14_shumsky.pdf. [Google Scholar]
- Sinha, K. , & Khare, V. (2017). Review on: Antinutritional factors in vegetable crops. The Pharma Innovation Journal, 6(12), 353–358. [Google Scholar]
- Smith, F. I. , & Ezyaguirre, P. (2007). African leafy vegetables: Role in World Health Organization’s Global Fruit and Vegetables Initiative. African Journal of Food, Agriculture, Nutrition and Development, 7(3), 1–17. [Google Scholar]
- Stevens, G. A. , Finucane, M. M. , De‐regil, L. M. , Paciorek, C. J. , Flaxman, S. R. , Branca, F. , & Peña‐rosas, J. P. (2012). Global, regional, and national trends in haemoglobin concentration and prevalence of total and severe anaemia in children and pregnant and non‐pregnant women for 1995–2011: a systematic analysis of population‐representative data, 16–25. 10.1016/S2214‐109X(13)70001–9. [DOI] [PMC free article] [PubMed] [Google Scholar]
- Sunderland, T. C. H. , & Rowland, D. (2019). Forests, Land Use, and Challenges to Climate Stability and Food Security. Sustainable Food and Agriculture, 95–116. 10.1016/b978-0-12-812134-4.00006-6 [DOI] [Google Scholar]
- Tsuda, T. (2016). Recent progress in anti‐obesity and anti‐diabetes effect of berries. Antioxidants, 5(2), 13 10.3390/antiox5020013 [DOI] [PMC free article] [PubMed] [Google Scholar]
- United Nations (UN) (2015a). Transforming Our World: The 2030 Agenda for Sustainable Development. https://www.un.org/development/.../2015/.../transforming‐our‐world‐the‐2030‐agenda. [Google Scholar]
- Uusiku, N. P. , Oelofse, A. , Duodu, K. G. , Bester, M. J. , & Faber, M. (2010). Nutritional Value of Leafy Vegetables of Sub‐Saharan Africa and their Potential Contributuion to Human Health: A Review. Journal of Food Composition and Analysis, 23, 499–509. [Google Scholar]
- Wanling, H. , Xiaoli, L. , Ke, D. , Yuanxiao, L. , & Wang, L. (2019). Ascorbic Acid can Reverse the Inhibition of Phytic Acid, Sodium Oxalate and Sodium Silicate on Iron Absorption in Caco‐2 cells. International Journal for Vitamin and Nutrition Research, 88, 65–72. 10.1024/0300-9831/a000503. © 2018 Hogrefe AG [DOI] [PubMed] [Google Scholar]
- World Bank (2018). Rural population (%) of total population. https://data.worldbank.org/indicator/sp.rur.totl.zs. [Google Scholar]
- Xie, H. , Perez, N. , Anderson, W. , Ringler, C. , & You, L. (2018). Can Sub‐Saharan Africa feed itself? The role of irrigation development in the region’s drylands for food security. Water International, 43(6), 796–814. 10.1080/02508060.2018.1516080 [DOI] [Google Scholar]
- Young, I. , Parker, H. , Rangan, A. , Prvan, T. , Cook, R. , Donges, C. , Steinbeck, K. , O’Dwyer, N. , Cheng, H. , Franklin, J. , & O’Connor, H. (2018). Association between Haem and Non‐Haem Iron Intake and Serum Ferritin in Healthy Young Women. Nutrients, 10(1), 81 10.3390/nu10010081 [DOI] [PMC free article] [PubMed] [Google Scholar]
- Zulu, D. , Ellis, R. H. , & Culham, A. (2019). Collection, Consumption, and Sale of Lusala (Dioscorea hirtiflora) a Wild Yam by Rural Households in Southern Province, Zambia. Economic Botany, 73(1), 47–63. 10.1007/s12231-018-9433-3. [DOI] [Google Scholar]
Associated Data
This section collects any data citations, data availability statements, or supplementary materials included in this article.
Data Availability Statement
Data that support the findings of this study are available from the corresponding author upon reasonable request.