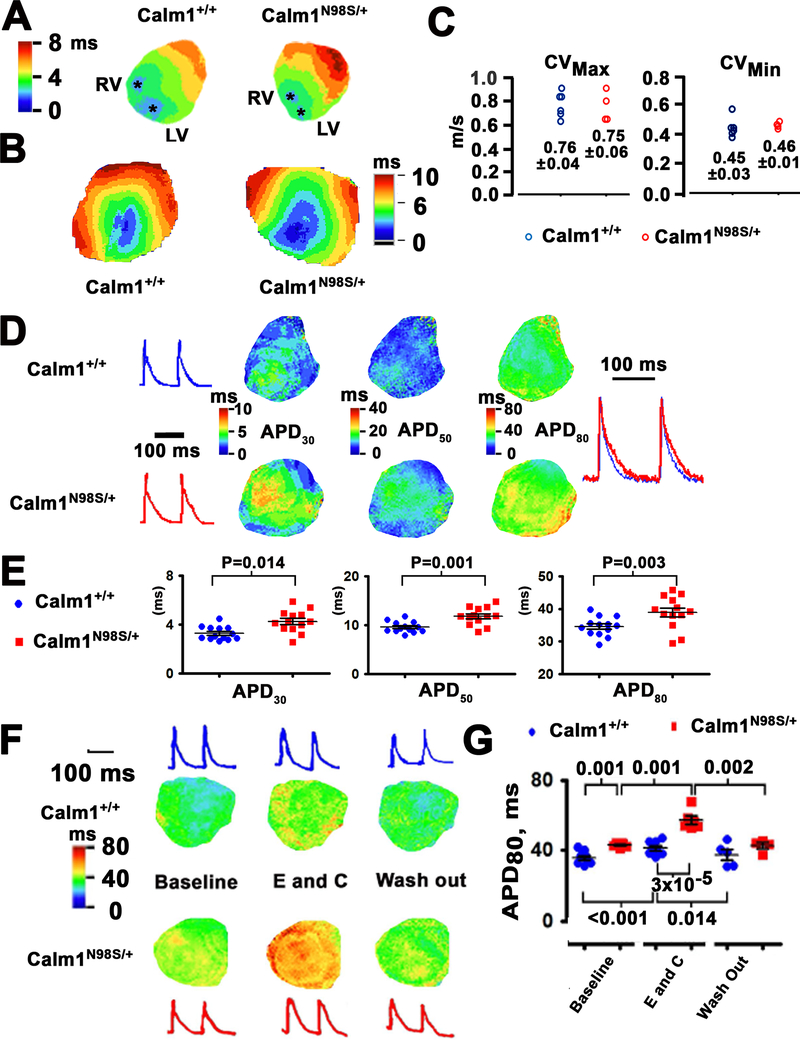
Figure 2. Delayed repolarization in ventricles of Calm1N98S/+ mice.
A, Isochrone maps of epicardial activation during atrial pacing at a cycle length of 120 ms. Asterisks denote epicardial breakthrough sites on the anterior surface near the apex of the left (LV) and right ventricle (RV). Depolarization spread from the apex to the base. Sequential depolarizations are depicted in different colors according to the color legend shown in the left. Isochronal lines are 1 ms apart. B, Epicardial ventricular conduction velocities. Ventricular activation isochrone maps of the anterior aspect of a Calm1+/+ and Calm1N98S/+ heart. The anisotropic propagation in the ventricle enables measurements of maximal and minimal conduction velocities (CVmax and CVmin). C, Dot plots of CVs. Numbers indicate mean and SEM in m/s from 6 Calm1+/+ and 4 Calm1N98S/+ hearts. No statistically significant differences between the two genotypes were found. D, Left: Representative optical action potentials from the anterior left ventricular epicardium of littermate Calm1+/+ and Calm1N98S/+ mice during atrial pacing at a cycle length of 120 ms. Middle three panels: exemplar maps of the repolarization time points at APD30, APD50 and APD80. Colored scale bars are shown in the inserts. Right: superimposition of the same optical action potentials shown in the left panels. E, Dot plots showing APD30, APD50 and APD80 of littermate control and Calm1N98S/+ mice. Black horizontal lines depict mean ± SEM. * P ≤ 0.02 by t-test. N = 11 per genotype. F, Exacerbation of long QT phenotype upon exposure to epinephrine (E) and caffeine (C) combined. Exemplar ventricular repolarization (APD80) isochrone maps of the anterior aspect of a Calm1+/+ and a Calm1N98S/+ heart at baseline, during E and C exposure, and following washout. Pacing cycle length, 120 ms. G, Scatter plots of APD80. Black lines are mean ± SEM from 8 Calm1+/+ and 6 Calm1N98S/+ hearts. P values by Repeated Measures ANOVA followed by Tukey test for intragroup analyses; for intergroup analyses, a t-test (for comparisons at baseline and during washout) and Mann-Whitney Rank Sum test (for comparison during epinephrine) were used.

