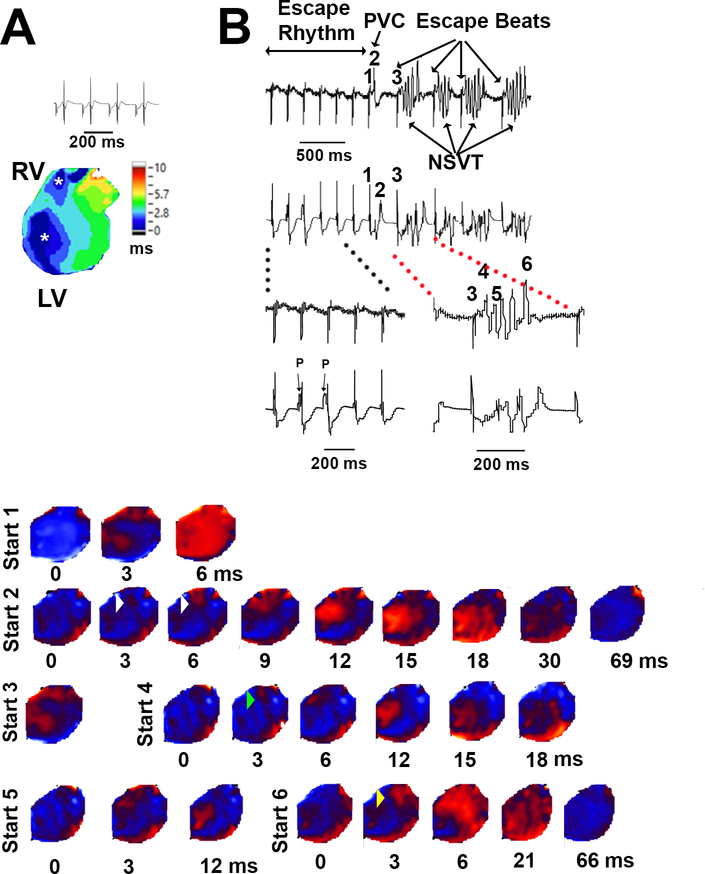
Figure 4. Ventricular arrhythmia in a Calm1N98S/+ heart.
A, Volume-conducted ECG and epicardial activation map in sinus rhythm. Asterisks denote concentric breakthroughs on the anterior right and left ventricular free walls. B, Volume-conducted ECGs and epicardial voltage maps in the presence of 100 nM isoproterenol and 3.6 mmol/L extracellular Ca2+. QRS complex numbers on ECG correspond to voltage map sequences with the same numbers. The ECG shows a junctional escape rhythm with AV dissociation and a QRS morphology similar to that during SR, a single premature ventricular complex (PVC) and 4 episodes of non-sustained VT (NSVT). Maps show epicardial breakthrough pattern during junctional escape rhythm (sequence #1), RV focal discharge (white arrowheads) coinciding with the emergence of an R-on-T ectopic ventricular beat (sequence #2) in the ECG, RV focal discharge (green arrowhead) initiating NSVT with a large wave front traveling across the epicardial surface (sequences #3 - #5), followed by an RV focal discharge (yellow arrowhead) coinciding with the last beat of the arrhythmia episode (sequence #6). Map sequences of the other 3 VT episodes similarly showed RV focal discharges initiating NSVT. Times denote intervals after the onset of epicardial breakthroughs.

