

Abstract
Recent work finds that medical marijuana laws reduce the daily doses filled for opioid analgesics among Medicare Part-D and Medicaid enrollees, as well as population-wide opioid overdose deaths. We replicate the result for opioid overdose deaths and explore the potential mechanism. The key feature of a medical marijuana law that facilitates a reduction in overdose death rates is a relatively liberal allowance for dispensaries. As states have become more stringent in their regulation of dispensaries, the protective value generally has fallen. These findings suggest that broader access to medical marijuana facilitates substitution of marijuana for powerful and addictive opioids.
I. Introduction
Drug overdose deaths have increased dramatically over the past 15 years, increasing by 137% between 2000 and 2014 (Rudd et al., 2016), and are now the leading cause of death from injuries in the United States, exceeding deaths from suicide, gunshots and motor vehicle accidents (Murphy et al., 2013). Overdose deaths are also a prime contributor to the recent rise in mortality among middle-aged non-Hispanic white Americans (Case and Deaton 2015; Case and Deaton 2017). In 2015, 22,598 deaths were caused by an overdose of a prescription opioid, representing over 40% of all drug overdose deaths, and exceeding overdose deaths from heroin and cocaine combined.1 Over the same period, the distribution of opioid analgesics (commonly referred to as “pain medications”) quadrupled, demonstrating a parallel rise between the medical distribution of opioid analgesics and its misuse nationally (CDC, 2011). More recently, the misuse of heroin and synthetic opioids has increased, with overdose deaths involving heroin more than quadrupling between 2010 and 2015 (Hedegaard et al., 2017). The problem has reached such severe proportions that the Department of Health and Human Services and Centers for Disease Control have deemed it an epidemic.
Providing some modest hope in an otherwise bleak landscape, recent work finds that state medical marijuana laws, which allow marijuana use for medicinal purposes, reduce prescription pain medication fills in Medicare Part-D (Bradford and Bradford, 2016), prescriptions for nausea, pain, depression and seizures among Medicaid enrollees (Bradford and Bradford, 2017), hospitalizations related to opioid analgesics (Shi, 2017), the prevalence of narcotics detected among fatally injured drivers (Kim et al., 2016) as well as national age-adjusted opioid overdose death rates (Bachhuber et al., 2014). The implication from these studies is that medical marijuana laws enable individuals to substitute marijuana for opiates, particularly opioid analgesics.2 Consistent with this idea, medical marijuana recommendations are often sought for severe or chronic pain (Bowles, 2012; Nunberg et al., 2011) and several reviews find the drug is effective medicine for the treatment of chronic pain (Borgelt et al., 2013; Lynch & Cambell, 2011; Lueng, 2011; Martin-Sanchez et al., 2009).3 More generally, there is interest in pain management substitutes for opioid analgesics given their associated risks, and significant policy interest in the ramifications of improving access to such substitutes. Missing from most of the prior literature, however, is a clear articulation of the mechanism through which patients substitute towards marijuana.4 In particular, given the considerable heterogeneity in medical marijuana laws (Klieger et al., Forthcoming; Williams et al., 2016; Pacula et al., 2015), it is important to discern the specific features of medical marijuana laws that have contributed to this relationship. Without understanding the mechanisms, efforts to replicate any benefits (or, likewise, avoid any harms) may prove unsuccessful.
In this paper, we present a detailed analysis of the impact of medical marijuana laws on opiate related harm with a specific focus on not just whether a state has a law in effect but also whether that law provides an allowance for retail marijuana sales to qualified patients through dispensaries. Dispensary allowances are associated with greater access to and use of marijuana (Pacula et al., 2015; 2010; Choi, 2014; Chu, 2014; Freisthler and Greunewald, 2014) as well as the availability of more potent marijuana (Sevigny et al., 2014). If marijuana is an effective alternative to prescription opioids, then states that provide greater legal access to it should have been more likely to stem the rise of harm caused by opiates overall.
To assess these issues, we focus on two broad measures of opioid related harm: treatment admissions for addiction to pain relievers (1999–2012) and state-level overdose deaths from opioid medications (1999–2013). Because of the recent rise in heroin use, particularly in response to a 2010 reformulation of OxyContin (Alpert et al., 2017), we also consider treatment admissions and overdose deaths for a combined category of heroin and prescription opioids (which together will be referred to as “opiates”). We further examine how state policies influence the distribution of (2000–2013) and self-reported misuse of prescription opioid medication (2002–2012), so as to better understand whether medical use of marijuana impacted the legal distribution of opioid analgesics as a possible mechanism for our findings.
To begin, we replicate the estimates of Bachhuber et al. (2014), demonstrating a significant decline in opioid overdose death rates in states that adopted medical marijuana laws between 1999 and 2010. We show that these estimates are driven disproportionately by states that allowed for and had a legal channel for retail marijuana sales to qualified patients. We find a similar pattern of results for treatment admissions. We then show that extending the study period through 2012/2013 - a period when states began opening more tightly regulated medical marijuana retail systems - weakens the overall medical marijuana law results and, to a lesser extent, even the dispensary law provisions. We discuss in the paper why we think this occurs and how these findings tell us about possible mechanisms.
We find little evidence that states with medical marijuana laws, with or without legal access to medical marijuana dispensaries, experience reductions in the volume of legally distributed opioids as indicated by the Drug Enforcement Agency’s Automation of Reports and Consolidated Orders System (ARCOS). Indeed, if anything, states that adopt medical marijuana laws during our sample experience a relative increase in the legal distribution of prescription opioids. This result suggests that our findings are not driven by a decrease in the legal supply of opioids.
Finally, we analyze self-reported nonmedical use of pain relievers as reported in the National Survey on Drug Use and Health (NSDUH). We find only weak evidence that access to medical marijuana dispensaries reduce nonmedical use of pain relievers. Given the limits of this question - which asks only about nonmedical use of pain relievers, rather than, for example either any or regular use of prescription opioids - and the small size of the NSDUH, we caution against over-interpreting this result.
These results combined - reductions in opioid overdose death rates and treatment admissions with no decrease in the legal distribution of prescription opioids or in their “nonmedical use” - suggest that medical marijuana dispensaries reduced some of the harms associated with the misuse of opioids. The effect of medical marijuana policies on opioid related harm diminishes over time, particularly after 2010, which might be due to the regulatory tightening of medical marijuana dispensaries, the major marijuana policy feature behind the reduced harm in the earlier period. It is not driven solely by a shift in use to heroin, as our results with respect to active and legal dispensaries remain when we include heroin in our mortality measure and treatment admissions.
The rest of this paper is organized as follows. In Section II, we describe the data sources and study measures. Section III includes a discussion of our empirical strategy. The results are presented in Section IV. Section V concludes.
II. Data and Measures
Following the literature studying opioid-related harms, we use four different measures of opioid use and misuse to study the relationship between medical marijuana laws and potential harm from opioids: opioid-related mortality, opioid-related treatment admissions, the legal distribution of opioids to states from the producers of these medications, and self-reported nonmedical pain reliever use. For each outcome, we have data for all states and Washington D.C.
We construct opioid-related deaths using the National Vital Statistics System (NVSS), a census of deaths in the United States. Opioid-related deaths are the key driver of prescription drug overdoses for over a decade (Jones et al, 2013). We code deaths as related to prescription opioids using the ICD-10 external cause of injury codes (X40–X44, X60–64, X85, or Y10–Y14) and drug identification codes (T40.2–T40.4). We follow the codes used by the CDC to categorize deaths of any intent (unintentional, suicide, homicide or undetermined).5 Given the rise in heroin-related mortality during our time period, we will also study deaths involving any opiate, including heroin (identification code T40.1). We limit our mortality analysis to 1999–2013 because prior to 1999, the NVSS used ICD-9 codes to identify cause of death and opioid-related deaths are difficult to link across ICD coding systems. We used the restricted geocoded data with state identifiers to link medical marijuana laws to opioid-related deaths. We aggregate based on state of occurrence and year.
Our second measure of problematic opioid use is the number of treatment episodes for abuse of pain relievers from the Treatment Episode Data Set (TEDS) for 1999–2012, which is collected by Substance Abuse and Mental Health Services Administration (SAMHSA).6 While available back to 1992, we use 1999 as the start date to remain consistent with the mortality data and due to the rarity of medical marijuana laws before 1999. Not all states report in all years so we have an unbalanced sample for our TEDS outcomes, though all states report in at least eight of the fourteen years.7 SAMHSA requests that all states submit treatment admissions data from facilities receiving public funding (federal block grants, state funds, public insurance dollars) even if those facilities also serve privately insured or cash only patients. While facilities serving exclusively privately insured or cash-only patients are not reflected in the sampling frame, examination of national spending on substance abuse treatment shows that the public sector (via Medicare, Medicaid or other federal, state and local grants or subsidies) has consistently paid over 75% of all substance abuse treatment in the United States since 1998 (Mark et al., 2011). Thus, in theory the TEDS data should capture the vast majority of treatment admissions. In practice, the scope of facilities included in TEDS varies by state due to differences in systems of licensure, certification, accreditation, and health care payment systems (Rutter et al., 2015; SAMHSA, 2017). As we discuss below, important differences in what gets reported across states must be accounted for statistically when analyzing the TEDS data. Prior work has found that the TEDS provides useful information regarding substance abuse (e.g., Anderson, 2010; Chu, 2014; Anderson et al., 2015). We present evidence that the reductions in treatment admissions associated with medical marijuana dispensaries represent reductions in harms and not concurrent reductions in treatment availability or reporting.
While the first two data sets provide measures related to opioid harm, we are also interested in opioid access. Data on the supply of opioids by drug type through medicinal channels, one measure of access, is captured and in the Drug Enforcement Administration’s (DEA) Automation of Reports and Consolidated Orders System (ARCOS). ARCOS is the system that monitors and records the flows of controlled substances, which are tracked under the Controlled Substances Act of 1970, as they move from manufacturers to retail distributors at the local level (down to the street address and zip code). We have ARCOS data by quarter, year, drug type, and state for the years 2000–2013. Following prior work (Paulozzi et al., 2011; Paulozzi and Ryan, 2006), we measure morphine-equivalent doses of the 8 most commonly abused opioid analgesics: fentanyl, hydrocodone, hydromorphone, meperidine, methadone (distributed through narcotics treatment programs and distributed through other outlets as an analgesic), morphine, codeine and oxycodone (as OxyContin as well as in other forms). We convert the total grams distributed per capita into morphine equivalent doses drawing on standard multipliers used by the Centers for Medicare & Medicaid Services (CMS)8 and Paulozzi et al. (2011) and aggregate by state and year.
While data on opioid use are difficult to find at the state level, the National Survey on Drug Use and Health (NSDUH) constructs estimates of self-reported nonmedical use of pain relievers by state from its annual survey of the civilian, noninstitutionalized population aged 12 and older. Although the NSDUH data are collected annually, the portal that provided access to the geocoded individual level data has been closed for nearly two years. We therefore make use of aggregated state-level estimates of non-medical use of pain reliever medication, which SAMHSA constructs using survey-weighted hierarchical Bayes estimation methodology applied to data that is pooled over two years to overcome problems associated with small area estimates. Due to the relatively short timeframe for this variable, we present regression estimates for nonmedical use but provide less information about pre-existing trends and lagged effects than in our other analyses.
Information on state medical marijuana laws were obtained via original legal research of state statutes and regulations as part of a series of projects funded by the National Institute on Drug Abuse and the Robert Wood Johnston Foundation over the past decade (Chriqui et al., 2002; Pacula, et al., 2002; Pacula et al., 2014). A state was identified as having a medical marijuana policy if it provided legal protections (affirmative defense) to physicians who wanted to discuss and/or recommend marijuana to their patients as well as to patients who wanted to use and/or possess marijuana for allowable conditions or symptoms permitted by the law.9 These policies were identified through Lexis/Nexis and state webpage searches. Once statutes meeting these criteria were identified, these statutes were then reviewed by legal scholars, economists, and policy analysts at RAND to determine whether the law contained specific provisions related to: (i) the conditions and/or symptoms for which medical marijuana would be allowed; (ii) whether the state required or recommended a patient (and subsequently caregiver) registry system, and (iii) the supply mechanism (if mentioned in the law) through which marijuana could be provided to patients (home cultivation by patient and/or caregiver, cooperatives, and dispensaries). States were categorized as legally permitting and protecting dispensaries if either (1) the statute or agency rules explicitly allowed for a dispensary, or (2) the statute or agency rules allowed for organizations that were functionally equivalent to dispensaries (e.g., allowing for qualified persons to associate under state law in order to collectively or cooperatively cultivate marijuana for medicinal purposes with no restrictions placed on membership).
Recent papers have identified in even greater detail how medical marijuana laws differ across states (Klieger et al., Forthcoming; Williams et al., 2016; Pacula et al., 2015), making it clear that simple indicators of adoption are inadequate for capturing how these laws may impact use (Sevigny et al., 2014; Pacula et al., 2014 and 2015) or the size of medical marijuana markets (Smart, 2016). Legal allowances for medical marijuana dispensaries are more strongly associated with adult marijuana use than medical marijuana laws per se (Pacula et al., 2010, 2015; Choi, 2014; Chu, 2014; Freisthler and Greunewald, 2014), as they provide legal protection to otherwise illegal entities, enabling them to spread openly throughout a state rather than operate discretely in specific jurisdictions where they are tolerated.
Because legal protection of retail dispensaries does not mean dispensaries are operational, we construct our policy measure to identify the state/year in which dispensaries are both legally protected and open for business. Our designation of states with active dispensaries comes from an extensive web search conducted from three primary sources: (1) webpages produced by marijuana advocacy groups either informing patients of where to get marijuana or linking to dispensary webpages, such as Weedmaps, the National Organization for the Reform of Marijuana Laws (www.norml.org), Marijuana Policy Project (www.mpp.org)10; (2) key word searches of old local newspapers and weekly circulars, using terms such as “medical marijuana” and “dispensary” or “cooperative”; and (3) state agency webpages responsible for licensing and regulating marijuana dispensaries. Information on the earliest month and year in which an operating dispensary could be identified from one of these sources was coded for each state. When dispensaries were identified as operating prior to the adoption of a law granting legal protections to dispensaries (e.g., Michigan, California and Colorado), we simply coded our (active + legal) policy variable as zero until the state adopted a law providing legal protections, at which point this policy turned on with the law. If dispensaries were not open prior to state adoption of legal protections (e.g., New York, Massachusetts), then this (active + legal) policy variable is turned on at the later date when the first dispensary is known to be operating (generally identified by the state licensing agency as well as news reports around the opening). We report our enactment and operational dispensary dates in Appendix Table 1.
We also distinguish between the periods before versus after 2010. We do this because of important differences in dispensary provisions over time that may be related to an October 2009 Obama administration policy (Smart, 2016). Specifically, the 2009 Ogden memo, sent from the Department of Justice to all US Attorney Generals, deprioritized the federal prosecution of medical marijuana users and suppliers who were in clear and unambiguous compliance with existing state laws. Perhaps as a result, the dispensary policies crafted after 2010 look quite different from earlier policies (Pacula and Smart, 2017). While early adopting states (e.g., California, Colorado, and Washington) took relatively lax approaches to regulating dispensaries, later states adopted stringent guidelines that were more consistent with traditional medical care and pharmaceutical regulation (Pacula and Smart, 2017; Williams et al., 2016). Studies conducted using variation in the adoption of these later laws generally do not find as strong a statistical association between dispensaries and adult use (Wen et al., 2015; Smart, 2016). In contrast, states with loosely regulated systems experience large increases in marijuana use and marijuana-involved harms, even in the latter period, due to rapid commercialization that occurred because of weak state regulation (Smart, 2016; Davis et al., 2016; Ghosh et al., 2015).
Descriptive Patterns
Our time period includes an unprecedented rise in opioid supply, substance abuse treatment admissions, and overdoses involving opioids. In Figure 1, we show these trends for all available years. We normalize all trends to 100 in year 2000 to more clearly demonstrate the dramatic increase in opioid distribution and harm over our sample period. From 2000 to 2012, opioid-related treatment admissions more than quadrupled. Mortality and distribution more than tripled. We show trends for overdoses involving prescription opioids (T40.2-T40.4) but excluding heroin. Heroin-related mortality experienced dramatic growth starting in 2011, motivating our analysis to study how effect sizes change when heroin is also examined.
Figure 1:
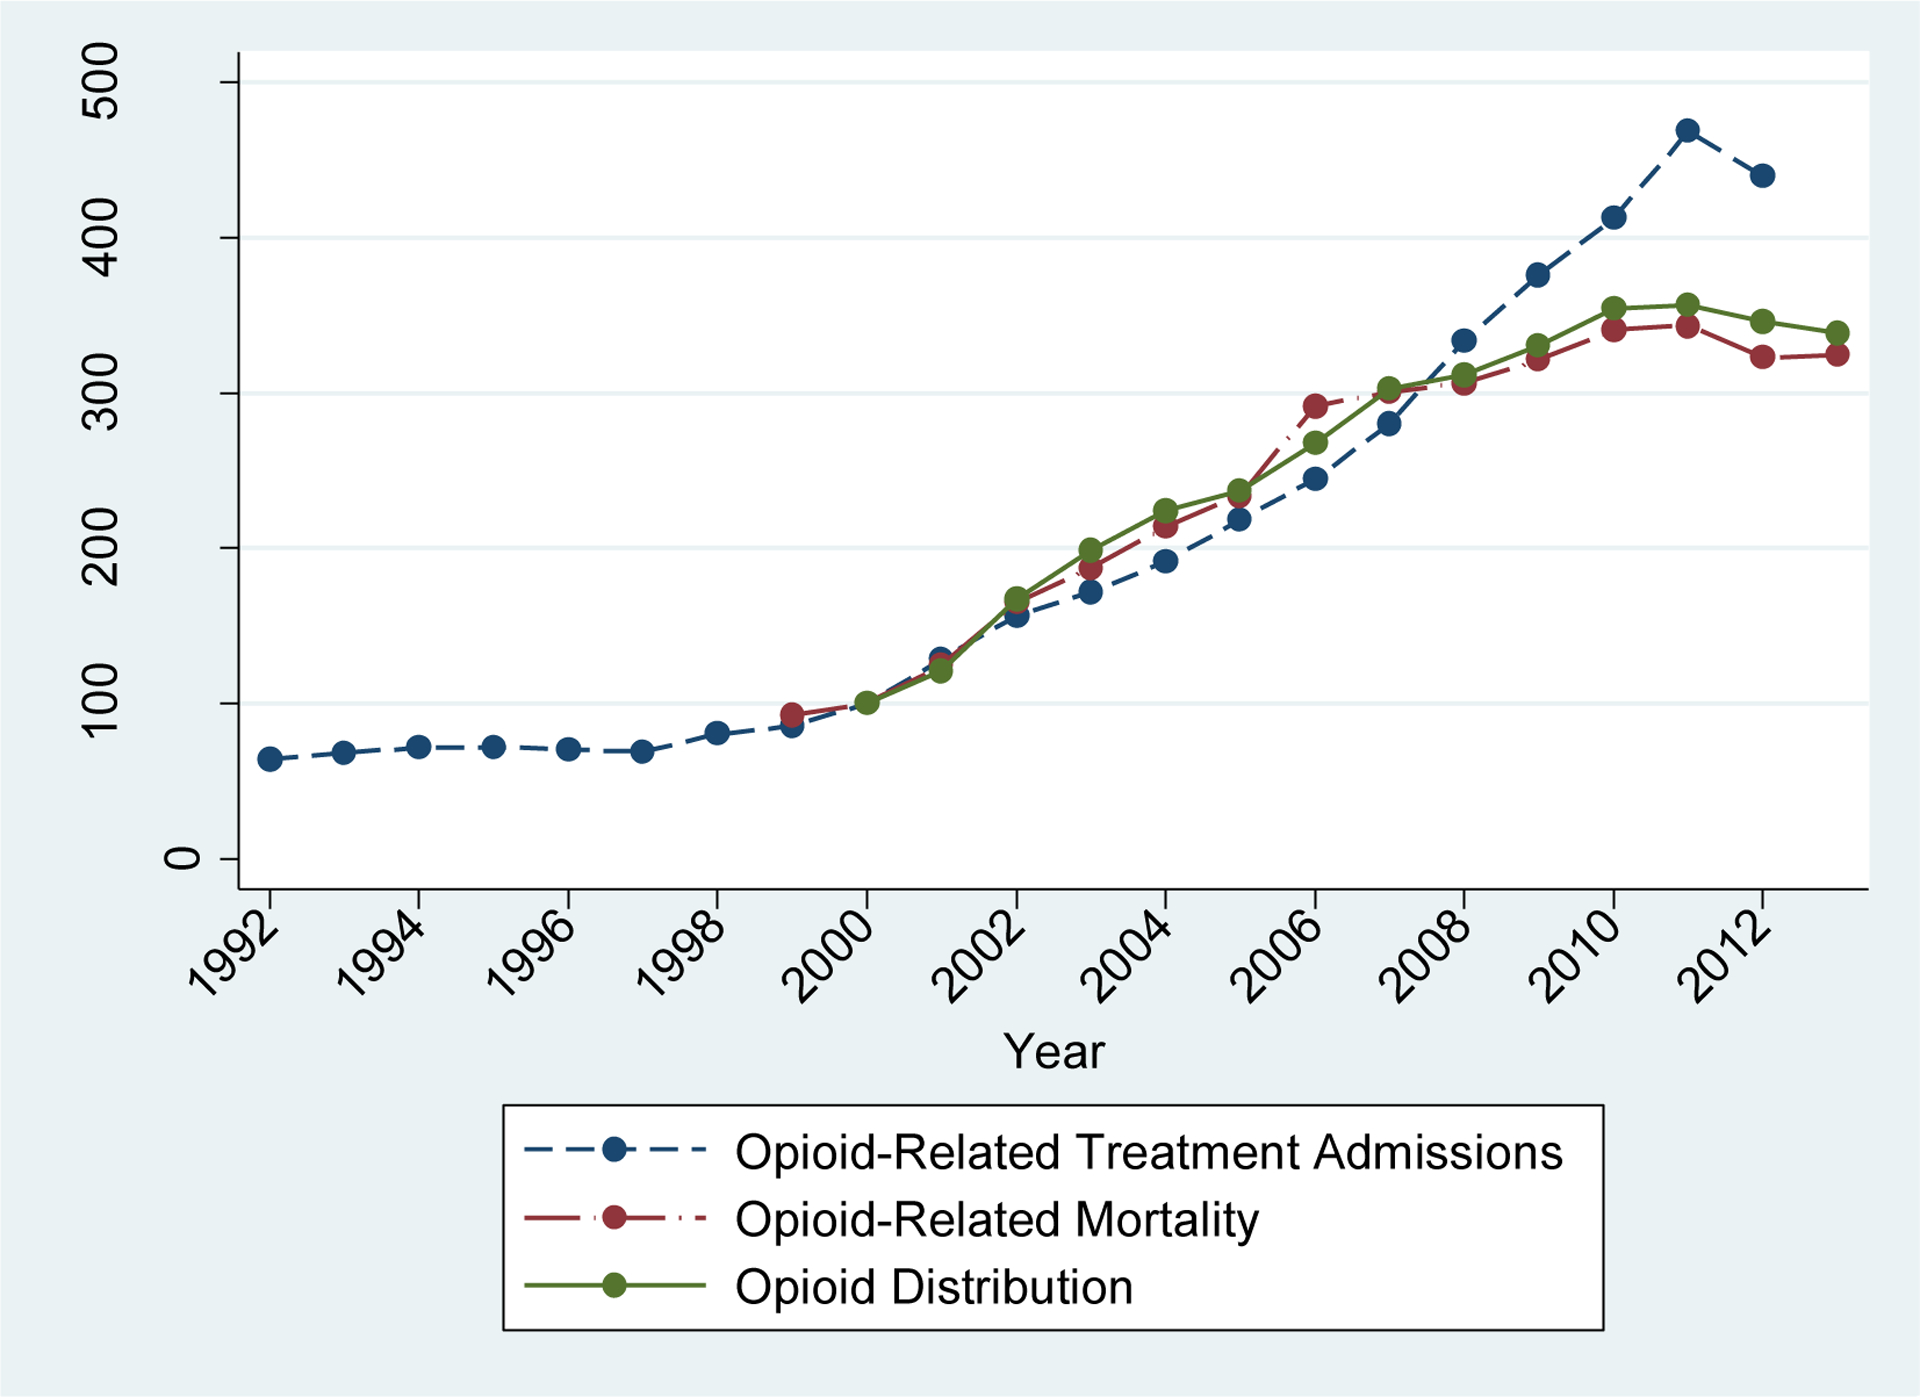
Time Series Trends
Notes: Treatment Admissions are from TEDS (1992–2012); Mortality data are from NVSS (1999–2013); Distribution data are from ARCOS (2000–2013).
Given the dramatic trends in Figure 1, it is important to account for national time effects. Opioid-related outcomes increased even as more states legalized medical marijuana and permitted dispensaries. We will study the differential outcomes in these states compared to states without medical marijuana laws and/or without legal and active dispensaries.
III. Empirical Strategy
The basis of our empirical strategy is to compare changes in opioid-related mortality and treatment admissions in states adopting medical marijuana laws to those not adopting these laws. We use the timing of adoption of the marijuana policy for identification. Our primary approach is to use (1) a difference-in-differences strategy that uses non-adopting states as controls and differential timing of adoption to estimate the effect and (2) an event study analysis that estimates effects by year relative to year of adoption to assess the credibility that our estimates are causal.
Our first approach, the traditional difference-in-differences framework, compares changes in outcomes within adopting states to those in non-adopting states. We implement this strategy by including state fixed effects and year fixed effects in the following specification:
| (1) |
where yst represents an outcome, such as opioid overdose deaths per 100,000 of the population within state s at time t. The vector MML represents our two indicators for state medical marijuana laws: (1) any law and (2) operational and legally-protected dispensaries (equal to one in the first full year). Xst is a vector of time-varying covariates, including demographics that are associated with prescription drug misuse: the percentage of the state population that is male, the age distribution within the state, and the percentage of the state population that is white (CDC, 2011b). In addition, we control for the state unemployment rate, which might influence access to insurance/ability to pay for prescription drugs, and the state alcohol tax rate. We also include an indicator for whether a state has a “must access” state-level prescription drug monitoring program (PDMP). Nineteen states had operational PDMPs from 1999 to 2005 but these programs grew rapidly after 2005 with nearly all states having them by 2011. Although some studies have found little effect of these laws generally (Brady et al., 2014; Paulozzi et al., 2011), recent studies have identified specific elements of these laws that make them more effective at reducing opioid related harm (Buchmueller and Carey, 2017; Patrick et al., 2016; Pardo, 2016). Buchmueller and Carey (2017) find that “must access” PDMPs, those that require providers to access the PDMP under certain circumstances,11 are effective in reducing measures of doctor shopping and abuse. In robustness tests, we have included other PDMP dimensions as well and found that our results are not meaningfully changed. Finally, we include an indicator variable equal to one if the state has a pill mill law.
Table 1 provides descriptive statistics on all the measures used in our analyses, broken out by status and period of medical marijuana law adoption, with states that adopted a law by 2009 shown in column (1); those that adopted in 2010 or later shown in column (2); and those that did not adopt during our study period shown in column (3). States that were late in adopting medical marijuana laws had lower total opioid deaths and, specifically, prescription opioid deaths than states that were early medical marijuana adopters. Never adopters had rates between the late and early adopters for prescription opioid deaths. While late adopting states had lower opioid mortality rates and slightly lower non-medical use rates (from NSDUH), they had substantially higher rates of opioid treatment admissions (from TEDS) and higher opioid distribution, reported in per capita morphine milligram equivalents (from ARCOS) than either early adopters or never adopter states. Finally, only 6 of the 14 early adopting states passed laws during the entire time period allowing dispensaries, while nearly all late adopting states did so. Importantly, however, fewer of these late adopting states had stores that were actually open during our time period at least in part because of more stringent state regulation of these entities.
Table 1:
Descriptive Statistics for Data Used in Analyses (1999 – 2013)
| Early Adopters | Late Adopters | Never Adopters | |
|---|---|---|---|
| Prescription Opioid Deaths per 100,000 | 4.55 | 3.27 | 4.05 |
| Total Opioid Deaths per 100,000 | 5.53 | 4.82 | 4.80 |
| Opioid Treatment Admission per 100,000 | 54.11 | 84.33 | 50.95 |
| Nonmedical Pain Reliever Use per 100 | 5.25 | 4.51 | 4.60 |
| Morphine Milligram Equivalents per capita | 584.90 | 679.01 | 589.94 |
| % Male | 49.56% | 48.77% | 48.96% |
| % 18–64 | 63.15% | 62.57% | 62.31% |
| % 65+ | 11.83% | 13.54% | 13.11% |
| % White | 77.99% | 80.86% | 79.78% |
| Beer Tax | 0.22 | 0.14 | 0.29 |
| Unemployment Rate | 7.04 | 6.02 | 6.07 |
| PDMP Must Access | 0.01 | 0.01 | 0.02 |
| Pill Mill Law | 0.00 | 0.00 | 0.07 |
| Population | 54,71,199 | 43,23,484 | 62,91,445 |
| Number of states | 14 | 6 | 31 |
| Number of states legally protecting dispensaries | 6 | 5 | |
| Number of states with active, legal dispensaries | 6 | 3 |
Notes: Population weighted
Equation (1) represents a log-linear regression model. We rely primarily on unweighted regressions to compare our results to Bachhuber et al. (2014), though we include population-weighted estimates in the Appendix. Following Santos Silva and Tenreyro (2006), which shows that a Poisson regression model allows for both multiplicative and additive error terms,12 we also present Poisson regression models results, which are similar, in the Appendix. In all models, we adjust our standard errors for clustering at the state-level.13
We also employ a complementary event study approach to estimate lagged effects while testing for pre-existing trends. For this approach, we estimate equation (1) while allowing for differential effects of the MML variables based on the time relative to adoption. We will include seven indicators per MML dimension, representing 6 years or more before adoption, 5 to 4 years prior to adoption, 3 to 2 years prior to adoption, the year before and year of adoption, 1 to 2 years after adoption, 3 to 4 years after adoption, and 5 or more years after adoption. We include these seven indicators for medical marijuana laws and legal and active dispensaries and estimate event studies jointly.
IV. Results
IV.A. The Availability of Medical Marijuana on Measures of Opioid Harm
We start by revisiting the Buchhuber et al. (2014) finding that MML adoption is associated with a decline in the opioid-related mortality rate. There are a few differences between our approach and the model estimated in Buchhuber et al. (2014) - for example, we do not age-adjust the death rates and we include some additional controls, such as an indicator for a “must access” PDMP.14 Although we do not expect our coefficient estimates to be identical, we do expect and obtain very similar results, as seen in Table 2. Our estimate, presented in the first column of Table 2, is −0.23. This implies that medical marijuana law adoption decreases the opioid mortality rate by 21%,15 similar to the Bachhuber et al. (2014) estimate of a 25% reduction.
Table 2:
Log Opioid-Related Mortality Rate
| Prescription Opioids Only | Prescription Opioids and Heroin | |||||
|---|---|---|---|---|---|---|
| Years | 1999–2010 | 1999–2013 | 1999–2013 | 1999–2010 | 1999–2013 | 1999–2013 |
| Sample | All States | All States | No LateAdopters | All States | All States | No LateAdopters |
| Panel A: With State and Year Fixed Effects Only | ||||||
| MML | −0.230* | −0.115 | −0.231* | −0.202 | −0.104 | −0.245* |
| (0.115) | (0.106) | (0.128) | (0.121) | (0.111) | (0.131) | |
| Panel B: With State and Year Fixed Effects and Covariates | ||||||
| MML | −0.180 | −0.084 | −0.231* | −0.220* | −0.106 | −0.255* |
| (0.120) | (0.109) | (0.131) | (0.126) | (0.118) | (0.140) | |
| Pre-MML Mean | 3.64 | 3.76 | 4.54 | 4.72 | 4.92 | 5.47 |
| Observations | 612 | 765 | 675 | 612 | 765 | 675 |
Notes:
p<0.10,
p<0.05,
p<0.01
All regressions include state and year fixed effects. Time-varying state-specific covariates: share of the population that is male; share that is white; age distribution, state unemployment rate, state alcohol tax rate, an indicator for state-level “must access” prescription drug monitoring program, and an indicator for a state pill mill law. Standard errors allow for clustering at the state level. Pre-MML Mean is average (unweighted) number of overdoses per 100,000 before MML adoption in states adopting MMLs.
When we add time-varying state-specific covariates, in particular our state-level PDMP variables, pill mill laws, alcohol tax rate, unemployment rate and population demographics, our estimate of the impact of having any medical marijuana laws decreases to −0.18, statistically insignificant from zero. Moreover, when we extend the analysis sample to include just three more years of data (adding 2010–2013), the estimate of the effect of having any medical marijuana law further decreases in magnitude (to −0.084 with covariates) and is similarly statistically indistinguishable from zero.
There are two possible reasons for the reduced effect when studying the longer time period. First, there may be differences in the types and effectiveness of medical marijuana laws adopted between 2010 and 2013 compared to the earlier laws. Second, the effects of the existing MMLs may have changed over time. We disentangle these two possibilities by reporting results using the full sample period while excluding states adopting MML during 2010–2013 (see column labeled “No Late Adopters”). The magnitude of the coefficient on any medical marijuana law is similar to the estimate from the earlier time period (1999–2010), suggesting that the new MMLs have different associations with this outcome than the older MMLs. In the latter half of Table 2, we also include heroin deaths in our mortality measure. The pattern of results just described is similar, suggesting that the exclusion of heroin in our measure of opioid mortality is not the reason for the changing medical marijuana policy effects after 2010.
As described previously, a key difference between late and early adopters of medical marijuana laws is that although most state laws included medical marijuana dispensaries post the October 2009 release of the Ogden memo, these states tightly regulated dispensaries and significantly curtailed access to marijuana relative to early adopters (Pacula and Smart, 2017; Smart, 2016). To further probe the importance of dispensaries, we augment our models to include not only a medical marijuana law indicator but also a dispensary indicator. In all specifications including both the medical marijuana law indicator and an indicator for the presence of active and legal dispensaries, we report the significance of the sum of the parameters on these two variables in the bottom row. The sum is the total effect of active and legal dispensaries since having a medical marijuana law is a necessary condition for such dispensaries. As shown in Table 3, dispensaries - retail outlets that sell marijuana to qualified patients - contribute to the decline in opioid overdose death rates.
Table 3:
Log Opioid Related Mortality Rate
| Prescription Opioids Only | Prescription Opioids and Heroin | |||||||
|---|---|---|---|---|---|---|---|---|
| Years | 1999–2010 | 1999–2013 | 1999–2010 | 1999–2013 | ||||
| MML | −0.195* | −0.154 | −0.073 | −0.048 | −0.169 | −0.195 | −0.066 | −0.072 |
| (0.100) | (0.112) | (0.096) | (0.096) | (0.108) | (0.117) | (0.101) | (0.107) | |
| Active + Legal | −0.572*** | −0.520*** | −0.254** | −0.272** | −0.533*** | −0.498*** | −0.226* | −0.261** |
| Dispensaries | (0.082) | (0.131) | (0.117) | (0.112) | (0.099) | (0.163) | (0.117) | (0.119) |
| Time-varying covariates | No | Yes | No | Yes | No | Yes | No | Yes |
| Observations | 612 | 612 | 765 | 765 | 612 | 612 | 765 | 765 |
| P-value for sum | 0.00 | 0.00 | 0.03 | 0.05 | 0.00 | 0.00 | 0.08 | 0.06 |
Notes:
p<0.10,
p<0.05,
p<0.01
All regressions include state and year fixed effects. Regressions in the second column for each sample also include a set of time-varying state-specific covariates: share of the population that is male; share that is white; age distribution, state unemployment rate, state alcohol tax rate, an indicator for state-level “must access” prescription drug monitoring program, and an indicator for a state pill mill law. Active + legal dispensaries means that the state allows dispensaries to operate in the state and any regulatory hurdles to do so have been overcome. Standard errors allow for clustering at the state level. P-value for sum is the statistical significance of the sum of the two estimates reported in the column.
Using data from just the early period of these laws 1999–2010, dispensaries reduce opioid mortality rates by about 40%, above and beyond the reduction from marijuana laws alone. The total effect is estimated to be even larger. When we consider the full time period (1999–2013), the estimates imply that dispensaries reduce opioid mortality rates by about 20% while the main effect of having a law is relatively small in magnitude, implying declines of about 5%, and not statistically distinguishable from zero. Importantly, together - a marijuana law with a legal, operational dispensary provision - implies a statistically significant (at the 5% level) decline in overdose death rates of about 25%. Results that include heroin deaths in the outcome (the last 4 columns of Table 3) are again similar (with a p-value of 0.06 when using the full sample and including covariates). Results are similar when we use Poisson regression models (see Appendix Table 2). When we population-weight the regressions (see Appendix Table 3), we estimate statistically significant reductions at the 5% level (when all covariates are included) for both prescription opioid deaths and prescriptions opioids plus heroin.
Our focus on legal and operational dispensaries is motivated by the possible inadequacy of simply adopting a medical marijuana law without addressing the delivery of medicinal marijuana to patients. We can go a step further and study whether the simple act of legalization (at the state-level) of medical marijuana dispensaries is able to reduce overdose deaths, regardless of whether there are operational dispensaries. We present these estimates in Appendix Table 4. The impact of simply having a dispensary allowance in the law is small and statistically indistinguishable from zero when using the full time period (including the post-Ogden memo period). When compared to the results presented in Table 3, it is clear that operational dispensaries are critical, implying significant heterogeneity across states that are often coded uniformly as having a medical marijuana law.
Finally, it is also informative to study whether dispensaries differentially reduce “natural and semisynthetic opioid” deaths (e.g., oxycodone), synthetic opioid deaths (e.g., fentanyl), or heroin deaths.16 We present these estimates in Appendix Table 5. We estimate Poisson regression models for these outcomes because some state-years have no heroin deaths. As such, the appropriate comparisons are the results shown in Appendix Table 2. We find large and statistically significant reductions for overdoses involving natural and semisynthetic opioids but less evidence for synthetic opioids or heroin. This pattern of results makes sense if medical marijuana is more often used as a substitute for pain relievers such as oxycodone instead of fentanyl and heroin. It is also possible that the any effects for synthetic opioids and heroin occur with a lag that is not appropriately modelled in Appendix Table 4.
In Table 4, we present our analysis of treatment admissions from the TEDS data. We find no statistically significant relationship between simply having a medical marijuana law and pain reliever substance abuse treatment admissions, when separately accounting for states with active and legally-protected dispensaries. Estimates that do not include heroin are small and flip sign, from negative to positive, when we consider the whole time period. Estimates with heroin are larger in magnitude - implying reductions of about 11–13% - but are not statistically distinguishable from zero. In contrast, we find more support for an impact of dispensary allowances on admissions, particularly, when we include heroin in the outcome. The admission rate for opioids and heroin declines by about 38% as a result of operational dispensaries, above and beyond just having a law. The sum of the estimates for having a medical marijuana law and operational legal dispensaries is statistically distinguishable from zero at the 5% level. As we found for mortality, estimates of the effects of legal and active dispensaries on treatment admissions are similar when we use Poisson regression models (see Appendix Table 6) or population-weighted regressions (see Appendix Table 7). The findings for treatment admissions lend further support to the idea that access to marijuana through dispensaries curtailed the misuse of opioids.
Table 4:
Log Opioid Related Treatment Admission Rate
| Prescription Opioids Only | Prescription Opioids and Heroin | |||||||
|---|---|---|---|---|---|---|---|---|
| Years | 1999–2010 | 1999–2013 | 1999–2010 | 1999–2013 | ||||
| MML | −0.051 | −0.091 | 0.038 | 0.07 | −0.167 | −0.146 | −0.215 | −0.126 |
| (0.124) | (0.108) | (0.119) | (0.135) | (0.184) | (0.119) | (0.161) | (0.119) | |
| Active + Legal | −0.316** | −0.364*** | −0.161 | −0.238 | −0.681** | −0.577*** | −0.351 | −0.374* |
| Dispensaries | (0.120) | (0.122) | (0.176) | (0.166) | (0.265) | (0.129) | (0.286) | (0.214) |
| Time-varying covariates | No | Yes | No | Yes | No | Yes | No | Yes |
| Observations | 591 | 591 | 686 | 686 | 591 | 591 | 686 | 686 |
| P-value for sum | 0.02 | 0.00 | 0.57 | 0.44 | 0.01 | 0.00 | 0.06 | 0.05 |
Notes:
p<0.10,
p<0.05,
p<0.01
All regressions include state and year fixed effects. Regressions in the second column for each sample also include a set of time-varying state-specific covariates: share of the population that is male; share that is white; age distribution, state unemployment rate, state alcohol tax rate, an indicator for state-level “must access” prescription drug monitoring program, and an indicator for a state pill mill law. Active + legal dispensaries means that the state allows dispensaries to operate in the state and any regulatory hurdles to do so have been overcome. Standard errors allow for clustering at the state level. P-value for sum is the statistical significance of the sum of the two estimates reported in the column.
We also provide evidence about the potential for systematic reporting issues in Appendix Table 8. Instead of using the log of per capita opioid treatment admissions as the outcome, we use the log of the number of opioid treatment admissions divided by the total number of admissions in the state. If reporting issues or changes in treatment access are driving our results, then these should affect all types of treatment admissions and we should not observe similar effects when we scale opioid admissions by all admissions. Our results are generally similar to those in Table 4 using this alternative outcome, suggesting that we are estimating true changes in state-level abuse rates and not changes in the reporting of abuse. Though not shown here, the Appendix Table 8 results are also similar if we exclude treatment admissions for marijuana from the denominator.
IV.B. Medical Marijuana Laws and Nonmedical Use of Prescription Opioids
The findings above suggest that medical marijuana laws reduce the misuse of prescription opioids, as reflected in treatment admissions and overdose deaths, primarily through the allowance and opening of dispensaries. It is unclear however whether these reductions occur at the extensive or intensive margins. To more directly assess the impact of medical marijuana laws on the extensive margin (i.e., any use), we study the relationship between medical marijuana laws and self-reported measures of nonmedical use of pain relievers (in the past year) in the NSDUH. There are several known limitations of these data - they are self-reported, the “non-medical” qualifier is subject to interpretation, they exclude heroin and other non-prescription opiates, and they are constructed estimates from pooling two years of data to overcome small sampling areas. Nonetheless, they are the only direct measures of nonmedical use of opioids we have available at this time.
Table 5 presents the NSDUH estimates. These results are qualitatively consistent with the opioid misuse estimates above. Prior to 2011, we find a negative relationship between dispensary allowances and self-reported nonmedical use of pain relievers in the past year when compared to all states with any type of medical marijuana law. The sum of the effects for having a medical marijuana law and having legally-protected and operational dispensaries are, however, never statistically significant. Estimates that include data through 2012 are even more imprecise and often positive. Appendix Table 9 includes the same estimates but weighted by the NSDUH sample size.17 There is slightly stronger evidence of reduction in nonmedical pain reliever use, but we cannot reject that there is no effect.
Table 5:
Log Nonmedical Use of Prescription Opioids
| 2002–2010 | 2002–2012 | |||
|---|---|---|---|---|
| MML | 0.101 | 0.073 | 0.055 | 0.025 |
| (0.079) | (0.081) | (0.068) | (0.059) | |
| Active + Legal | −0.118* | −0.123 | −0.024 | −0.007 |
| Dispensaries | (0.066) | (0.085) | (0.046) | (0.063) |
| Time-varying covariates | No | Yes | No | Yes |
| Observations | 255 | 255 | 306 | 306 |
| P-value for sum | 0.83 | 0.60 | 0.69 | 0.82 |
Notes:
p<0.10,
p<0.05,
p<0.01
All regressions include state and year fixed effects. Regressions in the second column for each sample also include a set of time-varying state-specific covariates: share of the population that is male; share that is white; age distribution, state unemployment rate, state alcohol tax rate, an indicator for state-level “must access” prescription drug monitoring program, and an indicator for a state pill mill law. Active + legal dispensaries means that the state allows dispensaries to operate in the state and any regulatory hurdles to do so have been overcome. Standard errors allow for clustering at the state level. P-value for sum is the statistical significance of the sum of the two estimates reported in the column.
At best, the NSDUH evidence is somewhat suggestive of the possibility that the legal protection of medical marijuana dispensaries is associated with a reduction in nonmedical pain reliever use (i.e., use on the extensive margin). More realistically, they suggest little to no relationship between medical marijuana laws with active dispensaries and self-reported non-medical use of pain relievers. Given the limitations of the NSDUH measures discussed above, we caution against over-interpreting these results.
IV.C. Medical marijuana laws on measures of opioid distribution
While we have found evidence that medical marijuana dispensaries reduce opioid misuse, as measured by opioid overdose deaths and treatment admissions, the mechanism driving this result remains unclear. To shed further light on this, we consider the distribution of opioid analgesic medications to legal medical markets using the ARCOS data. Table 6 presents the results for morphine equivalent doses per capita of our 8 primary opioids of abuse pooled together. Across models and samples, we find little evidence that either marijuana laws per se or dispensaries reduce legal distribution at the state-level. Indeed, adopting a medical marijuana law is associated with an increase in legal distribution of opioids over the 1999–2010 time period, the same years in which we see this policy reduce mortality and treatment admissions. Results through 2013 are much smaller in magnitude and never statistically distinguishable from zero. Likewise, over the full period, the combined estimate for marijuana laws and dispensary provisions are not significantly different from zero. These results indicate that our findings for overdose deaths and treatment admissions are not driven by a decrease in the legal supply of opioids. This implies that access to medical marijuana through dispensaries must decrease the harm from opioids (overdoses and addiction), but not necessarily the medical use of opioids and, given the results above, not necessarily misuse on the extensive margin.
Table 6:
Log Per Capita Prescription Opioid Distribution
| 2000–2010 | 2000–2013 | |||||||
|---|---|---|---|---|---|---|---|---|
| MML | 0.057** | 0.071** | 0.056** | 0.071** | 0.015 | 0.027 | 0.016 | 0.03 |
| (0.025) | (0.027) | (0.025) | (0.028) | (0.033) | (0.026) | (0.031) | (0.024) | |
| Active + Legal | 0.005 | −0.002 | −0.007 | −0.024 | ||||
| Dispensaries | (0.016) | (0.023) | (0.023) | (0.026) | ||||
| Time-varying covariates | No | Yes | No | Yes | No | Yes | No | Yes |
| Observations | 561 | 561 | 561 | 561 | 714 | 714 | 714 | 714 |
| P-value for sum | N/A | N/A | 0.03 | 0.05 | N/A | N/A | 0.84 | 0.88 |
Notes:
p<0.10,
p<0.05,
p<0.01
All regressions include state and year fixed effects. Regressions in the second column for each sample also include a set of time-varying state-specific covariates: share of the population that is male; share that is white; age distribution, state unemployment rate, state alcohol tax rate, an indicator for state-level “must access” prescription drug monitoring program, and an indicator for a state pill mill law. Active + legal dispensaries means that the state allows dispensaries to operate in the state and any regulatory hurdles to do so have been overcome. Standard errors allow for clustering at the state level. P-value for sum is the statistical significance of the sum of the two estimates reported in the column.
IV.D. Event Studies
Previous work has rarely explored whether medical marijuana law policy is endogenously related to trends in opioid harm. We use event study analysis to test for pre-existing trends as well as to understand whether medical marijuana access has immediate or lagged effects on opioid-related harm.
In Figure 2, we jointly estimate event studies for adoption of a medical marijuana law and for presence of legal and active dispensaries on per capita opioid-related mortality. For medical marijuana adoption (figure on the left), we see little pre- or post-adoption relationship with mortality rates, consistent with our aggregated findings presented above. On the right, we present the estimates for active and legal dispensaries. We find large and statistically significant reductions in opioid-related mortality after full implementation of legal and active dispensaries. This effect persists for the remainder of the post-adoption period. Further, the sum of the MML estimate and the dispensary estimate for the same time period (relative to adoption) is statistically significant at the 5% level in each post-adoption time period. These sums are never statistically significant in the pre-period. Overall, we observe little evidence that this reduction is driven by pre-existing trends.
Figure 2:
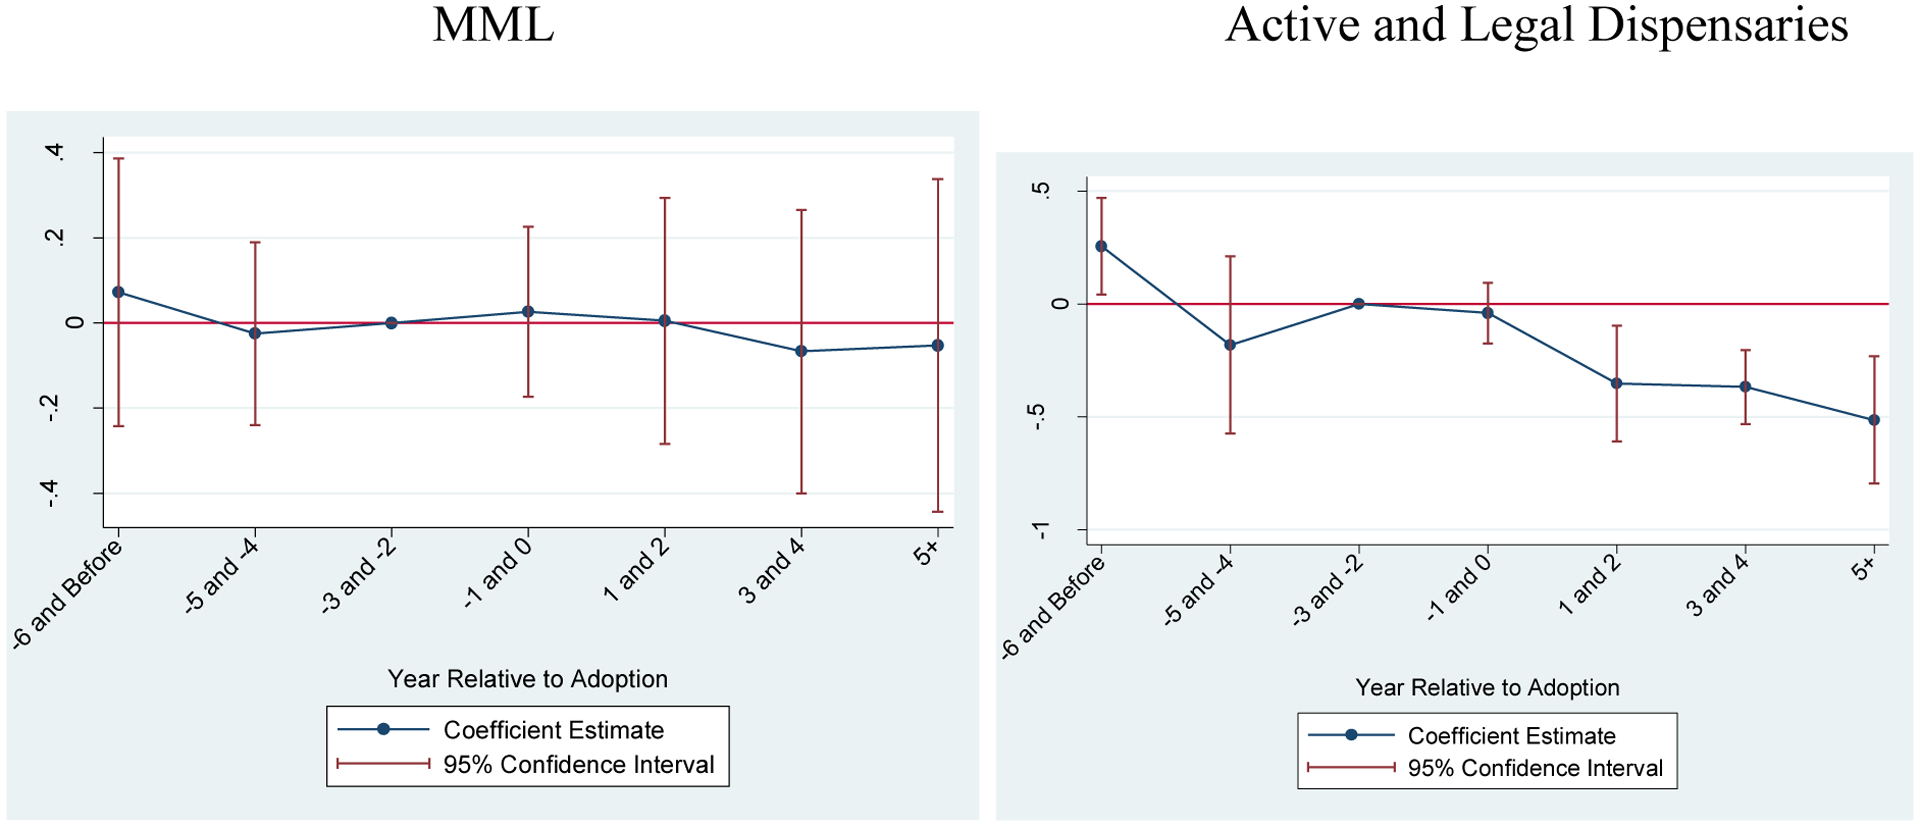
Event Studies for Per Capita Mortality
Notes: All estimates in both figures estimated jointly. Outcome is log of per capita opioid-related overdoses. Confidence intervals adjusted for within-state clustering. All time-varying covariates discussed in text included in regression.
Figure 3 presents the corresponding event studies for opioid-involved treatment admissions. Here, we observe suggestive evidence of long-term reductions in admissions associated with the adoption of any medical marijuana law. For legal and active dispensaries, we observe a downward trend beginning in the adoption years and continuing to 3–4 years post-adoption. The estimates in the post-period are statistically significant at the 5% level. When testing the significance of the sum of the MML estimates and the dispensary estimates in the same period, we can statistically reject (at the 5% level) that there is no effect in each period after adoption). As before, there is little evidence of pre-existing trends driving the results and we can never statistically reject that the sum of the parameters is equal to zero. While we previously noted concerns with reporting issues in the TEDS, it is unlikely that these would be so closely correlated with medical marijuana adoption and dispensary openings. Combined with our Appendix Table 8 results as previously-discussed, we find little evidence that any reporting issues in the TEDS are systematically affecting our results.
Figure 3:
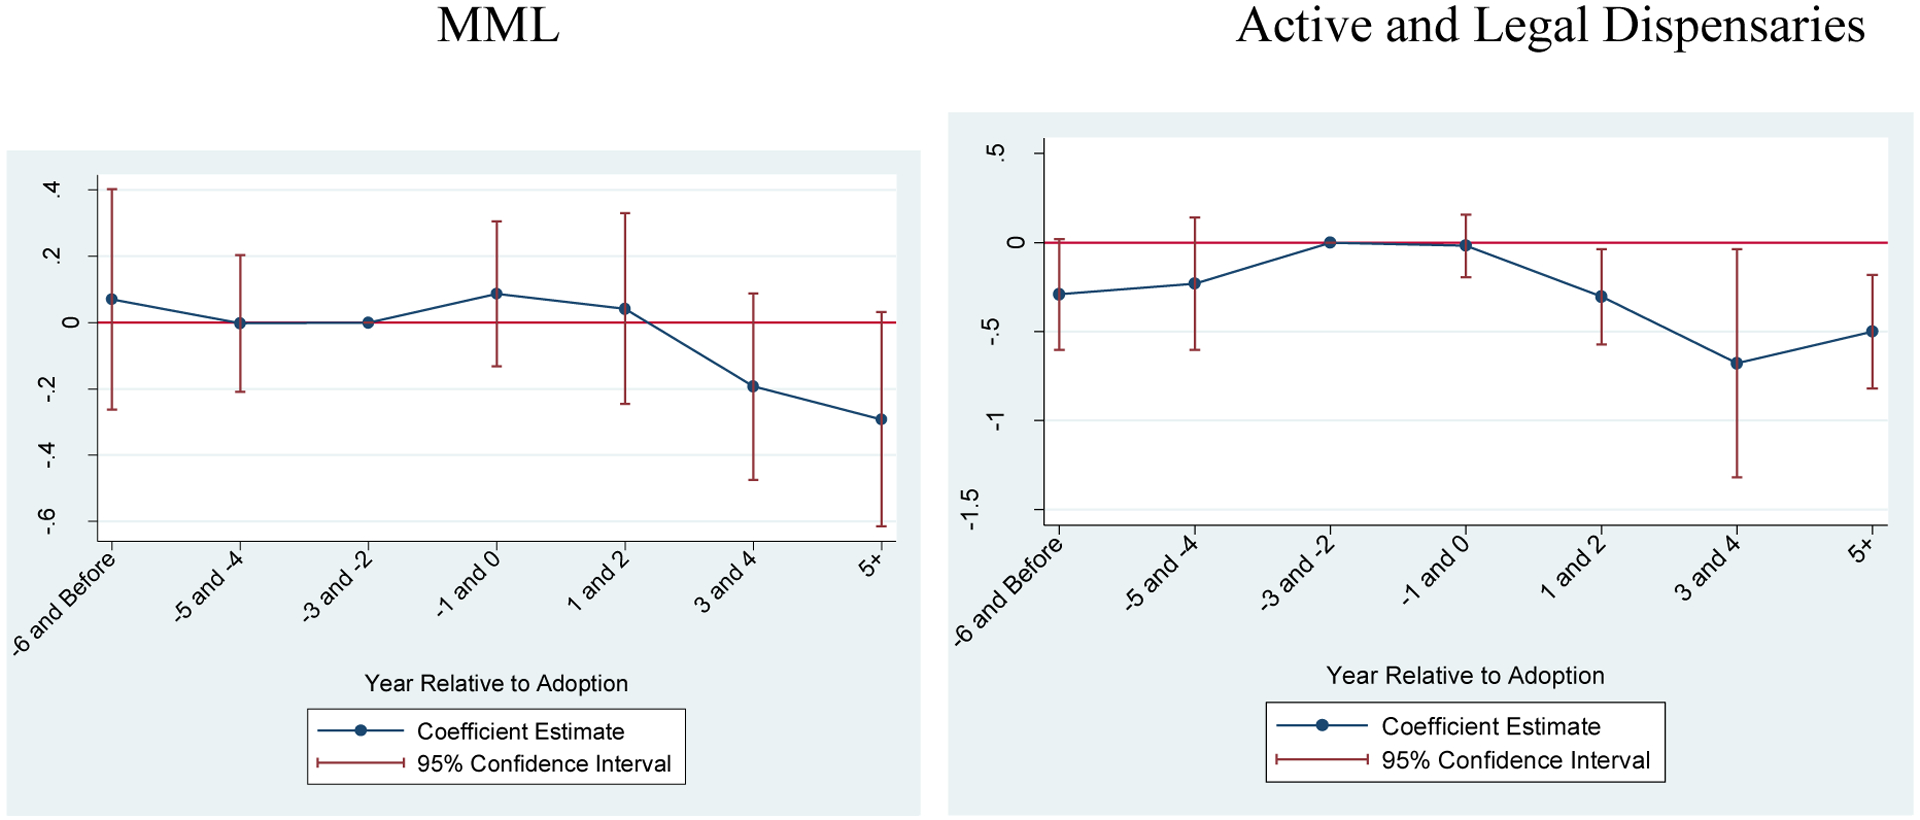
Event Studies for Per Capita Substance Abuse Treatment Admissions
Notes: All estimates in both figures estimated jointly. Outcome is log of per capita opioid-related substance abuse treatment admissions. Confidence intervals adjusted for within-state clustering. All time-varying covariates discussed in text included in regression.
Finally, we study per capita morphine equivalent doses and present the results in Figure 4. These estimates are consistent with a possible rise in opioid supply after adoption of a medical marijuana law. There is no differential effect in states with active and legal dispensaries as all of the estimates are statistically insignificant from zero.
Figure 4:
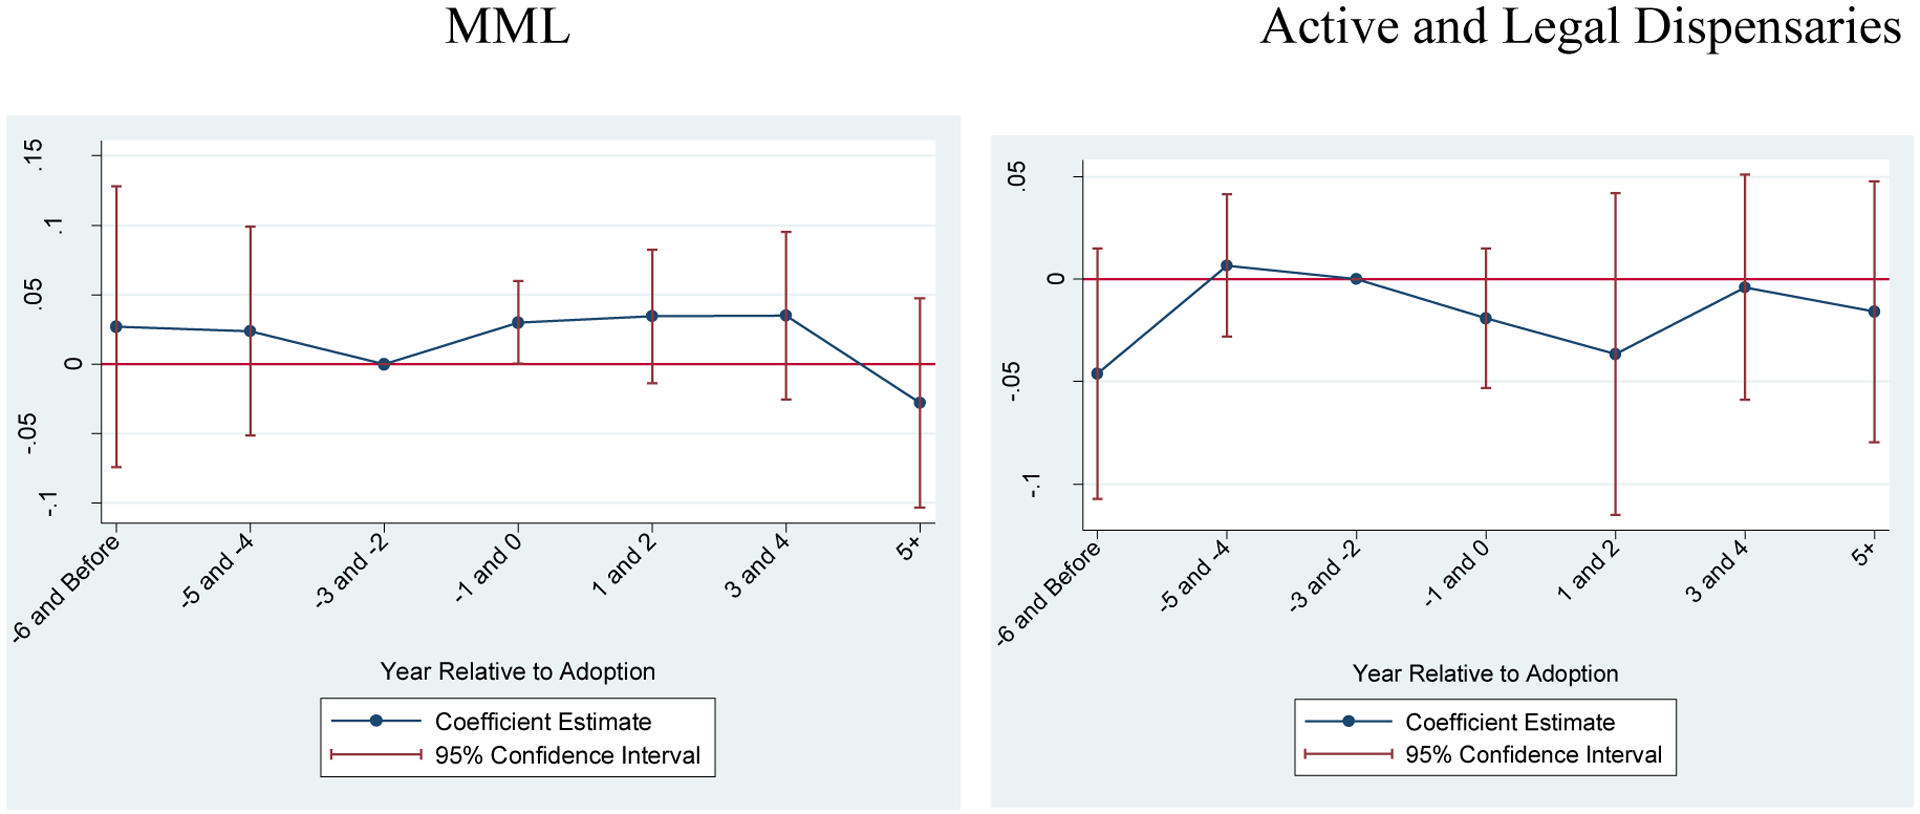
Event Studies for Per Capita Morphine Equivalent Doses
Notes: All estimates in both figures estimated jointly. Outcome is log of per capita morphine equivalent doses distributed to the state. Confidence intervals adjusted for within-state clustering. All time-varying covariates discussed in text included in regression.
V. Discussion and Conclusions
Considerable attention has been paid in the literature to the potential unintended consequences of medical marijuana laws, with people examining impacts of these policies on youth initiation, recreational marijuana use and abuse as well as drunk driving (Wen et al., 2015; Choi, 2014; Lynne-Landsman et al., 2013; Anderson, Hanson and Rees, 2013 & 2015; Pacula et al., 2015). In this paper we consider a potential unintended benefit of these laws: a reduction in the misuse of prescription opioids. While other work has considered this question, previous analyses (e.g., Bradford and Bradford, 2017; Bachhuber et al., 2014) have ignored the substantial heterogeneity in medical marijuana laws. In particular, they have not taken into account medical marijuana dispensary provisions, which enable access to marijuana through retail sales nor the changes in these provisions over time, as newly adopting states more tightly regulate dispensaries in response to Federal-state conflict over marijuana policy (Pacula and Smart, 2017; Smart, 2016).
We find fairly strong and consistent evidence using difference-in-differences and event study methods that states providing legal access to marijuana through dispensaries reduce deaths due to opioid overdoses, particularly prior to the October 2009 Ogden memo when dispensary systems were not tightly regulated by the states. We provide complementary evidence that dispensary provisions lower treatment admissions for addiction to pain medications. We find in all cases that the effectiveness of having any medical marijuana law completely disappears when data after 2010 are included. Furthermore, while we show that legally protected and active dispensaries remain an important factor in reduced opioid harm, the magnitude of even this component of the policy has changed since 2010, when states more actively and tightly regulated marijuana dispensaries and as the opioid epidemic has shifted toward heroin consumption.
While these findings are broadly consistent with prior studies (Bradford and Bradford, 2017, 2016; Shi, 2017; Bachhuber et al., 2014), our study differs in a few important ways. First, we consider the evolving nature of the medical marijuana policies in terms of the extent to which they provide broad or narrow access to patients. By simply adding 3 years of data to analyses to analyses consistent with Bachhuber et al. (2014), we show differences in the impact of having any medical marijuana law on opioid harm over time that had been previously ignored. Second, we demonstrate that the primary driver of the previous relationship was the presence of legally protected and operational dispensaries, which continue to have an impact on opioid related harm even with the inclusion of years of data after 2010. Our supplemental results confirm that legally protecting dispensaries alone, without accounting for whether they are operational, is not sufficient for identifying a relationship with opioid related harm. This evidence is consistent with the need for a clear and legal supply chain for medical marijuana policy to have an effect. Third, we thoroughly test the robustness of our findings by examining the consistency in our findings across several measures of harm (e.g., treatment admissions and mortality), functional form assumptions (log-linear and Poisson), and time periods (Pre-Ogden memo and post-Ogden memo). We also consider the influence of pre-policy trend differences in biasing the results by using event study methods.
Our paper augments the analysis of opioid-related harms with data on nonmedical use and distribution of prescription opioids. Analysis of self-reported nonmedical use in the NSDUH suggests little impact of dispensary provisions on the extensive margin of opioid misuse. We make this conclusion very cautiously given the sparseness and aggregate nature of the data, the non-medical qualifier to the survey question, and the self-reporting. Analysis of the effects of legally protected and operational dispensaries on the distribution of opioids to states (ARCOS) show no impact on the aggregate supply of prescription opioids. This suggests that pharmacies may stockpile or be generally slow to adjust their inventory or that there may be less illegal diversion when individuals can access marijuana through dispensaries. In short, our findings that legally protected and operating medical marijuana dispensaries reduce opioid-related harms suggests that some individuals may be substituting towards marijuana, reducing the quantity of opioids they consume or forgoing initiation of opiates altogether. With the current data, we are unable to disentangle the relative contribution of each effect.
Nonetheless, the fact that opioid harms decline in response to these policies raises some interesting questions as to whether marijuana liberalization may be beneficial for public health. Marijuana is a far less addictive substance than opioids and the potential for overdosing is nearly zero (Hall and Pacula, 2003). However, it remains unclear from our current analysis whether the findings we observe are short term or persist. In addition, we ultimately need to weigh any potential indirect benefits from medical marijuana dispensary provisions in terms of its implied reductions in opioid misuse (or other positive outcomes) against any potential negative impacts of these provisions on other factors, such as tobacco use and drugged driving. At a minimum, however, our results suggest a potential overlooked positive effect of dispensary-enabling medical marijuana laws.
Acknowledgments
This paper was supported by a grant from the National Institute on Drug Abuse to the RAND Corporation (R01DA032693). We appreciate helpful comments from participants of the 2013 Addiction Health Services Annual Meeting, the Drug Policy Research Center Seminar, the Vanderbilt Law School Drug Policy Roundtable Meeting, the Conference of the American Society of Health Economists, and the NBER Summer Institute. We received especially helpful suggestions from Abby Alpert, Donald Kenkel, Harold Pollack and three anonymous referees.
Appendix
Appendix Table 1:
Medical Marijuana Enactment and Active Dispensary Dates During Study Period
| State | Medical MJ Enactment Date | Medical MJ Effective Date | MJ Dispensary Legally Protected? (Date Dispensaries Became Legally Protected) | First Year MJ Dispensary Legally Protected & Active | Year MJ Dispensary is Known to be Active |
|---|---|---|---|---|---|
| Alaska | 11/3/1998 | 3/4/1999 | No | ||
| Arizona | 11/2/2010 | 11/29/2010 | Yes (12/14/2010) | Dec 2012 | 2012 |
| California | 11/5/1996 | 11/6/1996 | Yes (10/8/2003) | Jan 2004 | 1996 |
| Colorado | 11/7/2000 | 12/28/2000 | Yes (6/7/2010) | June 2010 | 2005 |
| Connecticut | 5/31/2012 | 10/1/2012 | Yes(10/1/2012) | Aug 2014 | 2014 |
| Delaware | 5/13/2011 | 5/13/2011 | Yes (5/13/2011) | ||
| Washington DC | 5/21/2010 | 7/27/2010 | Yes (7/27/2010) | Apr 2013 | 2013 |
| Hawaii | 6/16/2000 | 6/16/2000 | No | ||
| Illinois | 8/1/2013 | 1/1/2014 | Yes(1/1/2014) | ||
| Maine | 11/2/1999 | 12/23/1999 | Yes(12/4/2009) | Mar 2011 | 2011 |
| Maryland** | 5/22/2003 | 10/2/2003 | Yes(6/1/2014) | ||
| Massachusetts | 11/6/2012 | 1/1/2013 | Yes(5/24//2013) | ||
| Michigan | 11/4/2008 | 12/4/2008 | No | 2009 | |
| Minnesota | 5/29/2014 | 5/30/2014 | Yes(5/30/2014) | ||
| Montana | 11/2/2004 | 11/2/2004 | No | 2009 | |
| Nevada | 6/14/2001 | 10/1/2001 | Yes(7/1/2013) | Mar 2015 | 2009 |
| New Hampshire | 7/23/2013 | 7/23/2013 | Yes(7/23/2013) | ||
| New Jersey | 1/18/2010 | 6/1/2010 | Yes(7/1/2010) | Dec 2012 | 2012 |
| New Mexico | 4/3/2007 | 7/1/2007 | Yes(7/1/2007) | July 2009 | 2009 |
| New York | 7/5/2014 | 7/5/2014 | Yes(7/5/2014) | ||
| Oregon | 12/3/1998 | 12/3/1998 | Yes(8/14/2013) | Mar 2014 | 2009 |
| Rhode Island | 1/3/2006 | 1/3/2006 | Yes(6/16/2009) | Apr 2013 | 2013 |
| Vermont | 5/26/2004 | 7/1/2004 | Yes (6/2/2011) | June 2013 | 2013 |
| Washington | 11/3/1998 | 12/3/1998 | No | 2009 |
Notes:
Although Maryland passed a law on 5/22/2003 (effective10/2/2003) that provided legal protections to patients for possession/use of marijuana, no supply source was identified in the law. Therefore, most studies do not recognize this first law, and do not code MD as having a medical marijuana law until the June 2014 law passed, which did specify a supply source. As previous studies have not recognized the earlier law and one goal in this paper is to replicate results from the prior literature, we do not code Maryland as having a medical marijuana law during our study period.
States that adopted medical MJ policies outside of our time period are treated as “control states”, IL (2013), New York (2014) and Maryland (2014). In some instances, dispensaries were legally allowed in subsequent state policies that fell outside of our evaluation window (e.g. Oregon). In other cases, the state policy that passed medical marijuana did not provide immediate legal protection for dispensaries (as they had to go through a particular process (e.g. DC), or they emerged in subsequent law (e.g. CA).
Appendix Table 2:
Poisson Regression Models of Opioid Related Mortality
| Prescription Opioids Only | Prescription Opioids and Heroin | |||||||
|---|---|---|---|---|---|---|---|---|
| Years | 1999–2010 | 1999–2013 | 1999–2010 | 1999–2013 | ||||
| MML | 0.040 | 0.018 | 0.133 | 0.058 | 0.119 | 0.057 | 0.159 | 0.068 |
| (0.157) | (0.137) | (0.098) | (0.087) | (0.175) | (0.166) | (0.098) | (0.100) | |
| Active + Legal | −0.478*** | −0.420*** | −0.348*** | −0.291*** | −0.410*** | −0.349*** | −0.316*** | −0.241*** |
| Dispensaries | (0.051) | (0.073) | (0.098) | (0.075) | (0.071) | (0.093) | (0.101) | (0.086) |
| Time-varying covariates | No | Yes | No | Yes | No | Yes | No | Yes |
| Observations | 612 | 612 | 765 | 765 | 612 | 612 | 765 | 765 |
| P-value for sum | 0.00 | 0.00 | 0.08 | 0.02 | 0.12 | 0.10 | 0.24 | 0.15 |
Notes:
p<0.10,
p<0.05,
p<0.01
All regressions include state and year fixed effects. Regressions in the second column for each sample also include a set of time-varying state-specific covariates: share of the population that is male; share that is white; age distribution, state unemployment rate, state alcohol tax rate, an indicator for state-level “must access” prescription drug monitoring program, and an indicator for a state pill mill law. The log of the population is used as an offset. Active + legal dispensaries means that the state allows dispensaries to operate in the state and any regulatory hurdles to do so have been overcome. Standard errors allow for clustering at the state level. P-value for sum is the statistical significance of the sum of the two estimates reported in the column.
Appendix Table 3:
Log Opioid Related Mortality Rate (Population-Weighted Regressions)
| Prescription Opioids Only | Prescription Opioids and Heroin | |||||||
|---|---|---|---|---|---|---|---|---|
| Years | 1999–2010 | All | 1999–2010 | All | ||||
| MML | −0.062 | −0.198** | 0.137 | −0.022 | −0.057 | −0.248** | 0.088 | −0.092 |
| (0.150) | (0.093) | (0.104) | (0.076) | (0.151) | (0.109) | (0.095) | (0.077) | |
| Active + Legal | −0.484*** | −0.399*** | −0.404*** | −0.317*** | −0.420*** | −0.349** | −0.379*** | −0.275** |
| Dispensaries | (0.062) | (0.116) | (0.105) | (0.100) | (0.077) | (0.133) | (0.109) | (0.116) |
| Time-varying covariates | No | Yes | No | Yes | No | Yes | No | Yes |
| Observations | 612 | 612 | 765 | 765 | 612 | 612 | 765 | 765 |
| P-value for sum | 0.00 | 0.00 | 0.10 | 0.03 | 0.02 | 0.00 | 0.07 | 0.03 |
Notes:
p<0.10,
p<0.05,
p<0.01
All regressions include state and year fixed effects. Regressions in the second column for each sample also include a set of time-varying state-specific covariates: share of the population that is male; share that is white; age distribution, state unemployment rate, state alcohol tax rate, an indicator for state-level “must access” prescription drug monitoring program, and an indicator for a state pill mill law. Active + legal dispensaries means that the state allows dispensaries to operate in the state and any regulatory hurdles to do so have been overcome. Standard errors allow for clustering at the state level. P-value for sum is the statistical significance of the sum of the two estimates reported in the column.
Appendix Table 4:
Any Dispensary Law and Log Opioid Related Mortality Rate
| Prescription Opioids Only | Prescription Opioids and Heroin | |||||||
|---|---|---|---|---|---|---|---|---|
| Years | 1999–2010 | 1999–2013 | 1999–2010 | 1999–2013 | ||||
| MML | −0.177* | −0.137 | −0.075 | −0.046 | −0.153 | −0.179 | −0.062 | −0.064 |
| (0.103) | (0.111) | (0.109) | (0.101) | (0.110) | (0.118) | (0.113) | (0.112) | |
| Dispensary law | −0.405*** | −0.379*** | −0.097 | −0.105 | −0.371*** | −0.371*** | −0.098 | −0.116 |
| (0.111) | (0.104) | (0.141) | (0.125) | (0.105) | (0.116) | (0.136) | (0.130) | |
| Time-varying covariates | No | Yes | No | Yes | No | Yes | No | Yes |
| Observations | 612 | 612 | 765 | 765 | 612 | 612 | 765 | 765 |
| P-value for sum | 0.00 | 0.00 | 0.25 | 0.34 | 0.00 | 0.00 | 0.29 | 0.28 |
Notes:
p<0.10,
p<0.05,
p<0.01
All regressions include state and year fixed effects. Regressions in the second column for each sample also include a set of time-varying state-specific covariates: share of the population that is male; share that is white; age distribution, state unemployment rate, state alcohol tax rate, an indicator for state-level “must access” prescription drug monitoring program, and an indicator for a state pill mill law. Active + legal dispensaries means that the state allows dispensaries to operate in the state and any regulatory hurdles to do so have been overcome. Standard errors allow for clustering at the state level. P-value for sum is the statistical significance of the sum of the two estimates reported in the column.
Appendix Table 5:
Effects by Opioid Category
| Natural Opioids | Synthetic Opioids | Heroin | |
|---|---|---|---|
| MML | 0.025 | −0.092 | 0.053 |
| (0.096) | (0.127) | (0.204) | |
| Active + Legal | −0.407*** | −0.035 | −0.192 |
| Dispensaries | (0.088) | (0.103) | (0.149) |
| Time-varying covariates | Yes | Yes | Yes |
| Observations | 765 | 765 | 765 |
| P-value for sum | 0.00 | 0.41 | 0.54 |
Notes:
p<0.10,
p<0.05,
p<0.01
All regressions include state and year fixed effects. Regressions in the second column for each sample also include a set of time-varying state-specific covariates: share of the population that is male; share that is white; age distribution, state unemployment rate, state alcohol tax rate, an indicator for state-level “must access” prescription drug monitoring program, and an indicator for a state pill mill law. Active + legal dispensaries means that the state allows dispensaries to operate in the state and any regulatory hurdles to do so have been overcome. Standard errors allow for clustering at the state level. P-value for sum is the statistical significance of the sum of the two estimates reported in the column.
Appendix Table 6:
Poisson Regression Models of Opioid Treatment Admissions
| Prescription Opioids Only | Prescription Opioids and Heroin | |||||||
|---|---|---|---|---|---|---|---|---|
| Years | 1999–2010 | 1999–2012 | 1999–2010 | 1999–2012 | ||||
| MML | 0.013 | −0.076 | 0.093 | 0.014 | −0.077 | −0.037 | −0.052 | −0.077 |
| (0.071) | (0.084) | (0.091) | (0.109) | (0.107) | (0.073) | (0.092) | (0.055) | |
| Active + Legal | −0.322*** | −0.336*** | −0.173 | −0.253** | −0.688*** | −0.507*** | −0.604*** | −0.468*** |
| Dispensaries | (0.048) | (0.066) | (0.123) | (0.114) | (0.060) | (0.058) | (0.148) | (0.076) |
| Time-varying covariates | No | Yes | No | Yes | No | Yes | No | Yes |
| Observations | 612 | 612 | 765 | 765 | 612 | 612 | 765 | 765 |
| P-value for sum | 0.00 | 0.00 | 0.63 | 0.19 | 0.00 | 0.00 | 0.00 | 0.00 |
Notes:
p<0.10,
p<0.05,
p<0.01
All regressions include state and year fixed effects. Regressions in the second column for each sample also include a set of time-varying state-specific covariates: share of the population that is male; share that is white; age distribution, state unemployment rate, state alcohol tax rate, an indicator for state-level “must access” prescription drug monitoring program, and an indicator for a state pill mill law. The log of the population is used as an offset. Active + legal dispensaries means that the state allows dispensaries to operate in the state and any regulatory hurdles to do so have been overcome. Standard errors allow for clustering at the state level. P-value for sum is the statistical significance of the sum of the two estimates reported in the column.
Appendix Table 7:
Log Opioid Treatment Admission Rate (Population-Weighted Regressions)
| Prescription Opioids Only | Prescription Opioids and Heroin | |||||||
|---|---|---|---|---|---|---|---|---|
| Years | 1999–2010 | 1999–2012 | 1999–2010 | 1999–2012 | ||||
| MML | −0.078 | −0.225** | 0.166 | 0.054 | −0.085 | −0.185 | 0.026 | −0.057 |
| (0.086) | (0.103) | (0.171) | (0.182) | (0.136) | (0.115) | (0.168) | (0.158) | |
| Active + Legal | −0.387*** | −0.409*** | −0.305*** | −0.331*** | −0.842*** | −0.594*** | −0.747*** | −0.526*** |
| Dispensaries | (0.058) | (0.062) | (0.113) | (0.078) | (0.075) | (0.073) | (0.185) | (0.100) |
| Time-varying covariates | No | Yes | No | Yes | No | Yes | No | Yes |
| Observations | 591 | 591 | 686 | 686 | 591 | 591 | 686 | 686 |
| P-value for sum | 0.00 | 0.00 | 0.53 | 0.18 | 0.00 | 0.00 | 0.00 | 0.00 |
Notes:
p<0.10,
p<0.05,
p<0.01
All regressions include state and year fixed effects. Regressions in the second column for each sample also include a set of time-varying state-specific covariates: share of the population that is male; share that is white; age distribution, state unemployment rate, state alcohol tax rate, an indicator for state-level “must access” prescription drug monitoring program, and an indicator for a state pill mill law. The log of the population is used as an offset. Active + legal dispensaries means that the state allows dispensaries to operate in the state and any regulatory hurdles to do so have been overcome. Standard errors allow for clustering at the state level. P-value for sum is the statistical significance of the sum of the two estimates reported in the column.
Appendix Table 8:
Log (Opioid Related Treatment Admissions / All Treatment Admissions)
| Prescription Opioids Only | Prescription Opioids and Heroin | |||||||
|---|---|---|---|---|---|---|---|---|
| Years | 1999–2010 | All | 1999–2010 | All | ||||
| MML | −0.042 | −0.081 | 0.016 | 0.034 | −0.159 | −0.135 | −0.237* | −0.161 |
| (0.106) | (0.093) | (0.102) | (0.118) | (0.144) | (0.099) | (0.137) | (0.103) | |
| Active + Legal | −0.226** | −0.282** | −0.139 | −0.206 | −0.591** | −0.495*** | −0.330 | −0.342** |
| Dispensaries | (0.095) | (0.124) | (0.135) | (0.125) | (0.238) | (0.130) | (0.234) | (0.164) |
| Time-varying covariates | No | Yes | No | Yes | No | Yes | No | Yes |
| Observations | 591 | 591 | 686 | 686 | 591 | 591 | 686 | 686 |
| P-value for sum | 0.03 | 0.01 | 0.51 | 0.35 | 0.01 | 0.00 | 0.02 | 0.02 |
Notes:
p<0.10,
p<0.05,
p<0.01
All regressions include state and year fixed effects. Regressions in the second column for each sample also include a set of time-varying state-specific covariates: share of the population that is male; share that is white; age distribution, state unemployment rate, state alcohol tax rate, an indicator for state-level “must access” prescription drug monitoring program, and an indicator for a state pill mill law. The log of the population is used as an offset. Active + legal dispensaries means that the state allows dispensaries to operate in the state and any regulatory hurdles to do so have been overcome. Standard errors allow for clustering at the state level. P-value for sum is the statistical significance of the sum of the two estimates reported in the column.
Appendix Table 9:
Log Nonmedical Use of Prescription Opioids (Weighted)
| Years | 2002–2010 | 2002–2012 | ||
|---|---|---|---|---|
| MML | 0.145* | 0.082 | 0.050 | 0.024 |
| (0.080) | (0.093) | (0.080) | (0.106) | |
| Active + Legal | −0.142*** | −0.157*** | −0.079 | −0.109 |
| Dispensaries | (0.034) | (0.042) | (0.048) | (0.070) |
| Time-varying covariates | No | Yes | No | Yes |
| Observations | 255 | 255 | 306 | 306 |
| P-value for sum | 0.97 | 0.46 | 0.75 | 0.48 |
Notes:
p<0.10,
p<0.05,
p<0.01
All regressions include state and year fixed effects. Regressions in the second column for each sample also include a set of time-varying state-specific covariates: share of the population that is male; share that is white; age distribution, state unemployment rate, state alcohol tax rate, an indicator for state-level “must access” prescription drug monitoring program, and an indicator for a state pill mill law. Active + legal dispensaries means that the state allows dispensaries to operate in the state and any regulatory hurdles to do so have been overcome. Standard errors allow for clustering at the state level. P-value for sum is the statistical significance of the sum of the two estimates reported in the column.
Footnotes
Publisher's Disclaimer: This is a PDF file of an unedited manuscript that has been accepted for publication. As a service to our customers we are providing this early version of the manuscript. The manuscript will undergo copyediting, typesetting, and review of the resulting proof before it is published in its final citable form. Please note that during the production process errors may be discovered which could affect the content, and all legal disclaimers that apply to the journal pertain.
https://www.drugabuse.gov/sites/default/files/overdose_data_1999-2015.xls(last accessed July 31, 2017)
For the purposes of the work we present in this paper, we are adopting the medical definitions of “opiate” and “opioid”, using “opiate” to refer to the broad class of narcotics that include both natural opiates derived from the opium plant, such as heroin, as well as semi-synthetic and synthetic opioids frequently produced by prescription drug companies (e.g., hydrocodone, oxymorphone, and even fentanyl). The term “opioid” is used to refer to synthetic narcotics that have opiate-like properties typically patented as a prescription drug, but are not derived from opium. However, there are some naturally derived prescription drugs as well, including morphine and codeine so, consistent with the CDC, we will use the term “opioid analgesics” when referring to these prescription drugs. When referring to findings from other research, however, we maintain the language used in that original work (or used by the CDC/NIDA to describe the overall “opioid epidemic”).
As medical marijuana is a Schedule I drug on the federal Controlled Substance Act, it cannot be prescribed by a licensed physician (as that would put the physician at risk of losing his license). Thus, state laws instead require “recommendations” by physicians, which can either be a verbal or written statement by a physician stating that it is their professional opinion that marijuana may be of medical benefit to the patient.
Kim et al. (2016) analyzes only laws that allow for medical marijuana access through one’s own or collective cultivation or through dispensaries but does not distinguish across these types of access channels. Shi (2017) tests for differential effects of dispensary operations (though not necessarily legal) on hospitalizations. Both papers use only a subset of states - 27 in Shi (2017) and 18 in Kim et al. (2016) - limiting the generalizability of the findings.
TEDS lists up to three substance of abuse per admission. We categorize as pain reliever admissions those for “non-prescription methadone” and “other opiates and synthetics,” which includes all non-heroin opiates such as buprenorphine, codeine, hydrocodone, hydromorphone, meperidine, morphine, opium, oxycodone, pentazocine, propoxyphene, tramadol, and any other drug with morphine-like effects.
The results are similar if we select on the 42 states that report in each year.
https://www.cms.gov/Medicare/Prescription-Drug-Coverage/PrescriptionDrugCovContra/Downloads/Opioid-Morphine-EQ-Conversion-Factors-March-2015.pdf(last accessed April 8, 2016)
When we initiated these searches back in 2000 and again in 2002 and 2008, there was no distinction in any of these laws between “high CBD” and “low CBD” marijuana. Thus, laws that have been adopted since 2014 that allow for only “high CBD/low THC” marijuana to be used are not included in our legal definition of a medical marijuana law.
Historical data from these webpages was also searched using the WayBack Machine (https://archive.org/web/).
These are also commonly referred to as mandatory access provisions.
It is commonly thought that Poisson regression assumes that the mean is equal to variance. While this is a feature of the Poisson distribution, it is not enforced in Poisson regression. See Santos Silva and Tenreyro (2006) for more details. Similar estimators (such as a negative binomial model) do require correctly specifying the variance, making Poisson regression more robust to misspecification (see Chapter 18 of Wooldridge (2010) for more details).
We also use a “small sample” adjustment to scale up our standard errors since we only have 51 clusters.
We also use the CDC’s definition of opioid-related deaths, while Buchhuber et al. (2014) create a different (though similar) measure. Lastly, there are some additional differences in covariates in our models and theirs.
The percent reduction is 100*(exp(−0.23)−1)%=−20.5%.
These categories are not mutually exclusive as overdoses can involve multiple substances. These results are similar if we select on overdoses involving only natural and semisynthetic opiates, only synthetic opioids, or only heroin.
The NSDUH often relies on a small number of respondents to generate estimates for a given state and wave. Our motivation for weighting by the NSDUH sample size is to place more weight on state-wave observations with more data.
References
- Alpert A, Powell D and Pacula RL, 2017. Supply-Side Drug Policy in the Presence of Substitutes: Evidence from the Introduction of Abuse-Deterrent Opioids (No. w23031). National Bureau of Economic Research. [DOI] [PMC free article] [PubMed] [Google Scholar]
- Anderson DM, 2010. Does information matter? The effect of the Meth Project on meth use among youths. Journal of Health Economics, 29(5), pp.732–742. [DOI] [PMC free article] [PubMed] [Google Scholar]
- Anderson DM, Hansen B, and Rees DI. (2013). Medical marijuana laws, traffic fatalities, and alcohol consumption. Journal of Law and Economics, 56(2): 333–369. [Google Scholar]
- Anderson DM, Hansen B, and Rees DI. (2015). Medical marijuana laws and teen marijuana use. American Law and Economics Review, 17(2): 495–528 [Google Scholar]
- Bachhuber MA, Saloner B, Cunningham CO, and Barry CL. (2014). Medical Cannabis Laws and Opiate Analgesic Overdose Mortality in the United States, 1999–2010. JAMA Internal Medicine, August 25. [DOI] [PMC free article] [PubMed] [Google Scholar]
- Borgelt LM, Franson KL, Nussbaum AM and Wang GS. (2013). The pharmacologic and clinical effects of medical cannabis. Pharmacotherapy 33: 195–209. [DOI] [PubMed] [Google Scholar]
- Bowles DW, 2012. Persons registered for medical marijuana in the United States. Journal of Palliative Medicine, 15(1), pp.9–11. [DOI] [PubMed] [Google Scholar]
- Bradford AC and Bradford WD. (2016). Medical marijuana laws reduce prescription medication use in Medicare Part D. Health Affairs, 35(7): 1230–1236. [DOI] [PubMed] [Google Scholar]
- Bradford AC and Bradford WD. (2017). Medical Marijuana Laws May Be Associated With A Decline In The Number Of Prescriptions For Medicaid Enrollees. Health Affairs, on-line publication: doi: 10.1377/hlthaff.2016.1135. [DOI] [PubMed] [Google Scholar]
- Brady JE, Wunsch H, DiMaggio C, Lang BH, Giglio J and Li G (2014). Prescription Drug Monitoring and Dispensing of Prescription Opioids. Public Health Reports 129: 139–147. [DOI] [PMC free article] [PubMed] [Google Scholar]
- Buchmueller TC and Carey C (2017). The Effect of Prescription Drug Monitoring Programs on Opioid Utilization in Medicare. American Economic Journal: Economic Policy. Forthcoming. [Google Scholar]
- Case A, Deaton A (2017). Mortality and Morbidity in the 21st Century Brookings Papers on Economic Activity, Conference Draft, https://www.brookings.edu/wp-content/uploads/2017/03/6_casedeaton.pdf [DOI] [PMC free article] [PubMed] [Google Scholar]
- Case A, Deaton A (2015). Rising Morbidity and Mortality in Midlife Among White Non-Hispanic Americans in the 21st Century. Proceedings of the National Academy of Sciences. http://www.pnas.org/content/early/2015/10/29/1518393112.full.pdf [DOI] [PMC free article] [PubMed] [Google Scholar]
- Centers for Disease Control and Prevention (2011). Vital Signs: Overdoses of Prescription Opioid Pain Relievers - United States, 1999–2008. Morbidity and Mortality Weekly Report. 60(43): 1487–1492. [PubMed] [Google Scholar]
- Choi A (2014, December). The Impact of Medical Marijuana Laws on Marijuana Use and Other Risky Health Behaviors In Health & Healthcare in America: From Economics to Policy. Ashecon. [Google Scholar]
- Chriqui JF; Pacula RL; McBride DC; Reichmann DA; VanderWaal CJand Terry-McElrath Y (2002). Illicit drug policies: Selected laws from the 50 states and the District of Columbia, Berrien Springs, MI: Andrews University. [Google Scholar]
- Chu YWL (2014). The effects of medical marijuana laws on illegal marijuana use. Journal of Health Economics, 38, pp.43–61. [DOI] [PubMed] [Google Scholar]
- Davis JM, Mendelson B, Berkes JJ, Suleta K, Corsi KF, and Booth RE (2016). “Public Health Effects of Medical Marijuana Legalization in Colorado,” American Journal of Preventive Medicine, 50(3): 373–379 [DOI] [PMC free article] [PubMed] [Google Scholar]
- Freisthler B and Gruenewald PJ (2014). Examining the relationship between the physical availability of medical marijuana and marijuana use across fifty California cities. Drug and Alcohol Dependence 143, pp: 244–250. [DOI] [PMC free article] [PubMed] [Google Scholar]
- Ghosh TS, Van Dyke M, Maffey A, Whitley E, Erpelding D and Wolk L. (2015). Medical marijuana’s public health lessons—implications for retail marijuana in Colorado. New England Journal of Medicine, 372(11), pp.991–993. [DOI] [PubMed] [Google Scholar]
- Hall W and Pacula RL, 2003. Cannabis use and dependence: public health and public policy. Cambridge University Press. [Google Scholar]
- Hedegaard H, Warner M, and Minino AM. (2017). Drug overdose deaths in the United States, 1999–2015 NCHS Data Brief No 273. Hyattsville, MD: National Center for Health Statistics. [Google Scholar]
- Jones CM, Mack KA, and Paulozzi LJ. (2013). Pharmaceutical overdose deaths, United States 2010. JAMA 20; 309(7): 657–659. [DOI] [PubMed] [Google Scholar]
- Kim JH, Santaella-Tenorio J, Mauro C et al. (2016) State medical marijuana laws and the prevalence of opioids detected among fatally injured drivers. American Journal of Public Health, 106(11): 2032–2037. [DOI] [PMC free article] [PubMed] [Google Scholar]
- Klieger SB, Allen L, Pacula RL, Ibrahim JKand Burris S (Forthcoming). “Mapping medical marijuana: State laws regulating patients, product safety and dispensaries, 2016. ” Addiction. [DOI] [PMC free article] [PubMed]
- Leung L, 2011. Cannabis and its derivatives: review of medical use. The Journal of the American Board of Family Medicine, 24(4), pp.452–462. [DOI] [PubMed] [Google Scholar]
- Lynch ME and Cambell F. (2011). Cannabinoids for treatment of chronic non-cancer pain; a systematic review of randomized trials. Br J Clin Pharmacol 72: 735–744. [DOI] [PMC free article] [PubMed] [Google Scholar]
- Lynne-Landsman SD, Livingston MD, & Wagenaar AC (2013). Effects of state medical marijuana laws on adolescent marijuana use. American Journal of Public Health, 103(8), 1500–1506. [DOI] [PMC free article] [PubMed] [Google Scholar]
- Mark TL, Levit KR, Vandivort-Warren R, Buck JA, & Coffey RM (2011). Changes in US spending on mental health and substance abuse treatment, 1986–2005, and implications for policy. Health Affairs, 30(2), 284–292. [DOI] [PubMed] [Google Scholar]
- Martin-Sanchez E, Furukawa TA, Taylor J, Martin JL (2009). Systematic review and metanalysis of cannabis treatment for chronic pain. Pain Med 10: 1353–1368. [DOI] [PubMed] [Google Scholar]
- Murphy SL, Xu J and Kochanek KD (2013). “Deaths: Final Data for 2010” National Vital Statistics Report 61(4): 1–118. May 8, 2013 [PubMed] [Google Scholar]
- NCHS. Multiple cause-of-death data, 1999–2013. CDC WONDER online database. 2014. Available from: http://wonder.cdc.gov/mcd.html. [Google Scholar]
- Nunberg H; Kilmer B; Pacula RL; and Burgdorf JR. (2011) “An Analysis of Applicants Presenting to a Medical Marijuana Specialty Practice in California,” Journal of Drug Policy Analysis: Vol. 4: Iss. 1, Article 1. DOI: 10.2202/1941-2851.1017 [DOI] [PMC free article] [PubMed] [Google Scholar]
- Ogden DW, Investigations And Prosecutions in States Authorizing the Medical Use of Marijuana. Memorandum For Selected United States Attorneys, Washington, D.C: U.S. Department of Justice, Office of the Deputy Attorney, 2009. [Google Scholar]
- Pacula RL, Boustead A, and Hunt P (2014). “Words can be deceiving: A review of variation among legally effective medical marijuana laws in the United States” Journal of Drug Policy Analysis. ISSN (Online) 1941–2851, ISSN (Print) 2194–6337,DOI: 10.1515/jdpa-2014-0001, May 2014 [DOI] [PMC free article] [PubMed] [Google Scholar]
- Pacula RL, Chriqui JF, Reichmann DA, & Terry-McElrath YM (2002). State medical marijuana laws: Understanding the laws and their limitations. Journal of Public Health Policy, 23(4), 413–439. [PubMed] [Google Scholar]
- Pacula RL, Kilmer B, Grossman M, and Chaloupka F (2010). “Risks and prices: The role of user sanctions in marijuana markets.” The B.E. Journal of Economic Analysis & Policy, 10(1): (Contributions), Article 11. [DOI] [PMC free article] [PubMed] [Google Scholar]
- Pacula RL, Powell D, Heaton P and Sevigny EL (2015). Assessing the effects of medical marijuana laws on marijuana use: the devil is in the details. Journal of Policy Analysis and Management, 34(1), pp.7–31. [DOI] [PMC free article] [PubMed] [Google Scholar]
- Pacula RL and Smart R(2017). “Effects of Changes in Marijuana Laws on Marijuana Use and Disorders: Medical Marijuana and Marijuana Legalization,” Annual Review of Clinical Psychology. 13(1), 397–419. [DOI] [PMC free article] [PubMed] [Google Scholar]
- Pardo B (2017). Do more robust prescription drug monitoring programs reduce prescription opioid overdose? Addiction. Published online ahead of print, February 8, 2017, DOI: 10.1111/add.13741 [DOI] [PubMed] [Google Scholar]
- Patrick SW, Fry CE, Jones TF and Buntin MB, 2016. Implementation of prescription drug monitoring programs associated with reductions in opioid-related death rates. Health Affairs, 35(7), pp.1324–1332. [DOI] [PMC free article] [PubMed] [Google Scholar]
- Paulozzi LJ, Kilbourne EM, Desai HA (2011). Prescription drug monitoring programs and death rates from drug overdose. Pain Med 12: 747–754. [DOI] [PubMed] [Google Scholar]
- Paulozzi LJ. and Ryan GW (2006). Opioid analgesics and rates of fatal drug poisoning in the United States. American Journal of Preventive Medicine, 31(6), pp.506–511. [DOI] [PubMed] [Google Scholar]
- Rudd RA, Aleshire N, Zibbell JE and Matthew Gladden R, (2016). Increases in drug and opioid overdose deaths—United States, 2000–2014. American Journal of Transplantation, 16(4), pp.1323–1327. [Google Scholar]
- Rutter Ali, Smithand Strashny(2015) “Factors associated with substance use treatment completion in residential facilities” Drug and Alcohol Dependence, 154, pp 291–295. [DOI] [PubMed] [Google Scholar]
- Santos Silva J, & Tenreyro S (2006). The log of gravity. The Review of Economics and Statistics, 88(4), 641–658. [Google Scholar]
- Sevigny EL, Pacula RL, & Heaton P (2014). The effects of medical marijuana laws on potency. International Journal of Drug Policy. 25(2): 308–319. [DOI] [PMC free article] [PubMed] [Google Scholar]
- Shi Y (2017). Medical marijuana policies and hospitalizations related to marijuana and opioid pain reliever. Drug and Alcohol Dependence. 173: 144–150. [DOI] [PMC free article] [PubMed] [Google Scholar]
- Smart R (2016). Essays on the Effects of Medical Marijuana Laws, Los Angeles, University of California, 2016. [Google Scholar]
- Substance Abuse and Mental Health Services Administration (SAMHSA), Center for Behavioral Health Statistics and Quality. Treatment Episode Data Set (TEDS): 2005–2015. National Admissions to Substance Abuse Treatment Services BHSIS Series S-91, HHS Publication No. (SMA) 17–5037. Rockville, MD: Substance Abuse and Mental Health Services Administration, 2017. [Google Scholar]
- Wen H, Hockenberry JM, & Cummings JR (2015). The effect of medical marijuana laws on adolescent and adult use of marijuana, alcohol, and other substances. Journal of Health Economics, 42, 64–80. [DOI] [PubMed] [Google Scholar]
- Williams AR, Olfson M, Kim JH, Martins SS, Kleber HD. (2016). Older, less regulated medical marijuana programs have much greater enrollment rates than newer “medicalized” programs. Health Affairs 35(3): 480–88 [DOI] [PMC free article] [PubMed] [Google Scholar]
- Wooldridge Jeffrey M. (2010). Econometric Analyses of Cross Section and Panel Data, second ed, Vol 1, MIT Press. [Google Scholar]