

Abstract
Studies have reported that B- and T-lymphocyte attenuator (BTLA) polymorphisms may be associated with the risk to different cancers. However, the correlation between those variations and non-small-cell lung cancer (NSCLC) is still unclear. A total of 1,003 NSCLC patients and 901 noncancer controls were recruited in the study, to confirm the association of variations in BTLA gene with the risk of NSCLC. The SNPscan™ genotyping assay was used to obtain the genotypes of the four BTLA polymorphisms (BTLA rs1982809 G>A, rs16859629 T>C, rs2171513 G>A, and rs3112270 A>G). It was found that BTLA rs1982809 polymorphism reduced the risk of NSCLC (GA vs. GG: adjusted odds ratio (OR) = 0.81, 95%confidence interval (CI) = 0.66‐0.99, and P = 0.043). However, the BTLA rs16859629, rs2171513, and rs3112270 polymorphisms showed no significant association between NSCLC patients and controls in overall comparison. In subgroup analyses, we found that BTLA rs1982809 polymorphism reduced the risk of NSCLC (nonsquamous cell carcinoma: GA vs. GG: adjusted OR = 0.79, 95%CI = 0.64‐0.97, and P = 0.026; AA/GA vs. GG: adjusted OR = 0.81, 95%CI = 0.66‐0.99, and P = 0.037; ≥59 years: GA vs. GG: P = 0.036; never alcohol consumption: GA vs. GG: P = 0.013; GA/AA vs. GG: P = 0.016; body mass index (BMI) ≥ 24 kg/m2: GA vs. GG: P = 0.030; GA/AA vs. GG: P = 0.041). The BTLA rs16859629 polymorphism increased the risk of the development of squamous cell carcinoma (CC vs. TT: adjusted OR = 9.85, 95%CI = 1.37‐71.03, and P = 0.023; CC vs. TT/TC: adjusted OR = 9.55, 95%CI = 1.32‐68.66, and P = 0.025). Taken together, the findings of the present suggest that BTLA rs1982809 and rs16859629 polymorphisms may influence the susceptibility to NSCLC in the Chinese population.
1. Introduction
Non-small-cell lung cancer (NSCLC) accounts for 80 to 85% of all the lung cancer and is the main pathological type of lung cancer (LC). LC has imposed huge diseases burden on human population and accounts for significant number of mortalities across the globe [1–3]. As per estimates, LC is currently ranked as first in terms of incidence and mortality [4]. The currently used treatment strategies for LC include surgery combined with adjuvant therapy. Owing to the recent advancements made in the diagnosis and treatment, the clinical outcomes have significantly improved [5]. However, the identification of the potential risk factors for the occurrence of LC is considered essential as it will permit early diagnosis and immediate management.
The B- and T-lymphocyte attenuator (BTLA), an immunosuppressive receptor, was identified after the cytotoxic T-lymphocyte-associated antigen-4 (CTLA-4) and programmed death-1 (PD-1) and is thus the third member of the CD28 immunoglobulin superfamily (IgSF) [6]. The BTLA upon binding with herpesvirus entry mediator (HVEM) inhibits the T cell response. In contrary, blocking of BTLA may in turn activate T cells [7–9]. Evidences suggest that BTLA plays a crucial immune regulatory role in human malignancies. Liu et al. [10] have reported that BTLA/HVEM pathway plays an important immunosuppressive role in the regulation of T cells in peripheral blood of hepatocellular carcinoma patients. Quan et al. [11] and Li et al. [12] found that the level of BTLA expression may act as a biomarker for the prognosis of diffuse large B cell lymphoma and NSCLC. In yet another study, Chen et al. [13] concluded that chemotherapy in combination with anti-BTLA antibody improves the prognosis of ovarian cancer in a mouse model. Similarly, Zhang et al. [14] reported that BTLA could directly intervene the effects of miR-32 on cancer cells. Collectively, these studies point towards a correlation between BTLA and the development and progression of human cancers.
Single nucleotide polymorphism (SNP) mutations constitute an important form of genetic variations. Some recent studies have revealed a significant correlation between BTLA SNPs and development of cancer [15–19]. Fu et al. reported that BTLA rs1844089 C>T and rs2705535 A>G variation could increase the risk of breast cancer in human [15]. Partyka et al. and Karabon et al. found that the variation on BTLA rs1982809 G>A gene polymorphism might be a potential risk factor for the development of chronic lymphocytic leukemia (CLL) and renal cell carcinoma [16, 17]. In a previous study, we reported that BTLA rs1982809 SNPs increased the susceptibility of esophagogastric junction adenocarcinoma (EGJA) in smoking subgroup analyses [18]. In another study, we found that the BTLA rs3112270 A>G and rs2171513 G>A polymorphisms could modify the risk of esophageal squamous cell carcinoma (ESCC) [19]. Given this background, we hypothesize that some associations may exist between BTLA polymorphisms and NSCLC pathogenesis.
Combined with these previous studies, the BTLA tagging SNPs (rs1982809, rs16859629, rs2171513, and rs3112270) were selected for analysis. Consistently, the present study is aimed at exploring the relationship between BTLA tagging SNPs and the risk of NSCLC.
2. Materials and Methods
2.1. Subject
The present study involved 1,003 NSCLC patients and 901 healthy controls. Those patients were continuously recruited from Fujian Medical University Union Hospital, Fuzhou, China, from October 2014 to January 2018, and the diagnosis was confirmed by postoperative pathology. The major inclusion criteria for NSCLC patients were (a) the case firstly to be diagnosed, (b) the individuals with no history of other cancers, (c) without any autoimmune disease, and (d) did not receive any chemo- or radiotherapy prior to enrollment. In the same period, the controls were recruited in the Affiliated Union Hospital of Fujian Medical University (Fuzhou, China) and the Affiliated People's Hospital of Jiangsu University (Zhenjiang, China), and the individuals without any cancer history, mainly healthy, checking individuals, matched with the NSCLC patients by age. The information collected from the patients included age, sex, drinking, smoking history, height, and weight. Furthermore, body mass index (BMI) of more than 24 kg/m2 was considered as obesity and overweight [20]. Each participant was informed about the purpose of the study and was asked to sign a written consent form for participation in the study. The study was approved by the research ethics committee of Fujian Medical University Union Hospital (Approval No. 2018KY023).
2.2. Selection of BTLA Tagging SNPs
The four candidate SNPs were ascertained by applying Genome Variation Server data [18, 19, 21] (http://gvs.gs.washington.edu/GVS147/). We gave priority to represent the main linkage disequilibrium blocks. The following main criteria were used: (a) minor allele frequency ≥ 0.05, (b) linkage disequilibrium of r2 < 0.8 between the SNPs, (c) with the 5 kb extent upstream and downstream of the gene regions, and (d) the genotyping value ≥ 95% in the CHB cohort. Four BTLA tagging SNPs (rs1982809, rs16859629, rs2171513, and rs3112270) were finally selected to decipher the association between the BTLA polymorphisms and NSCLC risk. The results are shown in Table 1.
Table 1.
Primary information for BTLA tagging polymorphisms.
| Genotyped polymorphisms | rs2171513 G>A | rs3112270 A>G | rs1982809 G>A | rs16859629 T>C |
|---|---|---|---|---|
| Chr | 3 | 3 | 3 | 3 |
| Position_38 | 112466080 | 112461797 | 112463893 | 112471533 |
| Region | 3′-UTR | Promoter | 3′-UTR | Intron_variant |
| MAF in database (1000 genomes—Chinese Han populations) | 0.198 | 0.278 | 0.195 | 0.082 |
| MAF in our controls (n = 901) | 0.194 | 0.295 | 0.270 | 0.079 |
| P value for HWE test in our controls | 0.554 | 0.259 | 0.584 | 0.747 |
| % genotyping value | 99.00% | 98.84% | 98.90% | 97.48% |
Abbreviations: MAF: minor allele frequency; HWE: Hardy–Weinberg equilibrium.
2.3. DNA Extraction and Genotyping
Around 2 mL of the peripheral blood samples of the subjects (early in the morning, empty stomach) was collected and placed in a vacuum ethylene diamine tetra-acetic acid anticoagulant tube. Genomic DNA was carefully extracted from the collected samples with the help of DNA blood mini kit (Promega, Madison, USA) by following manufacturer's guidelines. The BTLA rs1982809, rs16859629, rs2171513, and rs3112270 genotypes were assessed by the SNPscan™ Kit (Genesky Biotechnologies Inc., Shanghai, China) as per manufacturer's guidelines. For the qualitative assessment, 76 samples (4%) were randomly selected and subsequently tested by another laboratory technician. The genotypes of BTLA were well confirmed repeatedly.
2.4. PCR-Specific Experimental Procedures
2.4.1. DNA Cleavage
The DNA was diluted to a concentration of 30 to 50 ng/μL. From this 4 μL, DNA was transferred to a 96-well plate followed by the addition of 2.5 μL 4X DNA buffer. Thereafter, the total volume was made up to 10 μL by the addition of sterile ddH2O. The contents were mixed well and incubated at 98°C for 5 min. Afterwards, the plates were immediately placed in ice.
2.4.2. PCR Reaction
A 10 μL of the premixture prepared was centrifuged at 3000 rpm for 30 seconds. After 4 cycles of the PCR program, the mixture was subjected to 70°C warm bath.
2.4.3. Multiple Fluorescence PCR Reactions
A 19 μL PCR premixture was added to each hole. This was followed thorough mixing and centrifugation at 3000 rpm for 30 seconds. The reaction was subjected to 34 cycles of the PCR program followed by a 4°C warm bath.
2.4.4. Reading of PCR Results
The GeneMapper 4.2 software (Applied Biosystem, USA) was employed for the genotype analysis of the original sequence data.
2.5. Statistical Analysis
For the selected BTLA genotypes in controls, the internet software (http://ihg.gsf.de/cgi-bin/hw/hwa1.pl) was employed to assess if the genotype frequency distribution conforms to Hardy–Weinberg equilibrium (HWE) or not. Mean ± standard deviation (SD) was adopted for continuous variables. The t-test was applied to calculate the difference between NSCLC and healthy subjects. The chi-square (χ2) or Fisher test was utilized to compare the distributions of the BTLA SNPs in related categorical variables between the two groups, including age, gender, tobacco use, drinking, BMI, and genotype frequency. Multivariate logistic regression was used to examine the adjusted odds ratio (OR) and 95% confidence intervals (CIs) in evaluating the relationship between selective BTLA SNPs and susceptibility to NSCLC. All data were analyzed by the SAS 9.4 (windows version; SAS Institute Inc., Cary, NC) and SPSS 23 software (windows version; International Business Machines Corp.). Only P < 0.05 was considered as a statistically significance.
3. Results
3.1. Baseline Characteristics
A total of 1,003 NSCLC cases and 901 controls were recruited in this study. The risk factors that may influence the development of NSCLC are listed in Table 2. Although a good match was observed between the age of the NSCLC patients and the control group (P = 0.139), significant differences were observed in sex, smoking, alcohol consumption, and BMI between the two groups (P < 0.001). The genotyping rate of BTLA rs2171513, rs3112270, rs1982809, and rs16859629 was higher than 95% (99.00%, 98.84%, 98.90%, and 97.48%, respectively) as shown in Table 1. Minor allele frequencies (MAFs) in the control were similar to those of the Chinese populations, and the genotype frequency distributions were in accordance with the HWE.
Table 2.
Distribution of selected demographic variables and risk factors in NSCLC cases and controls.
| Variable | Cases (n = 1,003) | Controls (n = 901) | P a | ||
|---|---|---|---|---|---|
| n | % | n | % | ||
| Age (years) | 58.76 ± 9.92 | 59.43 ± 9.67 | 0.139 | ||
| Age (years) | 0.292 | ||||
| <59 | 465 | 46.36 | 396 | 43.95 | |
| ≥59 | 538 | 53.64 | 505 | 56.05 | |
| Sex | <0.001 | ||||
| Male | 520 | 51.84 | 552 | 61.27 | |
| Female | 483 | 48.16 | 349 | 38.73 | |
| Tobacco use | <0.001 | ||||
| Never | 634 | 63.21 | 717 | 79.58 | |
| Ever | 369 | 36.79 | 184 | 20.42 | |
| Alcohol use | <0.001 | ||||
| Never | 789 | 78.66 | 804 | 89.23 | |
| Ever | 214 | 21.34 | 97 | 10.77 | |
| BMI (kg/m2) | <0.001 | ||||
| <24 | 672 | 67.00 | 497 | 55.16 | |
| ≥24 | 331 | 33.00 | 404 | 44.84 | |
| Type of NSCLC | |||||
| SCC | 145 | 14.46 | |||
| Non-SCC | 858 | 85.54 | |||
Notes: atwo-sided χ2 test and Student's t-test. Abbreviations: BMI: body mass index; NSCLC: non-small-cell lung cancer; SCC: squamous cell carcinoma.
3.2. Association between BTLA Polymorphisms and Susceptibility to NSCLC
The genotype distribution of BTLA rs1982809, rs16859629, rs2171513, and rs3112270 SNPs is shown in Table 3. It was found that GG+AG genotype of BTLA rs3112270 polymorphism may be a protective factor for NSCLC compared to the AA genotype (GG+AG: OR = 0.83, 95%CI = 0.69‐0.99, and P = 0.038). Meanwhile, compared to the BTLA rs1982809 GG genotype, the BTLA rs1982809 GA and AA+GA genotypes are also associated with the development of NSCLC (GA: OR = 0.81, 95%CI = 0.67‐0.98, and P = 0.030; AA+GA: OR = 0.83, 95%CI = 0.69‐0.99, and P = 0.042). Adjusting the risk factors (age, sex, smoking, drinking, and BMI status), the genotypes of BTLA rs3112270 polymorphism were not closely correlated with NSCLC susceptibility, whereas the GA genotype of BTLA rs1982809 SNPs still decreased the susceptibility of NSCLC patients (GA: adjusted OR = 0.81, 95%CI = 0.66‐0.99, and P = 0.043; Table 4).
Table 3.
The frequencies of BTLA tagging polymorphisms in different NSCLC subgroups.
| Genotype | NSCLC (n = 1,003) | SCC (n = 145) | Non-SCC (n = 858) | Controls (n = 901) | ||||
|---|---|---|---|---|---|---|---|---|
| n | % | n | % | n | % | n | % | |
| rs2171513 G>A | ||||||||
| GG | 654 | 66.06 | 106 | 73.61 | 548 | 64.78 | 582 | 65.03 |
| GA | 297 | 30.00 | 35 | 24.31 | 262 | 30.97 | 276 | 30.84 |
| AA | 39 | 3.94 | 3 | 2.08 | 36 | 4.26 | 37 | 4.13 |
| A allele | 375 | 18.94 | 41 | 14.24 | 334 | 19.74 | 350 | 19.55 |
| rs3112270 A>G | ||||||||
| AA | 527 | 53.39 | 74 | 51.39 | 453 | 53.74 | 435 | 48.60 |
| AG | 392 | 39.72 | 61 | 42.36 | 331 | 39.26 | 388 | 43.35 |
| GG | 68 | 6.89 | 9 | 6.25 | 59 | 7.00 | 72 | 8.04 |
| G allele | 528 | 26.75 | 79 | 27.43 | 449 | 26.63 | 532 | 29.72 |
| rs1982809 G>A | ||||||||
| GG | 566 | 57.29 | 77 | 53.47 | 489 | 57.94 | 471 | 52.63 |
| GA | 351 | 35.53 | 54 | 37.50 | 297 | 35.19 | 361 | 40.34 |
| AA | 71 | 7.19 | 13 | 9.03 | 58 | 6.87 | 63 | 7.04 |
| A allele | 493 | 24.95 | 80 | 27.78 | 413 | 24.47 | 487 | 27.21 |
| rs16859629 T>C | ||||||||
| TT | 835 | 85.82 | 115 | 82.14 | 720 | 86.43 | 746 | 84.48 |
| TC | 131 | 13.46 | 23 | 16.43 | 108 | 12.97 | 132 | 14.95 |
| CC | 7 | 0.72 | 2 | 1.43 | 5 | 0.60 | 5 | 0.57 |
| C allele | 145 | 7.45 | 27 | 9.64 | 118 | 7.08 | 142 | 8.04 |
Table 4.
Logistic regression analyses of association of BTLA tagging polymorphisms with risk of NSCLC.
| Genotype | Overall NSCLC cases (n = 1,003) vs. controls (n = 901) | SCC (n = 145) vs. controls (n = 901) | Non-SCC (n = 858) vs. controls (n = 901) | |||||||||
|---|---|---|---|---|---|---|---|---|---|---|---|---|
| Crude OR (95% CI) | P | Adjusted ORa (95% CI) | P | Crude OR (95% CI) | P | Adjusted ORa (95% CI) | P | Crude OR (95% CI) | P | Adjusted ORa (95% CI) | P | |
| rs2171513 G>A | ||||||||||||
| GA vs. GG | 0.96 (0.79-1.17) | 0.669 | 1.00 (0.81-1.24) | 0.971 | 0.70 (0.46-1.05) | 0.082 | 0.83 (0.51-1.32) | 0.426 | 1.01 (0.82-1.24) | 0.938 | 1.03 (0.83-1.28) | 0.760 |
| AA vs. GG | 0.94 (0.59-1.49) | 0.787 | 0.97 (0.60-1.59) | 0.908 | 0.45 (0.14-1.47) | 0.184 | 0.32 (0.09-1.18) | 0.086 | 1.03 (0.64-1.66) | 0.892 | 1.06 (0.65-1.74) | 0.816 |
| AA/GA vs. GG | 0.96 (0.79-1.16) | 0.637 | 1.00 (0.82-1.22) | 1.00 | 0.67 (0.45-0.99) | 0.044 | 0.74 (0.47-1.17) | 0.195 | 1.01 (0.83-1.23) | 0.912 | 1.04 (0.84-1.28) | 0.728 |
| AA vs. GG/GA | 0.95 (0.60-1.51) | 0.830 | 0.97 (0.60-1.58) | 0.904 | 0.49 (0.15-1.62) | 0.245 | 0.34 (0.09-1.23) | 0.099 | 1.03 (0.65-1.65) | 0.900 | 1.05 (0.64-1.72) | 0.847 |
| rs3112270 A>G | ||||||||||||
| AG vs. AA | 0.83 (0.69-1.01) | 0.060 | 0.86 (0.70-1.05) | 0.125 | 0.92 (0.64-1.33) | 0.672 | 1.10 (0.72-1.69) | 0.667 | 0.82 (0.67-1.00) | 0.047 | 0.82 (0.67-1.01) | 0.064 |
| GG vs. AA | 0.78 (0.55-1.11) | 0.169 | 0.81 (0.56-1.18) | 0.275 | 0.74 (0.35-1.53) | 0.412 | 0.80 (0.35-1.85) | 0.603 | 0.79 (0.54-1.14) | 0.202 | 0.81 (0.55-1.20) | 0.293 |
| GG/AG vs. AA | 0.83 (0.69-0.99) | 0.038 | 0.85 (0.70-1.03) | 0.092 | 0.90 (0.63-1.27) | 0.535 | 1.05 (0.70-1.58) | 0.818 | 0.81 (0.67-0.98) | 0.033 | 0.82 (0.67-1.00) | 0.051 |
| GG vs. AA/AG | 0.85 (0.60-1.19) | 0.340 | 0.87 (0.61-1.25) | 0.456 | 0.76 (0.37-1.56) | 0.458 | 0.77 (0.34-1.73) | 0.522 | 0.86 (0.60-1.23) | 0.411 | 0.89 (0.61-1.29) | 0.530 |
| rs1982809 G>A | ||||||||||||
| GA vs. GG | 0.81 (0.67-0.98) | 0.030 | 0.81 (0.66-0.99) | 0.043 | 0.92 (0.63-1.33) | 0.642 | 1.05 (0.68-1.62) | 0.833 | 0.79 (0.65-0.97) | 0.022 | 0.79 (0.64-0.97) | 0.026 |
| AA vs. GG | 0.94 (0.65-1.35) | 0.727 | 0.99 (0.68-1.45) | 0.960 | 1.26 (0.66-2.40) | 0.478 | 1.83 (0.84-3.97) | 0.130 | 0.89 (0.61-1.30) | 0.534 | 0.93 (0.63-1.39) | 0.724 |
| AA/GA vs. GG | 0.83 (0.69-0.99) | 0.042 | 0.84 (0.69-1.02) | 0.071 | 0.97 (0.68-1.38) | 0.850 | 1.15 (0.76-1.73) | 0.522 | 0.81 (0.67-0.98) | 0.026 | 0.81 (0.66-0.99) | 0.037 |
| AA vs. GG/GA | 1.02 (0.72-1.45) | 0.901 | 1.08 (0.74-1.57) | 0.690 | 1.31 (0.70-2.45) | 0.396 | 1.79 (0.84-3.80) | 0.131 | 0.98 (0.67-1.41) | 0.891 | 1.03 (0.70-1.51) | 0.900 |
| rs16859629 T>C | ||||||||||||
| TC vs. TT | 0.89 (0.68-1.15) | 0.367 | 0.89 (0.68-1.18) | 0.412 | 1.13 (0.70-1.84) | 0.620 | 1.19 (0.68-2.11) | 0.544 | 0.85 (0.64-1.12) | 0.238 | 0.86 (0.65-1.15) | 0.307 |
| CC vs. TT | 1.25 (0.40-3.96) | 0.703 | 1.38 (0.41-4.58) | 0.602 | 2.60 (0.50-13.53) | 0.258 | 9.85 (1.37-71.03) | 0.023 | 1.04 (0.30-3.59) | 0.955 | 1.09 (0.30-4.01) | 0.898 |
| CC/TC vs. TT | 0.90 (0.70-1.16) | 0.419 | 0.91 (0.69-1.19) | 0.486 | 1.18 (0.74-1.89) | 0.481 | 1.31 (0.75-2.28) | 0.338 | 0.86 (0.65-1.12) | 0.253 | 0.87 (0.65-1.15) | 0.330 |
| CC vs. TT/TC | 1.27 (0.40-4.02) | 0.682 | 1.40 (0.42-4.66) | 0.584 | 2.55 (0.49-13.25) | 0.267 | 9.55 (1.32-68.66) | 0.025 | 1.06 (0.31-3.68) | 0.926 | 1.11 (0.30-4.09) | 0.873 |
Notes: aadjusted for age, sex, smoking status, alcohol use, and BMI status in a logistic regression model.
Collectively, the results suggest that the genotypes in BTLA rs2171513 and rs16859629 mutations may be associated with the development of NSCLC.
3.3. Association of BTLA Polymorphisms with Susceptibility in Different NSCLC Subgroups
The results showed that AA genotype of BTLA rs2171513 polymorphism might be considered as a susceptibility factor for the development of squamous cell carcinoma (SCC) (AA/GA: OR = 0.67, 95%CI = 0.45‐0.99, and P = 0.044) (Table 4). Adjusting the risk factors (age, sex, smoking, drinking, and BMI status), the BTLA rs2171513 polymorphism was not relevant to the occurrence of SCC. Nonetheless, using TT and TT+TC genotypes as references, the results showed that the CC genotype of BTLA rs16859629 polymorphisms may promote the development of SCC (CC vs. TT: adjusted OR = 9.85, 95%CI = 1.37‐71.03, and P = 0.023; CC vs. TT+TC: adjusted OR = 9.55, 95%CI = 1.32‐68.66, and P = 0.025).
In nonsquamous cell carcinoma (non-SCC), using AA genotype as reference, it was found that GG and GA+GG genotypes of BTLA rs3112270 polymorphisms may decrease the incidence of non-SCC (AG: OR = 0.82, 95%CI = 0.67‐1.00, and P = 0.047; GG+AG: OR = 0.81, 95%CI = 0.67‐0.98, and P = 0.033). Meanwhile, it was also found that the GA and GA+AA genotypes of BTLA rs1982809 polymorphism also decreased the occurrence of non-SCC with reference to GG genotype (GA vs. GG: OR = 0.79, 95%CI = 0.65‐0.97, and P = 0.022; AA/GA vs. GG: OR = 0.81, 95%CI = 0.67‐0.98, and P = 0.026). Adjusting the related risk factors, it is concluded that the BTLA rs3112270 polymorphism did not exhibit the tendency to change the risk to non-SCC. However, BTLA rs1982809 polymorphism was a protective factor of the susceptibility to non-SCC (GA: adjusted OR = 0.79, 95%CI = 0.64‐0.97, and P = 0.026; AA+GA: adjusted OR = 0.81, 95%CI = 0.66‐0.99, and P = 0.037).
The genotype frequencies of BTLA rs1982809 polymorphism in the subgroup analyses are depicted in Table 5. In ≥59-year subgroup, it was found that the variants of BTLA rs1982809 decreased the incidence of NSCLC (GA vs. GG: P = 0.036). In never alcohol and BMI ≥ 24 kg/m2 subgroup, it was found that similar genotype variants of BTLA rs1982809 might be a protective factor of NSCLC (never smoking subgroup: GA vs. GG: P = 0.013; AA/GA vs. GG: P = 0.016; BMI ≥ 24 kg/m2: GA vs. GG: P = 0.030; AA/GA vs. GG: P = 0.041). Additionally, it was found that BTLA rs2171513, rs3112270, and rs16859629 polymorphisms were not associated with the morbidity of NSCLC in subgroups (Tables 6–8).
Table 5.
Stratified analyses between BTLA rs1982809 G>A polymorphism and NSCLC risk by sex, age, smoking status, alcohol consumption, and BMI.
| Variable | BTLA rs1982809 G>A (case/control)a | Adjusted ORb (95% CI); P | ||||||
|---|---|---|---|---|---|---|---|---|
| GG | GA | AA | GG | GA vs. GG | AA vs. GG | GA/AA vs. GG | AA vs. (GG/GA) | |
| Sex | ||||||||
| Male | 299/289 | 177/228 | 37/33 | 1.00 | 0.79 (0.60-1.05); P: 0.100 | 1.32 (0.77-2.27); P: 0.314 | 0.86 (0.66-1.11); P: 0.246 | 1.45 (0.86-2.46); P: 0.167 |
| Female | 267/182 | 174/133 | 34/30 | 1.00 | 0.87 (0.64-1.18); P: 0.366 | 0.77 (0.45-1.33); P: 0.352 | 0.85 (0.64-1.14); P: 0.274 | 0.82 (0.49-1.38); P: 0.457 |
| Age | ||||||||
| <59 | 254/203 | 173/162 | 31/28 | 1.00 | 0.93 (0.69-1.27); P: 0.651 | 0.90 (0.50-1.62); P: 0.728 | 0.93 (0.69-1.24); P: 0.611 | 0.93 (0.52-1.64); P: 0.799 |
| ≥59 | 312/268 | 178/199 | 40/35 | 1.00 | 0.75 (0.57-0.98); P: 0.036 | 1.08 (0.65-1.78); P: 0.778 | 0.79 (0.61-1.03); P: 0.079 | 1.21 (0.74-1.98); P: 0.450 |
| Smoking status | ||||||||
| Never | 355/371 | 220/285 | 49/55 | 1.00 | 0.79 (0.62-1.01); P: 0.060 | 0.91 (0.59-1.40); P: 0.651 | 0.81 (0.65-1.02); P: 0.074 | 1.00 (0.65-1.52); P: 0.980 |
| Ever | 211/100 | 131/76 | 22/8 | 1.00 | 0.86 (0.59-1.26); P: 0.444 | 1.32 (0.56-3.11); P: 0.525 | 0.91 (0.63-1.31); P: 0.603 | 1.40 (0.60-3.26); P: 0.433 |
| Alcohol consumption | ||||||||
| Never | 443/408 | 280/332 | 55/59 | 1.00 | 0.76 (0.61-0.94); P: 0.013 | 0.87 (0.58-1.31); P: 0.509 | 0.77 (0.63-0.95); P: 0.016 | 0.98 (0.66-1.46); P: 0.911 |
| Ever | 123/63 | 71/29 | 16/4 | 1.00 | 1.22 (0.70-2.14); P: 0.479 | 2.55 (0.75-8.60); P: 0.132 | 1.36 (0.80-2.32); P: 0.256 | 2.37 (0.71-7.86); P: 0.159 |
| BMI (kg/m2) | ||||||||
| <24 | 368/257 | 245/201 | 47/35 | 1.00 | 0.89 (0.68-1.15); P: 0.361 | 1.06 (0.65-1.73); P: 0.828 | 0.91 (0.71-1.17); P: 0.458 | 1.11 (0.69-1.80); P: 0.667 |
| ≥24 | 198/214 | 106/160 | 24/28 | 1.00 | 0.69 (0.50-0.97); P: 0.030 | 0.88 (0.48-1.62); P: 0.677 | 0.72 (0.53-0.99); P: 0.041 | 1.01 (0.56-1.84); P: 0.973 |
Notes: athe genotyping was successful in 1,003 (98.50%) NSCLC cases, and 901 (99.33%) controls for BTLA rs1982809 G>A. bAdjusted for age, sex, smoking status, alcohol consumption, and BMI (besides stratified factors accordingly) in a logistic regression model. Abbreviations: BMI: body mass index; NSCLC: non-small-cell lung cancer.
Table 6.
Stratified analyses between BTLA rs2171513 G>A polymorphism and NSCLC risk by sex, age, smoking status, alcohol consumption, and BMI.
| Variable | BTLA rs2171513 G>A (case/control)a | Adjusted ORb (95% CI); P | ||||||
|---|---|---|---|---|---|---|---|---|
| GG | GA | AA | GG | GA vs. GG | AA vs. GG | GA/AA vs. GG | AA vs. (GG/GA) | |
| Sex | ||||||||
| Male | 335/361 | 165/165 | 15/24 | 1.00 | 1.15 (0.86-1.53); P: 0.346 | 0.70 (0.34-1.43); P: 0.325 | 1.09 (0.83-1.44); P: 0.545 | 0.67 (0.33-1.36); P: 0.266 |
| Female | 319/221 | 132/111 | 24/13 | 1.00 | 0.84 (0.61-1.15); P: 0.273 | 1.32 (0.65-2.69); P: 0.441 | 0.89 (0.66-1.20); P: 0.445 | 1.40 (0.69-2.83); P: 0.350 |
| Age | ||||||||
| <59 | 305/265 | 133/114 | 21/14 | 1.00 | 1.02 (0.73-1.40); P: 0.930 | 1.58 (0.73-3.42); P: 0.244 | 1.06 (0.78-1.46); P: 0.672 | 1.58 (0.73-3.39); P: 0.244 |
| ≥59 | 349/317 | 164/162 | 18/23 | 1.00 | 0.98 (0.74-1.30); P: 0.906 | 0.67 (0.35-1.30); P: 0.240 | 0.94 (0.72-1.23); P: 0.659 | 0.68 (0.35-1.30); P: 0.242 |
| Smoking status | ||||||||
| Never | 408/456 | 188/227 | 29/28 | 1.00 | 0.97 (0.76-1.24); P: 0.803 | 1.18 (0.67-2.08); P: 0.571 | 0.99 (0.78-1.26); P: 0.948 | 1.19 (0.68-2.09); P: 0.543 |
| Ever | 246/126 | 109/49 | 10/9 | 1.00 | 1.08 (0.72-1.63); P: 0.698 | 0.58 (0.23-1.48); P: 0.254 | 1.01 (0.68-1.48); P: 0.980 | 0.57 (0.22-1.44); P: 0.232 |
| Alcohol consumption | ||||||||
| Never | 520/520 | 226/245 | 34/34 | 1.00 | 0.98 (0.78-1.23); P: 0.829 | 0.99 (0.59-1.66); P: 0.967 | 0.98 (0.79-1.22); P: 0.834 | 1.00 (0.60-1.66); P: 0.990 |
| Ever | 134/62 | 71/31 | 5/3 | 1.00 | 1.13 (0.65-1.95); P: 0.670 | 0.79 (0.17-3.69); P: 0.767 | 1.10 (0.64-1.87); P: 0.735 | 0.76 (0.17-3.50); P: 0.725 |
| BMI (kg/m2) | ||||||||
| <24 | 441/326 | 194/147 | 26/20 | 1.00 | 1.05 (0.80-1.38); P: 0.711 | 0.91 (0.49-1.69); P: 0.761 | 1.03 (0.80-1.34); P: 0.803 | 0.89 (0.48-1.66); P: 0.724 |
| ≥24 | 213/256 | 103/129 | 13/17 | 1.00 | 0.93 (0.66-1.30); P: 0.656 | 1.09 (0.49-2.40); P: 0.839 | 0.94 (0.68-1.30); P: 0.723 | 1.11 (0.51-2.44); P: 0.791 |
Notes: athe genotyping was successful in 1,003 (98.70%) NSCLC cases, and 901 (99.33%) controls for BTLA rs2171513 G>A. bAdjusted for age, sex, smoking status, alcohol consumption, and BMI (besides stratified factors accordingly) in a logistic regression model. Abbreviations: BMI: body mass index; NSCLC: non-small-cell lung cancer.
Table 7.
Stratified analyses between BTLA rs3112270 A>G polymorphism and NSCLC risk by sex, age, smoking status, alcohol consumption, and BMI.
| Variable | BTLA rs3112270 A>G (case/control)a | Adjusted ORb (95% CI); P | ||||||
|---|---|---|---|---|---|---|---|---|
| AA | GA | GG | AA | AG vs. AA | GG vs. AA | AG/GG vs. AA | GG vs. (AA/AG) | |
| Sex | ||||||||
| Male | 277/270 | 199/237 | 37/43 | 1.00 | 0.89 (0.68-1.17); P: 0.413 | 0.97 (0.58-1.62); P: 0.902 | 0.90 (0.69-1.18); P: 0.447 | 1.02 (0.62-1.68); P: 0.940 |
| Female | 250/165 | 193/151 | 31/29 | 1.00 | 0.84 (0.62-1.13); P: 0.257 | 0.72 (0.41-1.26); P: 0.250 | 0.82 (0.62-1.09); P: 0.179 | 0.78 (0.45-1.34); P: 0.367 |
| Age | ||||||||
| <59 | 243/195 | 184/163 | 31/35 | 1.00 | 0.92 (0.68-1.26); P: 0.615 | 0.81 (0.47-1.43); P: 0.472 | 0.91 (0.68-1.21); P: 0.507 | 0.84 (0.49-1.45); P: 0.539 |
| ≥59 | 284/240 | 208/225 | 37/37 | 1.00 | 0.82 (0.63-1.07); P: 0.140 | 0.84 (0.50-1.39); P: 0.493 | 0.82 (0.63-1.06); P: 0.131 | 0.92 (0.56-1.51); P: 0.733 |
| Smoking status | ||||||||
| Never | 330/339 | 246/316 | 47/56 | 1.00 | 0.81 (0.64-1.03); P: 0.081 | 0.87 (0.56-1.35); P: 0.528 | 0.82 (0.65-1.03); P: 0.084 | 0.96 (0.63-1.46); P: 0.836 |
| Ever | 197/96 | 146/72 | 21/16 | 1.00 | 1.01 (0.69-1.47); P: 0.980 | 0.67 (0.33-1.37); P: 0.278 | 0.94 (0.66-1.36); P: 0.758 | 0.67 (0.34-1.35); P: 0.263 |
| Alcohol consumption | ||||||||
| Never | 410/383 | 312/350 | 56/66 | 1.00 | 0.85 (0.69-1.06); P: 0.156 | 0.78 (0.52-1.17); P: 0.230 | 0.84 (0.69-1.04); P: 0.106 | 0.84 (0.57-1.24); P: 0.380 |
| Ever | 117/52 | 80/38 | 12/6 | 1.00 | 0.89 (0.52-1.52); P: 0.666 | 1.14 (0.38-3.46); P: 0.818 | 0.92 (0.55-1.54); P: 0.747 | 1.20 (0.41-3.55); P: 0.742 |
| BMI (kg/m2) | ||||||||
| <24 | 355/233 | 255/217 | 49/43 | 1.00 | 0.79 (0.61-1.02); P: 0.070 | 0.81 (0.51-1.29); P: 0.369 | 0.79 (0.62-1.01); P: 0.063 | 0.90 (0.57-1.41); P: 0.646 |
| ≥24 | 172/202 | 137/171 | 19/29 | 1.00 | 0.96 (0.70-1.32); P: 0.787 | 0.82 (0.34-1.55); P: 0.543 | 0.94 (0.69-1.27); P: 0.677 | 0.84 (0.45-1.56); P: 0.574 |
Notes: athe genotyping was successful in 1,003 (98.40%) NSCLC cases, and 901 (99.33%) controls for BTLA rs3112270 A>G; badjusted for age, sex, smoking status, alcohol consumption, and BMI (besides stratified factors accordingly) in a logistic regression model. Abbreviations: BMI: body mass index; NSCLC: non-small-cell lung cancer.
Table 8.
Stratified analyses between BTLA rs16859629 T>C polymorphism and NSCLC risk by sex, age, smoking status, and alcohol consumption.
| Variable | BTLA rs16859629 T>C (case/control)a | Adjusted ORb (95% CI); P | ||||||
|---|---|---|---|---|---|---|---|---|
| TT | TC | CC | TT | TC vs. TT | CC vs. TT | TC/CC vs. TT | CC vs. (TT/TC) | |
| Sex | ||||||||
| Male | 435/459 | 70/81 | 3/1 | 1.00 | 0.91 (0.63-1.33); P: 0.636 | 5.89 (0.56-61.95); P: 0.140 | 0.96 (0.66-1.39); P: 0.815 | 5.97 (0.57-62.73); P: 0.137 |
| Female | 400/287 | 61/51 | 4/4 | 1.00 | 0.85 (0.57-1.29); P: 0.455 | 0.70 (0.17-2.89); P: 0.618 | 0.84 (0.57-1.26); P: 0.402 | 0.71 (0.17-2.95); P: 0.640 |
| Age | ||||||||
| <59 | 387/325 | 58/58 | 4/3 | 1.00 | 0.80 (0.52-1.22); P: 0.303 | 1.17 (0.24-5.76); P: 0.848 | 0.82 (0.54-1.24); P: 0.342 | 1.21 (0.45-5.93); P: 0.819 |
| ≥59 | 448/421 | 73/74 | 3/2 | 1.00 | 0.96 (0.67-1.39); P: 0.843 | 1.56 (0.24-10.30); P: 0.643 | 0.98 (0.68-1.41); P: 0.908 | 1.57 (0.24-10.35); P: 0.639 |
| Smoking status | ||||||||
| Never | 527/593 | 80/107 | 6/5 | 1.00 | 0.85 (0.61-1.18); P: 0.325 | 1.21 (0.35-4.19); P: 0.766 | 0.87 (0.63-1.19); P: 0.376 | 1.24 (0.36-4.29); P: 0.738 |
| Ever | 308/153 | 51/25 | 1/0 | 1.00 | 1.00 (0.59-1.70); P: 0.988 | - | 1.02 (0.60-1.72); P: 0.945 | - |
| Alcohol consumption | ||||||||
| Never | 659/665 | 102/117 | 6/5 | 1.00 | 0.89 (0.66-1.21); P: 0.457 | 1.24 (0.36-4.31); P: 0.734 | 0.91 (0.68-1.22); P: 0.513 | 1.26 (0.36-4.37); P: 0.715 |
| Ever | 176/81 | 29/15 | 1/0 | 1.00 | 0.86 (0.42-1.75); P: 0.681 | - | 0.89 (0.44-1.80); P: 0.735 | - |
| BMI (kg/m2) | ||||||||
| <24 | 557/411 | 88/71 | 4/2 | 1.00 | 0.92 (0.65-1.32); P: 0.658 | 1.81 (0.30-10.83); P: 0.514 | 0.95 (0.67-1.34); P: 0.752 | 1.84 (0.31-10.95); P: 0.505 |
| ≥24 | 278/335 | 43/61 | 3/3 | 1.00 | 0.83 (0.53-1.29); P: 0.411 | 1.08 (0.20-5.86); P: 0.930 | 0.84 (0.55-1.30); P: 0.437 | 1.11 (0.20-6.00); P: 0.906 |
Notes: athe genotyping was successful in 1,003 (97.01%) NSCLC cases, and 901 (98.00%) controls for BTLA rs16859629 T>C; badjusted for age, sex, smoking status, alcohol consumption, and BMI (besides stratified factors accordingly) in a logistic regression model. Abbreviations: BMI: body mass index; NSCLC: non-small-cell lung cancer.
3.4. SNP Haplotypes
The SHESIS software online (http://analysis.bio-x.cn/myAnalysis.php) was used to perform the haplotype analysis. If the probability of BTLA haploid in the case-control study is less than 0.03, it is classified as others. In the end, six subgroups were built. The results are shown in Table 9 and Figure 1. No significant linkage disequilibrium (LD) relationship was observed among the BTLA rs16859629, rs1982809, rs2171513, and rs3112270 (r2 < 0.8). It was found that compared to BTLA Trs16859629Grs1982809Grs2171513Ars3112270 haplotype, the haplotype BTLA Trs16859629Ars1982809Grs2171513Grs3112270 significantly reduced the susceptibility to NSCLC (OR = 0.66, 95%CI = 0.659‐0.930, and P = 0.005).
Table 9.
BTLA haplotype analysis.
| Haplotypes | Case (n = 2006) | Control (n = 1802) | Crude OR (95% CI) | P | ||
|---|---|---|---|---|---|---|
| n | % | n | % | |||
| T G G A | 1015 | 52.40 | 854 | 48.40 | 1.00 | |
| T A G G | 295 | 15.30 | 330 | 18.70 | 0.661 (0.659-0.930) | 0.005 |
| T G A A | 207 | 10.70 | 189 | 10.70 | 0.843 (0.810-1.229) | 0.982 |
| T G A G | 100 | 5.20 | 102 | 5.80 | 0.757 (0.674-1.189) | 0.446 |
| C G G A | 80 | 4.10 | 92 | 5.20 | 0.662 (0.577-1.066) | 0.119 |
| T A G A | 63 | 3.30 | 47 | 2.70 | 1.034 (0.836-1.794) | 0.298 |
| T G G G | 49 | 2.50 | 48 | 2.70 | 0.919 (0.614-1.374) | 0.680 |
| T A A A | 42 | 2.20 | 48 | 2.70 | 0.674 (0.525-1.213) | 0.291 |
| C A G G | 47 | 2.40 | 37 | 2.10 | 0.972 (0.745-1.779) | 0.526 |
| Others | 37 | 1.90 | 17 | 0.90 | 3.595 (1.502-12.065) | <0.003 |
The haplotypes were constructed in the sequence of BTLA rs16859629 T>C, rs1982809 G>A, rs2171513 G>A, and rs3112270 A>G.
Figure 1.
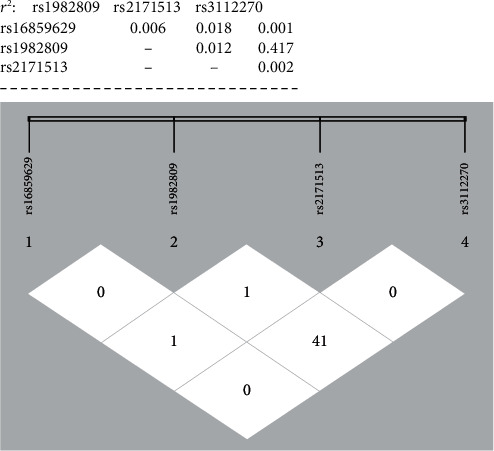
There was no significant linkage disequilibrium between BTLA polymorphisms (r2 < 0.8).
4. Discussion
The pathogenesis of LC is overly complex. It is believed that LC might be a disease driven by multiple genes [22]. Epidemiological studies have proved the correlation of the etiology of LC and the gene-environment interaction [23, 24]. Recently, immune checkpoint inhibitors have attracted remarkable attention in cancer treatment. For instance, PD-1 and CTLA-4 immunity inhibitors have achieved certain efficacy in the treatment of advanced LC [25]. Nonetheless, the cause of LC is still largely unclear. A previous study had reported that overexpression of BTLA could predict a poor prognosis in NSCLC patients [12].
In the present case-control study, the potential relationship between the BTLA rs1982809 G>A, rs16859629 T>C, rs2171513 G>A, and rs3112270 A>G SNPs and susceptibility to NSCLC was explored [23, 26]. It was found that BTLA rs1982809 polymorphism might reduce the risk of overall NSCLC. But candidate locus of BTLA rs2171513, rs3112270, and rs16859629 SNPs could not affect the susceptibility to NSCLC. In NSCLC subgroup analysis, BTLA rs16859629 SNPs could increase the risk of SCC. However, BTLA rs1982809 SNPs might reduce susceptibility to non-SCC. In addition, BTLA rs1982809 SNPs could reduce the susceptibility to NSCLC in the BMI ≥ 24 kg/m2, ≥59 year, and never drinking subgroups. To the best of our knowledge, the present study for the first time reports the relationship between BTLA SNPs and NSCLC susceptibility in the Chinese population.
BTLA rs1982809, as a locus in the 3′-untranslated region (UTR), has been reported to exhibit an association with the development of some malignancies. The 3′-UTR plays a crucial role in the regulation of mRNA expression [27, 28]. Karabon et al. reported that BTLA could exert its effects on T-lymphocytes by affecting mRNA expression levels due to T to C substitutions of rs1982809 [16]. Additionally, it was also reported that BTLA rs1982809 might act as a potential biomarker in predicting the multiple organ dysfunction syndrome. In another study, rs1982809 polymorphism of the BTLA was found to be associated with the risk of kidney cancer [17]. Similarly, in our previous study, we report that the gene variation in BTLA rs1982809 increased the susceptibility to EGJA in ever smoking subjects [18]. In contrary, Cao et al. concluded that the distribution of genotype in BTLA rs1982809 was not different from the ESCC and the control group [19]. In short, the previous results were ambiguous, even contradictory. Considering that genetic variations played different roles in different cancers, 1,904 participants were enrolled to conduct a more precise evaluation. In this study, we showed that the G to A changes of BTLA rs1982809 genotype reduced the overall risk of NSCLC, especially the non-SCC, BMI ≥ 24 kg/m2, ≥59 year, and never drinking subgroups. These facts indicated that BTLA rs1982809 polymorphism could play a critical role in the susceptibility to NSCLC. However, our findings should be interpreted with cautions. Studies with larger sample sizes are required to further validate the effects of this locus on NSCLC.
The BTLA rs16859629 SNP, which is located in the intron variant sequence, plays an important role in alternative splicing [29]. It has been reported that SNP located in the intron regions may affect the susceptibility to several human diseases [30–32]. When adjusted for including 5 covariates by regression analysis, it was found that BTLA rs16859629 SNP increased the risk of SCC. In two recent studies, the genotype distribution of BTLA rs16859629 showed no statistically significant differences between EGJA cases and controls and the same conclusion was made for susceptibility to ESCC [18, 19]. Interestingly, the present study first explored that BTLA rs16859629 SNP could promote the susceptibility to cancer. However, considering that the number of SCC was relatively small, the results might not be convincing enough. In the future, a larger case-control group study should be performed to unveil the susceptibility relationship between BTLA rs16859629 and SCC.
Previous studies have shown that the genetics of the SNP locus in the BTLA rs16859629, rs1982809, rs2171513, and rs3112270 may not be random [18]. In the present study, it was found that haploid type of the four candidate SNP loci may play an important role in heredity. It was found that the haplotype BTLA Trs16859629Ars1982809Grs2171513Grs3112270 could significantly change the susceptibility to NSCLC, affecting 18.70% of the normal population. Interestingly, compared to the study by Tang et al. [18], it was found that with alteration of rs1982809, the effect of this single locus on haplotype significantly reversed the association with cancer. When BTLA rs1982809 was allele A, it decreased the risk of NSCLC. This is in contrary to the findings of Tang et al. [18]. However, our findings need to be further verified in the future studies. In addition, stepwise analysis of the SPSS 23 software was used to analyze the correlation of age, sex, smoking, drinking, BMI, and the four candidate SNPs. We found that the BTLA rs1982809 among the four candidate SNPs may be a key factor affecting the susceptibility to NSCLC. The detailed results are shown in supplementary document 1.
Despite some interesting findings, our study suffers from the following potential limitations. Firstly, our sample is only from two hospitals, the Affiliated Hospital of Fujian Medical University and Jiangsu University. Although the four selected SNPs were consistent with HWE and there is no significant difference between MAF and database of Chinese Han populations, the bias might still be unavoidable. Secondly, the sample sizes of some subgroups are relatively small, especially in the SCC subgroup. As such, our conclusions may not be sufficient to testify the real relationship of BTLA polymorphisms with susceptibility to SCC. The replication of the study with larger sample sizes is required to further validate our findings. Thirdly, only four functional loci in BTLA gene were selected in our study, and, therefore, other polymorphisms of BTLA should not be ignored. Finally, a functional study for these identified SNPs was not performed.
5. Conclusions
Despite some shortcomings, our findings preliminarily suggest that BTLA rs1982809 and rs16859629 SNPs may contribute to the risk of NSCLC. However, a thorough study with larger samples should be worth to elucidate the potential molecular functions of these BTLA polymorphisms.
Acknowledgments
The work was supported in part by the Program for New Century Excellent Talents in Fujian Province University (NCETFJ-2017B015) and the Joint Funds for the Innovation of Science and Technology, Fujian Province (2017Y9099). The authors would like to thank all subjects who participated in this study and all the reviewers who participated in the review and MJEditor (http://www.mjeditor.com/) for its linguistic assistance during the preparation of this manuscript. We thank Dr. Yan Liu (Genesky Biotechnologies Inc., Shanghai, China) for the technical support.
Contributor Information
Weifeng Tang, Email: twf001001@126.com.
Shuchen Chen, Email: cscdoctor@163.com.
Data Availability
The data used to support the findings of this study are available from the corresponding author according to reasonable request.
Conflicts of Interest
The authors declare that they have no potential financial conflicts of interest regarding the publication of this paper.
Authors' Contributions
Weifeng Tang and Shuchen Chen contributed to the conception and design; Shuchen Chen participated in the administrative support; Jusi Wang, Rui Cao, Zhan Chen, and Qiang Zhang participated in the provision of study materials or patients; Jusi Wang, Tingyu Chen, and Chengxiong You contributed to the collection and assembly of data; data analysis and interpretation were done by Jusi Wang and Weifeng Tang; manuscript writing was done by Jusi Wang; Weifeng Tang and Shuchen Chen participated in writing—review and editing.
Supplementary Materials
Please see the document 1 about stepwise analysis of BTLA rs16859629, rs1982809, rs2171513, and rs3112270.
References
- 1.Chen W., Zheng R., Baade P. D., et al. Cancer statistics in China, 2015. CA: a Cancer Journal for Clinicians. 2016;66(2):115–132. doi: 10.3322/caac.21338. [DOI] [PubMed] [Google Scholar]
- 2.Wong M. C. S., Lao X. Q., Ho K. F., Goggins W. B., Tse S. L. A. Incidence and mortality of lung cancer: global trends and association with socioeconomic status. Scientific Reports. 2017;7(1):p. 14300. doi: 10.1038/s41598-017-14513-7. [DOI] [PMC free article] [PubMed] [Google Scholar]
- 3.Zhao J., Yu H., Han T., Wang W., Tong W., Zhu X. A study on the efficacy of recombinant human endostatin combined with apatinib mesylate in patients with middle and advanced stage non-small cell lung cancer. Journal of BUON. 2019;24(6):2267–2272. [PubMed] [Google Scholar]
- 4.Bray F., Ferlay J., Soerjomataram I., Siegel R. L., Torre L. A., Jemal A. Global cancer statistics 2018: GLOBOCAN estimates of incidence and mortality worldwide for 36 cancers in 185 countries. CA: a Cancer Journal for Clinicians. 2018;68(6):394–424. doi: 10.3322/caac.21492. [DOI] [PubMed] [Google Scholar]
- 5.Font-Burgada J., Sun B., Karin M. Obesity and cancer: the oil that feeds the flame. Cell Metabolism. 2016;23(1):48–62. doi: 10.1016/j.cmet.2015.12.015. [DOI] [PubMed] [Google Scholar]
- 6.Yu X., Zheng Y., Mao R., Su Z., Zhang J. BTLA/HVEM signaling: milestones in research and role in chronic hepatitis B virus infection. Frontiers in Immunology. 2019;10:p. 617. doi: 10.3389/fimmu.2019.00617. [DOI] [PMC free article] [PubMed] [Google Scholar]
- 7.Watanabe N., Gavrieli M., Sedy J. R., et al. BTLA is a lymphocyte inhibitory receptor with similarities to CTLA-4 and PD-1. Nature Immunology. 2003;4(7):670–679. doi: 10.1038/ni944. [DOI] [PubMed] [Google Scholar]
- 8.Sedy J. R., Gavrieli M., Potter K. G., et al. B and T lymphocyte attenuator regulates T cell activation through interaction with herpesvirus entry mediator. Nature Immunology. 2005;6(1):90–98. doi: 10.1038/ni1144. [DOI] [PubMed] [Google Scholar]
- 9.Shi W., Shao T., Li J. Y., et al. BTLA-HVEM checkpoint axis regulates hepatic homeostasis and inflammation in a ConA-induced hepatitis model in zebrafish. Journal of Immunology. 2019;203(9):2425–2442. doi: 10.4049/jimmunol.1900458. [DOI] [PubMed] [Google Scholar]
- 10.Liu J., Li J., He M., Zhang G. L., Zhao Q. Distinct changes of BTLA and HVEM expressions in circulating CD4(+) and CD8(+) T cells in hepatocellular carcinoma patients. Journal of Immunology Research. 2018;2018 doi: 10.1155/2018/4561571.4561571 [DOI] [PMC free article] [PubMed] [Google Scholar]
- 11.Quan L., Lan X., Meng Y., et al. BTLA marks a less cytotoxic T-cell subset in diffuse large B-cell lymphoma with high expression of checkpoints. Experimental Hematology. 2018;60:47–56.e1. doi: 10.1016/j.exphem.2018.01.003. [DOI] [PubMed] [Google Scholar]
- 12.Li X., Xu Z., Cui G., Yu L., Zhang X. BTLA expression in stage I-III non-small-cell lung cancer and its correlation with PD-1/PD-L1 and clinical outcomes. Oncotargets and Therapy. 2020;Volume 13:215–224. doi: 10.2147/OTT.S232234. [DOI] [PMC free article] [PubMed] [Google Scholar]
- 13.Chen Y. L., Lin H. W., Chien C. L., et al. BTLA blockade enhances cancer therapy by inhibiting IL-6/IL-10-induced CD19(high) B lymphocytes. Journal for Immunotherapy of Cancer. 2019;7(1):p. 313. doi: 10.1186/s40425-019-0744-4. [DOI] [PMC free article] [PubMed] [Google Scholar]
- 14.Zhang R. R., Wang L. M., Shen J. J. Overexpression of miR-32 inhibits the proliferation and metastasis of ovarian cancer cells by targeting BTLA. European Review for Medical and Pharmacological Sciences. 2020;24(9):4671–4678. doi: 10.26355/eurrev_202005_21154. [DOI] [PubMed] [Google Scholar]
- 15.Fu Z., Li D., Jiang W., et al. Association of BTLA gene polymorphisms with the risk of malignant breast cancer in Chinese women of Heilongjiang Province. Breast Cancer Research and Treatment. 2010;120(1):195–202. doi: 10.1007/s10549-009-0462-6. [DOI] [PubMed] [Google Scholar]
- 16.Karabon L., Partyka A., Jasek M., et al. Intragenic variations in BTLA gene influence mRNA expression of BTLA gene in chronic lymphocytic leukemia patients and confer susceptibility to chronic lymphocytic leukemia. Archivum Immunologiae et Therapiae Experimentalis (Warsz) 2016;64(Suppl 1):137–145. doi: 10.1007/s00005-016-0430-x. [DOI] [PMC free article] [PubMed] [Google Scholar]
- 17.Partyka A., Tupikowski K., Kolodziej A., et al. Association of 3' nearby gene BTLA polymorphisms with the risk of renal cell carcinoma in the Polish population. Urologic Oncology. 2016;34(9):419–e13-9. doi: 10.1016/j.urolonc.2016.04.010. [DOI] [PubMed] [Google Scholar]
- 18.Tang W., Chen S., Kang M., Liu J., Liu C. Investigation of BTLA tagging variants with risk of esophagogastric junction adenocarcinoma. Bioscience Reports. 2019;39(12) doi: 10.1042/BSR20191770. [DOI] [PMC free article] [PubMed] [Google Scholar]
- 19.Cao R., Tang W., Chen S. Association between BTLA polymorphisms and susceptibility to esophageal squamous cell carcinoma in the Chinese population. Journal of Clinical Laboratory Analysis. 2020;34(6, article e23221) doi: 10.1002/jcla.23221. [DOI] [PMC free article] [PubMed] [Google Scholar]
- 20.Zhai Y., Zhao W. H., Chen C. M. Verification on the cut-offs of waist circumference for defining central obesity in Chinese elderly and tall adults. Zhonghua Liu Xing Bing Xue Za Zhi. 2010;31(6):621–625. [PubMed] [Google Scholar]
- 21.Tang W., Zhang S., Qiu H., et al. Genetic variations in MTHFR and esophageal squamous cell carcinoma susceptibility in Chinese Han population. Medical Oncology. 2014;31(5):p. 915. doi: 10.1007/s12032-014-0915-6. [DOI] [PubMed] [Google Scholar]
- 22.Atal S., Asokan P., Jhaj R. Recent advances in targeted small-molecule inhibitor therapy for non-small-cell lung cancer-an update. Journal of Clinical Pharmacy and Therapeutics. 2020;45(3):580–584. doi: 10.1111/jcpt.13121. [DOI] [PubMed] [Google Scholar]
- 23.Mao Y., Yang D., He J., Krasna M. J. Epidemiology of lung cancer. Surgical Oncology Clinics of North America. 2016;25(3):439–445. doi: 10.1016/j.soc.2016.02.001. [DOI] [PubMed] [Google Scholar]
- 24.Parris B. A., O’Farrell H. E., Fong K. M., Yang I. A. Chronic obstructive pulmonary disease (COPD) and lung cancer: common pathways for pathogenesis. Journal of Thoracic Disease. 2019;11(Suppl 17):S2155–s2172. doi: 10.21037/jtd.2019.10.54. [DOI] [PMC free article] [PubMed] [Google Scholar]
- 25.Califano R., Gomes F., Ackermann C. J., Rafee S., Tsakonas G., Ekman S. Immune checkpoint blockade for non-small cell lung cancer: what is the role in the special populations? European Journal of Cancer. 2020;125:1–11. doi: 10.1016/j.ejca.2019.11.010. [DOI] [PubMed] [Google Scholar]
- 26.Hung R. J., Spitz M. R., Houlston R. S., et al. Lung cancer risk in never-smokers of European descent is associated with genetic variation in the 5(p)15.33 TERT-CLPTM1Ll region. Journal of Thoracic Oncology. 2019;14(8):1360–1369. doi: 10.1016/j.jtho.2019.04.008. [DOI] [PMC free article] [PubMed] [Google Scholar]
- 27.Mayya V. K., Duchaine T. F. Ciphers and executioners: how 3'-untranslated regions determine the fate of messenger RNAs. Frontiers in Genetics. 2019;10:p. 6. doi: 10.3389/fgene.2019.00006. [DOI] [PMC free article] [PubMed] [Google Scholar]
- 28.Gruber A. J., Schmidt R., Ghosh S., et al. Discovery of physiological and cancer-related regulators of 3' UTR processing with KAPAC. Genome Biology. 2018;19(1):p. 44. doi: 10.1186/s13059-018-1415-3. [DOI] [PMC free article] [PubMed] [Google Scholar]
- 29.Majewski J., Ott J. Distribution and characterization of regulatory elements in the human genome. Genome Research. 2002;12(12):1827–1836. doi: 10.1101/gr.606402. [DOI] [PMC free article] [PubMed] [Google Scholar]
- 30.He Q., Lu Y., Hu S., et al. An intron SNP rs807185 in ATG4A decreases the risk of lung cancer in a southwest Chinese population. European Journal of Cancer Prevention. 2016;25(4):255–258. doi: 10.1097/CEJ.0000000000000174. [DOI] [PubMed] [Google Scholar]
- 31.Moon S., Lee Y., Won S., Lee J. Multiple genotype-phenotype association study reveals intronic variant pair on SIDT2 associated with metabolic syndrome in a Korean population. Human Genomics. 2018;12(1):p. 48. doi: 10.1186/s40246-018-0180-4. [DOI] [PMC free article] [PubMed] [Google Scholar]
- 32.Matkovich S. J., van Booven D. J., Cappola T. P., Dorn II G. W. Association of an intronic, but not any exonic, FRMD4B sequence variant and heart failure. Clinical and Translational Science. 2010;3(4):134–139. doi: 10.1111/j.1752-8062.2010.00220.x. [DOI] [PMC free article] [PubMed] [Google Scholar]
Associated Data
This section collects any data citations, data availability statements, or supplementary materials included in this article.
Supplementary Materials
Please see the document 1 about stepwise analysis of BTLA rs16859629, rs1982809, rs2171513, and rs3112270.
Data Availability Statement
The data used to support the findings of this study are available from the corresponding author according to reasonable request.