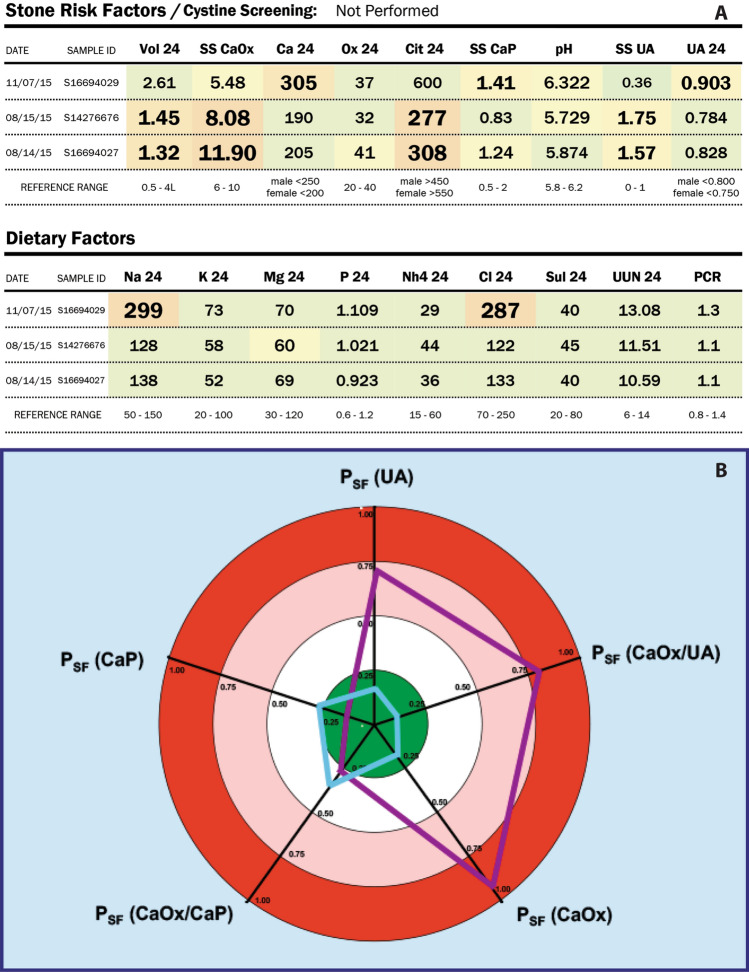
Fig. 1.
Examples of urine analysis reports that include graphical features to aid in interpretation. a Part of the LithoLink report (Laboratory Corporation of America, Burlington, NC, USA) for 24-h urine results. Note that measures that are out of the normal range are highlighted both by a change in background colour and an increase in the size and boldness of the typeface. The history of the patient is also shown, with the most recent results on the top line. Note that in this case, the patient has significantly increased the urine volume, and thereby reduced the supersaturation value for calcium oxalate (SS CaOx). However, this was done along with a dramatic increase in dietary salt (Na 24), which likely led to the increase in urine calcium (Ca 24), which was part of what drove an increase in the supersaturation value for calcium phosphate (SS CaP). b Part of the graphical report for urine results from the LITHOSCREEN system for assessing stone patients [29]. Note that targeted values (least likely to lead to a stone recurrence) are at the centre of the diagram, in the green bull’s eye. PSF indicates the Robertson biochemical risk of forming stones as described above under Q12. The initial untreated PSF values for the patient are shown in the purple lines and shape, and the values after treatment are shown in light blue. Before treatment, this patient was at risk of forming both uric acid and calcium oxalate stones or a mixture of the two. Following suitable dietary treatment, the PSF values of the patient all fell into the green bull’s eye. Similar target diagrams are also available for both 24-h urine and dietary composition [29]

