

Abstract
Pericytes are a unique class of mural cells essential for angiogenesis, maintenance of the vasculature and are key players in microvascular pathology. However, their diversity and specific roles are poorly understood, limiting our insight into vascular physiology and the ability to develop effective therapies. Here, in the mouse retina, a tractable model of the CNS, we evaluated distinct classes of mural cells along the vascular tree for both structural characterization and physiological manipulation of blood flow. To accomplish this, we first tested three inducible mural cell-specific mouse lines using a sensitive Ai14 reporter and tamoxifen application either by a systemic injection, or by local administration in the form of eye drops. The specificity and pattern of cre activation varied significantly across the three lines, under either the PDGFRβ or NG2 promoter (Pdgfrβ-CreRha, Pdgfrβ-CreCsln, Cspg4-Cre). In particular, a mouse line with Cre under the NG2 promoter resulted in sparse TdTomato labeling of mural cells, allowing for an unambiguous characterization of anatomical features of individual sphincter cells and capillary pericytes. Furthermore, in one PDGFRβ line, we found that focal eye drop application of tamoxifen led to an exclusive Cre-activation in pericytes, without affecting arterial mural cells. We then used this approach to boost capillary blood flow by selective expression of Halorhodopsin, a highly precise hyperpolarizing optogenetic actuator. The ability to exclusively target capillary pericytes may prove a precise and potentially powerful tool to treat microcirculation deficits, a common pathology in numerous diseases.
Keywords: Mural cells, pericyte, precapillary sphincter, retina, optogenetics, Halorhodopsin
Ivanova et al. use sparse labeling of mural cells in the retina to identify pericyte diversity and to selectively manipulate capillary blood flow
1 |. INTRODUCTION
Pericytes comprise a heterogeneous population of mural cells with a variety of functions, yet their identity remains a topic of intense debate (Attwell, Mishra, Hall, O’Farrell, & Dalkara, 2016). In the CNS, capillary pericytes have the highest densities and ratio to endothelial cells, and are thought to be essential to angiogenesis, neovascularization, blood-brain-barrier function and dynamic control of blood flow (Bergers & Song, 2005). Accumulating evidence links pericyte failure to major brain pathologies such as stroke, Alzheimer’s disease, BBB impairment, neurodegeneration and traumatic brain injury (Dias et al., 2018; Li et al., 2017). Therefore, a better understanding of pericyte subtypes and their unique roles is needed for the development of effective therapeutic strategies.
Several inducible Cre mouse lines have been developed specifically to dissect pericyte contribution to CNS physiology and pathology, expressing Cre under either the PDGRFβ (Table 1, line 1–2) or the NG2 promoters (Table 1, line 3). The PDGRFβ-mT/mG line (Muzumdar, Tasic, Miyamichi, Li, & Luo, 2007), marks a majority of mural cells across the CNS at P6 (Eilken et al., 2017). Conversely, the CSPG4-mT/mG line, assessed in the same study demonstrated minimal expression in mural cells as well as off-target expression in glial cells. However, these lines were not validated in adulthood with no display of off-target expression and no evaluation of the specificity for selective mural cell types. The PDGFRβ-cre mouse was validated in the CNS, including the retina at a variety of developmental stages using two reporter lines (Cuervo et al., 2017). When crossed with a sensitive TdTomato reporter (Madisen et al., 2010) around 84% of mural cells were positive at P5. At 6 weeks, all types of mural cells were found to express the reporter. Therefore, a lack of experimental consistency makes it hard to fully utilize this approach for pericyte physiology. Moreover, no organ specific targeting has been established, which is important to the development of therapeutics.
TABLE 1.
Commercially available mouse lines with tamoxifen-inducible Cre in vascular mural cells
| Mouse line | Promoter, approach | Age of induction | Reported phenotype repNG2+/NG2+repNG2+/rep | Background CreERT2-Reporter, No Tam | Reference |
|---|---|---|---|---|---|
| B6.Cg-Tg(Pdgfrβ-cre/ERT2)6096Rha/J JAX 029684 RRID:IMSR_JAX:029684 | Pdgfrβ, tamoxife n ip | P6 | 100% / 100% | not available | (Eilken et al., 2017) |
| B6.Cg-Pdgfrβtm1.1 (cre/ERT2)Csln/J JAX 030201 RRID:IMSR_JAX:030201 | Pdgfrβ, tamoxife n ip | P1-P42 | 84% / few percent of glial cells | not available | (Cuervo et al., 2017) |
| B6.Cg-Tg(Cspg4-cre/Esr1*)BAkik/J JAX 008538 RRID:IMSR_JAX:008538 | NG2 BAC 4-OHT | P2-P60 | 45 – 50% / 90% < 1% neurons | none | (Zhu et al., 2011) |
| B6.Cg-Gt(ROSA) 26Sortm14(CAG-tdTomato)Hze/J JAX 007914 RRID:IMSR_JAX:007914 | CAG | reporter line | none | none | (Madisen et al., 2010) |
| B6;129S-Gt(ROSA)26Sortm39(CAG-hop/EYFP)Hze/J JAX 014539 RRID:IMSR_JAX:014539 | CAG | reporter line / inactive Halorhodopsin | none | none | (Madisen et al., 2012) |
To address these limitations in the characterization of retinal mural cells, we characterized activation patterns of tamoxifen-inducible mural cell specific CreERT2 mouse lines with a highly sensitive Ai14 TdTomato reporter line. The three mouse lines described above (Table 1, lines 1–3) drive expression of TdTomato under either the NG2 or PDGRFβ promoter, enabling in vivo, ex vivo and structural characterization in the retina. Indeed, the retina is an accessible layered part of the brain that has been used as an ideal model to study CNS angiogenesis (Stahl et al., 2010) and blood flow (Kornfield & Newman, 2014) in health and pathological conditions. Angiogenesis and vascular maintenance are essential for proper organ development and function, particularly in the highly metabolically demanding central nervous system (Potente, Gerhardt, & Carmeliet, 2011). In contrast to the rest of the brain, the retinal vascular system develops after birth and is very well-characterized spatially and temporally (Stahl et al., 2010). The architecture of the retina and its vascular system is conserved among the vertebrates (Hoon, Okawa, Della Santina, & Wong, 2014). Direct non-invasive assessment of developing vasculature at the cellular level is possible using advanced confocal and two-photon microscopy. Additionally, the retina is the most metabolically demanding tissue in the human body by weight (Wong-Riley, 2010), and it must therefore be nourished by a large blood supply. There are a number of diseases in the retina that are affected or driven by pericyte pathology (Hammes et al., 2002).
Using sparse Cre-activation in isolated mural cells, we characterized the morphology of mural cells along distinct regions of the vascular tree. Specifically, the structure of sphincter pericytes and capillary pericytes was determined. With an eye-drop tamoxifen treatment we were able to selectively activate Cre in capillary pericytes but not in arterial smooth muscle cells. As a proof of concept for pericyte-driven optogenetic therapeutics, we selectively expressed Halorhodopsin in capillary pericytes and achieved Halorhodopsin-assisted blood flow enhancement in retinal capillaries in vivo.
2 |. METHODS
2.1 |. Animals
All animal procedures were performed in accordance with the Institutional Animal Care and Use Committee of Weill Cornell Medicine, and in accordance with the National Institutes of Health Guide for the care and use of laboratory animals. All mouse lines were purchased from Jackson Laboratories (Table 1).
To evaluate Cre activation patterns, CreERT2 mouse lines were crossed with either Ai14 or Halorhodopsin reporter lines. All experiments were conducted in mice heterozygous for both Cre and reporter genes. After genotyping, one group of animals was treated with standard intraperitoneal (ip) injections of 100 μl 20 mg/ml tamoxifen in corn oil daily for five consecutive days (Jackson Laboratories protocol). The other group was treated by topical eye drops of 5 μl 5 mg/ml tamoxifen in corn oil three times a day for five consecutive days (Schlecht, Leimbeck, Tamm, & Braunger, 2016). As controls, Cre and TdTomato-positive mice were treated with corn oil either via ip or via eye drops. Three to ten days after the final tamoxifen treatment, tissue was collected and analyzed for efficiency and specificity of TdTomato expression.
2.2 |. Two-photon recordings of retinal capillary blood flow
For in vivo blood flow characterization, the tail vein was injected with 200 μl Sulforhodamine 101 (SR101, 10 mM, Sigma, #S7635) 10 min prior to anesthesia. Each animal was initially anesthetized with a mixture of 75 mg/kg ketamine and 7.5 mg/kg xylazine. The pupils were dilated with a 0.5% tropicamide ophthalmic solution, and a coverslip was placed on each eye with GONAK ophthalmic solution. Mice were mounted with a SG-4N mouse head holder (Narishige) on an upright ThorLabs Bergamo II two-photon microscope. During recordings, mice were placed on a heat pad and covered with a blanket, to maintain physiological temperature. Blood flow was measured using a 10X super apochromatic objective with a 7.77 mm working distance and 0.5 NA (TL10X-2P, ThorLabs, Newton, NJ). Using a long working distance, we first placed the objective as close to the eye as possible with the focus beyond the retina and without any fluorescent illumination. The focus was achieved in two-photon mode by moving the objective away from the eye. SR101 was illuminated with a 920 nm wavelength and the measurements were taken at a rate of 116 frames per second. At first, baseline blood flow was recorded for 30 s. During this time, superficial, intermediate and deep capillary layers were measured by manually focusing through the retina; each vascular layer was recorded for several seconds. Following baseline recordings, the eye was illuminated for 20 s through the same objective using a 550–575 nm green LED (Thorlabs, M565L3). After light stimulation, each vascular layer was recorded for a total of 30 s. The time-lapse images were corrected for background, filtered with a Gaussian filter, and, when necessary, stabilized in Fiji (NIH). A stabilization plugin was used to eliminate strong movements of capillaries during deep animal breathing. Blood flow was estimated as the number of blood cells passing through a capillary per second. This analysis was performed in Fiji by plotting fluorescence profiles across blood vessels for every frame. In the resulting plot, troughs indicate the passage of a blood cell, which was darker relative to the plasma labeled with SR101. The peaks were automatically detected in Microsoft Excel and verified by visual inspection of the original data (Ivanova, Alam, Prusky, & Sagdullaev, 2019).
2.3 |. Immunocytochemistry
The method of eye removal and retinal dissection has been previously described (Ivanova, Toychiev, Yee, & Sagdullaev, 2013). Briefly, following euthanasia, eyes were removed and placed in bicarbonate-buffered Ames’ medium (Sigma Aldrich, St Louis, MO) equilibrated with 95% O2 and 5% CO2. The cornea was removed by an encircling cut above the ora serrata, and the iris, lens, and vitreous were extracted. The remaining eyecup, with the retina still attached to the pigment epithelium, was submersion-fixed on a shaker in freshly prepared 4% paraformaldehyde in 0.1 M phosphate saline (PBS, pH = 7.3) for 20 min at room temperature. After fixation, the eye cups were washed in PBS for 2 h and the retinas were detached from the eye-cups. Isolated retinas were blocked for 10 h in a PBS solution containing 5% Chemiblocker (membrane-blocking agent, Chemicon), 0.5% Triton X-100, and 0.05% sodium azide (Sigma). Primary antibodies were diluted in the same solution and applied for 72 h, followed by incubation for 48 h in the appropriate secondary antibody. In multi-labeling experiments, tissue was incubated in a mixture of primary antibodies, followed by a mixture of secondary antibodies. All steps were completed at room temperature. After staining, the tissue was flat-mounted on a slide, ganglion cell layer up, and coverslipped using Vectashield mounting medium (H-1000, Vector Laboratories). The coverslip was sealed in place with nail polish. To avoid extensive squeezing and damage to the retina, small pieces of a broken glass cover slip (Number 1 size) were placed in the space between the slide and the coverslip. Retinal wholemounts were imaged under a Leica SP8 confocal microscope using 20x air and 63x oil objectives.
The following primary antibody were used: mouse anti-SMA (Sigma, A5228, 1:2000, RRID:AB_262054), goat anti-CD31/PECAM-1 (RD, AF3628, 1:6000, RRID:AB_2161028), mouse anti-glutathione synthetase (MilliporeSigma, MAB302, 1:2000, RRID:AB_2110656), goat anti-PDGFRβ (RD, AF1042, 1:8000, RRID:AB_2162633), and rabbit anti-Cre recombinase (Cell Signaling, Cat. 15036, 1:2000, RRID:AB_2798694).
SMA antibody The antibody recognizes single isoform of α-SMA in rabbit, guinea pig, mouse, chicken, snake, sheep, goat, human, frog, rat, canine, and bovine. The antibody was raised against N-terminal synthetic decapeptide of α-SMA and tested in western blot and in immunolabeling of smooth muscle cells from bovine aortas using the monoclonal anti-ACTA2 antibody (manufacturer information). In the rat retina, the antibody labeled arteries and the pattern was comparable with the labeling produced by two different antibodies (FITC conjugated goat anti mouse IgG2a (Southern Biotechnology Associates) and Texas red conjugated sheep anti-mouse Ig (Amersham)(Hughes & Chan-Ling, 2004)).
CD31/PECAM-1 Detects mouse CD31/PECAM 1 in direct ELISAs and western blots (band ~130 kDa). It was raised against mouse myeloma cell NS0-derived recombinant mouse CD31Glu18-Lys590 epitope. In direct ELISAs and western blots, approximately 10% cross-reactivity with recombinant human CD31 and recombinant porcine CD31 is observed. Detected mouse CD31 and rat CD31 in flow cytometry (manufacturer information). In the retina, the antibody stained vascular endothelial cells (Fang et al., 2017; Wilhelm et al., 2016)
Glutathione synthetase antibody was raised against whole glutamine synthetase protein purified from sheep brain. The antibody was validated by western blot in human brain lysate. In the retina, our labeling revealed characteristic morphology of Muller cells and was identical to the labeling produced by a different antibody (Transduction Laboratories, (Shen et al., 2004)).
PDGFRβ antibody was raised against mouse myeloma cell line NS0-derived recombinant mouse PDGFRβ Leu32-Lys530, Accession # P05622. Antibody detects mouse PDGFRβ in direct ELISAs and Western blots (manufacturer information). It produces identical pattern to a different PDGFRβ antibody which disappears in PDFRβ deficient mice (14–1402, eBioscience, (Armulik et al., 2010)). The antibody labels pericytes in retinal wholemounts as demonstrated in NG2-DsRed mouse by colocalization with DsRed and NG2 labeling (Kovacs-Oller, Ivanova, Szarka, et al., 2020).
Cre recombinase monoclonal antibody was produced by immunizing animals with a synthetic peptide corresponding to residues near the amino terminus of bacteriophage-P1 Cre recombinase protein. In Western blot analysis, the antibody recognizes Cre in transfected 293 cells but not in the control cells (manufacturer information). In our hands, the labeling was produced in inducible Cre/TdTomato mouse lines only after tamoxifen treatment but not in oil-treated Cre/TdTomato littermates. No labeling was detected in TdTomato-positive Cre-negative mice.
We also used Griffonia simplicifolia isolectin (GS-IB4 Alexa Fluor 488, I21411, RRID:AB_2314665). Isolectin stock solution was made using 500 μg isolectin powder dissolved in 500 μl PBS-calcium solution: 8.1 mM Na2HPO4 dibasic, 1.9 mM NaH2PO4 monobasic, 154 mM NaCl, 1 mM CaCl2. Isolectin stock solution was diluted 1:400 and applied with the secondary antibodies.
2.4 |. Statistical analysis
Statistical analysis was performed in Microsoft Excel using a t-test. The data are presented as mean ± standard deviation, unless otherwise indicated. The number of samples (n) indicates the number of samples per group.
3 |. RESULTS
3.1 |. Evaluation of inducible mural cell specific Cre mouse lines for use in the retina
We used commercially available mouse lines with tamoxifen-inducible Cre in vascular mural cells (Table 1): B6.Cg-Tg(Pdgfrβ-cre/ERT2)6096Rha/J (Pdgfrβ-CreRha), B6.Cg-Pdgfrβtm1.1 (cre/ERT2)Csln/J (Pdgfrβ-CreCsln), and B6.Cg-Tg(Cspg4-cre/Esr1*)BAkik/J (Cspg4-Cre).
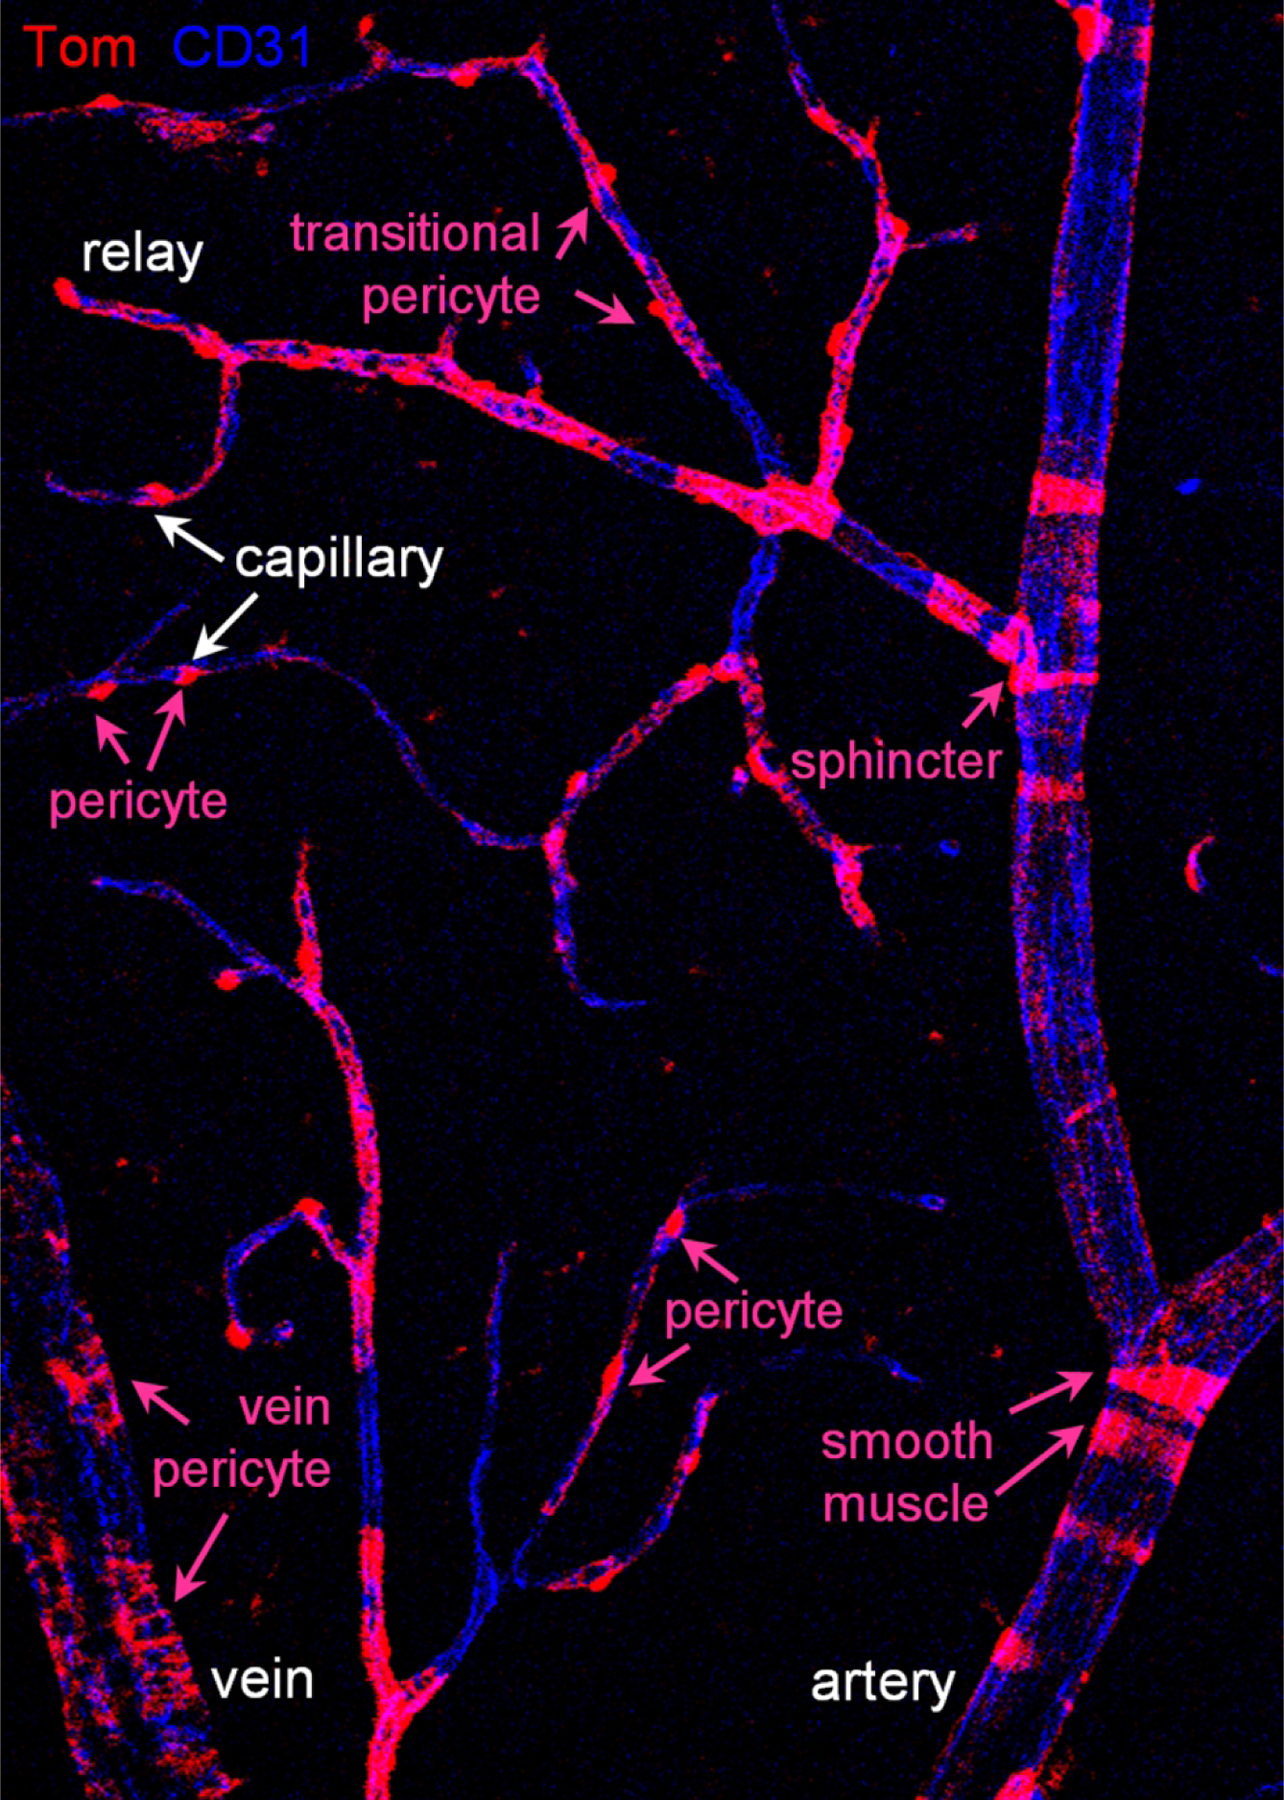
These were crossed with bright Ai14 TdTomato reporter line (abbreviated Tom, (Madisen et al., 2010)) to reveal Cre expression and activation. Offspring heterozygous for Cre and TdTomato were treated with tamoxifen starting at age P22 (Figure 1). One group of animals was treated with standard intraperitoneal injections (ip) of 100 ul 20 mg/ml tamoxifen in corn oil daily for five consecutive days (Jackson laboratories protocol). The other group was treated with 5 ul eye drops of 5 mg/ml tamoxifen in corn oil three times a day for five consecutive days (Schlecht et al., 2016). As controls, Cre-TdTomato-positive mice were treated with corn oil either via ip or via eye drops. In three to ten days after the last tamoxifen treatment, the tissue was collected and analyzed for efficiency and specificity of TdTomato expression (Figure 1b–i). We focused on the superficial layer as it contains all types of the blood vessels: artery (positive for smooth muscle cells), relay (a part of the vascular tree, originating in capillary and extending toward feeding artery (Ivanova, Kovacs-Oller, & Sagdullaev, 2019)), capillary, and vein (Figure 1c,d). Morphologically unique mural cells (magenta text) could be readily identified along the distinct vascular tree segments (white text), indicative of their function-specific vascular residence. Individual TdTomato-positive cells were further distinguished in high resolution (Figure 1e–i) using established functional markers for smooth muscle actin (SMA), endothelial cells (CD31) and basement membrane (isolectin) (Ivanova, Alam, et al., 2019). Thus, a nuanced and type-specific approach is required to evaluate the roles of diverse mural cell types on the vascular tree and to control them in genetic models.
FIGURE 1.
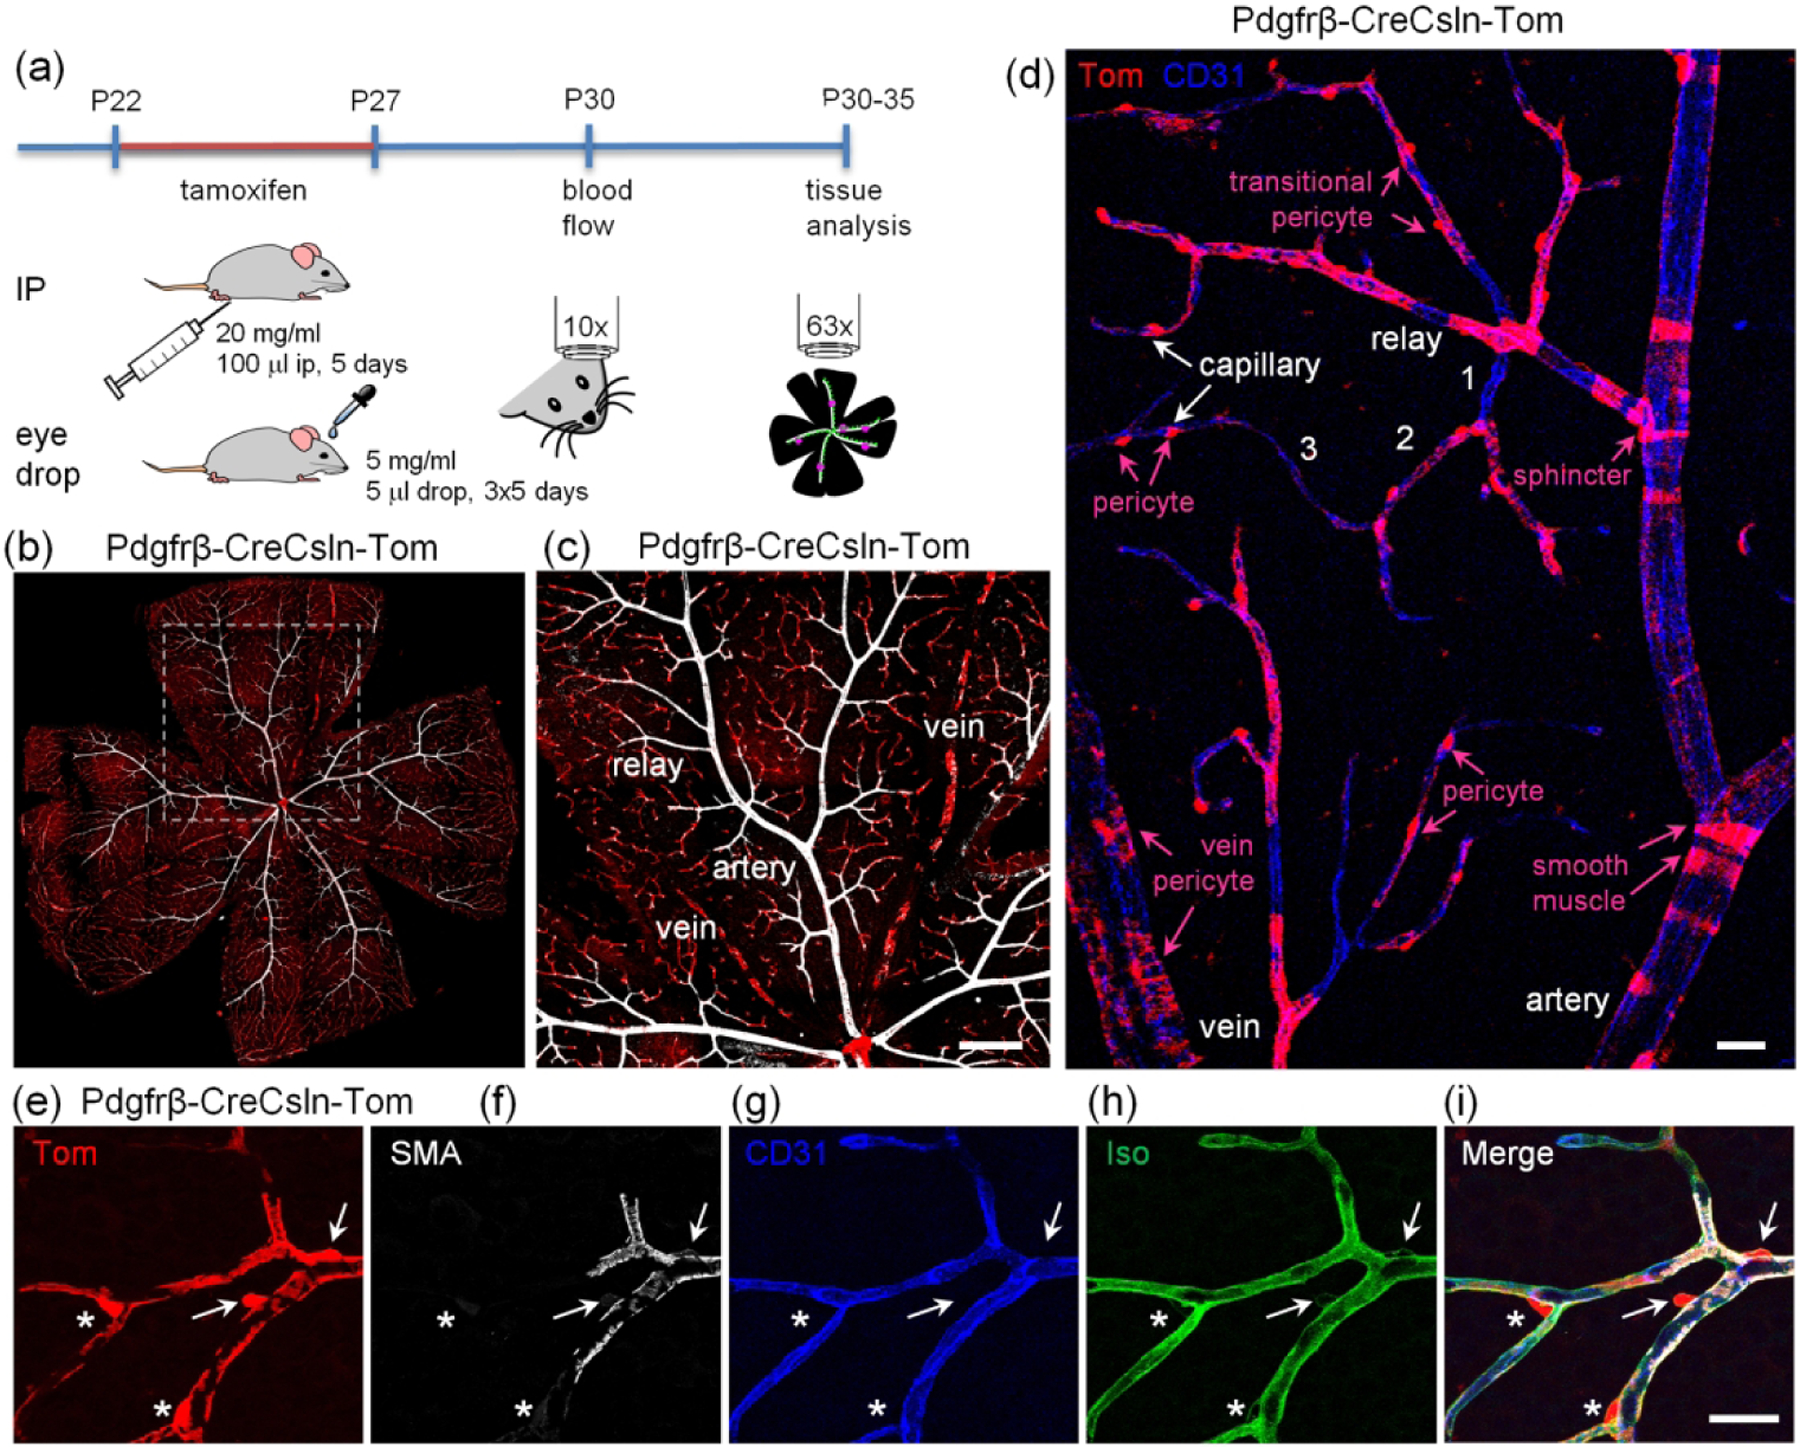
Experimental approach for activation of CreERT2 in retinal vascular contractile cells and their assessment with a TdTomato reporter. (a) Tamoxifen was delivered either by intraperitoneal injection or via eye drops. (b) Evaluation of retinal wholemounts after tamoxifen-mediated activation of CreERT2. Retinas were labeled for smooth muscle actin (SMA, white) to identify arteries, red fluorescence from TdTomato reporter line indicates active Cre. B6.Cg-Pdgfrβtm1.1 (cre/ERT2)Csln/J mouse is shown. Scale bar 200 μm. (c) High magnification image from highlighted area in (b). Scale bar 200 μm. (d) Hierarchy of the vascular tree and diversity of mural cells along the vascular branches. Vascular tree was visualized by immunolabeling for CD31, a marker of endothelial cells. Numbers indicate capillary order. Scale bar 25 μm. (e–i) Identification of TdTomato-positive cells using markers for SMA-positive contractile cells (SMA, white), endothelial cells (CD31, blue), basement membrane which covers pericytes and SMA cells (Iso, green). TdTomato-positive cells were identified as smooth muscle cells (arrows) and pericytes (asterisks). Scale bar 25 μm.
3.2 |. Identification of morphological polarization of mural cells using sparse labeling: pericytes and sphincter
To examine diverse mural cells, we used the Cspg4-Cre mouse line that produces sparse labeling of diverse mural cells (Zhu et al., 2011). When crossed to the TdTomato reporter line, the resulting Cspg4-Cre-Tom mouse had no “leaky” expression of TdTomato in the absence of tamoxifen (Figure 2a). When the mouse was treated with tamoxifen via an intraperitoneal injection, a small number of mural cells became labeled (Figure 2b). In addition to brightly labeled mural cells, a relatively weak labeling was also found outside of the vasculature (Figure 2c). Similarly, in the reporter mouse alone (Figure 2d), the same structures were weakly labeled (Figure 2e). These weakly positive structures were double-labeled for glutamine synthetase, a marker for Muller cells (Figure 2f). The majority of Muller cells were double labeled (Figure 2g) and no labeling of any mural cells was found in the reporter line. The Cspg4-Cre-Tom mice treated by tamoxifen eye drops had sparse TdTomato expression in the mural cells, with the density lower than that exhibited by ip-treated mice.
FIGURE 2.
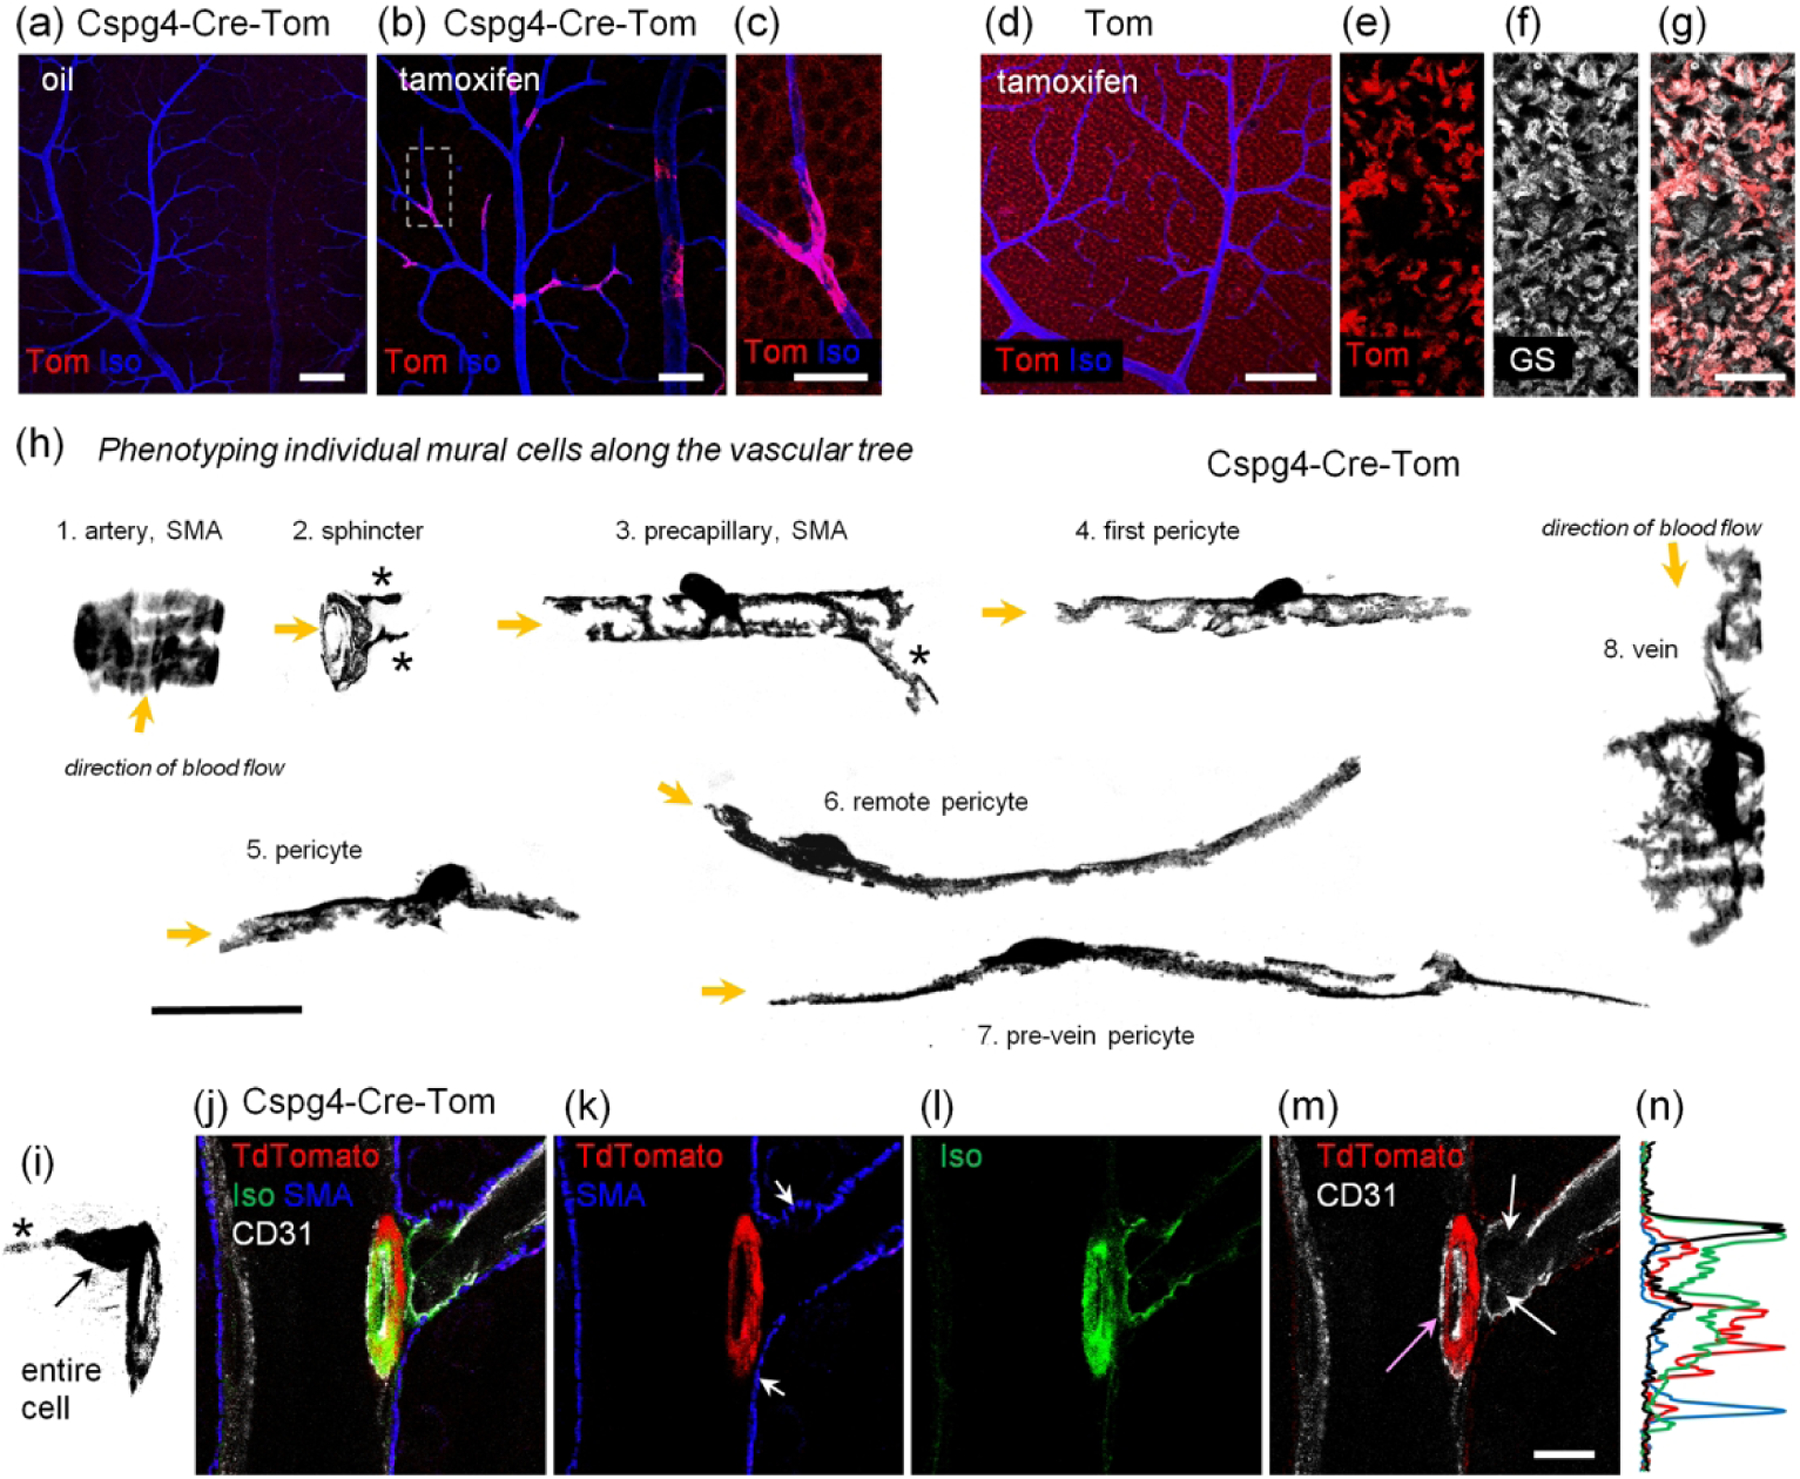
In Cspg4-Cre line, tamoxifen treatment results in Cre-induction across a sparse population of contractile vascular cells. (a) In the oil injected mice, no “leaky” activation of CreERT2 was detected. Scale bar 100 μm. (b) Tamoxifen ip induced TdTomato expression in sparsely distributed vascular mural cells. Scale bar 100 μm. (c) High resolution image from the area highlighted in (b). When TdTomato brightness was strongly amplified, weak TdTomato signal was detected around soma in the ganglion cell layer. Scale bar 20 μm. (d) In the reporter mouse, weak TdTomato signal was found in the absence of Cre. Please note that the TdTomato signal was amplified in comparison with settings for (a–b). Scale bar 100 μm. (e–g) High magnification of an area from (d) taken at the inner limiting membrane, where red TdTomato signal was colocalized with Muller cell marker, glutamine synthetase (GS, white). Scale bar 20 μm. (h) Phenotypic characterization of sparely labeled by TdTomato mural cells along the vascular tree. Cells expressing SMA are marked. Asterisks mark fine processing along branching vessels. Scale bar 25 μm. (i–n) Structural assessment of the artery branching point. Scale bar 10 μm. (i) A projection through the sphincter cell. (j) The branching complex labeled for endothelial cells (CD31, white), smooth muscle actin (SMA, blue), sphincter (TdTomato, red), and basement membrane (Iso, green). (k) Sphincter cell (red ring) has very low SMA level in comparison with surrounding SMA-positive cells (blue labeling, arrowheads). (l) The branching point is strongly insulated by especially thick basement membrane (green). (m) Two endothelial cells are located at the base of the branch (CD31, white) with additional endothelial cells surrounding the entrance into the branch (pink arrow). All endothelial cells described here were also well insulated with the basement membrane (l).
Next we characterized all types of positive mural cells in Cspg4-Cre-Tom mice (Figure 2h–n). Starting from the artery, we imaged progressively along the vascular tree towards the vein (Figure 2h). The SMA-positive cells on the artery had a compact and symmetric appearance with wide ribbon-like processes wrapping the artery from below. The “sphincter” cell positioned at the transition between the artery and precapillary region (Grubb et al., 2020) completely encircled the branch opening with fine processes expanding onto the downstream vessel. Precapillary SMA-positive mural cells had symmetric shapes, occasionally with a fine process onto the neighboring branch (Figure 2h, asterisk). Pericytes had no SMA expression and had asymmetric processes with respect to their cell body. In the direction towards the feeding artery, processes were short and dense, wrapping the capillary lumen, and resembling those seen in precapillary mural cells. The processes towards the downstream direction were long and straight. Pericytes on the finest remote capillaries had the longest processes. In contrast, the pre-vein capillary often had denser processes at the vein site. The vein pericytes had a “spider” like appearance with a dense network of fine processes.
Using the Cspg4-Cre-Tom mouse, we evaluated the sphincter cells (Figure 2i–n), a unique structure that is believed to play a role in gating blood inflow into the arterial branch (Grubb et al., 2020; Kovacs-Oller, Ivanova, Bianchimano, & .Sagdullaev, 2020; Zhang, Wu, Xu, & Puro, 2011). The soma of these cells was commonly located on the major artery, although a few cells had their somas on the branch. A fine process (asterisk) protruded from the body and was also positioned on the main artery. The major processes of this cell tightly and continuously enwrapped the entrance to the branching vessel, creating a diaphragm. Interestingly, the sphincter cells had a much lower expression of SMA relative to neighboring mural cells (Figure 2k, arrows). It was also insulated from nearby cells by a thick basement membrane (Figure 2l). This insulation could be protective against shear stress. It could also electrically decouple and chemically isolate the sphincter from the rest of the branch (Kovacs-Oller, Ivanova, Bianchimano, et al., 2020; Nakaizumi, Zhang, & Puro, 2012). Typically, three endothelial cells surrounded the sphincter, with two at the entrance to the branch and one covering the artery side (Figure 2m). Figure 2n shows a profile through the sphincter and surrounding elements, where the basement membrane strongly insulates the complex (Isolectin Alexa488, green) and SMA has a relatively low expression in the sphincter.
In summary, the labelling pattern observed in the Cspg-Cre mouse line suggest that it is useful for studying sparsely labelled mural cells, without preference for any specific subtype, including the uncommon types of mural cells.
3.3 |. Ubiquitous and pericyte-specific targeting of mural cells in the retina
To achieve wide-spread targeting of mural cells, we used the Pdgfrβ-CreRha and Pdgfrβ-CreCsln mouse lines (Figure 3). In the absence of tamoxifen, the retinas of Pdgfrβ-CreCsln-Tom mice exhibited only trace labeling of pericytes and no SMA cell labeling (Figure 3a). With tamoxifen ip injections, robust expression was achieved in all mural cells (Figure 3b and insert). As shown in the TdTomato reporter line (Figure 2d and e), weak labeling was also observed in many Muller cells. Interestingly, eye drop-tamoxifen application produced selective and complete labeling of pericytes and transitional cells on precapillary regions, but not of SMA cells on main arteries (Figure 3c).
FIGURE 3.
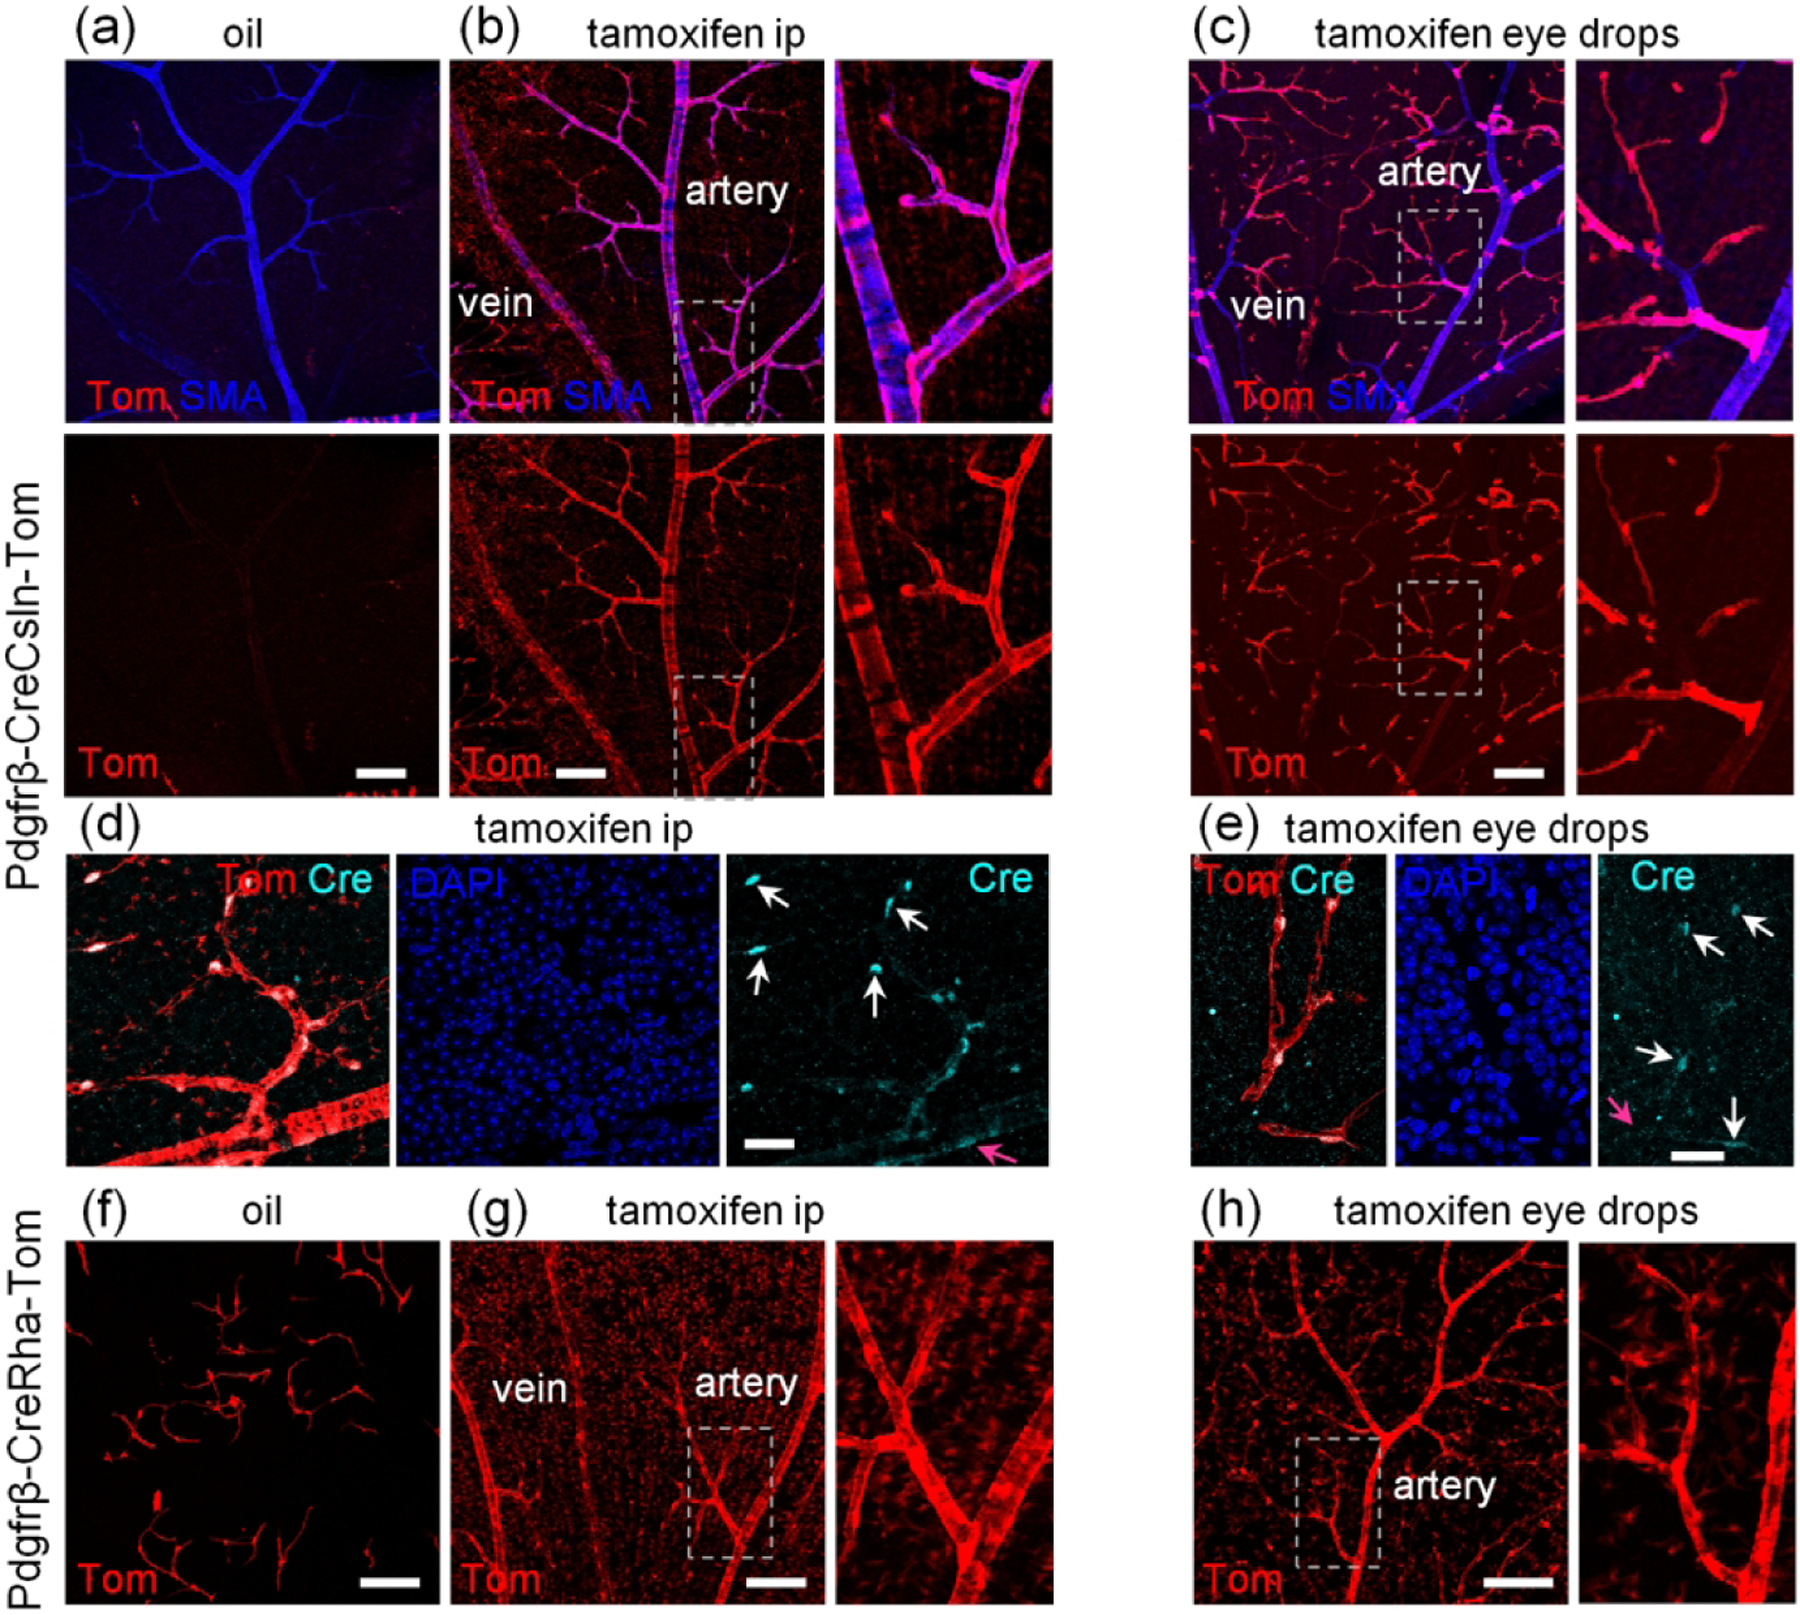
Comparison of two Pdgfrβ-CreERT2 lines for baseline activation of Cre and specificity of Cre activation after tamoxifen induction. (a) Pdgfrβ-CreCsln-Tom line had a very few TdTomato-positive mural cells without tamoxifen induction. (b) After ip tamoxifen treatment, Pdgfrβ-CreCsln-Tom line exhibited prominent TdTomato-labeling in all types of mural cells. All mural cells were positive. Weak TdTomato-expression was detected in Muller cells (magnified region). (c) In Pdgfrβ-CreCsln-Tom treated with tamoxifen eye drops, TdTomato was found predominantly in the capillaries and significantly less frequent in SMA cells and mural cells on veins. (d) After ip tamoxifen treatment, Pdgfrβ-CreCsln-Tom line showed Cre immunoreactivity in mural cell nuclei. The intensity of Cre immunolabeling was higher in pericytes (white arrows) and less in SMA cells (magenta arrows). (e) After tamoxifen eye drop treatment, Pdgfrβ-CreCsln-Tom line showed weak Cre immunoreactivity in pericytes (white arrows). Cre immunolabeling in SMA cells was below detection threshold (magenta arrow). (f) Pdgfrb-CreRha-Tom line had numerous pericytes labeled without tamoxifen treatment. (g) After tamoxifen ip, all mural cells in Pdgfrβ-CreRha-Tom line, were positive for TdTomato; in addition majority of Muller cells were labeled (magnified area). (h) After eye tamoxifen drops, all mural cells were labeled, many Muller cells were also positive. Scale bars: 100 μm in a-c and f-h, 25 μm in d-e.
When we assessed tamoxifen ip induced Cre translocation into the nucleus, the strongest Cre expression was found in pericytes (Figure 3d). After tamoxifen eye drops, we could only detect Cre in pericytes but not SMA cells (Figure 3e). Thus, in the Pdgfrβ-CreCsln line, activation of Cre in all contractile cells or in pericytes alone reflects the activity of the PDGFRβ promoter, known to be more active in pericytes than in smooth muscle cells (Armulik, Genove, & Betsholtz, 2011). In the Pdgfrβ-CreRha mouse line, the Cre activation pattern was different (Figure 3f–h). Without tamoxifen treatment, many pericytes expressed TdTomato (Figure 3f) suggesting some “leak” of Cre. Upon both tamoxifen ip or eye drop treatment, all contractile cells were targeted (Figure 3g,h). In addition, the vast majority of Muller cells were also brightly labeled.
3.4 |. Optimization of pericyte targeting in the retina and brain
The unique specificity of Cre activation in retinal pericytes after tamoxifen eye drops vs ip treatment warranted further investigation as it presents an opportunity to selectively target specific vascular regions for insight in vascular biology and treatment. For this, the animals were treated either with tamoxifen ip, tamoxifen eye drops, or oil ip (Figure 4). A coronal section through the hippocampus was chosen for brain evaluation (Figure 4a). After ip tamoxifen, all major blood vessels and capillaries were targeted in the brain with no positive glia detected (Figure 4a and insert). In the retina of the same mouse, all mural cells were also labeled with no endothelial cells labeled (Figure 4b). Muller cells were weakly positive for TdTomato. Surprisingly, very low numbers of brain pericytes were targeted by the tamoxifen eye-drop application (Figure 4C and insert), with no labeling of major blood vessels. The density of targeted pericytes was much lower than in mice treated with the tamoxifen injection and just slightly higher than in the animals treated with oil alone (Figure 4e and insert). Future studies will test whether lowering the concentration of tamoxifen in the eye drop solution will restrict gene expression to the retina. In the retina following the tamoxifen eye-drops, the majority of pericytes were labeled and the uninterrupted net of the capillaries could be seen (Figure 4d). TdTomato was found exclusively in mural cells, with the highest expression levels being in pericytes, and with a strong correlation to the high density of PDGFRβ (green). No Muller cells were labeled in this line. As expected, oil-treated animals revealed very few pericytes in both the brain (Figure 4e) and retina (Figure 4f).
FIGURE 4.
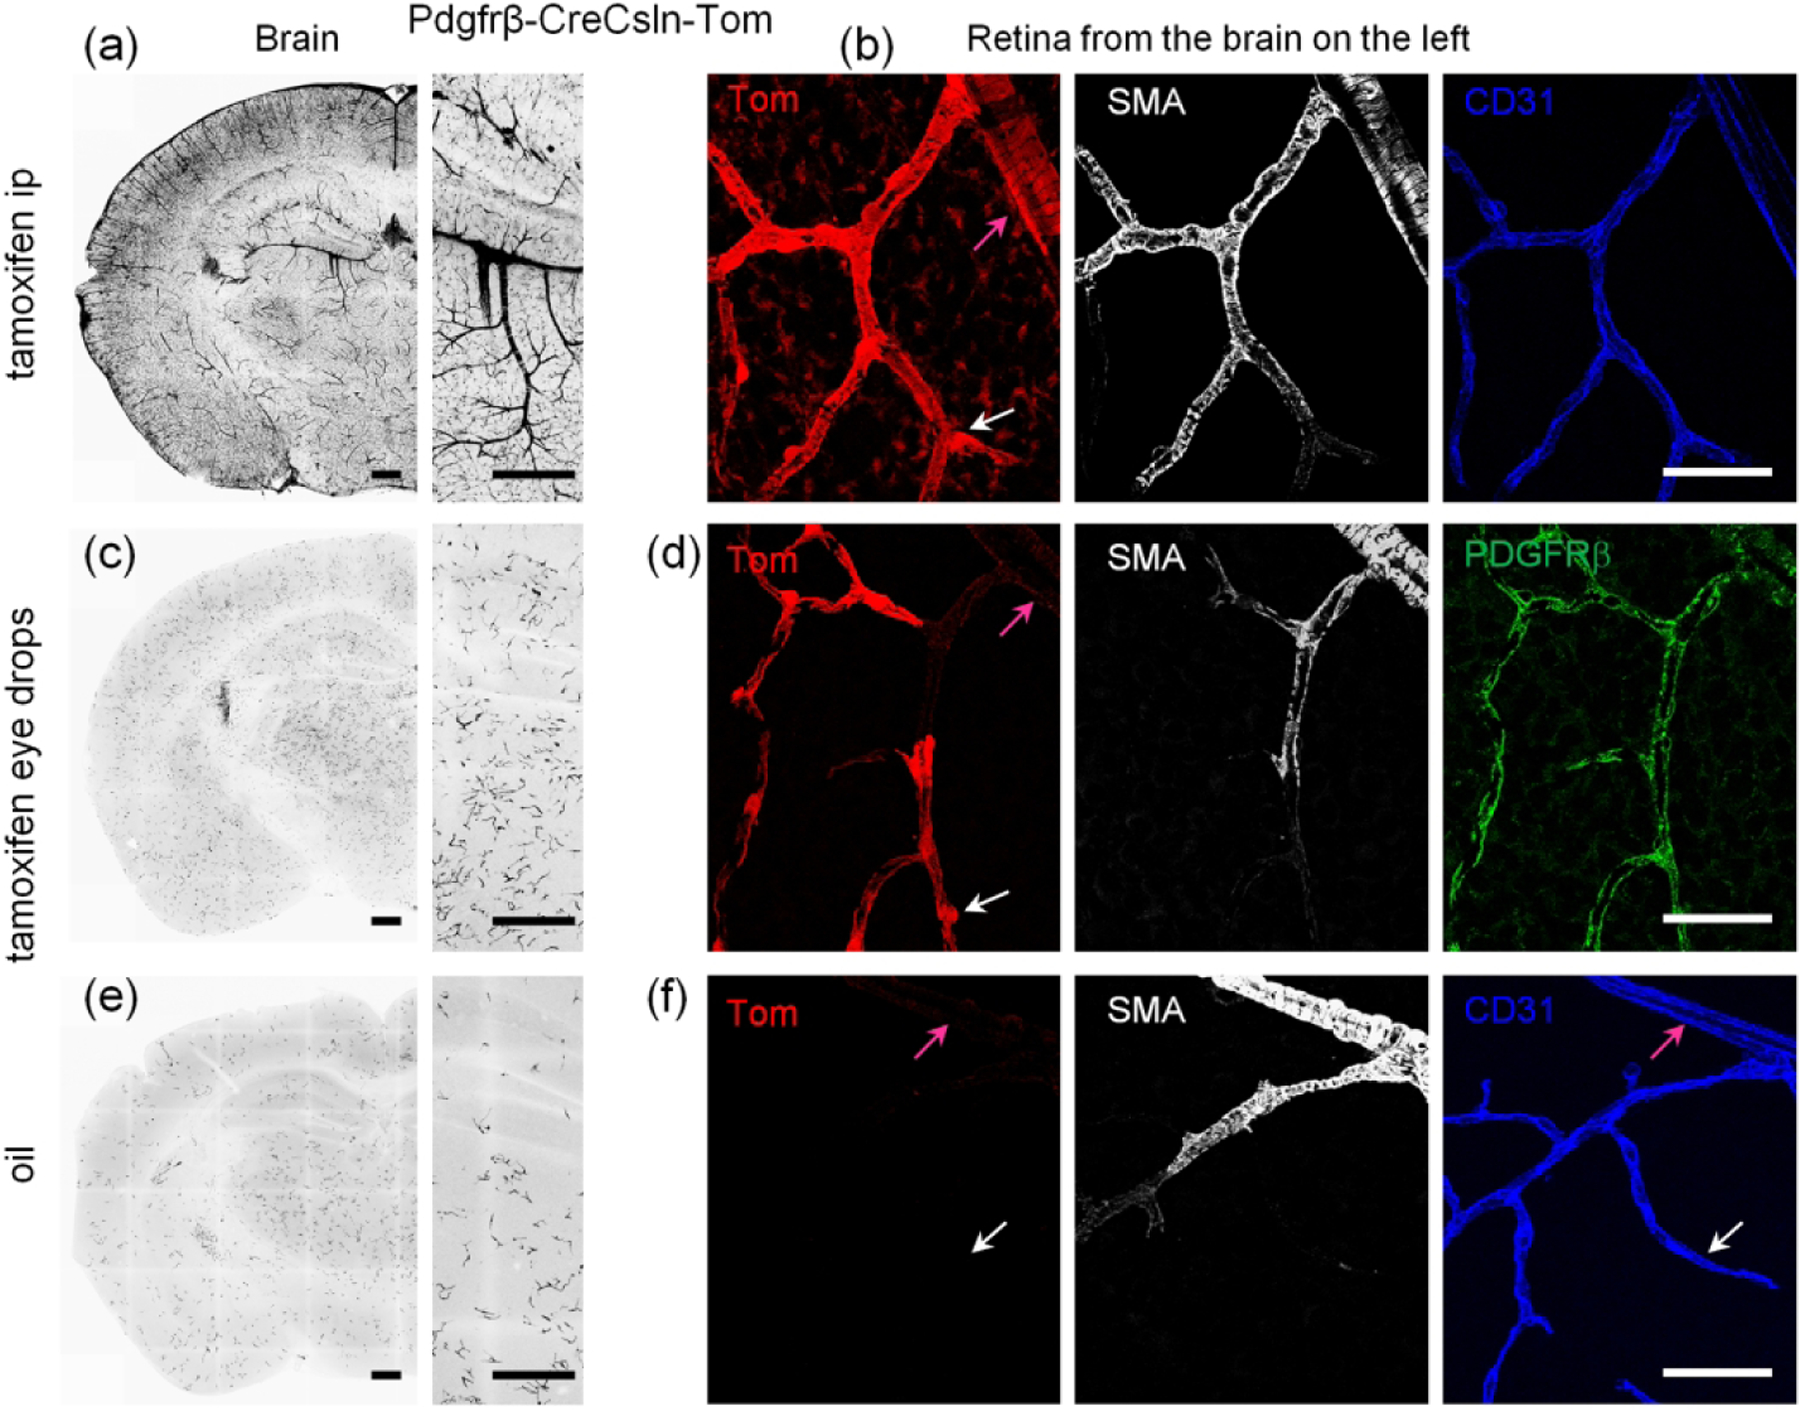
Controlling activation pattern of CreERT2 via tamoxifen administration in B6.Cg-Pdgfrβtm1.1 (cre/ERT2)Csln/J line. (a) In the brain of tamoxifen ip treated Pdgfrβ-CreCsln-Tom all mural cells expressed TdTomato; no glial labeling was visible. (b) In the retina of the mouse from (a), TdTomato-labeling was in SMA cells (magenta arrow) and pericytes (white arrow), as well as many Muller cells. No endothelial cells (blue) were labeled. (c) In the brain of Pdgfrβ-CreCsln-Tom treated with tamoxifen eye drops, TdTomato was found predominantly in the individual separate pericytes in the capillaries but not in large arteries and veins. (d) In the retina of the mouse from (b), TdTomato-labeling was colocalized with Pdgfrb immunolabeling (green) suggesting selective Cre activity in the majority of pericytes (white arrow) but not in SMA cells (magenta arrow). (e) In the brain of oil ip treated Pdgfrβ-CreCsln-Tom, sparse TdTomato labeling was detected in pericytes. (f) In the retina of the mouse from (e), there was no TdTomato-positive cells neither among SMA cells (magenta arrow) nor pericytes (white arrow). Endothelial cell immunolabeling for CD31 was used to visualize capillaries (blue). Scale bars: 400 μm in a, c, and e; 25 μm in b, d, and f.
Thus, the tamoxifen eye-drop application was a reproducible method of Cre activation for the majority of retinal pericytes, yet much less for brain pericytes. Therefore, the organ specific tamoxifen application could be used for retina-specific pericyte targeting.
3.5 |. Leveraging selective vascular cell targeting using optogenetic stimulation for manipulation of retinal blood flow
Next, we evaluated the ability of the Cre system to produce functional changes in mural cells. For this we chose the Pdgfrβ-CreCsln mouse line and crossed it with a Halorhodopsin reporter mouse (B6;129S-Gt(ROSA)26Sortm39(CAG-hop/EYFP)Hze/J). Halorhodopsin is a membrane bound chloride pump which induces hyperpolarisation in response to green/yellow light (peak wavelength sensitivity at 570 nm). This action is expected to relax vascular tone and therefore increase blood flow. The offspring were heterozygous for both Cre and Halo, and were treated with tamoxifen eye drops (Figure 5a). Similar to the Pdgfrβ-CreCsln-Tom reporter line, Halorhodopsin was selectively expressed in the majority of pericytes in the Pdgfrβ-CreCsln-Halo line (Figure 5b). However, in contrast to TdTomato expressed in the cytoplasm, the Halo-YFP construct was localized at the membrane of pericytes, consistently with its function as a transmembrane ionic channel. No endothelial or glia cells expressed Halorhodopsin. Tamoxifen and oil treated mice were used for assessment of retinal blood flow under a two-photon microscope (Figure 5c). Mice were lightly anesthetized and iv injected with the fluorescent contrast probe Sulforhodamine 101. The 10x objective enabled precise visualization of each of the three vascular layers when changing the focal plane. Blood flow was measured in individual capillaries in each layer, in ROIs of 128 by 128 pixels (55 by 55 um), (highlighted in red, Figure 5) before and after activation of Halorhodopsin. Baseline, and response recording epochs lasted for 30 s, and were intercalated by a 20 s light-stimulation of green light (peak wavelength 565 nm, power 900 mW).
FIGURE 5.
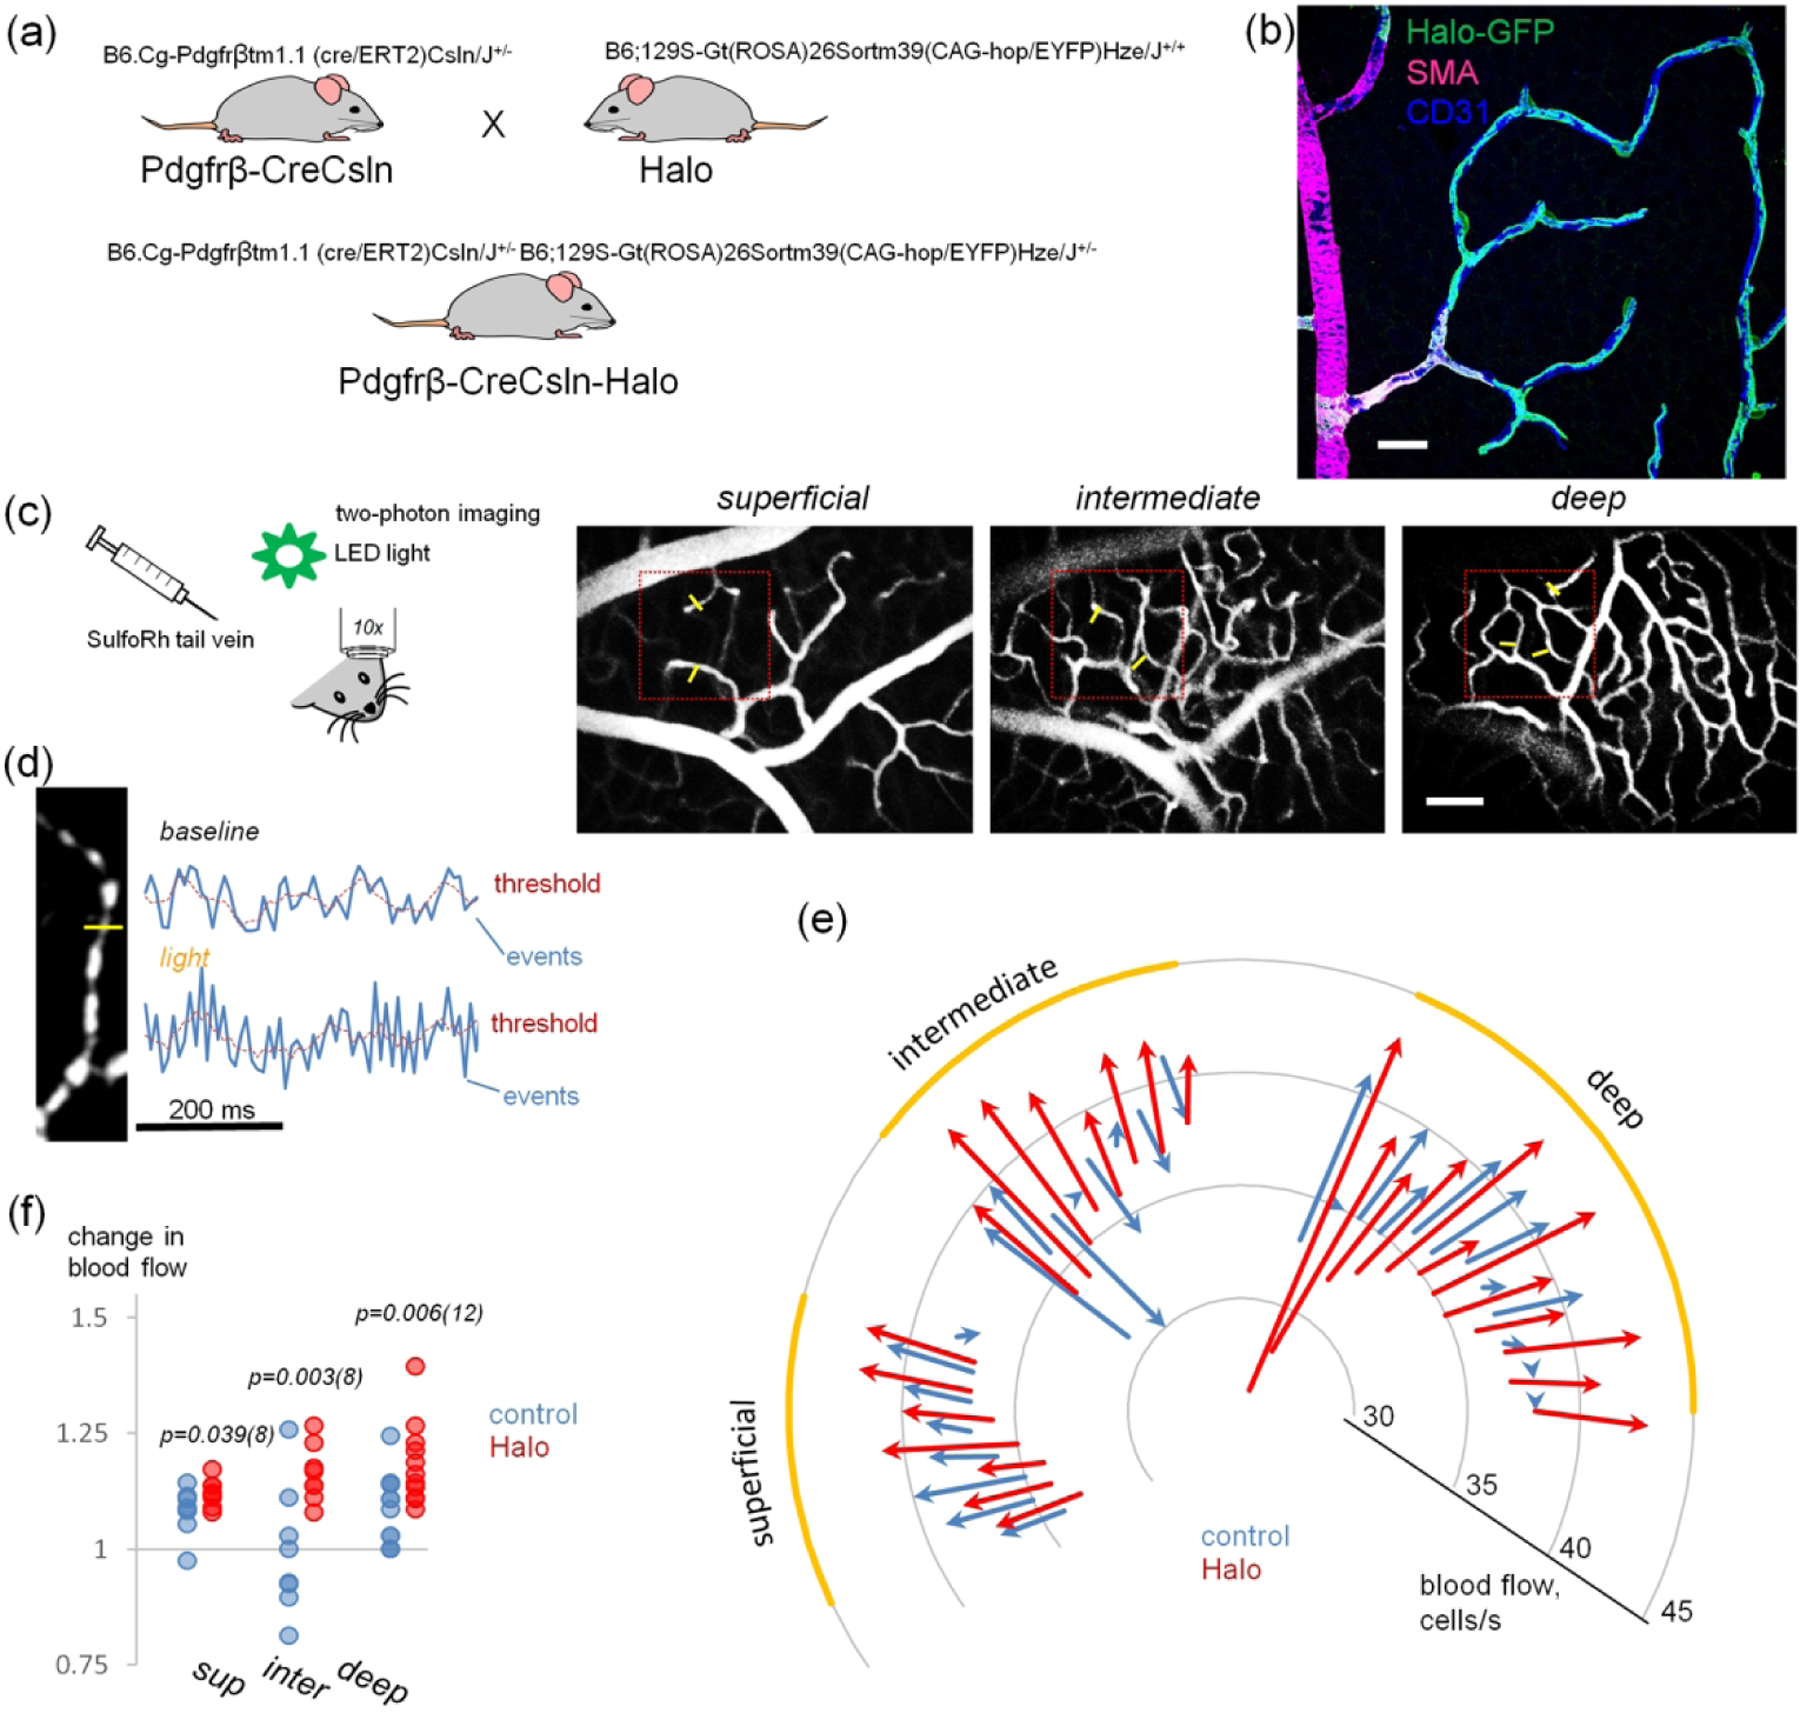
Targeted expression of Halorhodopsin in retinal pericytes for optogenetic boost of capillary blood flow. (a) Creation on Pdgfrb-CreCsln-Halo mouse. (b) Predominant expression of Halorhodopsin by contractile cells in microvascular regions. Retinal wholemount from B6.Cg-Pdgfrβtm1.1 (cre/ERT2)Csln/J+/− and B6;129S-Gt(ROSA)26Sortm39(CAG-hop/EYFP)Hze/J+/− mice expressing Halorhodopsin after Cre-induction via tamoxifen eye drops. Scale bar 25 μm. (c) In vivo imaging of retinal vasculature and blood flow after tail vein infusion of sulforhodamine101. Three vascular layers are clearly distinguishable. The actual area of blood flow with fast scan is outlined by the red square. Yellow bars indicate cross-sections through capillaries where blood flow was measured. Scale bar 25 μm. (d) Calculation of blood flow was made by analyzing time-lapse images of individual capillaries. Blood cells appear dark relatively to sulforhodamine101-labeled plasma. At the capillary cross-section marked by yellow line, the fluorescence intensity profile was created (blue line on the graph) and passing blood cell events were registered as peaks falling below the threshold. (e) Graphic representation of capillary blood flow before and after light stimulation at each capillary sample across three distinct vascular layers in halo and control animals. A vector indicates changes of blood flow in an individual capillary at the baseline (start) and after light stimulation (end). An arrow from the center indicates increase in blood flow, and an arrow towards the center indicates decrease in blood flow. Four eyes per group. (f) Optogenetic stimulation produced a robust increase in capillary blood flow. Ratios of capillary blood flow after light stimulation to the baseline in wt (blue) and Halorhodopsin-expressing retinas (red) were significantly different. Four eyes per group. Numbers of measured capillaries are below data points; TTEST significances are above.
For capillary blood flow assessment, a fluorescent profile was measured across individual capillaries (Figure 5d) and all peaks above the threshold line were counted as passing blood cells (Methods). At baseline, oil and tamoxifen-treated mice had similar blood flows in the superficial (control, 36 ± 1; tamoxifen, 36 ± 1; p = 0.22, TTEST, N=4), intermediate (control, 37 ± 3; tamoxifen, 36 ± 1; p = 0.14), and deep (control, 36 ± 1; tamoxifen, 34 ± 4; p = 0.03, TTEST, N=4) layers (Figure 5e). After Halorhodopsin activation, the blood flow increased significantly in intermediate (control, 37 ± 3; tamoxifen, 42 ± 1; TTEST< 0.001) and deep (control, 39 ± 2; tamoxifen, 41 ± 2; p = 0.02 TTEST; N=4) layers, but not in the superficial (control, 40 ± 2; tamoxifen, 36 ± 1; p = 0.2, TTEST, N=4). Interestingly, in the intermediate layer there was an increase of blood flow in the majority of the capillaries in tamoxifen-treated mice, but not in the oil-treated mice. Finally, we compared ratios of blood flow increase after stimulation relative to the baseline (Figure 5f). Again, the ratios were significantly different in the superficial (control, 1.08 ± 0.05; tamoxifen, 1.12 ± 0.03; p = 0.039, TTEST, N=4), intermediate (control, 0.99 ± 0.14; tamoxifen, 1.16 ± 0.06; TTEST = 0.004, N=4), and deep layers (control, 1.08 ± 0.08; tamoxifen, 1.22 ± 0.16; p = 0.006; TTEST, N=4) with higher blood flow increase in tamoxifen-treated mice. The expression of Halorhodopsin was confirmed in each animal after the in vivo experiment. Indeed, Halorhodopsin was associated with the EYFP reporter tag, which can be observed by fluorescence in the explanted retina. Using optogenetic tools and applying them specifically to modulate pericyte activity, we were able to transiently increase capillary blood flow in the retina of a living mouse.
4 |. DISCUSSION
The retina is one of the most metabolically demanding organs in the body and has been extensively used as a model to study CNS angiogenesis and blood flow. Here, using three commercially available mural cell specific CreERT2 lines, we found that targeting mural cells in the retina is distinct from other parts of the CNS. Specifically, tamoxifen application sets either ubiquitous targeting of all mural cells or pericytes alone. To demonstrate the utility of the pericyte-specific Cre-lines for vascular research, we evaluated the morphology of a newly discovered vascular sphincter cell and boosted capillary blood flow by optogenetically modulating pericyte physiology in vivo. Below, we provide a comparative analysis of pericyte targeting approaches and discuss how they can be used for basic and translational studies.
4.1 |. Which line to choose? Comparative analysis of mural-specific mouse lines in the retina
The three investigated CreERT2mouse lines for inducible targeting of mural cells exhibited different baseline, selectivity, and density of tamoxifen-activated mural cells (Table 2).
TABLE 2.
Mouse lines evaluated for targeting vascular mural cells in the retina
| Name of the line | Background activation | Tamoxifen ip | Tamoxifen eye |
|---|---|---|---|
| Pdgfrβ-CreRha | many pericytes | all mural cells and many Muller cells | all mural cells and many Muller cells |
| Pdgfrβ-CreCsln | very few pericytes | all mural cells and some Muller cells | predominantly pericytes and a few SMA cells |
| Cspg4-Cre | very few random type mural cells | sparse random type mural cells | sparse random type mural cells |
The main advantages of the CreERT2 system is that Cre-mediated recombination of floxed target sites can be induced at a specific time through tamoxifen administration (Feil et al., 1996; Feil, Wagner, Metzger, & Chambon, 1997). Cre leakiness is a known concern, and may be due to incomplete cre sequestering in the cytoplasm when a large amount of cre protein is produced (Alvarez-Aznar et al., 2020; Kristianto, Johnson, Zastrow, Radcliff, & Blank, 2017). Indeed, in the Pdgfrβ-CreRha-Tom line, numerous pericytes were labeled prior to tamoxifen treatment. The reporter lines are known to exhibit different recombination thresholds (Alvarez-Aznar et al., 2020; Liu et al., 2013). We used a highly sensitive Ai14 reporter (Madisen et al., 2010), highlighting that Cre in the Pdgfrβ-CreRha which was “leaky” in combination with Ai14 may have no background activity with a different reporter line (Chen et al., 2016; Gerl et al., 2015). Thus, for each CreERT2/loxP system the inclusion of oil-treated controls that carry both the CreERT2 and the reporter allele, is a necessity. Our data also show that the widely used Ai14 reporter line has some background TdTomato expression in Muller glial cells in the retina.
The other important characteristic is the specificity of Cre expression in individual mural cell types. All three lines, when induced by tamoxifen via ip injections, targeted all types of mural cells. In the Pdgfrβ-CreRha-Tom line, additional labeling was found in Muller cells. The selectivity of Cre activation, especially at low tamoxifen concentration, was strongly defined by the activity of its promoter. In the adult mice, the Cspg4 promoter is active in all mural cells (Schallek, Geng, Nguyen, & Williams, 2013; Zhu, Bergles, & Nishiyama, 2008), while the Pdgfrβ promoter is predominantly active in pericytes and transitional cells within the precapillary regions and less in arterial SMA-positive cells (Lindahl, Johansson, Leveen, & Betsholtz, 1997). In our study, PDGFRβ immunolabeling was strongly associated with pericytes and less with the SMA-positive cells. The degree and the pattern of Cre activation may also depend on the route or concentration of tamoxifen administration. Interestingly, we found that in the Pdgfrβ-CreCsln line, tamoxifen eye drops induced Cre in the vast majority of retinal pericytes and to a significantly lesser degree in the brain of the same animal (Figure 4). The high-specificity and simplicity of our approach opens the opportunity to selectively manipulate pericytes without affecting SMA cells. Furthermore, we demonstrate that focal eye drop tamoxifen application restricts Cre activation within the retina, minimizing undesired off-target effects.
4.2 |. Mural cell-specific CreERT2 lines for basic research
The CreERT2 system, in combination with floxed genes allows for visualization of cells, overexpression or suppression of their genes, cell ablation, inhibition, and excitation (Bouabe & Okkenhaug, 2013; McLellan, Rosenthal, & Pinto, 2017). By combining mural cell promoter lines with fluorescent reporter lines, we enabled the visualization of individual mural cells for detailed morphological characterization. First, using the Cspg4-Cre-Tom line, we anatomically characterized sphincter pericytes. In the brain, they control blood inflow from an artery into a capillary branch (Grubb et al., 2020; Ushiwata & Ushiki, 1990). We found that this is a single cell fully encircling the opening into the branching vessel; the cell had relatively low SMA expression and was heavily insulated by the basement membrane. Insulation of the sphincter suggests signal separation of the major artery from the capillary branch. This is supported by physiological studies that demonstrated a cutoff point for vasomotor signaling between the artery and capillary branch through electrical stimulation, calcium imaging and neurobiotin tracing (Kovacs-Oller, Ivanova, Bianchimano, et al., 2020; Zhang et al., 2011). Second, sparse labeling of individual pericytes enabled us to reveal their structural polarity. This structural asymmetry correlated with the direction of blood flow. Pericytes wrapped capillaries in the upstream direction of blood flow and had a long narrow tail on the downstream side. It is possible that this anatomical polarity serves functionally distinct regulatory mechanisms needed for proper control of vascular signaling and blood flow (Iadecola, Yang, Ebner, & Chen, 1997; Kovacs-Oller, Ivanova, Bianchimano, et al., 2020; Rungta, Chaigneau, Osmanski, & Charpak, 2018).
Studies in pericyte-deficient mice showed that pericytes control blood-brain/blood-retinal barriers (Armulik et al., 2010). To dissect the BBB-supporting role of pericytes in development and mature vessels, tamoxifen inducible lines could be crossed with Cre-inducible diphtheria toxin receptor lines (Buch et al., 2005). Instead of cell ablation, their genes could be manipulated to determine the molecular players involved in the BBB supporting function of pericytes. For example, Foxf2 inactivation in adult mice results in BBB breakdown, endothelial thickening, and increased trans-endothelial vesicular transport (Reyahi et al., 2015).
4.3 |. Targeted manipulation of pericytes to boost capillary blood flow
There are a number of diseases in the retina and brain that are affected or driven by pericyte pathology, starting with the disruption of physiological processes (microcirculation dysfunction) and progressing onto maladaptive anatomical remodeling (edemas, neovascularization). We sought to target pericytes to enhance capillary blood flow as recent studies identify them as key players in both the sensing and delivery of localized functional hyperemia in the retina (Kovacs-Oller, Ivanova, Bianchimano, et al., 2020).
A recent study explored the possibility to elicit light-driven capillary constriction and reduce blood flow in vivo by depolarizing brain pericytes with the cation optogenetic channel ChR2 (Nelson et al., 2020). As we sought to increase local blood flow by relaxing pericyte tone, an optogenetic hyperpolarizing system presented an ideal opportunity. The light-sensitive anion channel halorhodopsin (Gradinaru et al., 2010) enabled hyperpolarization of pericytes, resulting in a local dilation of capillaries, thus bypassing the highly orchestrated process of functional hyperemia (Kornfield & Newman, 2014). Indeed, targeting of multiple vascular elements simultaneously on the vascular tree leads to paradoxical effects which cancel each other out (Hill et al., 2015), warranting the need for highly precise cellular and spatio-temporal targeting with optogenetics. We would like to acknowledge that Halorhodopsin may present a number of limitations as an effective treatment strategy, requiring high photopic irradiance levels for activation, and operating on a millisecond timescale (Gradinaru et al., 2010). Possible alternatives include step-function opsins (bi-stable ChR2 mutants designed to stabilize the active chromophore isomer) which present longer inactivation time constants as well as single light-pulse switch-off mechanisms (Berndt, Yizhar, Gunaydin, Hegemann, & Deisseroth, 2009). Animal opsins (type II rhodopsins) require a much lower irradiance for activation, but activate G-protein pathways (Eleftheriou, Cesca, Maragliano, Benfenati, & Maya-Vetencourt, 2017), whose actions remain to be dissected in contractile pericytes. Similarly, designer receptors exclusively activated by designer drugs (DREADDs) can provide acute, yet sustained G-protein activation in response to synthetic agonist administration with highly selective cellular targeting (Coward et al., 1998).
In diabetic neuropathies, blood flow reduction in human patients (Srinivas et al., 2017) and animal models (Wang, Yadav, Leskova, & Harris, 2010; Wright, Messina, & Harris, 2009) was established long before pericyte drop-out, neovascularization and BBB breakdown. Targeted enhancement of blood flow with optogenetics or DREADDs could optimize oxygen delivery and avoid development of hypoxia-induced neovascularization and BRB impairments. In retinal degenerative (RD) diseases, blood vessel degeneration was commonly considered to be secondary to neuronal deficits. However, recent studies showed that narrowing of blood vessels and their consecutive degeneration was concurrent to neuronal deficits (Ivanova, Alam, et al., 2019; Ma et al., 2012). Moreover, the preservation of blood vessels was sufficient to rescue cone photoreceptors in some rodent models of RD (Otani et al., 2004). In humans, Retinitis pigmentosa is characterized by an initial reduction in blood flow beyond changes associated with the degradation of blood vessels (Grunwald, Maguire, & Dupont, 1996; Konieczka, Flammer, Todorova, Meyer, & Flammer, 2012; Ma et al., 2012; Nakagawa et al., 2014; Wolf et al., 1991). Persistent blood flow through capillaries was shown to be essential for the survival of capillaries during the pruning process (Korn & Augustin, 2015). Moreover, pericytes persisted, even on the dead blood vessels as long as they had a point access to a living blood vessel (Ivanova, Alam, et al., 2019). Their persistence makes them a good target for optogenetic or DREADD support to improve microcirculation in RD.
Acknowledgements:
This work was supported by NIH grants R01-EY026576, R01-EY029796 and NYSDOH-C34457GG (BTS).
Footnotes
Conflict of interest statement:
The authors declare no potential conflict of interest.
Data availability statement:
The data that support the findings of this study are available from the corresponding author upon reasonable request.
REFERENCES
- Alvarez-Aznar A, Martinez-Corral I, Daubel N, Betsholtz C, Makinen T, & Gaengel K (2020). Tamoxifen-independent recombination of reporter genes limits lineage tracing and mosaic analysis using creer(t2) lines. Transgenic Res, 29(1), 53–68. doi: 10.1007/s11248-019-00177-8 [DOI] [PMC free article] [PubMed] [Google Scholar]
- Armulik A, Genove G, & Betsholtz C (2011). Pericytes: Developmental, physiological, and pathological perspectives, problems, and promises. Dev Cell, 21(2), 193–215. doi: 10.1016/j.devcel.2011.07.001 [DOI] [PubMed] [Google Scholar]
- Armulik A, Genove G, Mae M, Nisancioglu MH, Wallgard E, Niaudet C, … Betsholtz C (2010). Pericytes regulate the blood-brain barrier. Nature, 468(7323), 557–561. doi: 10.1038/nature09522 [DOI] [PubMed] [Google Scholar]
- Attwell D, Mishra A, Hall CN, O’Farrell FM, & Dalkara T (2016). What is a pericyte? J Cereb Blood Flow Metab, 36(2), 451–455. doi: 10.1177/0271678X15610340 [DOI] [PMC free article] [PubMed] [Google Scholar]
- Bergers G, & Song S (2005). The role of pericytes in blood-vessel formation and maintenance. Neuro Oncol, 7(4), 452–464. doi: 10.1215/S1152851705000232 [DOI] [PMC free article] [PubMed] [Google Scholar]
- Berndt A, Yizhar O, Gunaydin LA, Hegemann P, & Deisseroth K (2009). Bi-stable neural state switches. Nat Neurosci, 12(2), 229–234. doi: 10.1038/nn.2247 [DOI] [PubMed] [Google Scholar]
- Bouabe H, & Okkenhaug K (2013). Gene targeting in mice: A review. Methods Mol Biol, 1064, 315–336. doi: 10.1007/978-1-62703-601-6_23 [DOI] [PMC free article] [PubMed] [Google Scholar]
- Buch T, Heppner FL, Tertilt C, Heinen TJ, Kremer M, Wunderlich FT, … Waisman A (2005). A cre-inducible diphtheria toxin receptor mediates cell lineage ablation after toxin administration. Nat Methods, 2(6), 419–426. doi: 10.1038/nmeth762 [DOI] [PubMed] [Google Scholar]
- Chen Q, Zhang H, Liu Y, Adams S, Eilken H, Stehling M, … Adams RH (2016). Endothelial cells are progenitors of cardiac pericytes and vascular smooth muscle cells. Nat Commun, 7, 12422. doi: 10.1038/ncomms12422 [DOI] [PMC free article] [PubMed] [Google Scholar]
- Coward P, Wada HG, Falk MS, Chan SD, Meng F, Akil H, & Conklin BR (1998). Controlling signaling with a specifically designed gi-coupled receptor. Proc Natl Acad Sci U S A, 95(1), 352–357. doi: 10.1073/pnas.95.1.352 [DOI] [PMC free article] [PubMed] [Google Scholar]
- Cuervo H, Pereira B, Nadeem T, Lin M, Lee F, Kitajewski J, & Lin CS (2017). Pdgfrbeta-p2a-creer(t2) mice: A genetic tool to target pericytes in angiogenesis. Angiogenesis, 20(4), 655–662. doi: 10.1007/s10456-017-9570-9 [DOI] [PMC free article] [PubMed] [Google Scholar]
- Dias DO, Kim H, Holl D, Werne Solnestam B, Lundeberg J, Carlen M, … Frisen J (2018). Reducing pericyte-derived scarring promotes recovery after spinal cord injury. Cell, 173(1), 153–165 e122. doi: 10.1016/j.cell.2018.02.004 [DOI] [PMC free article] [PubMed] [Google Scholar]
- Eilken HM, Dieguez-Hurtado R, Schmidt I, Nakayama M, Jeong HW, Arf H, … Adams RH (2017). Pericytes regulate vegf-induced endothelial sprouting through vegfr1. Nat Commun, 8(1), 1574. doi: 10.1038/s41467-017-01738-3 [DOI] [PMC free article] [PubMed] [Google Scholar]
- Eleftheriou C, Cesca F, Maragliano L, Benfenati F, & Maya-Vetencourt JF (2017). Optogenetic modulation of intracellular signalling and transcription: Focus on neuronal plasticity. J Exp Neurosci, 11, 1179069517703354. doi: 10.1177/1179069517703354 [DOI] [PMC free article] [PubMed] [Google Scholar]
- Fang JS, Coon BG, Gillis N, Chen Z, Qiu J, Chittenden TW, … Hirschi KK (2017). Shear-induced notch-cx37-p27 axis arrests endothelial cell cycle to enable arterial specification. Nat Commun, 8(1), 2149. doi: 10.1038/s41467-017-01742-7 [DOI] [PMC free article] [PubMed] [Google Scholar]
- Feil R, Brocard J, Mascrez B, LeMeur M, Metzger D, & Chambon P (1996). Ligand-activated site-specific recombination in mice. Proc Natl Acad Sci U S A, 93(20), 10887–10890. doi: 10.1073/pnas.93.20.10887 [DOI] [PMC free article] [PubMed] [Google Scholar]
- Feil R, Wagner J, Metzger D, & Chambon P (1997). Regulation of cre recombinase activity by mutated estrogen receptor ligand-binding domains. Biochem Biophys Res Commun, 237(3), 752–757. doi: 10.1006/bbrc.1997.7124 [DOI] [PubMed] [Google Scholar]
- Gerl K, Miquerol L, Todorov VT, Hugo CP, Adams RH, Kurtz A, & Kurt B (2015). Inducible glomerular erythropoietin production in the adult kidney. Kidney Int, 88(6), 1345–1355. doi: 10.1038/ki.2015.274 [DOI] [PubMed] [Google Scholar]
- Gradinaru V, Zhang F, Ramakrishnan C, Mattis J, Prakash R, Diester I, … Deisseroth K (2010). Molecular and cellular approaches for diversifying and extending optogenetics. Cell, 141(1), 154–165. doi: 10.1016/j.cell.2010.02.037 [DOI] [PMC free article] [PubMed] [Google Scholar]
- Grubb S, Cai C, Hald BO, Khennouf L, Murmu RP, Jensen AGK, … Lauritzen M (2020). Precapillary sphincters maintain perfusion in the cerebral cortex. Nat Commun, 11(1), 395. doi: 10.1038/s41467-020-14330-z [DOI] [PMC free article] [PubMed] [Google Scholar]
- Grunwald JE, Maguire AM, & Dupont J (1996). Retinal hemodynamics in retinitis pigmentosa. Am J Ophthalmol, 122(4), 502–508. doi: 10.1016/s0002-9394(14)72109-9 [DOI] [PubMed] [Google Scholar]
- Hammes HP, Lin J, Renner O, Shani M, Lundqvist A, Betsholtz C, … Deutsch U (2002). Pericytes and the pathogenesis of diabetic retinopathy. Diabetes, 51(10), 3107–3112. doi: 10.2337/diabetes.51.10.3107 [DOI] [PubMed] [Google Scholar]
- Hill RA, Tong L, Yuan P, Murikinati S, Gupta S, & Grutzendler J (2015). Regional blood flow in the normal and ischemic brain is controlled by arteriolar smooth muscle cell contractility and not by capillary pericytes. Neuron, 87(1), 95–110. doi: 10.1016/j.neuron.2015.06.001 [DOI] [PMC free article] [PubMed] [Google Scholar]
- Hoon M, Okawa H, Della Santina L, & Wong RO (2014). Functional architecture of the retina: Development and disease. Prog Retin Eye Res, 42, 44–84. doi: 10.1016/j.preteyeres.2014.06.003 [DOI] [PMC free article] [PubMed] [Google Scholar]
- Hughes S, & Chan-Ling T (2004). Characterization of smooth muscle cell and pericyte differentiation in the rat retina in vivo. Invest Ophthalmol Vis Sci, 45(8), 2795–2806. doi: 10.1167/iovs.03-1312 [DOI] [PubMed] [Google Scholar]
- Iadecola C, Yang G, Ebner TJ, & Chen G (1997). Local and propagated vascular responses evoked by focal synaptic activity in cerebellar cortex. J Neurophysiol, 78(2), 651–659. doi: 10.1152/jn.1997.78.2.651 [DOI] [PubMed] [Google Scholar]
- Ivanova E, Alam NM, Prusky GT, & Sagdullaev BT (2019). Blood-retina barrier failure and vision loss in neuron-specific degeneration. JCI Insight, 5. doi: 10.1172/jci.insight.126747 [DOI] [PMC free article] [PubMed] [Google Scholar]
- Ivanova E, Kovacs-Oller T, & Sagdullaev BT (2019). Domain-specific distribution of gap junctions defines cellular coupling to establish a vascular relay in the retina. J Comp Neurol, 527(16), 2675–2693. doi: 10.1002/cne.24699 [DOI] [PMC free article] [PubMed] [Google Scholar]
- Ivanova E, Toychiev AH, Yee CW, & Sagdullaev BT (2013). Optimized protocol for retinal wholemount preparation for imaging and immunohistochemistry. J Vis Exp(82), e51018. doi: 10.3791/51018 [DOI] [PMC free article] [PubMed] [Google Scholar]
- Konieczka K, Flammer AJ, Todorova M, Meyer P, & Flammer J (2012). Retinitis pigmentosa and ocular blood flow. EPMA J, 3(1), 17. doi: 10.1186/1878-5085-3-17 [DOI] [PMC free article] [PubMed] [Google Scholar]
- Korn C, & Augustin HG (2015). Mechanisms of vessel pruning and regression. Dev Cell, 34(1), 5–17. doi: 10.1016/j.devcel.2015.06.004 [DOI] [PubMed] [Google Scholar]
- Kornfield TE, & Newman EA (2014). Regulation of blood flow in the retinal trilaminar vascular network. J Neurosci, 34(34), 11504–11513. doi: 10.1523/JNEUROSCI.1971-14.2014 [DOI] [PMC free article] [PubMed] [Google Scholar]
- Kovacs-Oller T, Ivanova E, Bianchimano P, & .Sagdullaev BT (2020). The pericyte connectome: Spatial precision of neurovascular coupling is driven by selective connectivity maps of pericytes and endothelial cells and is disrupted in diabetes Cell Discovery, accepted for publication. [DOI] [PMC free article] [PubMed] [Google Scholar]
- Kovacs-Oller T, Ivanova E, Szarka G, Tengolics AJ, Volgyi B, & Sagdullaev BT (2020). Imatinib sets pericyte mosaic in the retina. Int J Mol Sci, 21(7). doi: 10.3390/ijms21072522 [DOI] [PMC free article] [PubMed] [Google Scholar]
- Kristianto J, Johnson MG, Zastrow RK, Radcliff AB, & Blank RD (2017). Spontaneous recombinase activity of cre-ert2 in vivo. Transgenic Res, 26(3), 411–417. doi: 10.1007/s11248-017-0018-1 [DOI] [PMC free article] [PubMed] [Google Scholar]
- Li Y, Lucas-Osma AM, Black S, Bandet MV, Stephens MJ, Vavrek R, … Bennett DJ (2017). Pericytes impair capillary blood flow and motor function after chronic spinal cord injury. Nat Med, 23(6), 733–741. doi: 10.1038/nm.4331 [DOI] [PMC free article] [PubMed] [Google Scholar]
- Lindahl P, Johansson BR, Leveen P, & Betsholtz C (1997). Pericyte loss and microaneurysm formation in pdgf-b-deficient mice. Science, 277(5323), 242–245. doi: 10.1126/science.277.5323.242 [DOI] [PubMed] [Google Scholar]
- Liu J, Willet SG, Bankaitis ED, Xu Y, Wright CV, & Gu G (2013). Non-parallel recombination limits cre-loxp-based reporters as precise indicators of conditional genetic manipulation. Genesis, 51(6), 436–442. doi: 10.1002/dvg.22384 [DOI] [PMC free article] [PubMed] [Google Scholar]
- Ma Y, Kawasaki R, Dobson LP, Ruddle JB, Kearns LS, Wong TY, & Mackey DA (2012). Quantitative analysis of retinal vessel attenuation in eyes with retinitis pigmentosa. Invest Ophthalmol Vis Sci, 53(7), 4306–4314. doi: 10.1167/iovs.11-8596 [DOI] [PubMed] [Google Scholar]
- Madisen L, Mao T, Koch H, Zhuo JM, Berenyi A, Fujisawa S, … Zeng H (2012). A toolbox of cre-dependent optogenetic transgenic mice for light-induced activation and silencing. Nat Neurosci, 15(5), 793–802. doi: 10.1038/nn.3078 [DOI] [PMC free article] [PubMed] [Google Scholar]
- Madisen L, Zwingman TA, Sunkin SM, Oh SW, Zariwala HA, Gu H, … Zeng H (2010). A robust and high-throughput cre reporting and characterization system for the whole mouse brain. Nat Neurosci, 13(1), 133–140. doi: 10.1038/nn.2467 [DOI] [PMC free article] [PubMed] [Google Scholar]
- McLellan MA, Rosenthal NA, & Pinto AR (2017). Cre-loxp-mediated recombination: General principles and experimental considerations. Curr Protoc Mouse Biol, 7(1), 1–12. doi: 10.1002/cpmo.22 [DOI] [PubMed] [Google Scholar]
- Muzumdar MD, Tasic B, Miyamichi K, Li L, & Luo L (2007). A global double-fluorescent cre reporter mouse. Genesis, 45(9), 593–605. doi: 10.1002/dvg.20335 [DOI] [PubMed] [Google Scholar]
- Nakagawa S, Oishi A, Ogino K, Makiyama Y, Kurimoto M, & Yoshimura N (2014). Association of retinal vessel attenuation with visual function in eyes with retinitis pigmentosa. Clin Ophthalmol, 8, 1487–1493. doi: 10.2147/OPTH.S66326 [DOI] [PMC free article] [PubMed] [Google Scholar]
- Nakaizumi A, Zhang T, & Puro DG (2012). The electrotonic architecture of the retinal microvasculature: Diabetes-induced alteration. Neurochem Int, 61(6), 948–953. doi: 10.1016/j.neuint.2012.02.002 [DOI] [PMC free article] [PubMed] [Google Scholar]
- Nelson AR, Sagare MA, Wang Y, Kisler K, Zhao Z, & Zlokovic BV (2020). Channelrhodopsin excitation contracts brain pericytes and reduces blood flow in the aging mouse brain in vivo. Front Aging Neurosci, 12, 108. doi: 10.3389/fnagi.2020.00108 [DOI] [PMC free article] [PubMed] [Google Scholar]
- Otani A, Dorrell MI, Kinder K, Moreno SK, Nusinowitz S, Banin E, … Friedlander M (2004). Rescue of retinal degeneration by intravitreally injected adult bone marrow-derived lineage-negative hematopoietic stem cells. J Clin Invest, 114(6), 765–774. doi: 10.1172/JCI21686 [DOI] [PMC free article] [PubMed] [Google Scholar]
- Potente M, Gerhardt H, & Carmeliet P (2011). Basic and therapeutic aspects of angiogenesis. Cell, 146(6), 873–887. doi: 10.1016/j.cell.2011.08.039 [DOI] [PubMed] [Google Scholar]
- Reyahi A, Nik AM, Ghiami M, Gritli-Linde A, Ponten F, Johansson BR, & Carlsson P (2015). Foxf2 is required for brain pericyte differentiation and development and maintenance of the blood-brain barrier. Dev Cell, 34(1), 19–32. doi: 10.1016/j.devcel.2015.05.008 [DOI] [PubMed] [Google Scholar]
- Rungta RL, Chaigneau E, Osmanski BF, & Charpak S (2018). Vascular compartmentalization of functional hyperemia from the synapse to the pia. Neuron, 99(2), 362–375 e364. doi: 10.1016/j.neuron.2018.06.012 [DOI] [PMC free article] [PubMed] [Google Scholar]
- Schallek J, Geng Y, Nguyen H, & Williams DR (2013). Morphology and topography of retinal pericytes in the living mouse retina using in vivo adaptive optics imaging and ex vivo characterization. Invest Ophthalmol Vis Sci, 54(13), 8237–8250. doi: 10.1167/iovs.13-12581 [DOI] [PMC free article] [PubMed] [Google Scholar]
- Schlecht A, Leimbeck SV, Tamm ER, & Braunger BM (2016). Tamoxifen-containing eye drops successfully trigger cre-mediated recombination in the entire eye. Adv Exp Med Biol, 854, 495–500. doi: 10.1007/978-3-319-17121-0_66 [DOI] [PubMed] [Google Scholar]
- Shen F, Chen B, Danias J, Lee KC, Lee H, Su Y, … Mittag TW (2004). Glutamate-induced glutamine synthetase expression in retinal muller cells after short-term ocular hypertension in the rat. Invest Ophthalmol Vis Sci, 45(9), 3107–3112. doi: 10.1167/iovs.03-0948 [DOI] [PubMed] [Google Scholar]
- Srinivas S, Tan O, Nittala MG, Wu JL, Fawzi AA, Huang D, & Sadda SR (2017). Assessment of retinal blood flow in diabetic retinopathy using doppler fourier-domain optical coherence tomography. Retina, 37(11), 2001–2007. doi: 10.1097/IAE.0000000000001479 [DOI] [PMC free article] [PubMed] [Google Scholar]
- Stahl A, Connor KM, Sapieha P, Chen J, Dennison RJ, Krah NM, … Smith LE (2010). The mouse retina as an angiogenesis model. Invest Ophthalmol Vis Sci, 51(6), 2813–2826. doi: 10.1167/iovs.10-5176 [DOI] [PMC free article] [PubMed] [Google Scholar]
- Ushiwata I, & Ushiki T (1990). Cytoarchitecture of the smooth muscles and pericytes of rat cerebral blood vessels. A scanning electron microscopic study. J Neurosurg, 73(1), 82–90. doi: 10.3171/jns.1990.73.1.0082 [DOI] [PubMed] [Google Scholar]
- Wang Z, Yadav AS, Leskova W, & Harris NR (2010). Attenuation of streptozotocin-induced microvascular changes in the mouse retina with the endothelin receptor a antagonist atrasentan. Exp Eye Res, 91(5), 670–675. doi: 10.1016/j.exer.2010.08.008 [DOI] [PMC free article] [PubMed] [Google Scholar]
- Wilhelm K, Happel K, Eelen G, Schoors S, Oellerich MF, Lim R, … Potente M (2016). Foxo1 couples metabolic activity and growth state in the vascular endothelium. Nature, 529(7585), 216–220. doi: 10.1038/nature16498 [DOI] [PMC free article] [PubMed] [Google Scholar]
- Wolf S, Postgens H, Bertram B, Schulte K, Teping C, & Reim M (1991). [hemodynamic findings in patients with retinitis pigmentosa]. Klin Monbl Augenheilkd, 199(5), 325–329. doi: 10.1055/s-2008-1046089 [DOI] [PubMed] [Google Scholar]
- Wong-Riley MT (2010). Energy metabolism of the visual system. Eye Brain, 2, 99–116. doi: 10.2147/EB.S9078 [DOI] [PMC free article] [PubMed] [Google Scholar]
- Wright WS, Messina JE, & Harris NR (2009). Attenuation of diabetes-induced retinal vasoconstriction by a thromboxane receptor antagonist. Exp Eye Res, 88(1), 106–112. doi: 10.1016/j.exer.2008.10.008 [DOI] [PMC free article] [PubMed] [Google Scholar]
- Zhang T, Wu DM, Xu GZ, & Puro DG (2011). The electrotonic architecture of the retinal microvasculature: Modulation by angiotensin ii. J Physiol, 589(Pt 9), 2383–2399. doi: 10.1113/jphysiol.2010.202937 [DOI] [PMC free article] [PubMed] [Google Scholar]
- Zhu X, Bergles DE, & Nishiyama A (2008). Ng2 cells generate both oligodendrocytes and gray matter astrocytes. Development, 135(1), 145–157. doi: 10.1242/dev.004895 [DOI] [PubMed] [Google Scholar]
- Zhu X, Hill RA, Dietrich D, Komitova M, Suzuki R, & Nishiyama A (2011). Age-dependent fate and lineage restriction of single ng2 cells. Development, 138(4), 745–753. doi: 10.1242/dev.047951 [DOI] [PMC free article] [PubMed] [Google Scholar]