

Abstract
The mesolimbic dopamine system is involved in the regulation of multiple behaviors, including feeding, and evidence demonstrates that the melanocortin system can act on the mesolimbic dopamine system to control feeding and other behaviors. The melanocortin-3 receptor (MC3R) is an important component of the melanocortin system, but its overall role is poorly understood. Because MC3Rs are highly expressed in the ventral tegmental area (VTA) and are likely to be the key interaction point between the melanocortin and mesolimbic dopamine systems, we set out to identify both the efferent projection patterns of VTA MC3R neurons and the location of the neurons providing afferent input to them. VTA MC3R neurons were broadly connected to neurons across the brain but were strongly connected to a discrete set of brain regions involved in the regulation of feeding, reward, and aversion. Surprisingly, experiments using monosynaptic rabies virus showed that proopiomelanocortin (POMC) and agouti-related protein (AgRP) neurons in the arcuate nucleus made few direct synapses onto VTA MC3R neurons or any of the other major neuronal subtypes in the VTA, despite being extensively labeled by general retrograde tracers injected into the VTA. These results greatly contribute to our understanding of the anatomical interactions between the melanocortin and mesolimbic systems and provide a foundation for future studies of VTA MC3R neurons and the circuits containing them in the control of feeding and other behaviors.
Keywords: MC3R, VTA, Melanocortin, POMC, AgRP, Dopamine, Arcuate Nucleus, Monosynaptic rabies, RRID Addgene_71760
Graphical abstract text:
-VTA MC3R neurons are a likely site of interaction between homeostatic and hedonic feeding circuits.
-VTA MC3R neurons send efferent projections to, and receive afferent input from, multiple brain regions involved in feeding, reward, and aversion.
-Very few POMC and AgRP neurons were labeled by monosynaptic rabies from multiple VTA neuron subtypes.
1. Introduction
The mesolimbic dopamine (DA) system, comprised of the DA neurons of the ventral tegmental area (VTA) and their afferent and efferent projections, is involved in the regulation of a wide range of behaviors, including natural and drug rewards, reinforcement, motivation, and aversion (Bromberg-Martin, Matsumoto, & Hikosaka, 2010; Stephan Lammel, Lim, & Malenka, 2014; Wise, 2006). Moreover, the mesolimbic DA system is an important component of the neural circuitry controlling feeding and food reward (Kenny, 2011; Palmiter, 2007; Volkow, Wang, & Baler, 2011). For example, food consumption, orosensory stimulation, and presentation of food or food-predictive cues all increase neuronal activity in the VTA (Hyland, Reynolds, Hay, Perk, & Miller, 2002; Schultz, 1998) and stimulate DA release in one of the major VTA targets, the nucleus accumbens (NAcc)(Hajnal, Smith, & Norgren, 2004; Hernandez & Hoebel, 1988; Liang, Hajnal, & Norgren, 2006; Roitman, Stuber, Phillips, Wightman, & Carelli, 2004). Alterations in DA signaling, induced either pharmacologically (Inoue et al., 1997; Wise, Spindler, & Legault, 1978) or via genetic means (Szczypka et al., 1999), significantly affect feeding and responding for food reward, independent of the effects on activity. The mechanisms by which the mesolimbic DA system regulates feeding are poorly understood, however.
The hypothalamic melanocortin system is a well-characterized component of the neural circuitry controlling feeding. This system is comprised of the POMC and AgRP neurons of the arcuate hypothalamus (Arc), their neuropeptides, alpha-melanocyte stimulating hormone (α-MSH) and AgRP, and the central MC3Rs and MC4Rs, and the role of the melanocortin system in the neural control of feeding has been studied extensively (Butler, 2006; Cone, 2005, 2006; Webber, Bonci, & Krashes, 2015). Although most of these studies have focused on the actions of the melanocortin system within the hypothalamus, it also interacts with the mesolimbic dopamine system to regulate feeding and body weight. For example, both POMC and AgRP neurons project to the VTA (Dietrich et al., 2012; King & Hentges, 2011), and the VTA is one of the brain regions with the highest expression of MC3Rs (Roselli-Rehfuss et al., 1993) where MC3Rs are expressed in both dopamine and non-dopamine neurons (Lippert, Ellacott, & Cone, 2014). Intra-VTA injection of α-MSH analogs also increases DA release in efferent target regions (Jansone et al., 2004; Lindblom et al., 2001; Sanchez, Barontini, Armando, & Celis, 2001; Torre & Celis, 1988) and increases DA dependent behaviors such as grooming, rearing, and locomotion (Klusa, Svirskis, Opmane, Muceniece, & Wikberg, 1999; Torre & Celis, 1986, 1988). Furthermore, intra-VTA administration of melanocortin receptor agonists and antagonists alters feeding, body weight, and food self-administration (Roseberry, 2013; Shanmugarajah, Dunigan, Frantz, & Roseberry, 2017; Yen & Roseberry, 2014). These findings suggest that the melanocortin system interacts with the mesolimbic dopamine system to regulate feeding and other behaviors and that VTA MC3Rs may play a central role in this interaction. The circuits underlying the behavioral responses to α-MSH and AgRP acting in the VTA are not known, however, and overall, we have a poor understanding of the exact role that MC3Rs play in the control of feeding. Thus, in these studies, we sought to advance our understanding of the anatomy of this system by using viral tracing approaches to identify the efferent and afferent connectivity of neurons in the VTA that express MC3Rs (VTA MC3R neurons).
2. Materials and Methods
Reagents and viral vectors:
AAV2/5-EF1a-DIO-hChR2 (H134R)-eYFP was obtained from the UNC Vector Core (Chapel Hill, NC). The pAAV-hSyn-FLEx-mGFP-2A-Synaptophysin mRuby plasmid was a gift from Liqun Luo and was obtained from Addgene (Addgene plasmid #71760; http://n2t.net/addgene:71760; RRID: Addgene_71760). The pHelper and pAAV-RC plasmids used for AAV preparation were generous gifts of Ralph DiLeone. Envelope-A pseudotyped, G-deleted rabies virus expressing mCherry (RvdG-mCherry) (Osakada et al., 2011), AAV2/1-CMV-eSyn-DIO-TVA950-eYFP (1.13E+12 GC/ml) and AAV2/1- EF1α -DIO-H2B-tagBFP-Flagx3-T2Am-cB19G (1.01E+11 GC/ml) (Faget et al., 2016) were from the Salk Institute Gene Transfer Targeting and Therapeutics Core (La Jolla, CA). Sterile bacteriostatic saline, ketamine, xylazine, and meloxicam were from Patterson Veterinary Supply, Inc. (Sterling, MA). The fluorescent RetroBeads were from Lumafluor, Inc. Neurotrace fluorescent Nissl stain was from Thermo-Fisher (Waltham, MA).
AAV-FLEx-mGFP-SYN-mRuby preparation:
AAV(2/2)-FLEx-mGFP-SYN-mRuby was prepared using a triple transfection, helper free method and was purified as previously described (Hommel et al., 2006). Briefly, HEK293 cells were transfected with equal amounts of pAAV-hSyn-FLEx-mGFP-2A-Synaptophysin-mRuby, pHelper, and pAAV-RC using a standard calcium phosphate transfection protocol. ~80 hours post-transfection, the cells were collected, resuspended in freezing buffer (150 mM NaCl, 50 mM Tris, pH 8.0), frozen and stored at −80°C until preparation. Cells underwent two freeze-thaw cycles followed by a 30-minute incubation in benzonase (50 U/ml final) at 37°C. The lysate was then layered on an iodixanol gradient and spun at 184,000xg (50,000 rpm in a Beckman Type 70Ti rotor) for 3 hours 20 minutes at 10°C. The 40% fraction was collected and replaced with sterile 1X phosphate-buffered saline (PBS) using Amicon Ultra-15 Centrifugal Filter Unit Concentrators (100 kDalton; Millipore, Inc.). Viral titer was calculated using the AAV pro Titration Kit (Clontech, Inc.) per the manufacturer’s instructions. The final purified viral particles were aliquoted and stored at −80°C, except during use, when they were stored at 4°C.
Animals:
Male and female transgenic mice expressing Cre recombinase in MC3R neurons (MC3R-Cre mice) on a mixed C57/129 background were used for tracing VTA MC3R neuron projections and inputs, and for the synaptophysin-based synaptic connectivity confirmation. MC3R-Cre mice were generously provided by David Olson (University of Michigan, Ann Arbor), and have been previously characterized and validated (Pei et al., 2019; West, Lu, Olson, & Roseberry, 2019). C57/129 mice (stock no. 000664; The Jackson Laboratory) or MC3R-Cre negative littermates were used as controls. Neuropeptide Y-GFP (NPY-GFP; stock no. 006417) (van den Pol et al., 2009), tyrosine hydroxylase-Cre (TH-Cre, stock no. 008601) (Savitt, Jang, Mu, Dawson, & Dawson, 2005), vesicular glutamate transporter-2-IRES-Cre (vGlut2-Cre; stock no. 016963) (Vong et al., 2011), and glutamic acid decarboxylase-2-IRES-Cre (GAD-Cre; stock no. 010802) (Taniguchi et al., 2011) mice, all on a C57Bl6/J or mixed C57/129 background, were obtained from The Jackson Laboratory (Bar Harbor, ME). Mice were single housed in ventilated polycarbonate Animal Care System cages in a temperature- and humidity-controlled room under a 12/12 light/dark cycle (lights on at 6:00 or 7:00 am) with ad libitum food and water. All protocols and procedures were approved by the Institutional Animal Care and Use Committee at Georgia State University and conformed to the NIH Guide for the Care and Use of Laboratory Animals.
Stereotaxic surgery.
Viral vectors or Red RetroBeads were injected into the VTA using standard flat-skull stereotaxic techniques. 7–10 week old mice were anesthetized with isoflurane (1.5–5%) and placed in a stereotaxic apparatus (David Kopf Instruments). The VTA was targeted using the following coordinates (relative to bregma): A/P −3.3, M/L +/−1.32, DV −4.55 and −4.45 from the skull surface, at a 12° angle to the midline. Injections were done bilaterally or unilaterally in equal volumes at two depths (viral vectors) or a single depth (DV-4.50, Retrobeads) at a speed of 50–100 nl/min using a Nanoliter 2010 microinjector (World Precision Instruments, Sarasota, FL) and glass pipettes with ~30–60 μm diameter tips. For unilateral injections, the injection sides were counterbalanced between animals to avoid potential side bias. The pipettes were left in the brain for 3 minutes following the first injection and 5 minutes following the final injection to allow for diffusion from the injection site. For pain management, the mice received meloxicam (1 mg/kg) at the onset of the surgery and again 24 hours post-surgery. AAV-DIO-ChR2-eYFP was injected unilaterally in a total volume of 300 nL (150 nL per injection site), and mice were sacrificed 4 weeks later. For the synaptophysin-mRuby experiments, mice received unilateral injections of 300 nL AAV-FLEx-mGFP-SYN-mRuby (150 nL/site) or 400nL of a 1:3 mix of AAV-DIO-ChR2-eYFP and AAV-FLEx-mGFP-SYN-mRuby (200 nL/site), and the mice were sacrificed 10 weeks later. For the RetroBead experiments, 100 nL of Red RetroBeads diluted 1:5 in sterile saline was injected bilaterally and the mice were sacrificed 4 weeks later. For the RVdG-mCherry experiments, 300 nL (150 nL/site/side) of 1.5:1 volume mixture of AAV-RbG-hBFP and AAV-TVA-eYFP (diluted 1:100 from the original AAV received) was injected bilaterally. Three weeks later, 126 nL of RVdG-mCherry (63 nL/site) was injected into the same coordinates and the mice were sacrificed 7 days later.
Tissue processing and histology.
Mice were deeply anesthetized with ketamine/xylazine (93/7 mg/kg) and transcardially perfused with ice-cold PBS followed by 4% paraformaldehyde. The brains were dissected, post-fixed with 4% paraformaldehyde at 4°C overnight, washed with 1X PBS and incubated in 30% sucrose (in 1X PBS) for 2–3 days until the brains sunk. The brains were then flash frozen in ethanol/dry ice cooled isopentane and stored at −80°C until sectioning. The brains were sectioned, mounted on glass slides and coverslipped using ProLong Diamond Antifade Mountant with or without DAPI (ThermoFisher Scientific) or lab-prepared gelvatol containing 10% DABCO. All slides were allowed to cure for at least 24 hours before imaging. For the efferent and afferent traces, 40 μm thick coronal sections were collected on a cryostat at 200 μm intervals (every 5th section) between +2.10 mm and −6.24 mm relative to bregma. For the synaptophysin experiment, 20 μm thick coronal sections containing the brain regions of interest were collected on the cryostat at 200 μm intervals (every 10th section). For the RetroBead experiment, 40 μm thick coronal sections were collected through the VTA and arcuate nucleus (Arc) at 200 μm intervals (every 5th section). For the RVdG experiment to determine the connectivity between Arc POMC and AgRP neurons and VTA neuron subtypes, 40 μm thick coronal sections were collected through the VTA at 200 μm intervals (every 5th section), and through the Arc at 80 μm intervals (every other section). The sections used for the quantification of the whole-brain VTA MC3R inputs and outputs were counterstained with Green Fluorescent Nissl stain (NeuroTrace 500/525, Invitrogen/ThermoFisher Scientific) at 1:100 dilution using manufacturer’s instructions.
POMC neurons were labeled using standard immunohistochemical (IHC) techniques. Brain sections were incubated for 6 hours at room temperature in blocking buffer (5% normal goat serum, 0.2% Triton X-100, 0.1% bovine serum albumin in 1X PBS), washed in 1X PBS for 5 minutes, and were incubated with rabbit polyclonal anti-POMC antibodies (Cat. # H-029–30, Phoenix Pharmaceuticals) diluted 1:1500 in antibody incubation buffer (0.2% Triton X-100, 1% bovine serum albumin in 1X PBS) overnight at 4°C. Sections were washed with 1X PBS 3 times for 5 minutes and were incubated with Alexa Fluor 647 conjugated goat anti-rabbit antibodies (Cat. # 111–605-045, Jackson Immuno Research) diluted 1:300 in antibody incubation buffer for 4 hours at room temperature. Sections were then washed with 1X PBS 3 times for 5 minutes, mounted on glass slides and coverslipped as described above.
Image acquisition.
Images used for the analysis of VTA MC3R axon labeling, synaptophysin puncta quantification, and whole-brain VTA MC3R afferent input cell counts were acquired at 10x, 20x, or 60x magnification on an Olympus BX41 fluorescent microscope equipped with an Olympus DP73 camera. The 10x and 20x magnification images used for scoring VTA MC3R axon labeling or RVdG-mCherry-labeled cell counts were acquired in a grid pattern and were stitched together post-acquisition using the ImageJ2 Stitching plugin (Preibisch, Saalfeld, & Tomancak, 2009). 20x and 60x magnification images used for quantitative, software-based VTA MC3R area coverage and density quantification, synaptophysin puncta quantification, or counting of densely populated RVdG-mCherry-labeled cells were manually acquired at different focal planes (~3–6 focal planes) and were stacked together post-acquisition into a single image using the Fiji Stack Focuser plugin in ImageJ (Hein, De Oliveira, De Campos, & Caltabiano, 2012). For the experiments examining the connectivity between the VTA and the Arc the images were acquired using Laser Scanning Confocal Microscope (Carl Zeiss LSM 780) at 20x magnification with 0.7 magnification factor. Macrostructure features and nuclei of the brain sections were delineated with the use of Neurotrace according to the Paxinos Mouse Brain Atlas (Paxinos & Franklin, 2001), and brain areas were grouped into regions and sub-regions based on the Allen Brain Atlas classification (http://mouse.brain-map.org/).
Qualitative analysis of VTA MC3R axon projections.
For qualitative analysis of whole-brain efferent targets of VTA MC3R neurons, 10x magnification images of coronal brain sections were used. Individual brain regions were initially delineated using Neurotrace fluorescent Nissl stain. The delineated brain regions between +1.78 mm and −6.24 mm relative to bregma were then assigned an axon labeling score of 1 to 4 using the following scoring rubric: 1 (very low)-very few fibers covering the area, 2 (low)-dispersed fibers covering the area, 3 (moderate) - part of the area is densely covered by fibers, and 4 (strong) - most of the area is densely covered by fibers. In most cases, brain areas containing eYFP+ axons were spread over multiple brain sections, and separate scores were assigned for each section containing an individual region. For each individual mouse, all sections across the entire brain were imaged at the same time to ensure internal consistency in the qualitative analysis of axon projections for an individual mouse. The qualitative data representing VTA MC3R axon labeling includes all scores for a given region across all sections in all animals. No statistical analyses were performed on this dataset. Only mice with strong labeling in the VTA were included the analyses. 7 mice were excluded due to inefficient AAV transduction and weak labeling in the VTA.
Quantitative analysis of VTA MC3R axons projections.
For software-based, quantitative analysis of axon coverage area and axon density in selected brain regions, we acquired a single 20x magnification image of the section with the highest qualitative score for each brain area using the same acquisition parameters across sections within an individual animal. The individual axons were isolated with Fiji Tubeness plugin (Sato et al., 1998). The brain region of interest (ROI) was delineated using the fluorescent Neurotrace Nissl staining, isolated, and the area of the region was measured using ImageJ (Rueden et al., 2017). The ImageJ Fiji Internal coverage area macro (Sears & Broihier, 2016) was used to quantify the area within a nucleus containing fluorescent axons (‘coverage area’) as reflected by the ratio of squares (3 pixels in size) with and without a signal. This quantified coverage area was then normalized to the coverage area in the VTA to control for the number of starter VTA MC3R neurons transduced by AAV-ChR-EYFP and to allow for comparisons between mice. The density of MC3R axons within a brain region was then calculated by dividing the coverage area value by the measured area of the brain region ROI. The density was then normalized to the density within the VTA to control for the number of starter VTA MC3R neurons transduced by AAV-ChR-EYFP and to allow for comparison between mice.
Synaptophysin puncta quantification.
Images were taken at 60x magnification at three different rostral-caudal sections (rostral, middle, and caudal) of each brain area to fully represent the entire length of each nucleus analyzed. The Synaptophysin-mRuby puncta quantification was then automated with the use of the Analyze Particles Fiji plugin in ImageJ (Schindelin et al., 2012) with Watershed separation (Soille & Vincent, 1990). The results were averaged within each animal and then across mice within each group (MC3R-Cre and WT).
Whole-brain quantification of RVdG-mCherry labeled cells.
VTA sections taken at 20x magnification between −2.92 mm and −4.48 mm relative to bregma were used to manually count starter cells using the ImageJ Cell Counter plugin (Schindelin et al., 2012). Cells were identified as starter cells if they expressed both cytoplasmic mCherry (RvdG-mCherry) and nuclear blue fluorescent protein (AAV-RbG-hBFP). Sections adjacent to the VTA were also analyzed for the presence of BFP and mCherry to identify any off-target starter cells. 10x and 20x (when necessary) magnification images of the 40 μm coronal sections with brain regions delineated by Neurotrace fluorescent Nissl stain were used for manual count of whole-brain VTA MC3R afferent inputs with the aid of ImageJ Cell Counter plugin (Schindelin et al., 2012).
Data analysis:
All data are presented as means ± SEM. Data were graphed using IgorPro (Wavemetrics, Inc., Lake Oswego, OR, USA), and statistical analyses were performed using IBM SPSS Statistics 25. A significance level was set at p<0.05 a priori for all analyses. The qualitative and quantitative measures of VTA MC3R neuron axon projections were not analyzed statistically. Synaptophysin-mRuby puncta counts were analyzed using two way repeated measures ANOVA. A one-way ANOVA was used to analyze the number of RetroBead-labeled neurons in the Arc and the connectivity between Arc and VTA subpopulations was analyzed using a two-way ANOVA. ANOVAs were followed by LSD post-hoc tests corrected for multiple comparisons. T-tests were used to compare starter cells in MC3R-Cre vs WT mice in the control rabies experiment and to make gender comparisons for the starter cell, total cell, and input per starter counts. The sex comparisons for the VTA MC3R inputs from the individual areas were made in two different ways: using a 2-way repeated measures ANOVA and performing individual t-tests comparing the number of RVdG-mCherry-labeled neurons in each region between males and females. Neither of the approaches revealed any significant sex differences.
3. Results
Efferent projections from VTA MC3R neurons
We initially sought to identify the efferent projection patterns of VTA MC3R neurons. To examine the efferent anatomy of VTA MC3R neurons, we injected AAVs expressing cre-dependent channelrhodopsin-eYFP (ChR2-eYFP) unilaterally into the VTA of both male and female MC3R-cre mice (Figure 1a). The mice were sacrificed 5 weeks later and 40μm coronal sections were collected across the entire rostro-caudal extent of the brain. Every 5th section was then analyzed for the presence of eYFP+ axons using standard epifluorescence microscopy. In all mice, eYFP+ cells bodies were largely restricted to the VTA and were present in all VTA subnuclei, similar to the previously reported distribution of VTA MC3R neurons (Lippert et al., 2014; West et al., 2019). YFP+ axons were observed in efferent target regions between +1.78 and −6.24 mm relative to bregma, with no labeling identified in brain regions rostral or caudal to these regions (see examples of labeling in sagittal sections in Figure 1). Although we included equal numbers of males and females in these experiments, we did not see any apparent sex differences in the eYFP+ axon labeling in any of the brain regions, so the brains of animals of both sexes were grouped for analysis.
Figure 1. Major efferent projection targets of VTA MC3R neurons.
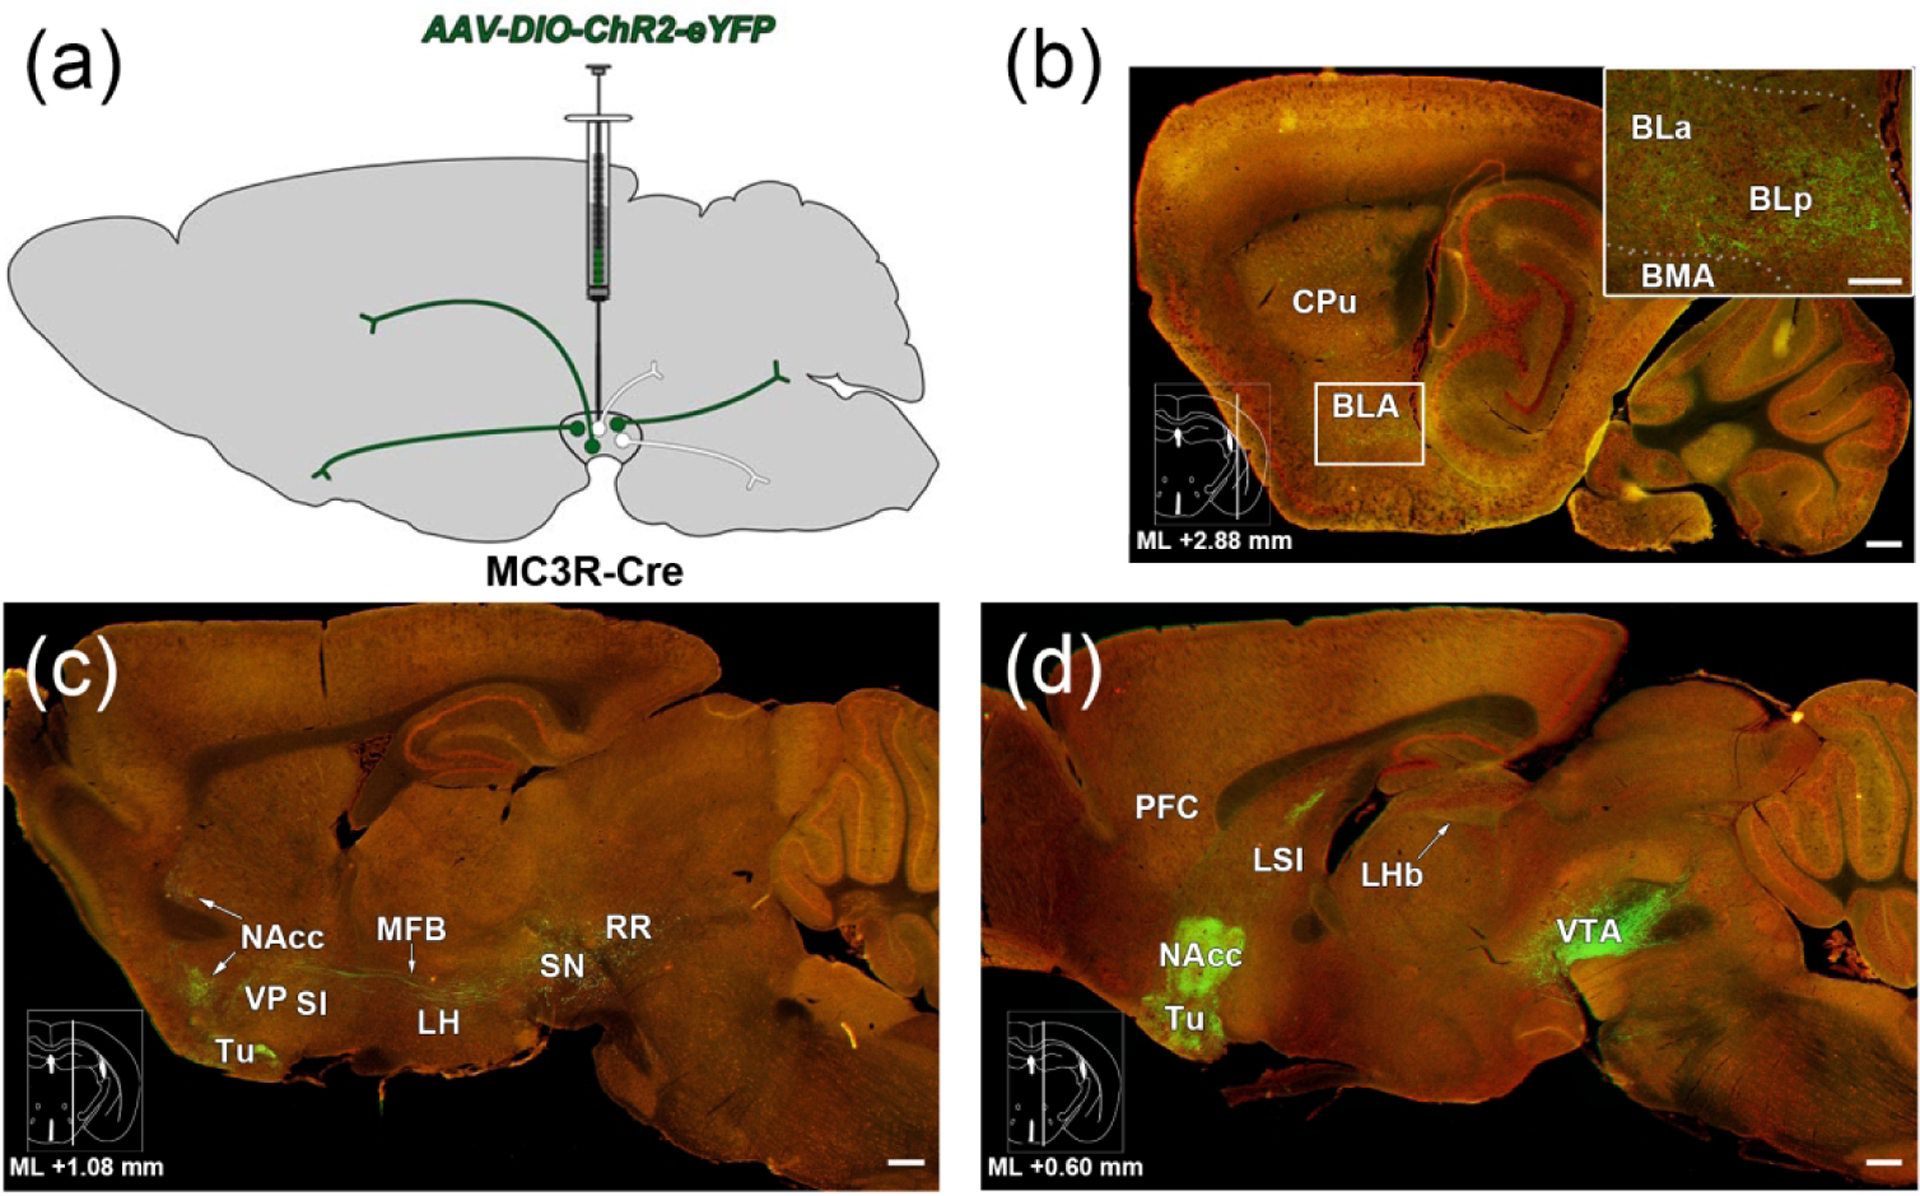
(a) Schematic illustrating strategy to examine VTA MC3R axon labeling. (b-d) Sagittal brain sections stained with NeuroTrace (red) showing ChR2-eYFP+ axons (green) in major target areas of the VTA MC3R neurons. Atlas insets on the bottom left of each image show the mediolateral location of each sagittal section and the distance relative to midline. (b) Lateral-most section of the series. Inset: Higher magnification view of the area in the white box. (c) Middle section of the series. (d) Medial-most section of the series. Scale bars: 200 μm. Abbreviations: BLa/BLp-anterior and posterior basolateral amygdala, BMA/BMP- anterior and posterior basomedial amygdala, RR-retrorubral nucleus and field, SN-substantia nigra.
We initially used a qualitative approach to describe the presence of VTA MC3R neuron axons across different brain regions. A score of 1 to 4 was assigned by the investigator to each brain region based on the intensity of fluorescence and the amount of area covered (see methods). In most cases, brain areas containing eYFP+ axons were spread over multiple brain sections, and separate scores were assigned for individual brain regions in all sections containing that region. The qualitative data representing VTA MC3R neuron axon labeling are presented in Figure 2 as the median, the 25% and 75% quartiles, and the minimum to maximum range of scores for a given region across all sections in all animals. Overall, the brain regions receiving input from VTA MC3R neurons reflect the projection patterns that have been identified for other VTA neuron subpopulations (Aransay, Rodriguez-Lopez, Garcia-Amado, Clasca, & Prensa, 2015; Taylor et al., 2014; Yamaguchi, Wang, Li, Ng, & Morales, 2011; Yetnikoff, Lavezzi, Reichard, & Zahm, 2014). The most prominent VTA MC3R neuron projection areas were in forebrain regions with ascending fibers concentrated in the medial forebrain bundle (MFB) traveling through the lateral hypothalamus (LH, Figure 1). The strongest VTA MC3R axon labeling was observed in the NAcc (Figure 1d, 2, 3d), olfactory tubercle (Tu; Figure 1D, 2, 3d), lateral septum (LS; Figure 1d, 2, 3e), bed nucleus of stria terminalis (BST; Figure 2, 3f), ventral pallidum (VP, Figure 1c, 2, 3d, g), substantia innominata (SI; Figure 1c, 2), LH (Figure 1c, 2, 3h), lateral habenula (LHb; Figure 1d, 2, 3i) and basolateral amygdala (BL; Figure 1b, 2, 3j). Sample images of VTA MC3R axon labeling in each of these brain regions as well as representative images of weakly labeled hindbrain areas such as the periaqueductal gray (PAG), dorsal raphe (DR, Figure 3k), laterodorsal tegmental nucleus (LDTg), and medial and lateral parabrachial nuclei (PBN; MPB and LPB, Figure 3l) are shown in Figure 3. The distributions of VTA MC3R axons across the brain are described in more detail below.
Figure 2. Qualitative whole-brain analysis of VTA MC3R axon labeling.
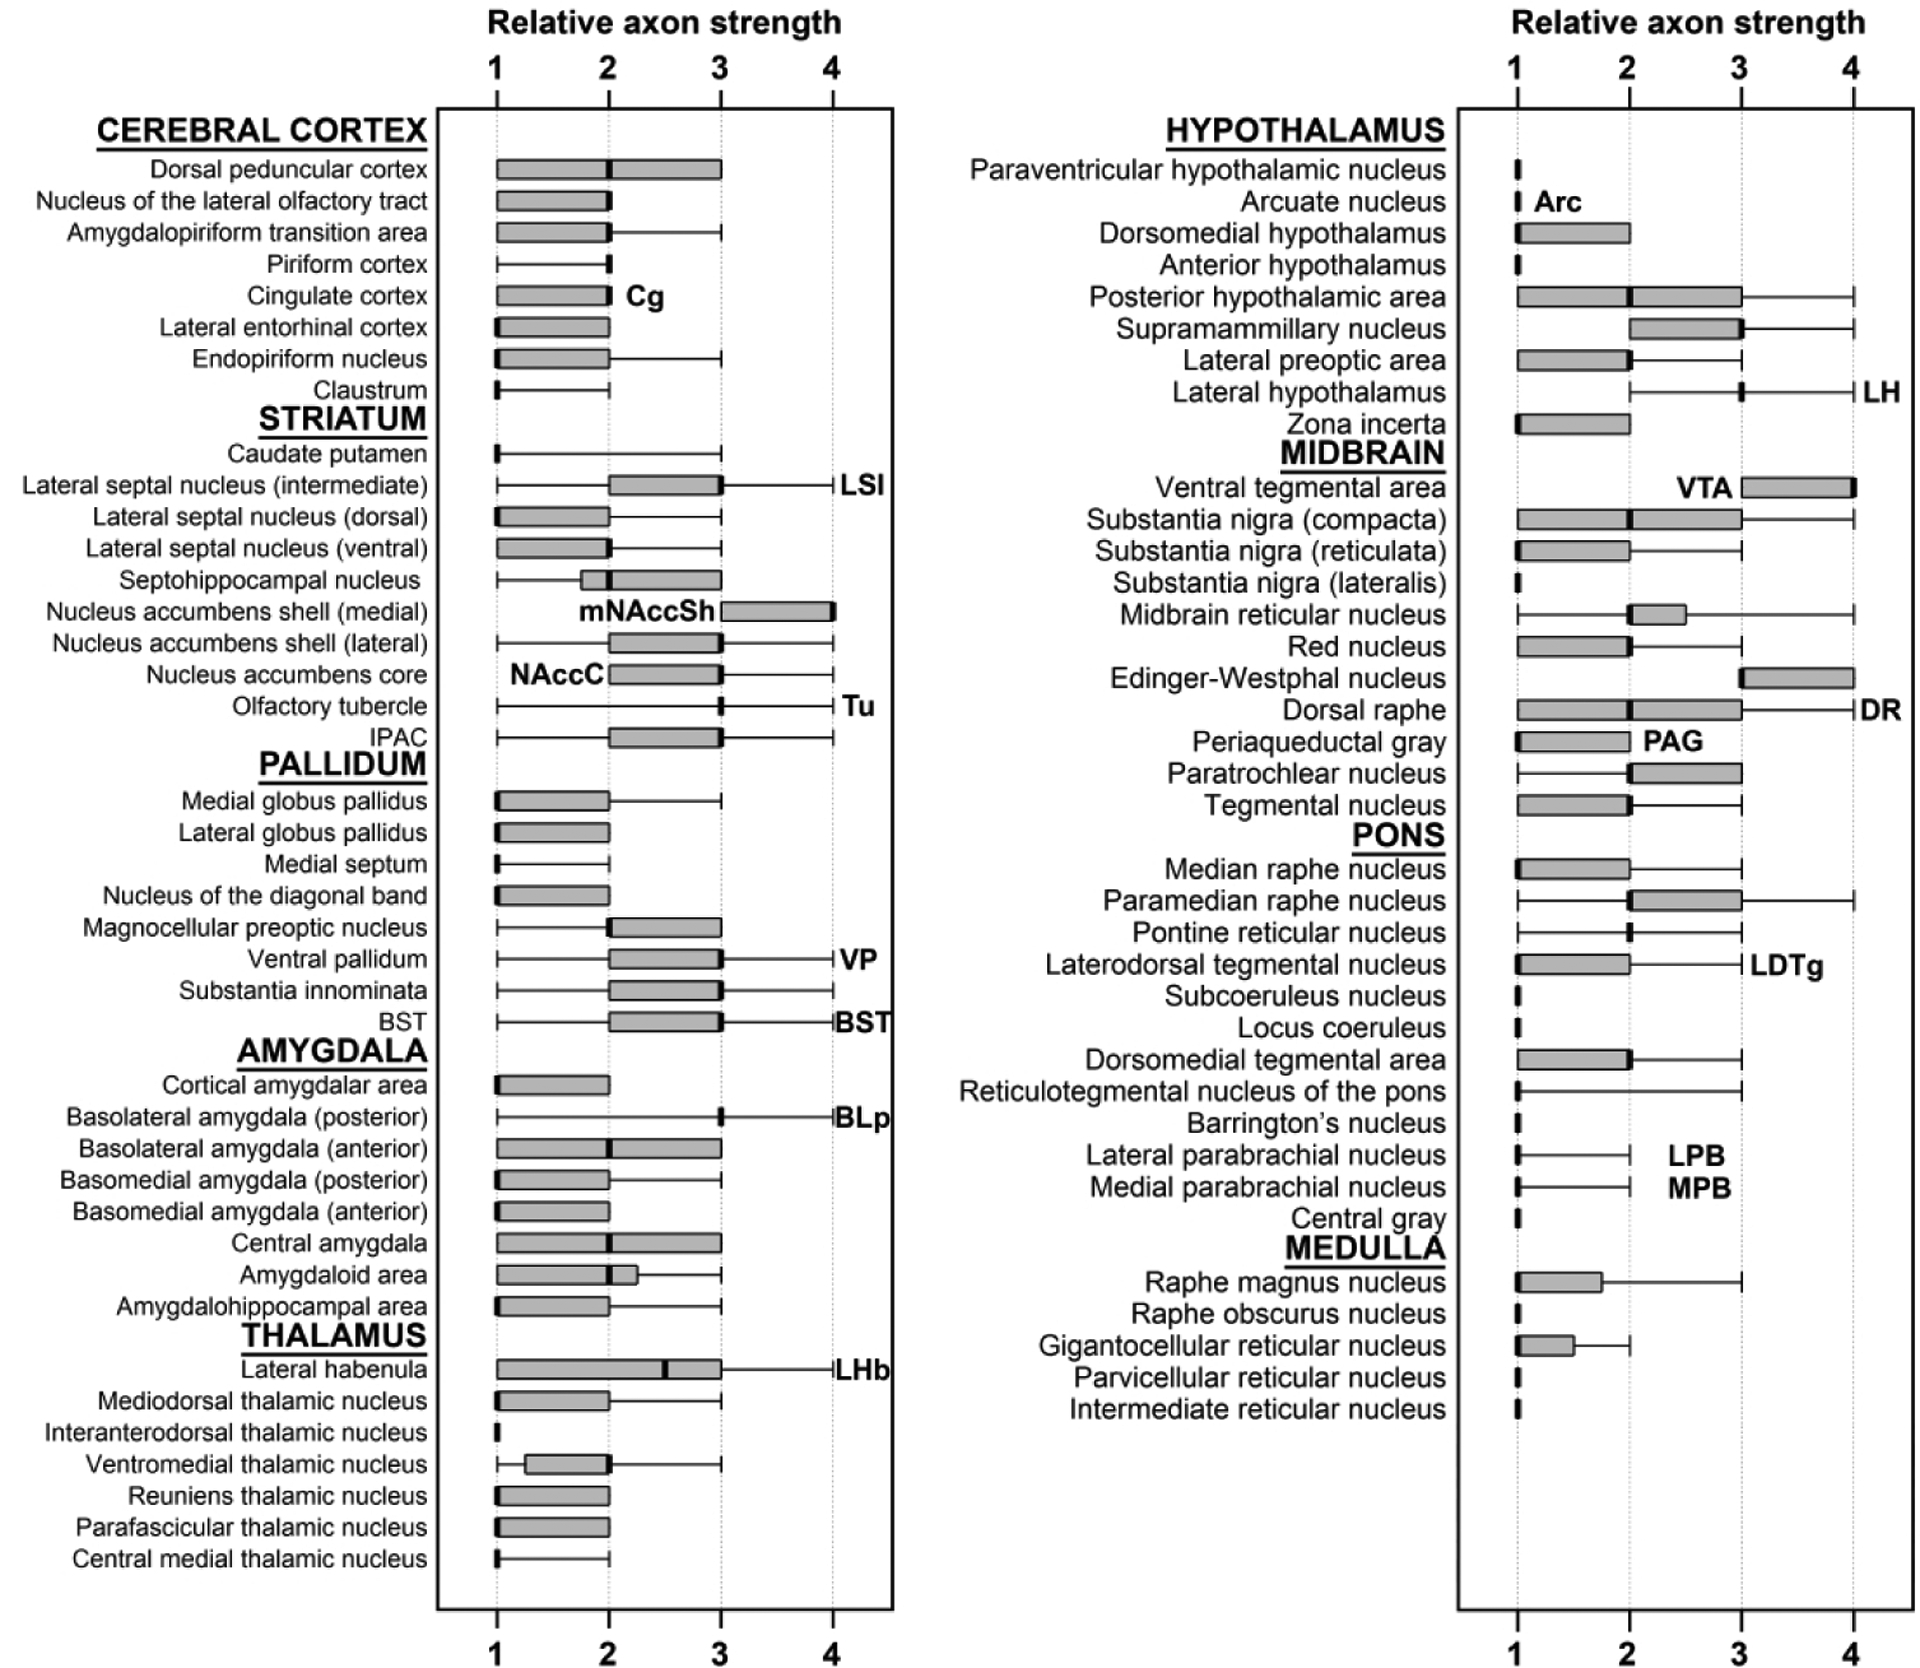
Whisker plots of axon labeling in different brain areas of MC3R-Cre mice. Scores from every brain section containing each individual nucleus across all mice examined are included. The dark line represents the median, the box represents the 25% and 75% quartiles, and the whiskers represent the minimum-maximum range of scores (n=6: 3 males, 3 females). Abbreviations: IPAC- interstitial nucleus of the posterior limb of the anterior commissure.
Figure 3. Sample images of the major efferent projection targets of VTA MC3R neurons.
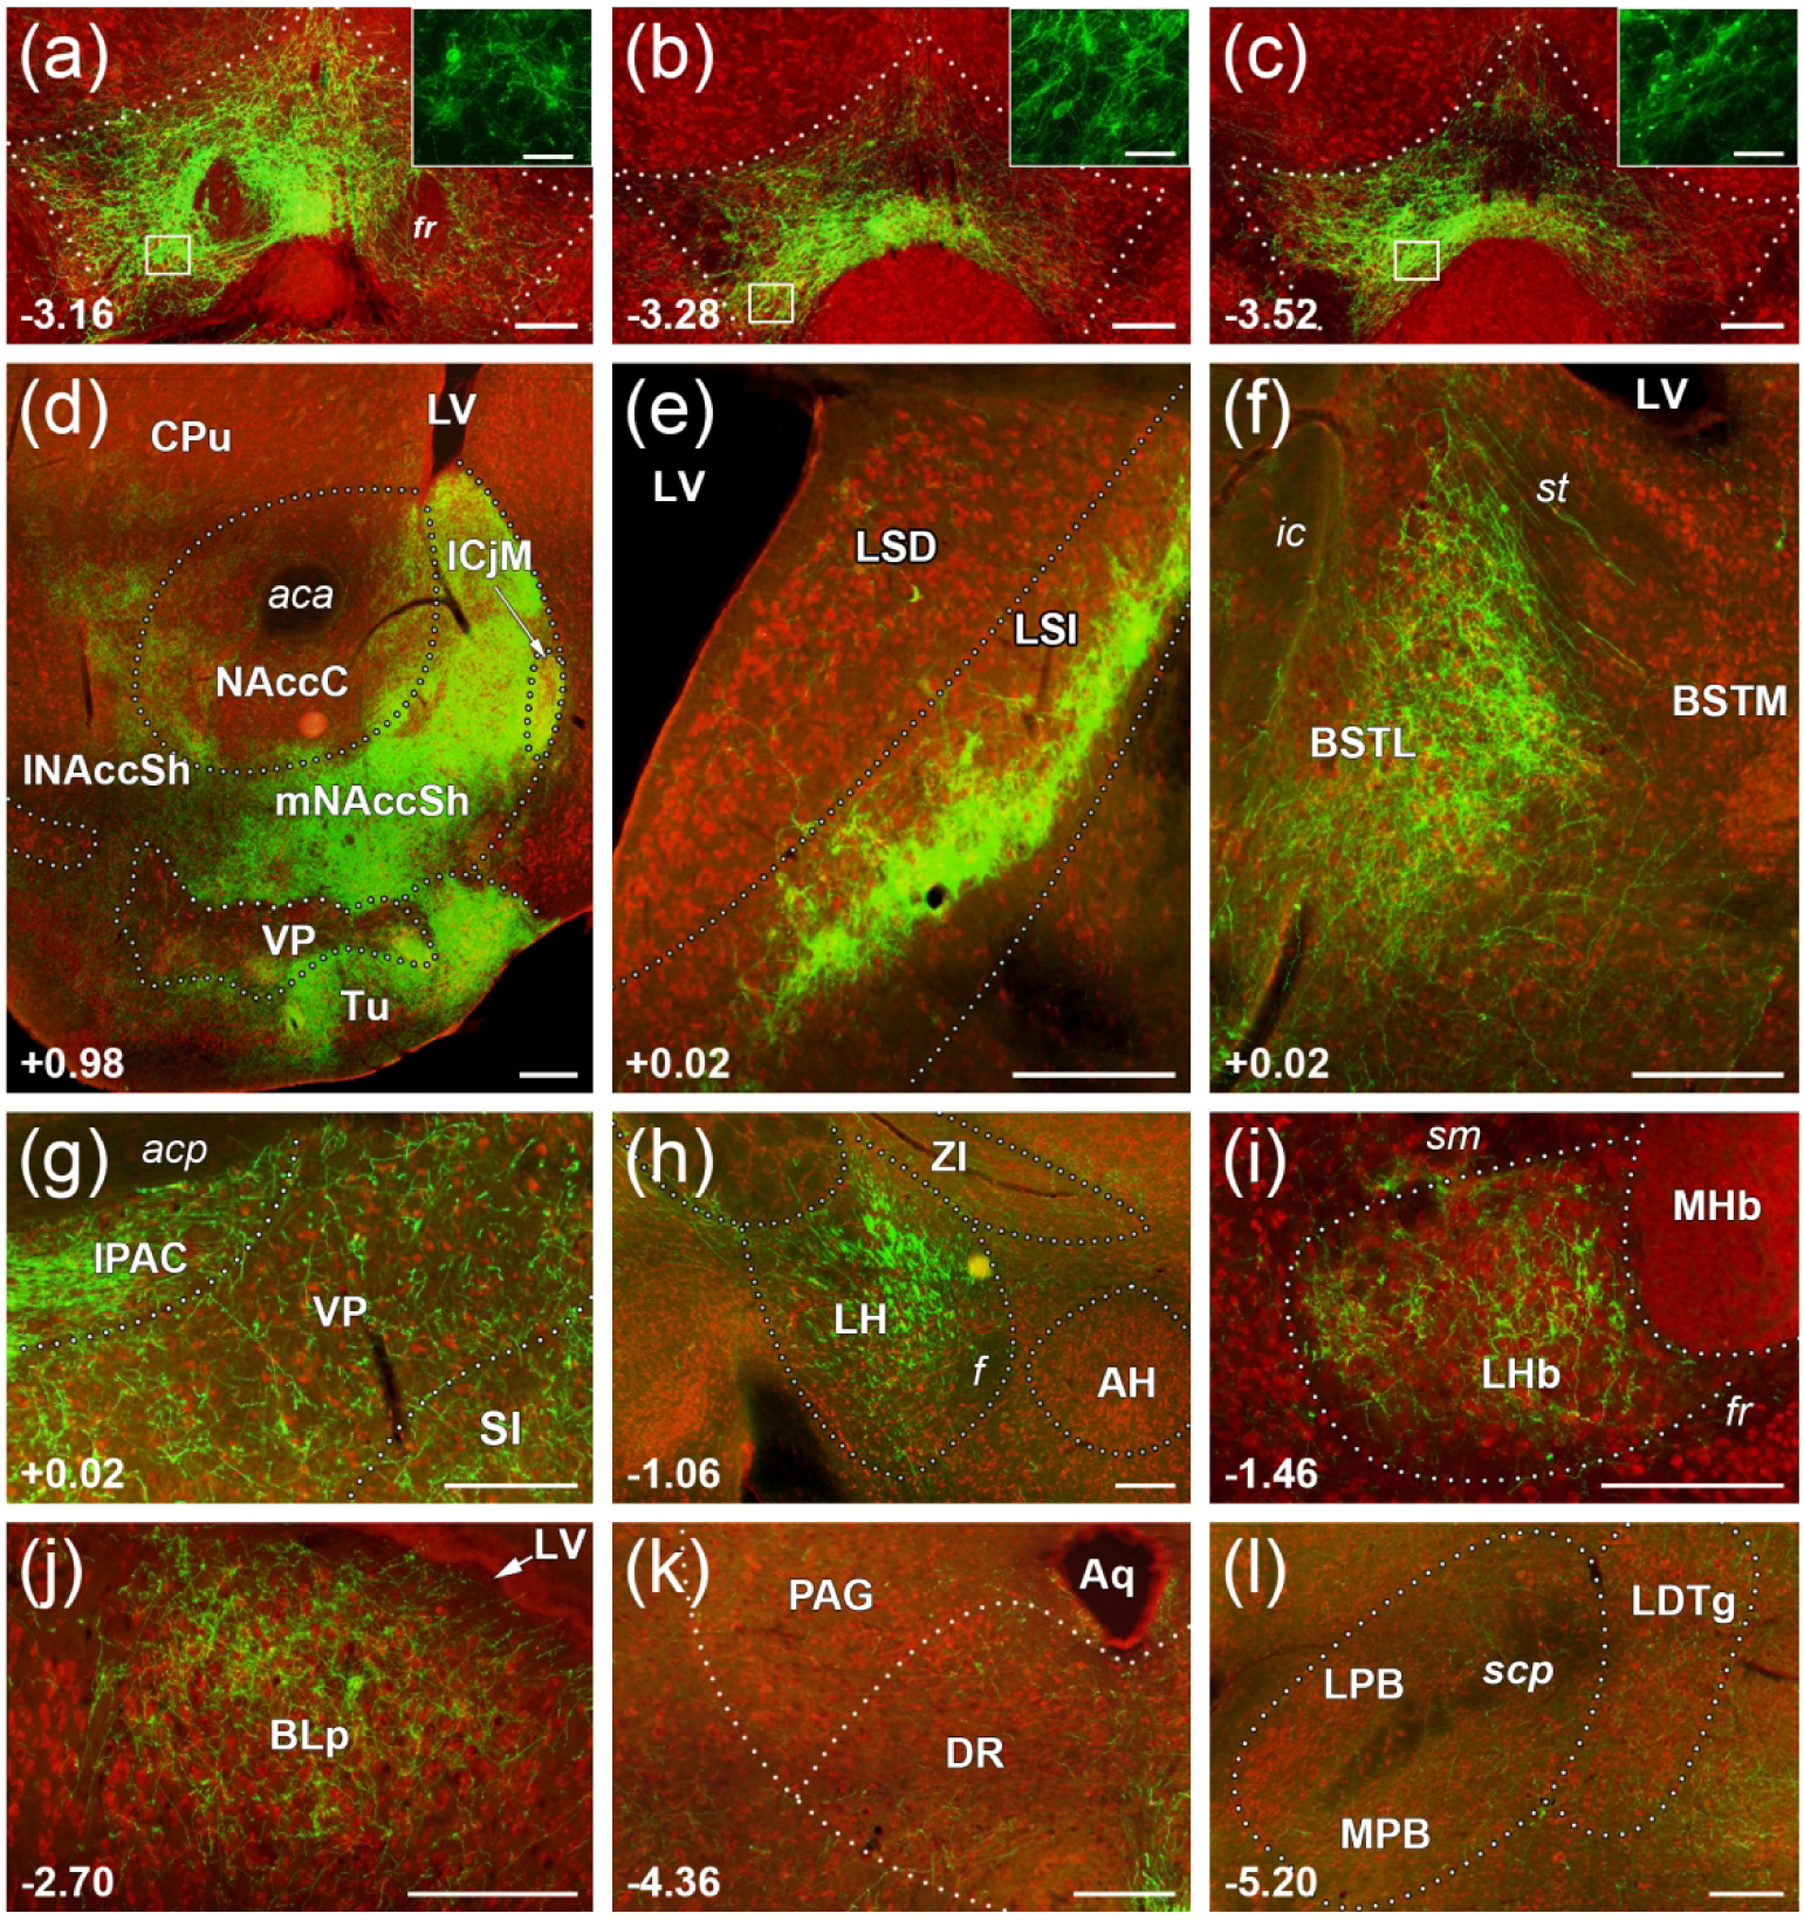
Representative images of coronal sections showing Cre-dependent ChR2-eYFP+ labeling in MC3R-Cre mice. VTA MC3R axon labeling is shown in green in brain sections stained with NeuroTrace Nissl stain (red). (a-c) Representative images of cell bodies and axons along the rostro-caudal extent of the VTA. (a)Rostral VTA; (b) Middle VTA; (c) Caudal VTA. Insets show higher magnification views of boxed areas in a-c. (d-j) Representative coronal sections showing ChR2-eYFP+ axon labeling in the major efferent targets of VTA MC3R neurons. (d) NAcc and Tu. (e) LSI. (f) Lateral BST. (g) VP, SI, and IPAC. (h) LH. (i) LHb. (j) BLp. (k, l) Representative images of weak ChR2-eYFP labeling in hindbrain regions. (k) PAG and DR. (l) LDTg, MPB, and LPB. Midline is to the right of the images for (d-l). Numbers at the bottom left corner indicate section position relative to bregma. Scale bars: 100 μm for (a-l) and 20 μm for (a-c) insets. Abbreviations: AH –anterior hypothalamic area, BST(L/M)- lateral or medial divisions of the bed nucleus of stria terminalis, HDB- nucleus of the horizontal limb of the diagonal band, ICjM-major islands of Calleja, LSI/LSD- intermediate and dorsal segments of the lateral septum, mNAccSh/lNAccSh- medial shell or lateral shell of NAcc, MCPO- magnocellular preoptic nucleus, MHb- medial habenula, PV- paraventricular thalamic nucleus, ZI- zona inserta; fiber tracts and other structures: aca- anterior commissure, Aq- aqueduct, f- fornix, fr- fasciculus retroflexus, LV– lateral ventricle, sm- stria medullaris of the thalamus, st- stria terminalis.
Cerebral cortex.
VTA MC3R projections to the cerebral cortex were weak, with only a few eYFP+ axons present in each labeled cortical area. Most of the brain areas receiving input from the VTA MC3R neurons were in the cortical plate with the regions associated with olfaction (dorsal peduncular cortex, nucleus of the lateral olfactory tract, amygdalopiriform transition area, and piriform cortex) receiving stronger input (Figure 2). Anterior cingulate cortex (Cg) was the only region of the prefrontal cortex (PFC) containing eYFP+ axons and was labeled very weakly with only a few eYFP+ axons observed in a subset of the Cg-containing sections examined.
Striatum.
Within the striatum, most eYFP+ axons were concentrated in the ventral striatum and the lateral septal complex with very weak labeling seen in the dorsal striatum (Figure 1–2). The regions with the strongest labeling were the NAcc, Tu, and the LS (Figure 1d, 2, 3d, e) with NAcc and Tu being the top two regions receiving the most VTA MC3R neuron input across the entire brain. NAcc and Tu-projecting VTA MC3R neuron axons were concentrated in the medial aspects of these nuclei and, on occasion, appeared to be organized in patches (Figure 1c, d; 3d). Within NAcc, the medial shell (mNaccSh) had the strongest labeling followed by the core (NAccC) and the lateral shell (lNaccSh, Figure 1, Figure 2, and Figure 3d). Although labeling in the mNaccSh was consistent across sections, there was more variability in the labeling observed across sections for the Tu, NaccC, and lNaccSh, with the majority of sections showing strong labeling, but some sections showing lower labeling (Figure 2). The major island of Calleja located between the medial shell and the LS was densely populated with eYFP+ axons (Figure 3d). The caudate putamen (CPu) and septohippocampal nucleus of the dorsal striatum were weakly to moderately labeled by the VTA MC3R neuron axons (Figure 2). The rostro-caudal range of CPu labeling was very broad and encompassed most of the length of the nucleus, whereas eYFP+ axons were only seen in 2–3 septohippocampal nucleus-containing sections and usually were found in the intermediate to caudal portions of this nucleus (between 0.62 mm and 0.98 mm relative to bregma). Most often, few eYFP+ axons were scattered in the CPu per section analyzed and occasionally a moderately labeled patch of eYFP+ axons was present at the interface between CPu and lNAccSh (Figure 3d).
Septum.
Within the lateral septal complex, the intermediate segment of the LS (LSI) received the strongest VTA MC3R projections and was one of the top 10 most prevalent VTA MC3R neuron target areas (Figure 2). In all animals, eYFP+ axons in the LS were concentrated in the caudal portion of the nucleus (between 0.14 and −0.1mm relative to bregma) and were arranged in a dense band located on the border with the dorsal segment of the nucleus (Figure 1d, 3e), with weaker labeling seen in the anterior regions of the LSI (see range of values in Figure 2). Both dorsal and ventral segments of the LS also contained VTA MC3R neuron axons with scattered weak to moderate labeling (Figure 2, Figure 3e).
Pallidum.
The most prominent pallidal targets of the VTA MC3R neurons were structures of the ventral and caudal pallidum including the VP, SI, and the BST (Figure 1c, 2, 3d, f, g). The eYFP+ axons were present at varying levels along the entire rostro-caudal extent of VP including the pallidal islands intermingled along the Tu parenchyma (Figure 3d). Similar to the VP, the SI received moderate VTA MC3R neuron projections that covered the entire rostro-caudal extent of the nucleus. Unlike the densely packed or patchy organization of the eYFP+ axons in the ventral striatum and the LS, the axons in the VP and SI were loosely spread over the entire nucleus (Figure 3d, g). The BST was moderately innervated by the VTA MC3R neurons and labeling was present along the entire rostro-caudal extent of the nucleus, including the very caudal intraamygdaloid division. The more abundant eYFP+ axon labeling was concentrated in the lateral division of the BST, while axons within the medial portion were sparse (Figure 3f). Although the labeling in the VP, SI, and BST was fairly consistent at a moderate level in most sections, some sections did show weak labeling (see full range and 25%−75% quartiles in Figure 2) similar to what was observed with the structures in the striatum and septum. Despite similar qualitative scores, the Tu and VP did differ, as the Tu had stronger labeling over a smaller area and the VP appeared to have more diffuse labeling over more of the nucleus. As the scoring system considers both intensity and area covered, these regions were rated qualitatively similar even though the pattern of innervation was not identical.
Amygdala.
Within the amygdala, the highest labeling was observed in the basolateral amygdala which was moderately innervated by eYFP+ axons (Figure 2, Figure 3j) with moderate levels of labeling spread over most sections containing this nucleus. VTA MC3R neurons sent more projections to the posterior division of the nucleus (BLp) compared to the anterior portion (BLa; Figure 1b). In many of the BLp-containing sections, eYFP+ fibers were diffusely spread over the entire nucleus as shown in Figure 3j but but some BLp sections showed smaller coverage area (see full range and 25%−75% quartiles in Figure 2). Low to moderate eYFP+ axon labeling was observed in the central amygdala (CeA), while the basomedial amygdala received sparse VTA MC3R neuron innervation (Figure 1b). No eYFP+ axons were seen in the medial amygdala (MeA).
Thalamus.
In the thalamus, VTA MC3R neurons projected exclusively to the polymodal associated cortex related nuclei including the LHb, reuniens nucleus, central medial thalamic nucleus, intermediodorsal thalamic nucleus, and parafascicular thalamus (Figure 2). LHb was the most prominent thalamic VTA MC3R neuron target with axons often concentrated in the medial and central portions of the nucleus in some but not all sections (Figure 1d, 2, 3i). The remaining thalamic nuclei lacked or had very few eYFP+ axons (Figure 2).
Hypothalamus.
Within the hypothalamus, more eYFP labeling was observed in the lateral zone compared to the medial zone or the periventricular zone/region. The LH contained moderate to high labeling of VTA MC3R neuron axons whereas the remaining nuclei in the lateral zone including lateral preoptic area (LPO), zona incerta, and parasubthalamic nucleus (PSTh) contained low to moderate amount of eYFP+ axons (Figure 2, 3h). Labeling in the LH was consistent across the rostro-caudal extent of the nucleus and was comprised of dense clusters of axons in the center of the nucleus some of which may represent fibers of passage that are a part of the medial forebrain bundle. The supramammillary nucleus (SuM) of the medial hypothalamic zone contained moderate labeling which was mostly concentrated in the medial aspect of the nucleus. Due to close proximity of SuM to the rostral VTA we did not choose this nucleus for further analysis. The remaining hypothalamic nuclei including the anterior, posterior, dorsomedial, paraventricular nuclei (PVN) and the Arc contained very sparse eYFP+ axons (Figure 2).
Midbrain, Pons, and Medulla Oblongata.
In general, the amount of VTA MC3R neuron axons observed was lower in the more caudal regions of the brain. Within the midbrain, sparse to moderate eYFP+ axon labeling was observed in the retrorubral field, dorsal raphe (DR, Figure 3k), and substantia nigra pars compacta, and along most of the rostro-caudal extent of the midbrain reticular nucleus (MRN, Figure 1c, 2). Moderate labeling was observed in the paramedian raphe and pontine reticular nucleus while other pontine nuclei such as the LDTg (Figure 3l), locus coeruleus (LC), and parabrachial nuclei (Figure 3l) only showed sparse VTA MC3R neuron axons (Figure 2).
Because there was variability in the both the intensity of labeling and the amount of area covered by fluorescent labeling between different brain regions which sometimes led to similar qualitative ratings, we next sought to use an unbiased quantitative approach to measure the density of axon labeling and the area of the brain region innervated by VTA MC3R axons in selected brain regions showing the strongest median labeling in the qualitative analysis. For this analysis, a single image was acquired from the VTA and 9 brain regions using the same acquisition parameters for each section within an individual mouse, and the coverage area and density of fluorescent axons were calculated for each brain region and normalized to the VTA (Figure 4a, see methods). Representative pixel-isolated images used for software-based quantification are shown in Figure 4d. The brain regions with the highest area coverage were the NAccSh and the LSI (Figure 4b), and these areas along with the LHb had the highest axon densities (Figure 4c).
Figure 4. Quantitative analysis of the coverage area and density of VTA MC3R neuron axons in major efferent projection targets.
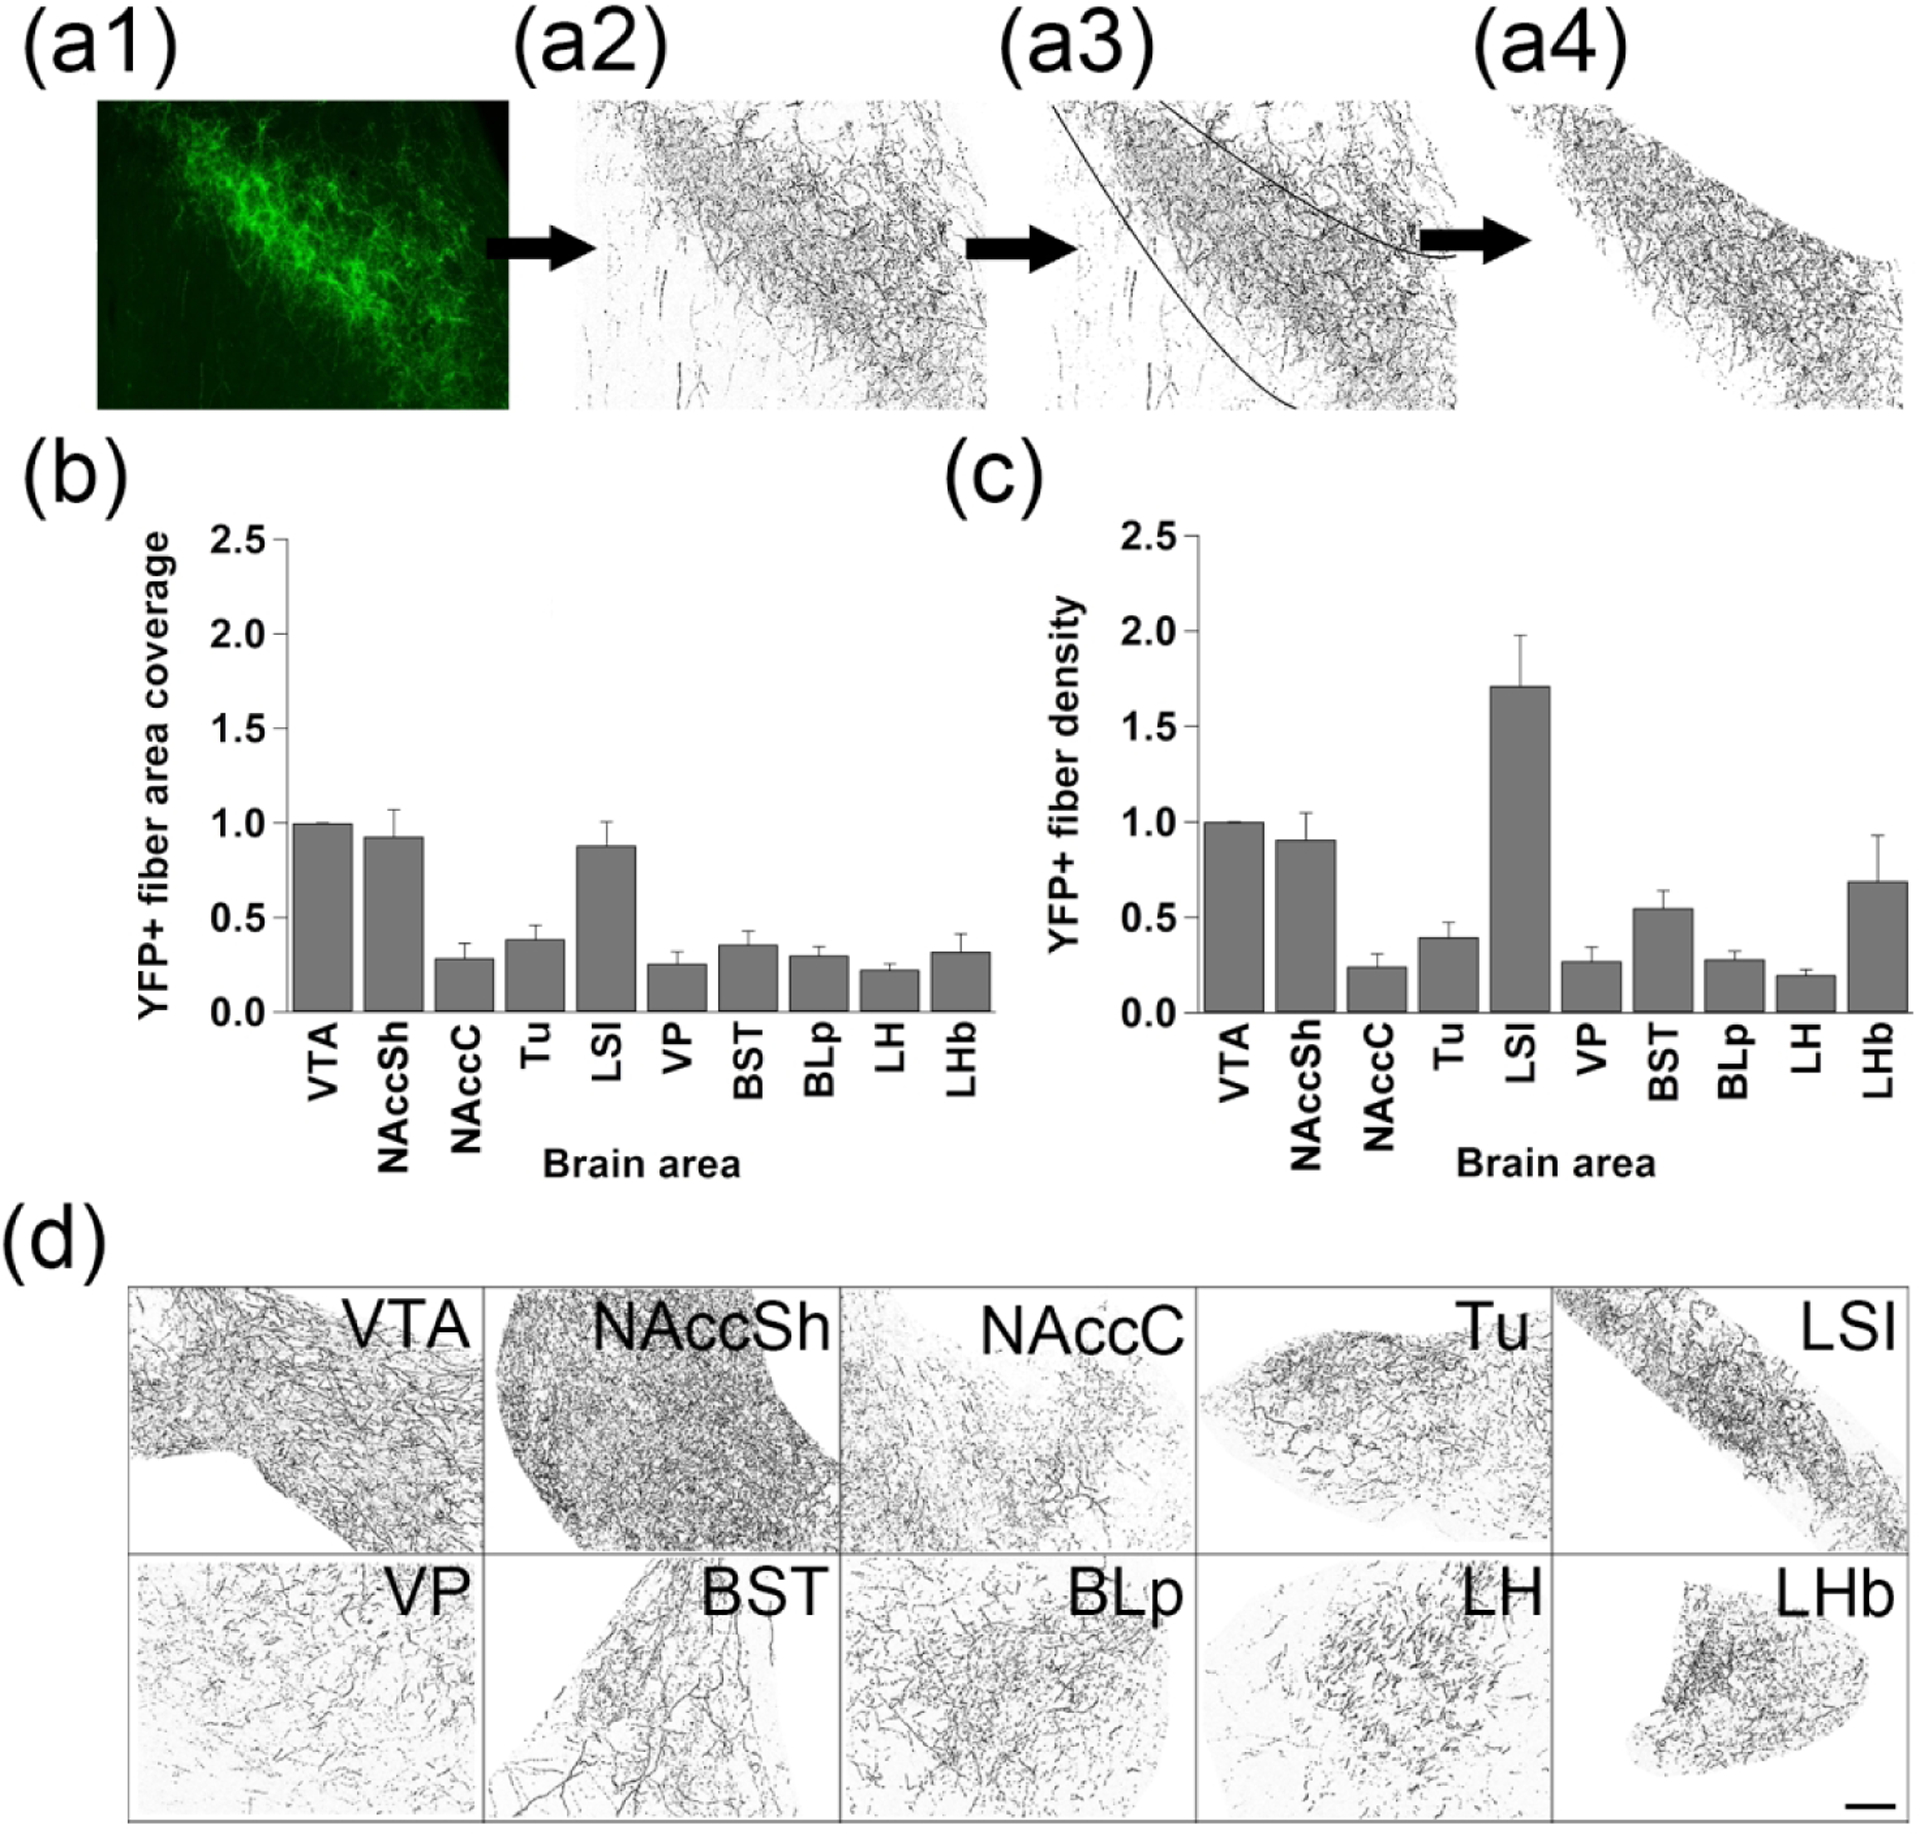
(a) Summary of the procedure used for software-based quantification of VTA MC3R neuron axon labeling in the major projection targets: (a1) a single 20x image was acquired for each brain region using the same acquisition parameters across all sections in an individual mouse. (a2) Pixels containing eYFP+ signal were isolated. (a3) The region of interest (ROI), an area containing the nucleus being measured, was delineated and the area was measured. (a4) The coverage area and density of eYFP+ axons were measured. (b) Average coverage area normalized to the VTA. (c) Average VTA MC3R axon density normalized to the VTA (n=6: 3 males, 3 females). (d). Representative pixel and ROI-isolated images used for software-based quantification. Midline is to the left for all images. Scale bars: 50 μm.
Analysis of putative VTA MC3R axons synapses in the major projection target regions
Although the presence of eYFP+ fibers suggests that VTA MC3R neurons synapse in these target brain regions, it is possible that the labeled axons were only fibers of passage that do not form synapses in the identified regions. In most of the regions containing eYFP+ axons, branching fibers with bulging varicosities were observed, suggestive of synaptic contact, but we sought to confirm that VTA MC3R neurons indeed synapse in each of the major target regions through the use of a synaptophysin-mRuby fusion protein which can be used to identify putative synapses (Beier et al., 2015). MC3R-Cre and wild type (WT) mice were unilaterally injected in the VTA with AAVs expressing a Cre-dependent membrane-tethered GFP (mGFP) and synaptophysin-mRuby connected by the T2A linker (Figure 5a) (Beier et al., 2019). In addition, a subset of mice received a 1:3 mixture of AAV-DIO-ChR2-eYFP and AAV-DIO-synaptophysin-mRuby to facilitate identification of VTA MC3R axons. Due to the strong autofluorescence present in the epifluorescent wide-field images, especially in hypothalamic and limbic areas including the LH, VP, BST, and BLp, the synaptophysin-mRuby signal in MC3R-Cre mice was compared to that in WT mice. Quantitative analysis of mRuby puncta revealed a significant brain area*genotype interaction (F(9, 54)=8.449, p<0.001) and post hoc tests revealed that synaptophysin-mRuby+ puncta were significantly higher in the NAccSh (p=0.010), NAccC (p=0.010), Tu (p=0.027), LSI (p=0.037), and LHb (p=0.016) of MC3R-Cre mice compared to WT (Figure 5b). mRuby puncta were also higher in the VP, BST, BLp, and LH of MC3R-Cre mice, but these differences did not reach statistical significance (Figure 5b). This likely reflects the high levels of background autofluorescence relative to the synaptophysin signal in these areas as clear synaptophysin-mRuby+ puncta were identified along mGFP/eYFP+ axons in all of the brain regions analyzed (Figure 5c). Thus, VTA MC3R neurons appear to synapse in each of the brain regions showing the strongest VTA MC3R neuron axon labeling in the quantitative analysis.
Figure 5. Synaptophysin-based confirmation of putative VTA MC3R synapses in the major efferent projection targets.
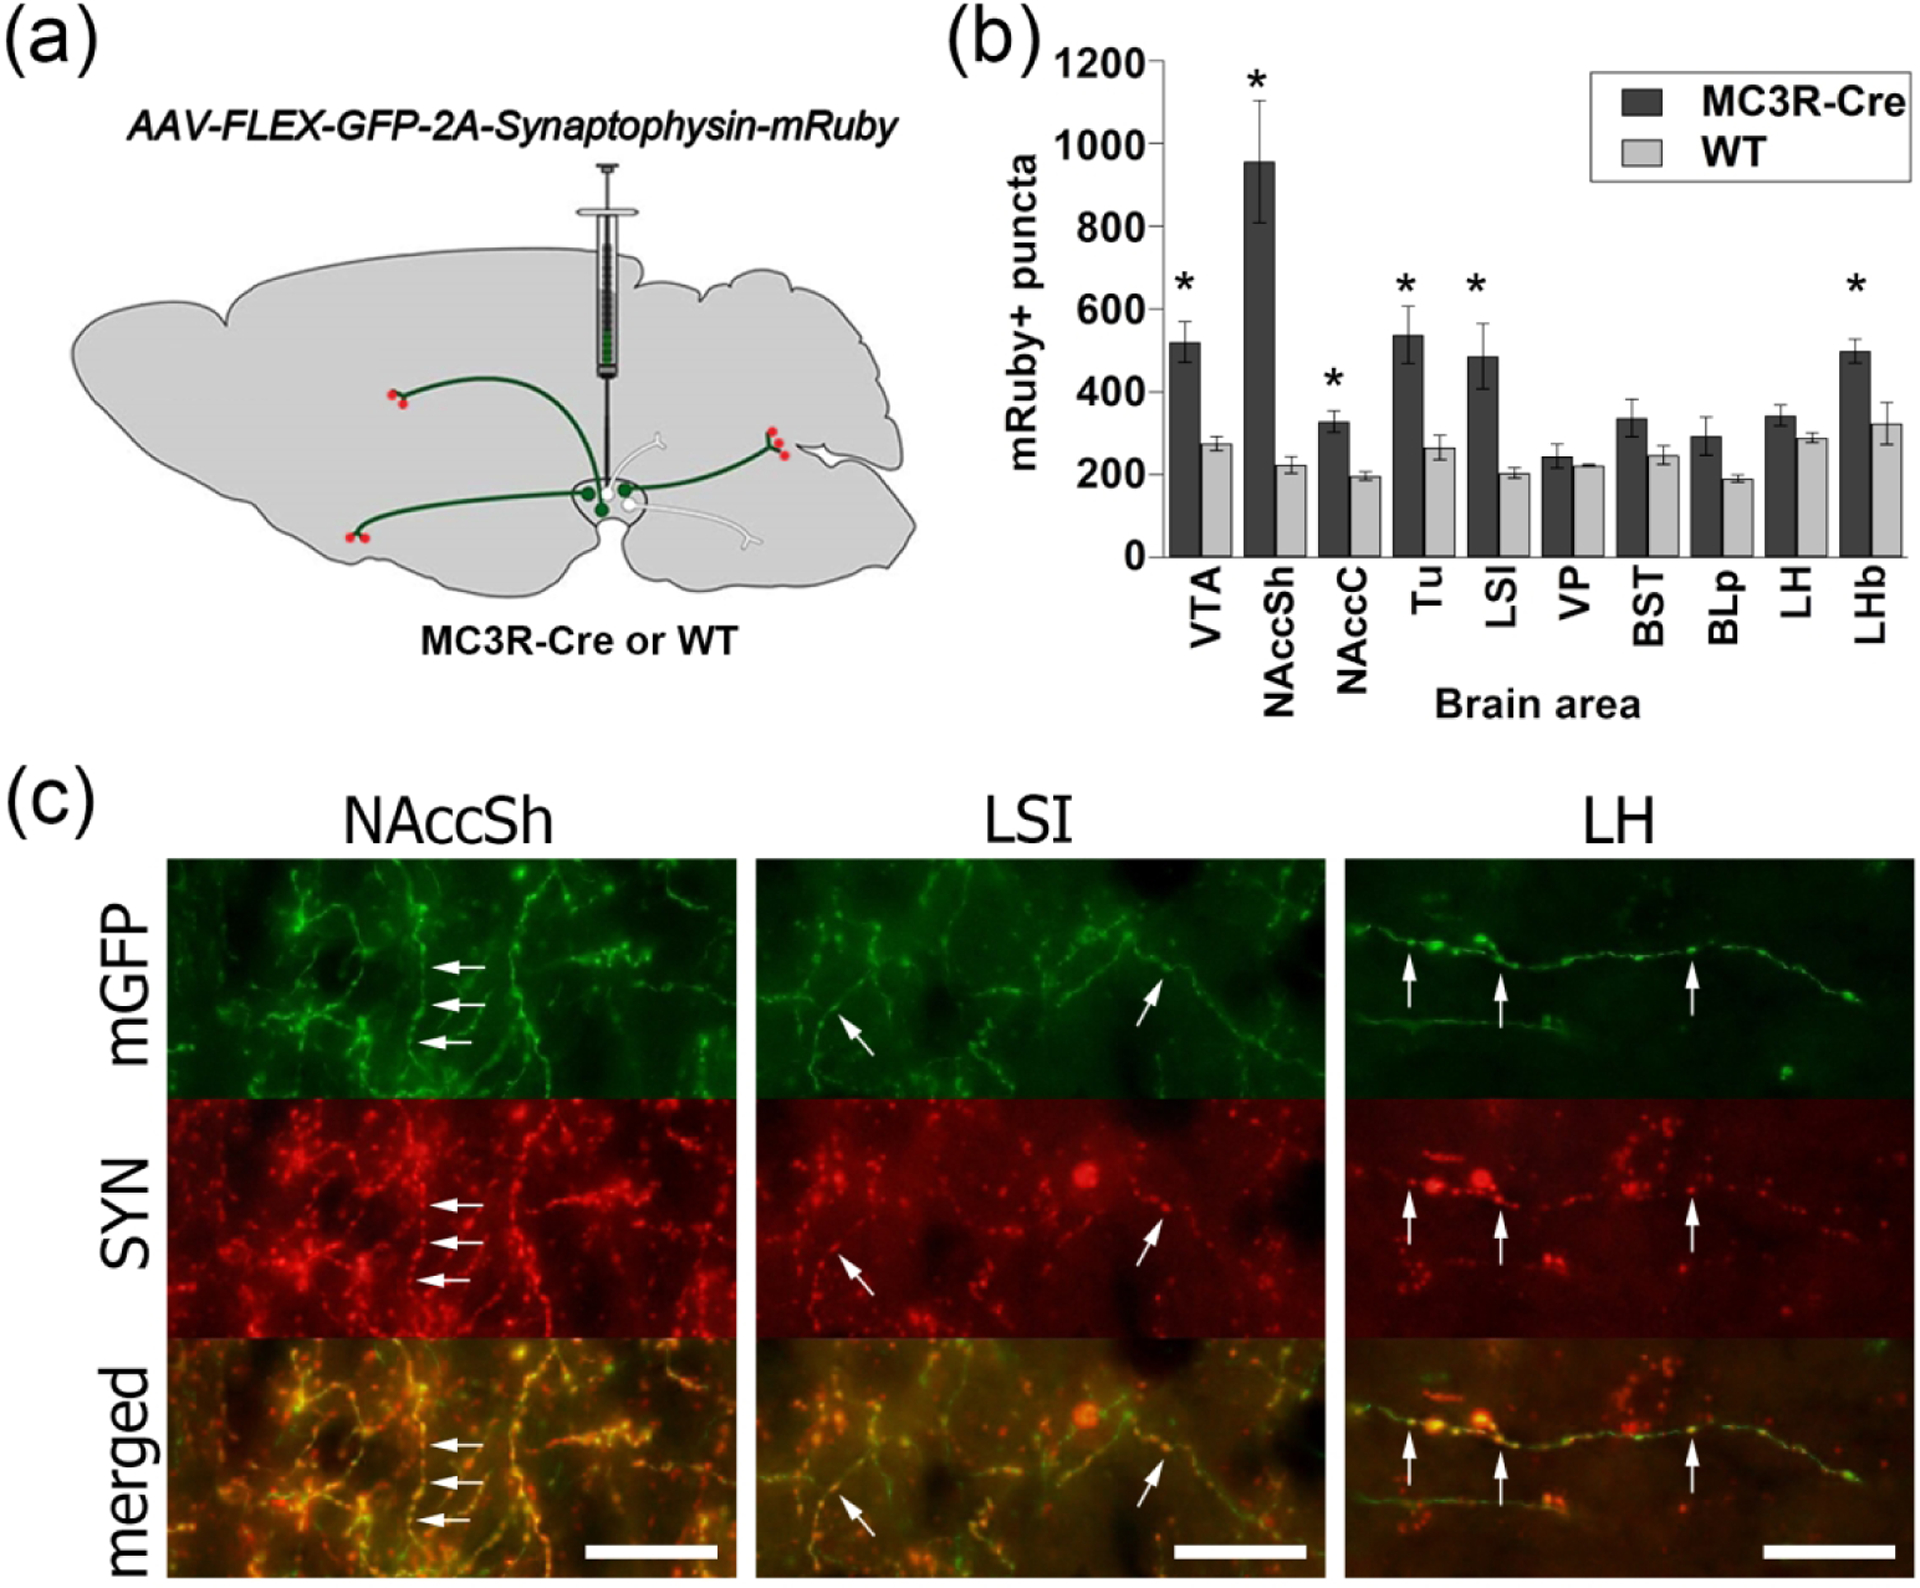
(a) Schematic illustrating strategy to achieve synaptophysin-mRuby expression in VTA MC3R axon terminals. (b) Average synaptophysin-mRuby+ puncta in MC3R-Cre (n=5) and wild type (WT; n=3) mice. (c) Representative images from NAccSh, LSI, and LH showing synaptophysin-mRuby+ puncta (red) along mGFP/eYFP+ axons (green). Arrows: examples of synaptophysin-mRuby puncta along an eYFP+ axon. Scale bars: 10 μm. * p<0.05 vs. WT. Abbreviations: SYN- synaptophysin.
Afferent inputs to VTA MC3R neurons
We next set out to identify the brain regions providing afferent input to VTA MC3R neurons by making use of EnvA-pseudotyped, G-deleted rabies viruses (RVdG) expressing mCherry (Wickersham et al., 2007a; Wickersham et al., 2007b; Faget et al., 2016). Two AAVs expressing either Cre-dependent TVA-eYFP or Cre-dependent rabies glycoprotein G and blue-fluorescent protein (rG-BFP) (Faget et al., 2016) were injected into the VTA of male and female MC3R-Cre mice, and RVdG was injected into the same site three weeks later. The mice were sacrificed after 7 days of incubation with RVdG, and 40 μm sections were obtained across the entire rostro-caudal extent of the brain (Figure 6a).
Figure 6. Strategy and validation of cell-type-specific monosynaptic rabies virus- mediated tracing from VTA MC3R neurons.
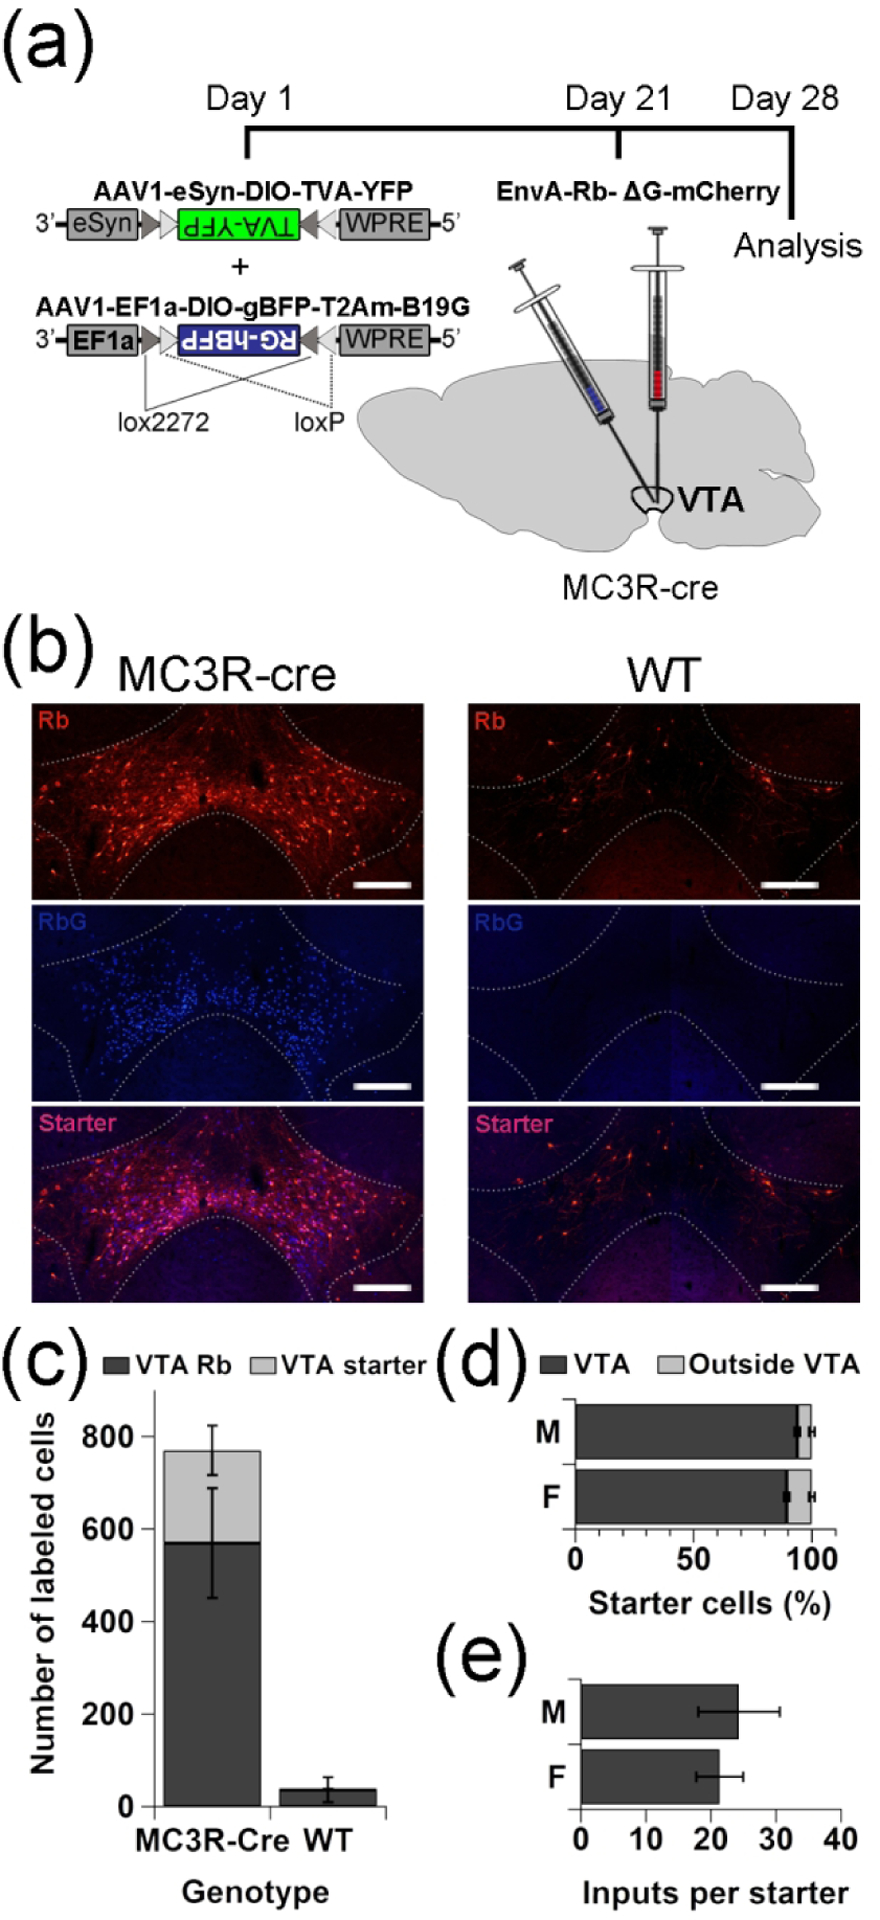
(a) Schematic illustrating the strategy used to achieve monosynaptic cell-type specific retrograde labeling of neurons providing synaptic input to VTA MC3R neurons. (b) Representative images of mCherry, BFP, and merged images taken from coronal VTA sections of VTA MC3R-Cre (left panel) or wild type mice (WT, right panel) injected with helper AAVs and RVdG-mCherry. (c) Average numbers of VTA starter cells (RVdG-mCherry + rG-BFP; light grey) and neurons expressing RVdG-mCherry only (dark gray) in MC3R-Cre (n=6) and WT mice (n=2). (d) Percent starter cells within (dark gray) or outside (light gray) the VTA in male and female MC3R-Cre mice (n=6: 3 males, 3 females). (e) Ratio of the total number of RVdG-mCherry-labeled neurons in the entire brain to the number of starter neurons in male and female MC3R-Cre mice (n=6: 3 males, 3 females). There were no sex differences in the input/starter ratio (p=0.71). Scale bars: 100 μm.
The specificity of the RVdG has been previously validated (Faget et al., 2016), but we wanted to confirm its specificity in our system as well. The AAV helper viruses expressing Cre-dependent TVA-eYFP and rG-BFP were injected into the VTA of WT mice (n=2) 3 weeks before the RVdG injection (n=2) and brains were harvested 1 week later. A small number of mCherry-labeled neurons were observed in the VTA of control animals (Figure 6b, c) consistent with the small amount of Cre-independent TVA expression reported previously (Faget et al., 2016; Watabe-Uchida, Zhu, Ogawa, Vamanrao, & Uchida, 2012). No cells expressing BFP were observed in the VTA, however, (Figure 6b, c, blue channel) and no RVdG-mCherry labeled neurons were identified outside the VTA, confirming that all RVdG labeled neurons identified in MC3R-Cre mice provide direct input to VTA MC3R neurons. We also confirmed that the injections were restricted to the VTA to exclude the possibility that RVdG-mCherry labeled neurons project to MC3R-expressing neurons outside the VTA. Greater than 88% of starter cells, defined as cells expressing both mCherry and BFP, were located in the VTA in both male and female mice (Figure 6d). Off-target starter cells represented less than 12% of all starter cells and most often were located in the Edinger–Westphal nucleus, red nucleus, substantia nigra pars compacta, MRN, and RRF, which are all immediately adjacent to the VTA, with no more than 10 cells per off-target site and most sites showing only 1–4 starter neurons. Although we initially analyzed all data by sex, there were no sex differences in the number of inputs per starter (Figure 6e), total inputs (data not shown), or inputs from individual brain regions (data not shown). As a result, the data from both sexes were combined for the remainder of the analyses.
The number of RVdG-mCherry labeled cells normalized to the number of VTA starter cells in brain regions providing more than 0.25% of the total number of RVdG labeled cells identified are shown in Figure 7, and a whole-brain series of representative coronal sections containing RVdG-mCherry-labeled cells is shown in Figure 8. In addition, the absolute and starter cell normalized numbers of RVdG labeled neurons in each brain region across the entire brain are presented in Table 1. Although RVdG-mCherry labeled non-starter cells (i.e. mCherry-positive, BFP-negative) were observed in the VTA, we excluded the VTA from the total input cell count because the cells expressing low levels of TVA may have been directly infected by RVdG and, as a result, could not be distinguished from those providing local input to VTA MC3R neurons. The greatest number of retrogradely labeled neurons were seen in the DR, LH, VP, NAcc, LPB, LHb, superior colliculus (SC), and median raphe nucleus (MnR) (Figure 7–9). Together, these top eight brain regions were responsible for ~46% of the total input to VTA MC3R neurons, and examples from each of these brain regions are shown in Figure 9. The distributions of cells providing afferent input to VTA MC3R neurons are described in more detail below.
Figure 7. RVdG-mCherry labeled inputs to VTA MC3R neurons across the brain.
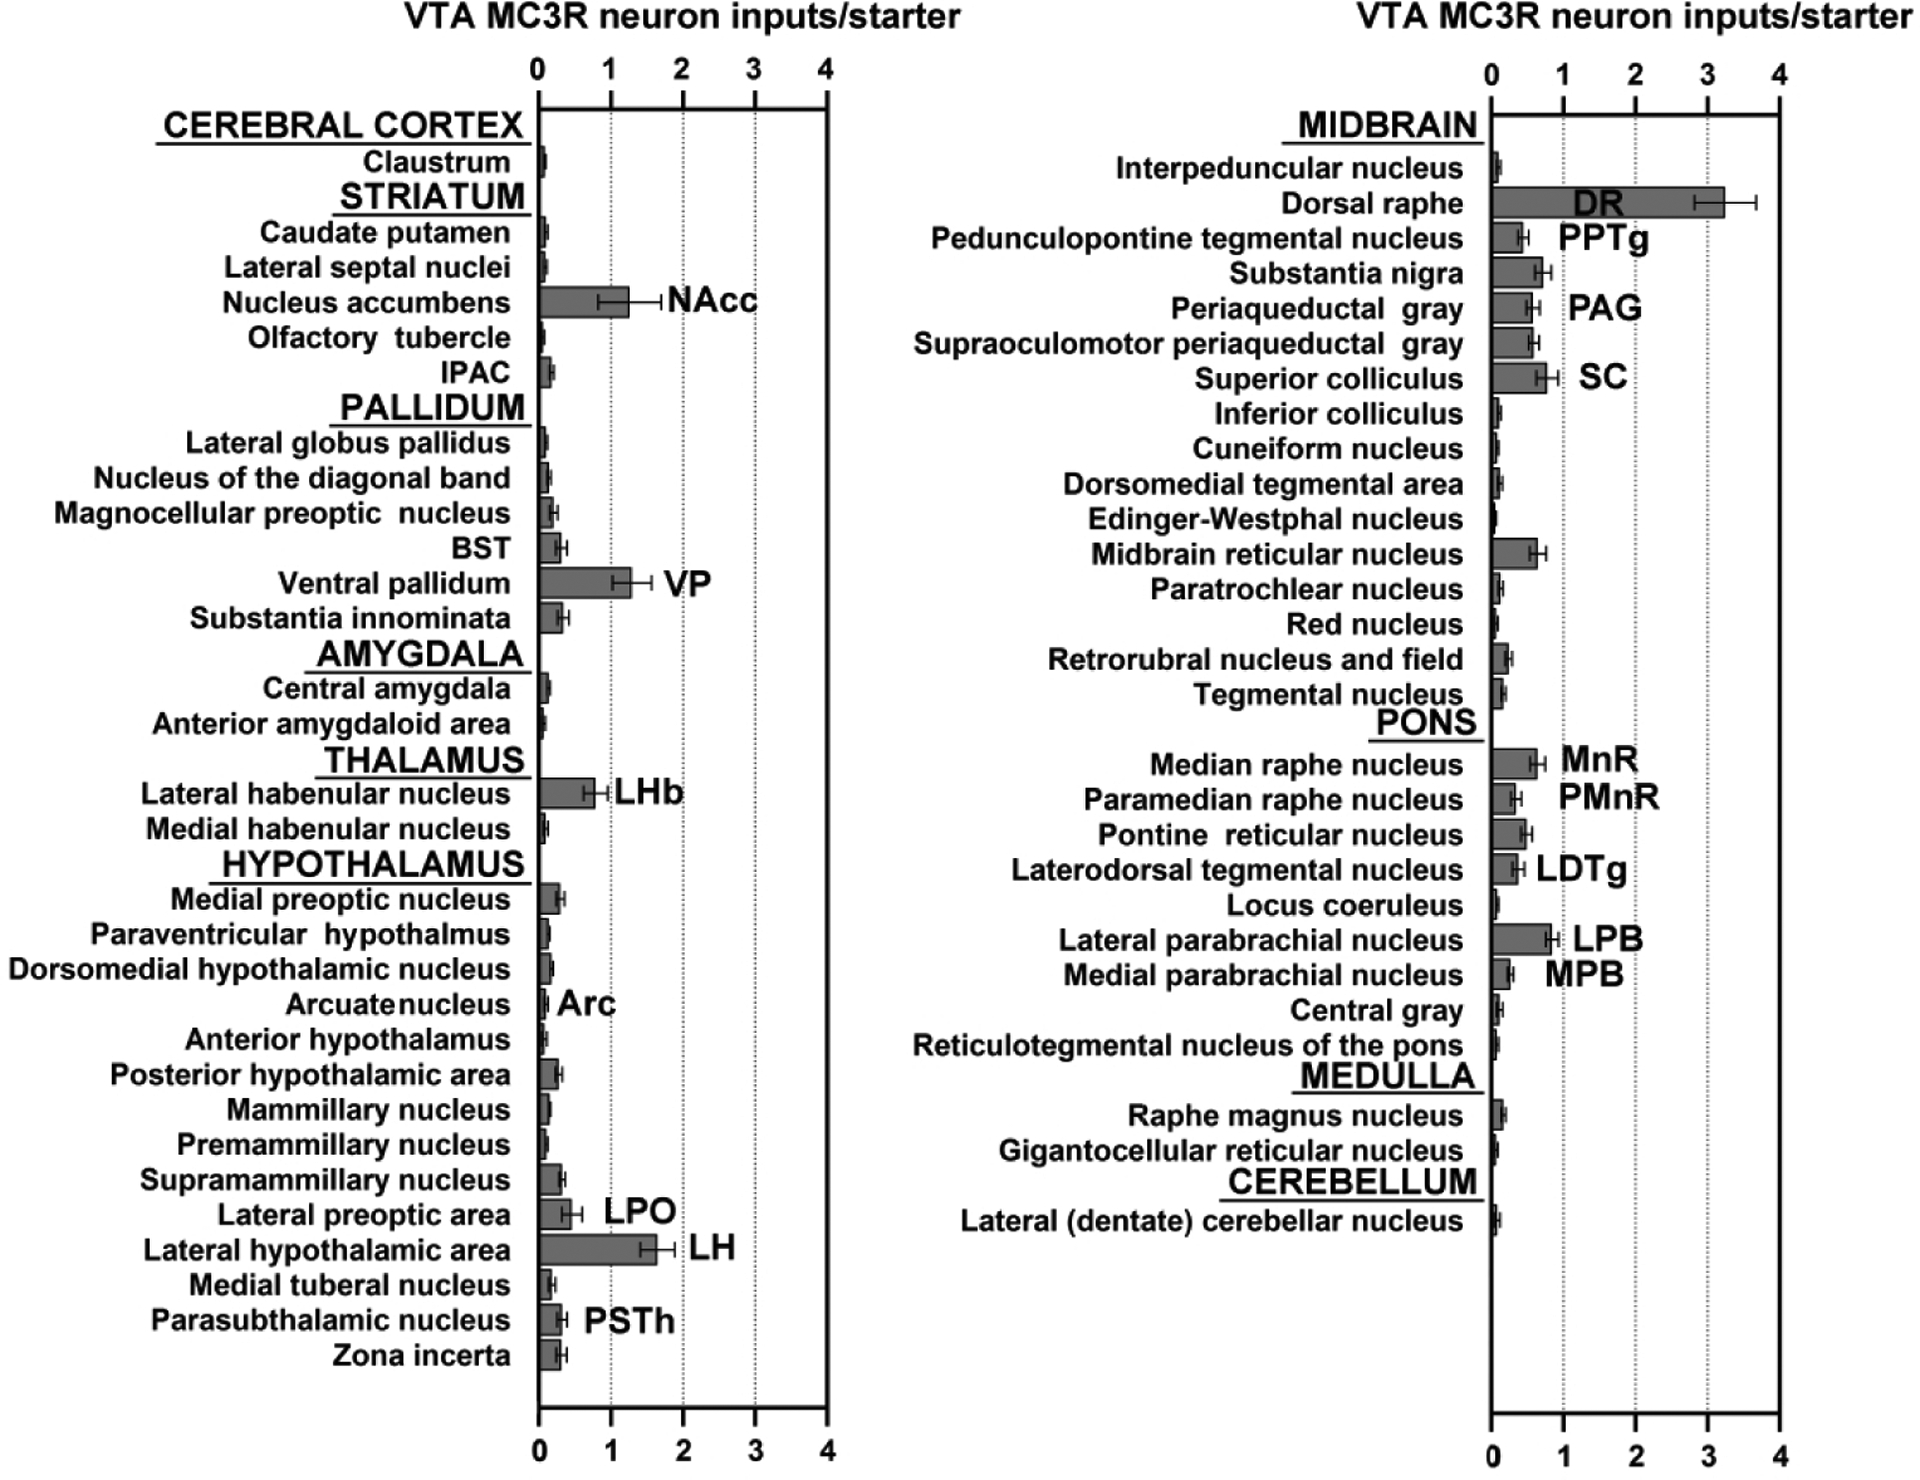
Average number of RVdG-mCherry-labeled neurons in different brain regions of male and female MC3R-Cre mice normalized to the total number of starter cells. Only the regions providing >0.25% of total input are shown. n=6 (3 males, 3 females).
Figure 8. Sample whole-brain series of coronal images showing RVdG-mCherry labeled neurons providing afferent input to VTA MC3R neurons.
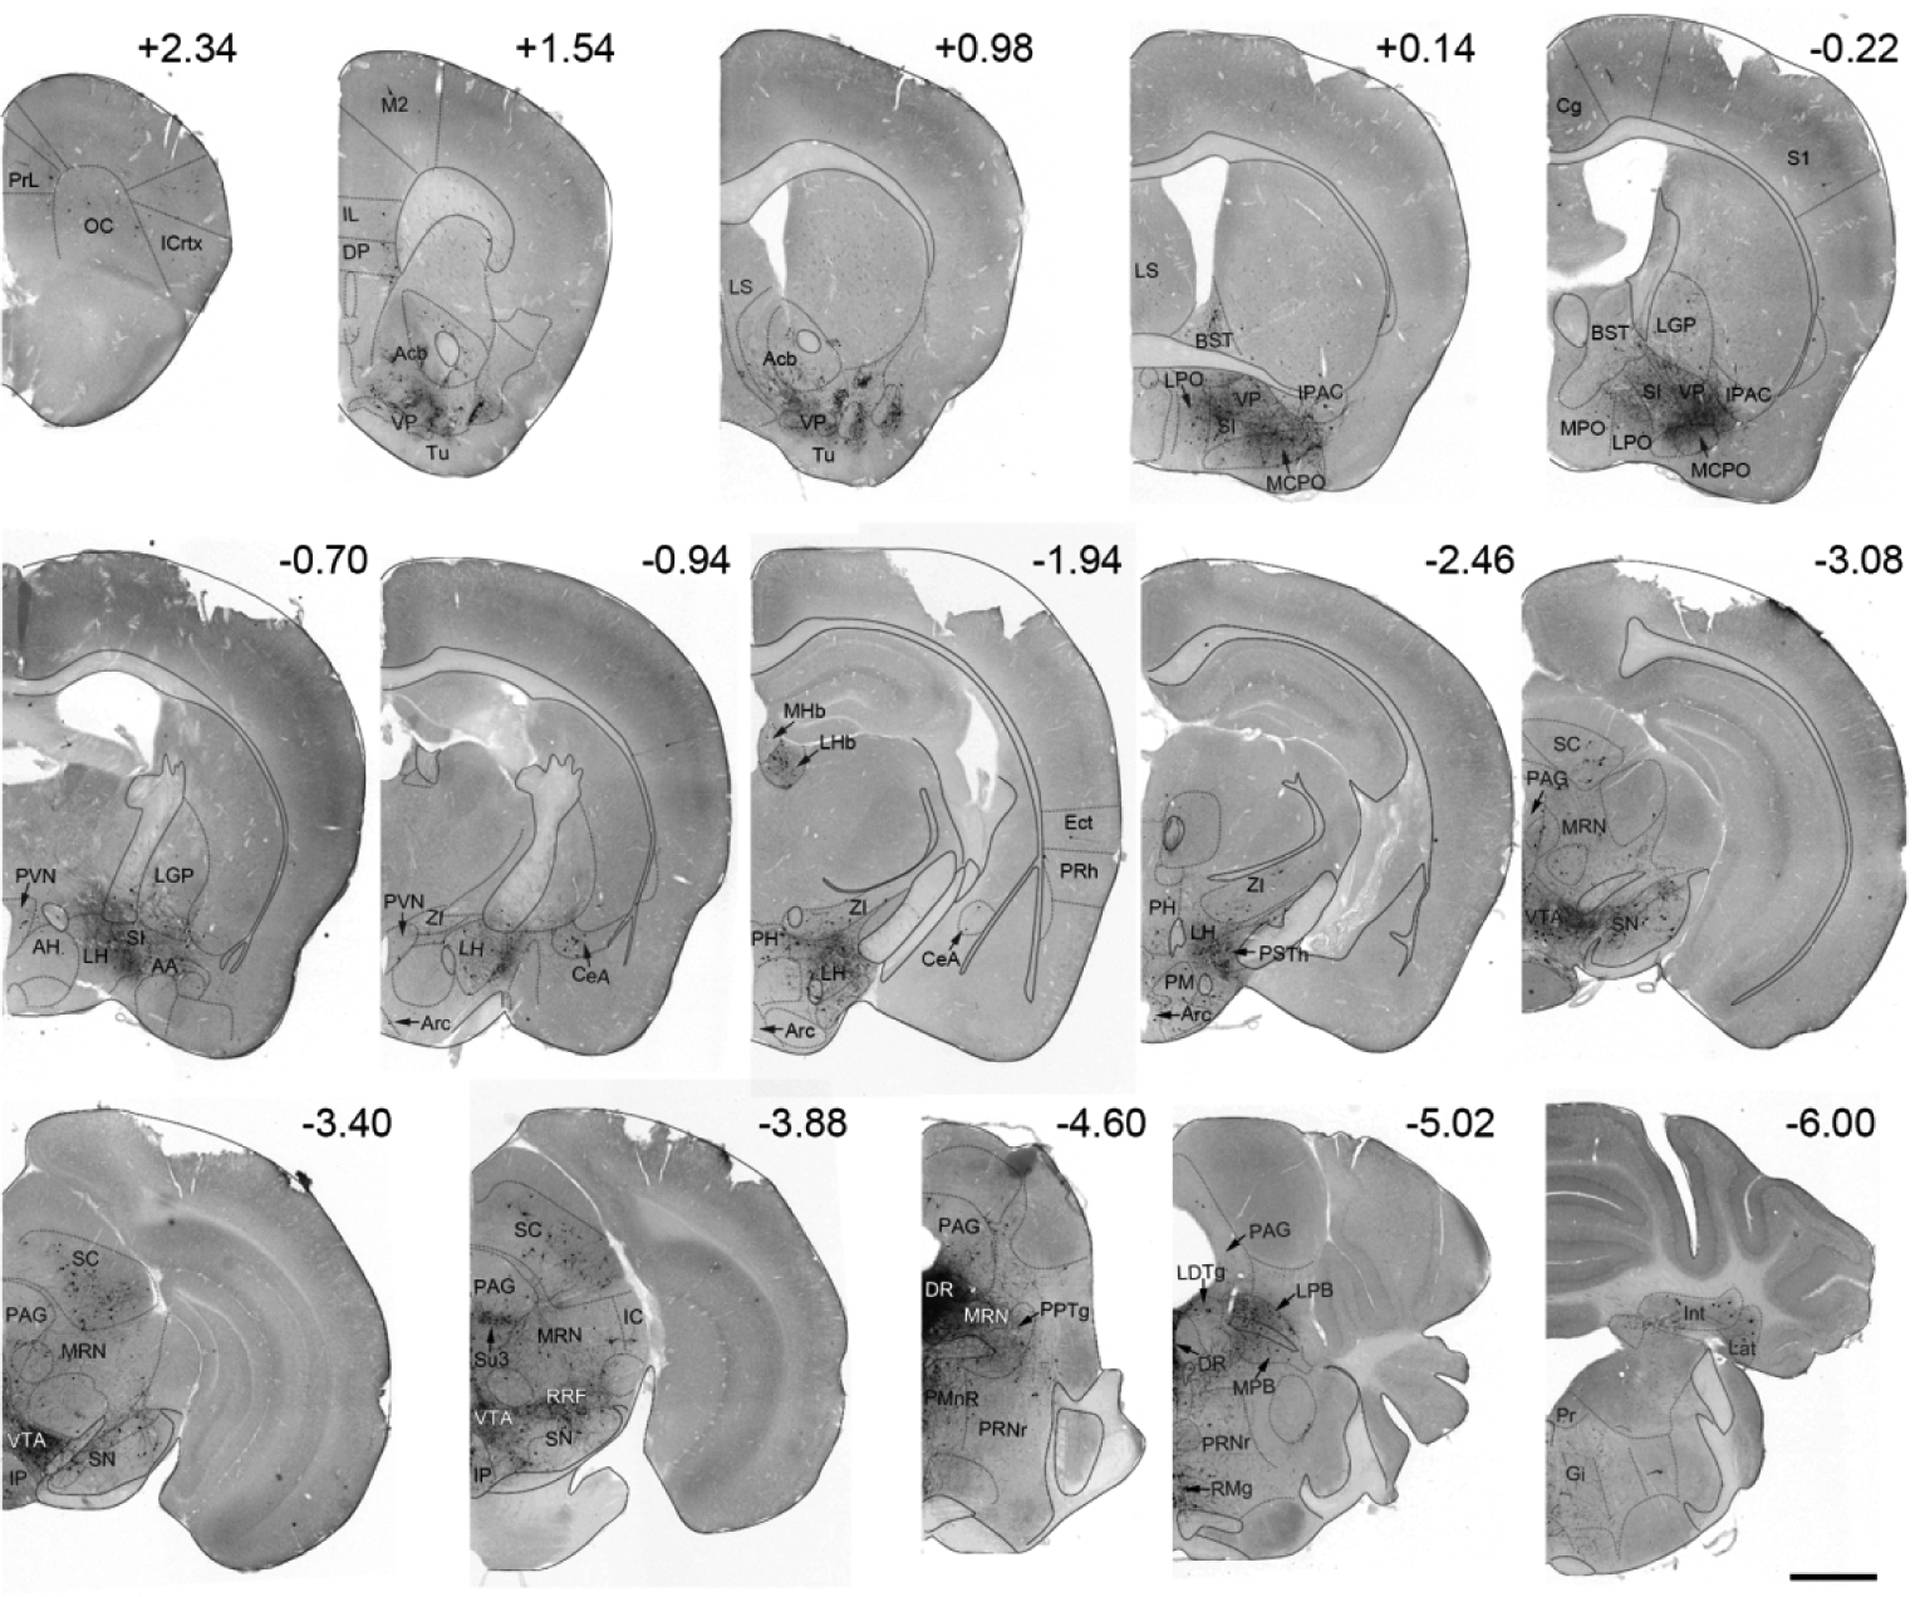
Representative whole-brain coronal sections showing RVdG-mCherry-labeled neurons (black) in different brain regions of a MC3R-Cre mouse. Brains sections are outlined with dotted lines and fiber tracts are outlined with solid lines. Numbers above sections indicate its position relative to bregma. Scale bar: 1 mm. Abbreviations: AA- anterior amygdaloid area, DP- dorsal peduncular cortex, Ect- ectorhinal cortex, Gi- gigantocellular reticular nucleus, IC- inferior colliculus, Icrtx- insular cortex, IL- infralimbic cortex, Int- interposed cerebellar nucleus, IP- interpeduncular nucleus, Lat- lateral (dentate) cerebellar nucleus, LGP- lateral globus pallidus, M2- motor cortex, MPO- medial preoptic area, OC- orbital cortex, PH- posterior hypothalamic area, PM- premammillary nucleus, PMnR- paramedian raphe nucleus, Pr- prepositus nucleus, PRh- perirhinal cortex, PrL- prelimbic cortex, PRNr- pontine reticular nucleus, RMg- raphe magnus nucleus, RRF- retrorubral field, S1- somatosensory cortex, Su3- supraoculomotor periaqueductal gray.
Table 1:
Number of RVdG-labeled neurons across the entire brain.
| Brain area | RVdG |
|---|---|
| Cerebral cortex | |
| Field CA3 of hippocampus | − |
| Retrosplenial cortex | + |
| Motor cortex | + |
| Somatosensory cortex | + |
| Secondary visual cortex | − |
| Secondary auditory cortex | − |
| Medial parietal association cortex | − |
| Insular cortex | + |
| Ectorhinal cortex | + |
| Perirhinal cortex | + |
| Temporal association cortex | − |
| Cingulate cortex | + |
| Prelimbic cortex | + |
| Infralimbic cortex | + |
| Orbital cortex | + |
| Anterior olfactory nucleus | − |
| Dorsal peduncular cortex | + |
| Dorsal tenia tecta | + |
| Nucleus of the lateral olfactory tract | + |
| Piriform cortex | + |
| Claustrum | + |
| Endopiriform nucleus | + |
| Striatum | |
| Caudate putamen | + |
| Lateral septal nuclei | + |
| Septofimbrial nucleus | − |
| Septohippocampal nucleus | − |
| Nucleus accumbens | +++++ |
| Olfactory tubercle | + |
| Lateral stripe of the striatum | − |
| IP AC | ++ |
| Pallidum | |
| Medial globus pallidus | + |
| Lateral globus pallidus | + |
| Medial septal nucleus | + |
| Nucleus of the diagonal band | + |
| Triangular septal nucleus | − |
| Magnocellular preoptic nucleus | ++ |
| BST | ++ |
| Ventral pallidum | +++++ |
| Substantia innominata | ++ |
| Amygdala | |
| Central amygdala | ++ |
| Medial amygdala | + |
| Basomedial amygdala | + |
| Basolateral amygdala | + |
| Cortical amygdalar area | + |
| Anterior amygdaloid area | + |
| Intercalated amygdaloid nucleus | − |
| Amygdalostriatal transition area | − |
| Thalamus | |
| Lateral habenular nucleus | ++++ |
| Medial habenular nucleus | + |
| Ethmoid thalamic nucleus | + |
| Retroethmoid nucleus | − |
| Suprageniculate thalamic nucleus | − |
| Anterior group of the dorsal thalamus | − |
| Mediodorsal thalamic nucleus | − |
| Submedius thalamic nucleus | − |
| Paratenial thalamic nucleus | + |
| Paraventricular thalamic nucleus | + |
| Reuniens thalamic nucleus | + |
| Parafascicular thalamic nucleus | + |
| Posterior intralaminar thalamic nucleus | − |
| Reticular thalamic nucleus | + |
| Ventromedial thalamic nucleus | + |
| Subparafascicular thalamic nucleus | + |
| Peripeduncular nucleus | + |
| Geniculate thalamic group | + |
| Hypothalamus | |
| A14 dopamine cells | − |
| Anterior commissural nucleus | + |
| Anterodorsal preoptic nucleus | + |
| Median preoptic nucleus | − |
| Parastrial nucleus | + |
| Ventrolateral preoptic nucleus | + |
| Ventromedial preoptic nucleus | − |
| Medial preoptic nucleus | ++ |
| Supraoptic nucleus | + |
| Paraventricular hypothalamic nucleus | ++ |
| Periventricular hypothalamic nucleus | + |
| Vascular organ of the lamina terminalis | + |
| Suprachiasmatic nucleus | − |
| Dorsomedial hypothalamic nucleus | ++ |
| Arcuate hypothalamic nucleus | + |
| Anterior hypothalamus | + |
| Ventromedial hypothalamic nucleus | + |
| Tuberomammillary nucleus | + |
| Posterior hypothalamic area | ++ |
| Mammillary nucleus | ++ |
| Premammillary nucleus | + |
| Supramammillary nucleus | ++ |
| Lateral preoptic area | +++ |
| Lateral hypothalamic area | +++++ |
| Medial tuberal nucleus | ++ |
| Parasubthalamic nucleus | ++ |
| Subthalamic nucleus | + |
| Zona incerta | ++ |
| Midbrain | |
| Interpeduncular nucleus | + |
| Dorsal raphe | +++++ |
| Pedunculopontine tegmental nucleus | ++ |
| Substantia nigra | +++ |
| Interstitial nucleus of Cajal | + |
| Nucleus of Darkschewitsch | + |
| Periaqueductal gray | +++ |
| Precommissural nucleus | − |
| Supraoculomotor periaqueductal gray | +++ |
| Anterior pretectal nucleus | + |
| Nucleus of the posterior commissure | + |
| Posterior pretectal nucleus | − |
| Retroparafascicular nucleus | − |
| Superior colliculus | ++++ |
| Inferior colliculus | + |
| Cuneiform nucleus | + |
| Dorsal terminal nucleus of the accessory optic tract | + |
| Dorsomedial tegmental area | ++ |
| Edinger-Westphal nucleus | + |
| Intercollicular nucleus | + |
| Medial accessory oculomotor nucleus | − |
| Midbrain reticular nucleus | +++ |
| Oculomotor nucleus | + |
| Parabigeminal nucleus | − |
| Paratrochlear nucleus | + |
| Red nucleus | + |
| Retrorubral nucleus and field | ++ |
| Rostral interstitial nucleus of medial longitudinal fasciculus | |
| Tegmental nucleus | ++ |
| Sagulum nucleus | − |
| Pons | |
| Median raphe nucleus | +++ |
| Paramedian raphe nucleus | ++ |
| Pontine reticular nucleus | ++ |
| Laterodorsal tegmental nucleus | ++ |
| Locus coeruleus | + |
| Subcoeruleus nucleus | + |
| Lateral parabrachial nucleus | ++++ |
| Medial parabrachial nucleus | ++ |
| Barrington’s nucleus | + |
| Central gray | + |
| Dorsal tegmental nucleus | + |
| Intertrigeminal nucleus | − |
| Motor trigeminal nucleus | + |
| Posterodorsal tegmental nucleus | + |
| Reticulotegmental nucleus of the pons | + |
| Supratrigeminal nucleus | + |
| Koelliker-Fuse nucleus | + |
| Nucleus of lateral lemniscus | + |
| Periolivary region | − |
| Principal sensory trigeminal nucleus | + |
| Medulla | |
| Raphe magnus nucleus | ++ |
| Raphe pallidus nucleus | − |
| Facial nucleus | + |
| Gigantocellular reticular nucleus | + |
| Intermediate reticular nucleus | + |
| Paraabducens nucleus | − |
| Paragigantocellular nucleus | + |
| Parvicellular reticular nucleus | + |
| Prepositus nucleus | + |
| Rostroventrolateral reticular nucleus | − |
| Vestibular nuclei | + |
| Cerebellum | |
| Interposed cerebellar nucleus | + |
| Lateral (dentate) cerebellar nucleus | + |
| Medial (fastigial) cerebellar nucleus | − |
| Other | |
| Medial lemniscus | − |
| Medial longitudinal fasciculus | − |
| Decussation of the superior cerebellar peduncle | |
| Periventricular fiber system | − |
| Superior cerebellar peduncle | − |
| Cerebral peduncle | − |
| Dorsal fornix | − |
| Tectospinal tract | − |
| Commissure of the superior colliculus | + |
| Commissure of the inferior colliculus | + |
| Cingulum | + |
| Probst’s bundle | + |
| Internal capsule | + |
| Mammillothalamic tract | + |
Absolute and Starter cell normalized (in parentheses) cell counts: −− <1 (<0.005); + 1–26 (0.005–0.13); ++27–89 (0.13–0.44), +++90–153 (0.45–0.76), ++++154–218 (0.77–1.09); +++++219–564 (1.09–2.81).
Figure 9. Sample images of the major areas providing afferent input to VTA MC3R neurons.
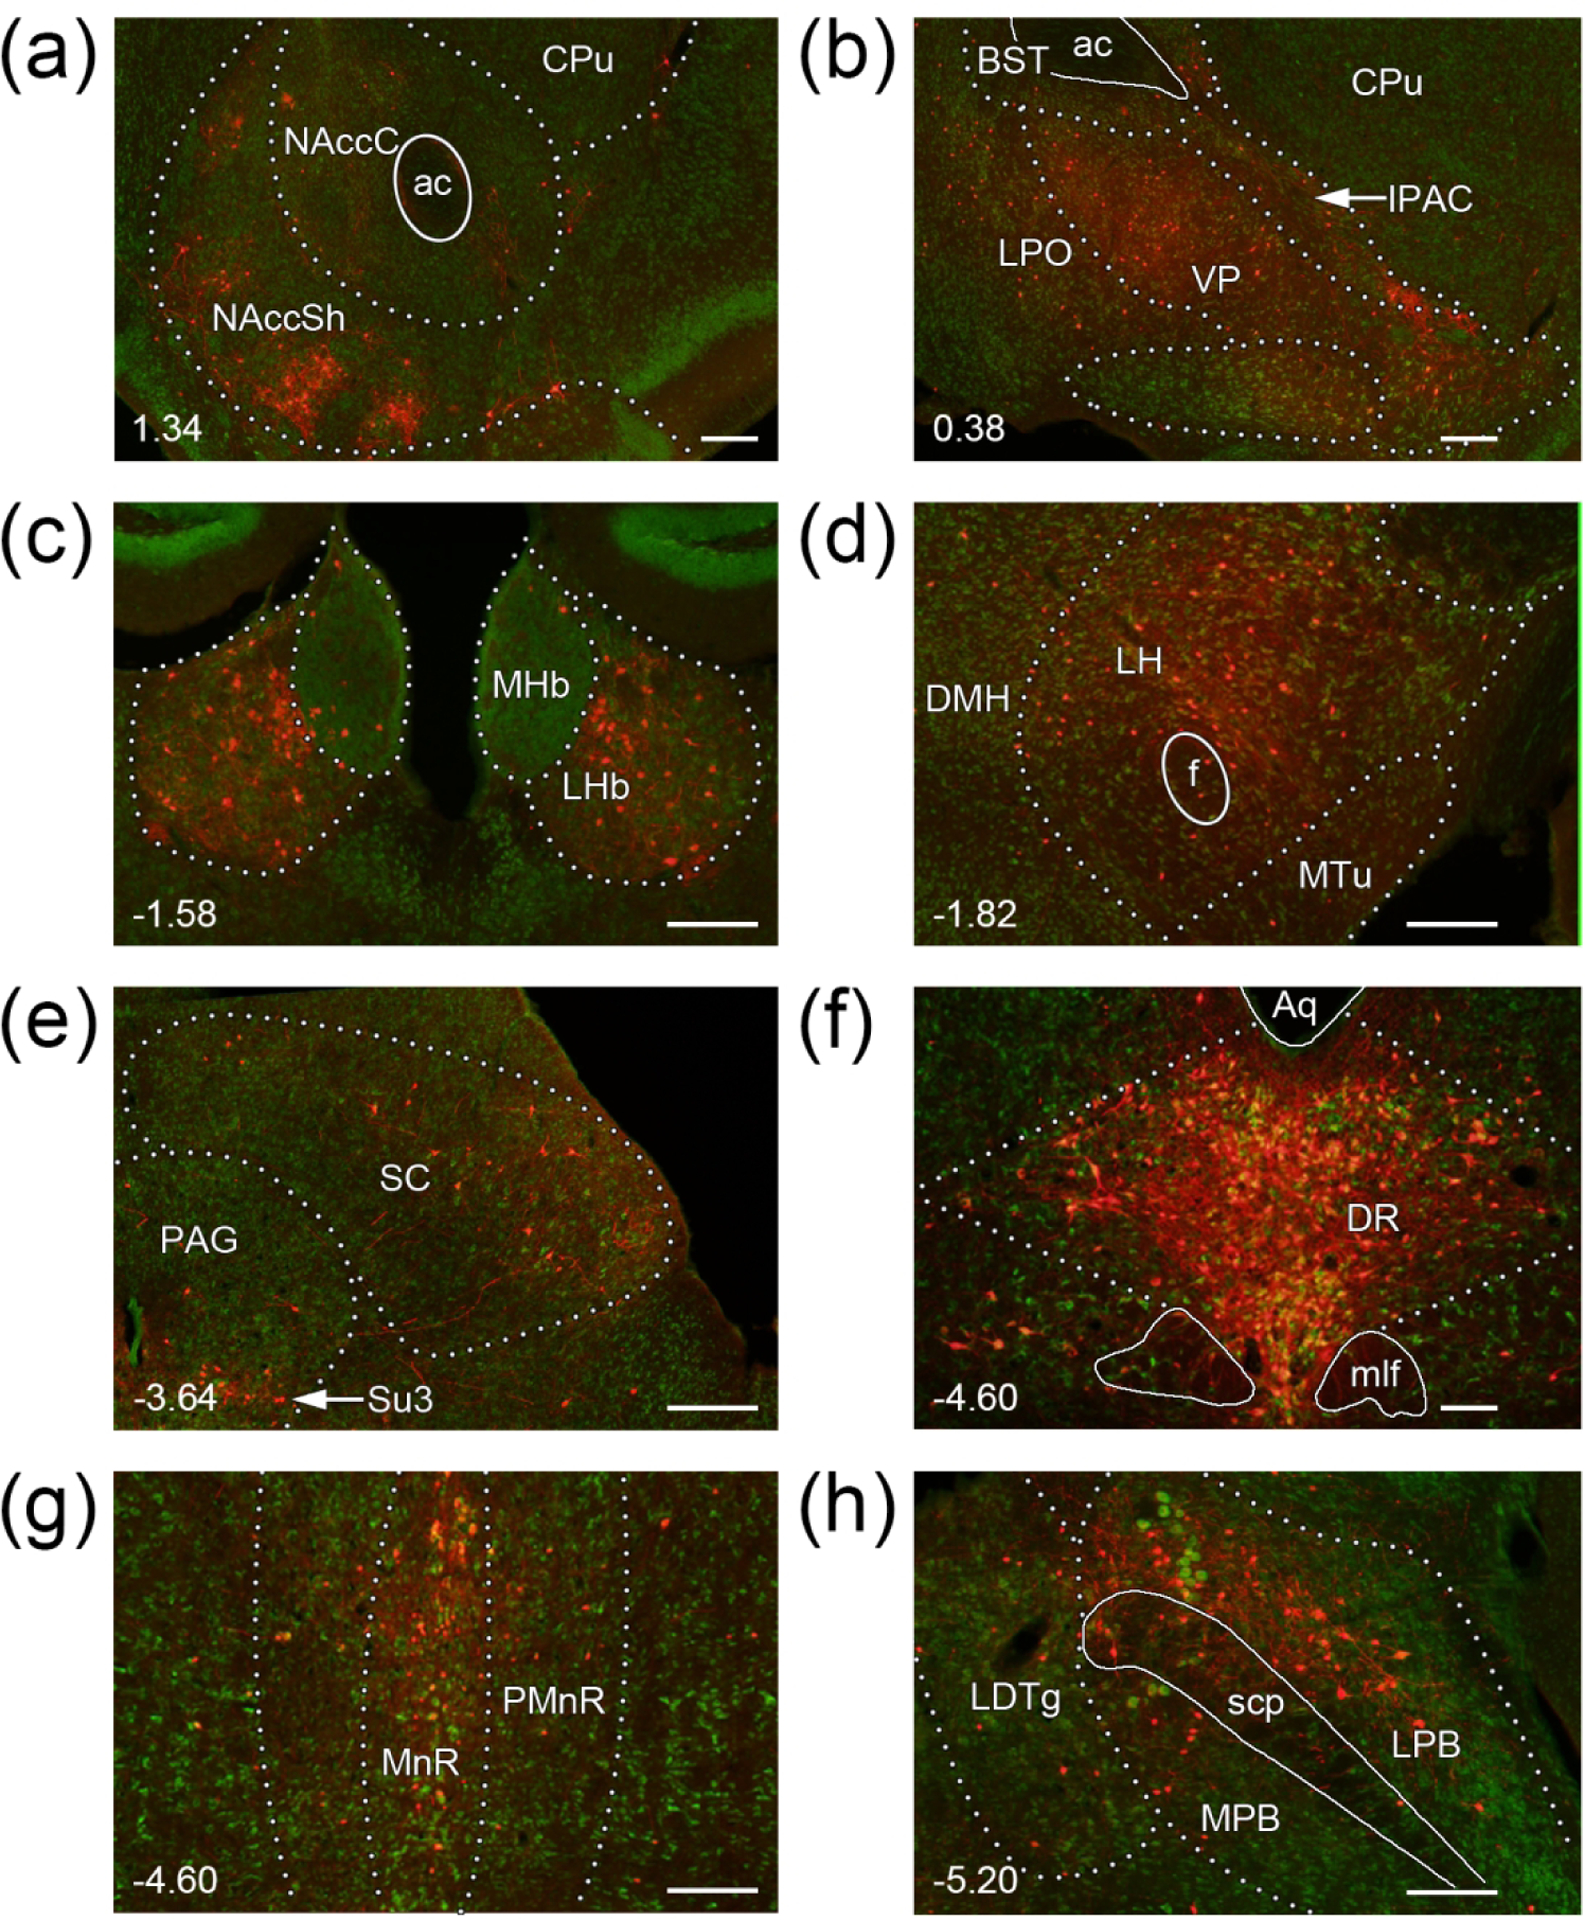
RVdG-mCherry labeled neurons are shown in red in coronal sections stained with NeuroTrace Nissl stain (green) (a) NAcc (b) VP and LPO. (c) LHb (d) LH. (e) SC and PAG. (f) DR. (g) MnR and PMnR. (h) PBN. Brain regions are outlined with dotted lines, and fiber tracts are outlined with continuous lines. Midline is to the left of the images for (a, b, d, e, h). Numbers at the bottom left corner indicate the section’s position relative to bregma. Scale bars: 100 μm. Abbreviations: DMH- dorsomedial hypothalamic nucleus, MTu- medial tuberal nucleus; fiber tracts and other structures: ac- anterior commissure, mlf- medial longitudinal fasciculus, scp- superior cerebellar peduncle.
Cerebral cortex and cerebellum.
The structures of the cerebral cortex and the cerebellum provided very sparse input to the VTA MC3R neurons (1.75%±0.12% and 0.47%±0.16 % of total input, respectively). All of the cortical and cerebellar nuclei containing RVdG-mCherry-labeled cells displayed scarce labeling, with fewer than 20 mCherry-labeled neurons per area (Figure 8, Table 1). A very small number of labeled neurons were present in the prefrontal cortex including the cingulate, prelimbic, infralimbic, and orbital cortices (Figure 8, Table 1). The very sparsely labeled olfactory areas included the anterior olfactory nucleus, dorsal peduncular cortex, dorsal tenia tecta, nucleus of the lateral olfactory tract, and piriform cortex. The single cortical nucleus with the greatest amount of retrogradely labeled neurons, although still very sparsely labeled, was the claustrum of the cortical subplate (Figure 8, Table 1). In the cerebellum, few cells were present in the cerebellar nuclei including the interposed, dentate, and fastigial nuclei (Figure 7–8, Table 1).
Striatum.
Striatal areas were responsible for 6.9% ± 1.2% of total input to the VTA MC3R neurons with most of the striatal input coming from the ventral striatum. NAcc was very highly populated with retrogradely labeled neurons which were highly concentrated and organized into patches within the mNAccSh. Conversely, the RVdG-mCherry labeling in the NAcc core and lateral shell was sparse (Figure 7–8, 9a, Table 1). The remaining nuclei of the ventral striatum including the Tu, the lateral stripe of the striatum, and the interstitial nucleus of the posterior limb of the anterior commissure (Figure 9b) provided very low to low amount of afferent input to VTA MC3R neurons (Figure 7–8, Table 1). The nuclei of the lateral septal complex including lateral septal nuclei, septofimbrial, and septohippocampal nuclei as well as the CPu (Figure 9a, b) of the dorsal striatum contained very few labeled neurons (Figure 7–8, Table 1)
Pallidum.
10.2% ± 0.9% of total afferent input to the VTA MC3R neurons came from the pallidum. Most of the pallidal input originated from the ventral division of the region. Within this division, VP was very highly populated with RVdG-mCherry+ neurons (Figure 9b), whereas the labeling within the other structures such as SI and the magnocellular preoptic nucleus was low (Figure 7–8, Table 1). The BST of the caudal pallidum also contained a low amount of RVdG-mCherry+ cells (Figure 9b) whereas the structures of dorsal pallidum such as the medial and lateral globus pallidus as well as those of the medial pallidum including medial septal nucleus, nucleus of the diagonal band, and the triangular septal nucleus contained very sparse labeling (Figure 7, Table 1).
Amygdala.
Structures of the amygdala and extended amygdala supplied very little input to the VTA MC3R neurons providing only 1.3% ± 0.1% of the total input. The CeA contained sparse RVdG-mCherry-labeled cells and was responsible for almost half of the amygdalar input to the VTA MC3R neurons (Figure 7–8, Table 1). Other amygdalar nuclei including the MeA, BLA, and BMA, as well as the anterior amygdaloid area, intercalated amygdaloid nucleus, and amygdalostriatal transition area contained very few retrogradely labeled neurons (Table 1).
Thalamus.
4.6% ± 0.5% of VTA MC3R input was supplied by the thalamus. Most of the afferent thalamic innervation of the VTA MC3R neurons came from the polymodal associated cortex related structures with the LHb containing the highest number of retrogradely labeled neurons of all thalamic structures (Figure 7–8, 9c, Table 1). Medial habenula (Figure 9c) as well as the other polymodal associated cortex related nuclei including the nuclei of the lateral, anterior, medial, midline, intralaminar thalamic groups, and the reticular thalamic nucleus contained very sparse RVdG-mCherry labeling (Figure 8, Table 1)
Hypothalamus.
Hypothalamic nuclei provided 21.2% ± 1.1% of the total VTA MC3R neuron input. We observed a lateral to medial gradient in the amount of hypothalamic input, with the most labeled neurons in the lateral zone and the fewest in the medial, periventricular zone. In the periventricular zone/region, sparse labeling was observed in the medial preoptic, paraventricular, and dorsomedial nuclei with very sparse labeling in the remaining nuclei (Figure 7–8, Table 1). To our surprise, but consistent with the lateromedial gradient, we found very few RVdG-mCherry-labeled cells in the Arc (Figure 7–8, Table 1). In the medial hypothalamic zone, weak RVdG-mCherry labeling was observed in the posterior hypothalamic area, the mammillary nucleus and very weak labeling was seen in the ventromedial hypothalamus, premammillary and the tuberomammillary nuclei (Figure 7–8, Table 1). In the lateral hypothalamic zone, LPO provided a moderate amount of input to the VTA MC3R neurons (Figure 7–8, 9b, Table 1). Very strong input to the VTA MC3R neurons came from LH (Figure 9d), whereas low numbers of retrogradely labeled neurons were present in the zona incerta, and PSTh with very sparse labeling in the subthalamic nucleus (Figure 7–8, Table 1).
Midbrain, Pons, and Medulla Oblongata.
Together, the midbrain and pons provided a little over half of all input (37.1% ± 2.9% and 15.0% ± 0.4%, respectively). In the midbrain, very high RVdG-mCherry labeling was present in the dorsal raphe (DR) which was the brain area providing the highest input to the VTA MC3R neurons (Figure 7–8, 9e, Table 1). The SN was moderately populated with RVdG-mCherry+ neurons with more abundant labeling in pars compacta than in pars reticulata (Figure 7–8, Table 1). The pedunculopontine tegmental nucleus (PPTg) and interpeduncular nucleus both displayed low/very low labeling, and the PAG including the supraoculomotor nucleus contained a moderate number of labeled neurons (Figure 7–8, 9f, Table 1). Many RVdG-mCherry+ cells were present in the SC, but only a few were present in the inferior colliculus (IC; Figure 7–8, 9f, Table 1). The MRN was moderately populated with retrogradely labeled neurons and low levels of labeled cells were seen in the RRF and the dorsomedial tegmental area (Figure 7–8, Table 1).
Most of the hindbrain input was derived from pons. The most prominent pontine input was from the LPB which contained many RVdG-mCherry+ neurons whereas the MPB was labeled sparsely (Figure 7–8, 9h, Table 1). MnR displayed moderate levels of labeling with low levels seen in the paramedian raphe (Figure 7, Figure 8, Figure 9g, Table 1). Low levels of RVdG-mCherry-labeled cells were also present throughout the pontine reticular nucleus and the LDTg, and very sparse labeling was present in the locus coeruleus (Figure 7–8, Table 1). Many other pontine areas contained sparse RVdG-mCherry labeling (Table 1), and a low amount of labeling was observed in the raphe magnus nucleus of the medulla oblondata with the remaining areas of the region labeled very sparsely labeled (Figure 8, Table 1).
Afferent Input from the Arcuate Nucleus to VTA MC3R Neurons
One surprising result of the analysis of the afferent inputs to VTA MC3R neurons was the near absence of RVdG-mCherry labeled neurons in the Arc, which contains POMC and AgRP neurons that would be expected to provide the ligands for MC3Rs (α-MSH and AgRP). Previous studies have shown that general retrograde tracers injected into the VTA label POMC neurons in the Arc (King & Hentges, 2011) and that AgRP axons are present in the VTA (Dietrich et al., 2012), however. Therefore, we conducted additional retrograde tracing experiments to further examine the potential projections from Arc POMC & AgRP neurons to the VTA. We initially injected the general retrograde tracer, RetroBeads, into the VTA of transgenic mice expressing GFP in NPY neurons (NPY-GFP mice) to confirm the previous reports that Arc POMC and AgRP neurons project to the VTA. POMC and AgRP neurons labeled with RetroBeads were identified using immunohistochemistry for POMC and GFP labeling in NPY/AgRP neurons. NPY-GFP was used to identify AgRP neurons because all AgRP neurons express NPY (Hahn, Breininger, Baskin, & Schwartz, 1998; Shutter et al., 1997) and AgRP neurons are difficult to identify using standard immunohistochemical techniques. Injection of fluorescent microspheres into the VTA resulted in 614 +/− 90 labeled neurons/mouse in the Arc (sampled from every 5th section) (Table 2), with NPY/AgRP neurons comprising 27.2 +/− 1.1% and POMC neurons comprising 12.5+/−1.0% of the total number of labeled neurons (Figure 10b, Table 2). There was a significant main effect of neuron cell type (F (2,14) =11.057, p=0.002) that was due to higher co-expression of RetroBeads with non-POMC, non-NPY/AgRP neurons (“other”) compared to POMC (p=0.001) or NPY/AgRP neurons (p=0.16), but no significant difference between the number of labeled POMC or NPY/AgRP (p=0.083, Figure 10b). Sample images of POMC and NPY/AgRP neurons containing RetroBeads are shown in Figure 10a1–a4. The larger number of NPY/AgRP neurons labeled by RetroBeads corresponded to the difference in the absolute number of NPY/AgRP and POMC neurons in the Arc. Fluorescent cell counts of NPY/AgRP and POMC neurons from the same sections determined that there were 2.4 times more NPY/AgRP neurons (2001 +− 338) compared to POMC neurons (822 +/− 39), with the POMC neuron count roughly matching the number of Arc POMC neurons previously reported (Cowley et al., 2001).
Table 2.
Number and percent of total Arc neurons labeled by RetroBeads and RVdG
| Genotype | # POMC†‡ | #NPY/AGRP†‡ | # OTHER†‡ | % POMC | % NPY/AgRP | % OTHER |
|---|---|---|---|---|---|---|
| RetroBeads (n=5) | 74 ± 9 | 165 ± 23 | 300 ± 54 | 12.5 ± 1.0 | 27.2 ± 1.1 | 51.9 ± 8.4 |
| MC3R-Cre (n=5) | 2 ± 1 (0.03 ± 0.01) | 0 (0) | 2 ± 1 (0.03 ± 0.01) | 54.3 ± 14.6 | 0.00 | 45.7 ± 14.6 |
| TH-Cre (n=6) | 4 ± 2 (0.02 ± 0.01) | 0 (0) | 5 ± 1 (0.03 ± 0.01) | 28.3 ± 11.5 | 2.4 ± 2.4 | 69.3 ± 11.5 |
| vGlut2-Cre (n=5) | 8 ± 3 (0.04 ± 0.01) | 1 ±1 (0.01 ± 0.01) | 18 ± 7 (0.06 ± 0.01) | 39.8 ± 10.9 | 7.7 ± 5.7 | 52.5 ± 8.9 |
| GAD-Cre (n=4) | 3 ± 1 (0.03 ± 0.01) | 1 ± 0 (0.00 ± 0.00) | 7 ± 2 (0.07 ± 0.02) | 29.4 ± 5.1 | 3.1 ± 1.8 | 67.4 ± 4.2 |
Retrobead labeled neurons were counted in every 5th Arc section, whereas RVdG-mCherry labeled neurons were counted in every other Arc section.
Numbers in parentheses provide number of labeled cells normalized to starter cells in the VTA.
Figure 10. Arc POMC and AgRP neurons project to the VTA but form few direct synapses with any of the major VTA neuron subtypes.
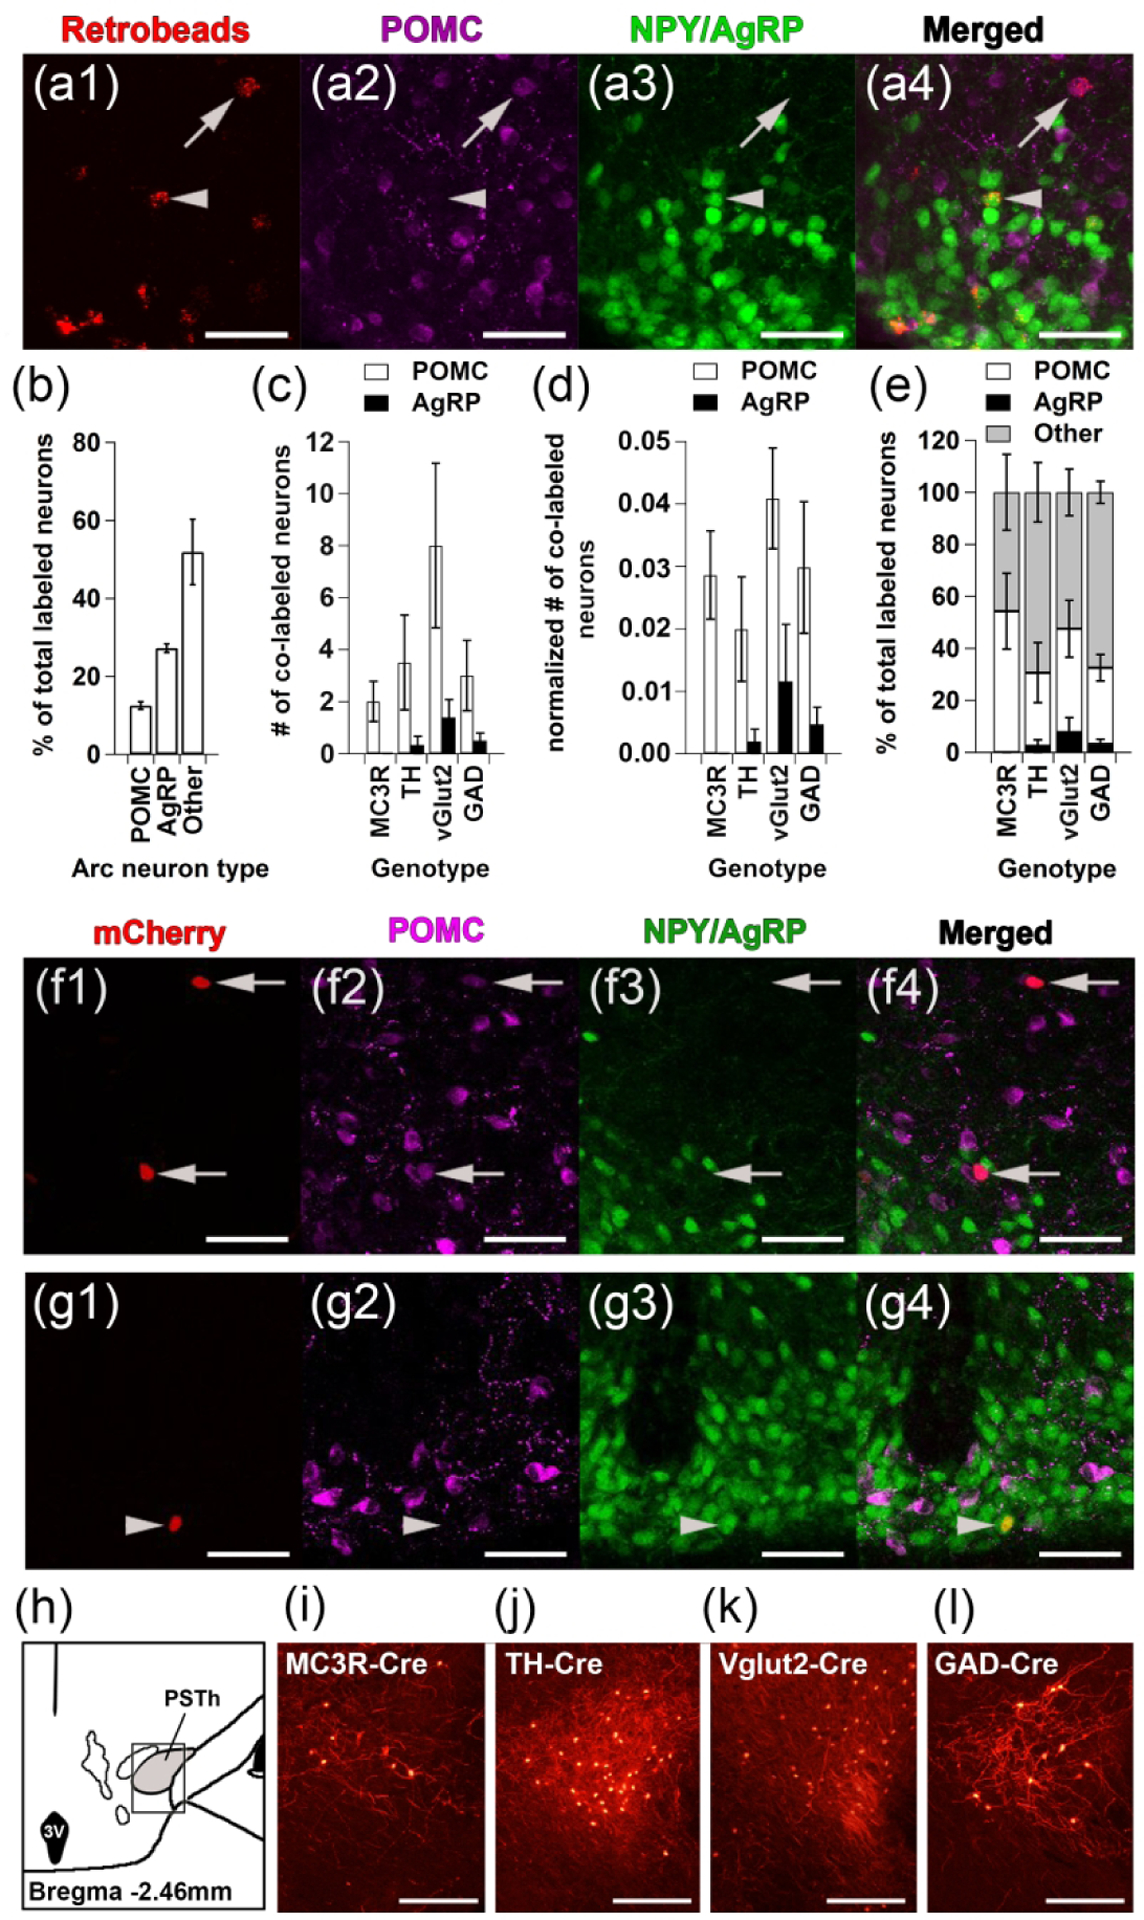
(a-b) Arc POMC and AgRP neurons were labeled by RetroBeads injected into the VTA. (a1-a4) Representative images showing Retrobead-labeled POMC and NPY/AgRP neurons: (a1) RetroBeads (red), (a2) POMC (magenta), (a3) NPY/AgRP (green), and (a4) merged images. Arrow indicates a RetroBead- labeled POMC neuron and arrowhead indicates a RetroBead-labeled NPY/AgRP neuron. (b) Percent of total RetroBead-labeled Arc neurons that were POMC, NPY/AgRP, or non-POMC, non-NPY/AgRP (‘other’) neurons (n=5: 3 males, 2 females). The cell counts were obtained from every 5th Arc section. (c-d) Absolute total number (c) and starter cell normalized number (d) of POMC (white) or NPY/AgRP (black) neurons labeled by RVdG injected into the VTA of MC3R-Cre (n=5: 3 males, 2 females), TH-Cre (n=6: 2 males, 4 females), vGlut2-Cre (n=5: 4 males, 1 female), and GAD-Cre (n=4: 2 males, 2 females) mice. Arc cell counts were obtained from every other section whereas starter cell counts were obtained from every 5th VTA section. (e) Percent of total POMC (white), NPY/AgRP (black), or other (gray) Arc neurons labeled by RVdG-mCherry from VTA MC3R, TH, vGlut2, or GAD neurons. Error bars for each cell type are at the top of each bar. (f-g) Representative Arc images of sections from a vGlut2-Cre (f) or TH-Cre (g) mouse: (f1, g1) RVdG-mCherry, (f2, g2) POMC, (f3, g3) NPY/AgRP, (f4, g4) Merged images. Arrows indicate a RVdG-labeled POMC neuron and arrowhead indicates a RVdG-labeled AgRP neuron. (h-l) Confirmation of functional tracing by RVdG in the PSTh. (h) Atlas section showing the location of PSTh images (box). (i-l) Sample images of the PSTh in sections from (i) MC3R-Cre, (j) TH-Cre, (k) vGlut2-Cre, and (l) GAD-Cre mice. Scale bars: 50 μm (a,f,g) and 100 μm (i-l).
The lack of RVdG-labeled neurons in the Arc following RVdG injection into the VTA of MC3R-Cre mice combined with the robust labeling of POMC and AgRP neurons by RetroBeads injected to the VTA raised the possibility that POMC and AgRP neurons could synapse onto other VTA neuron subpopulations. Thus, we utilized RVdG to test whether POMC or AgRP neurons synapse onto MC3R, dopamine (DA), GABA, or glutamate neurons in the VTA using MC3R-Cre, TH-Cre (DA), GAD-Cre (GABA), or vGlut2-Cre (glutamate) mice. Each of the mouse lines was crossed to NPY-GFP mice to visualize both NPY/AgRP and POMC (using IHC) neurons within the same brain sections. Male and female mice of each genotype were injected with the helper AAVs expressing TVA and RG-BFP, followed by RVdG as described for the whole-brain input mapping experiments (Figure 6a), and coronal sections containing the VTA and Arc were collected. The VTA sections were used to confirm correct injection location and to count the total number of starter cells in each mouse (done in in every 5th section). RVdG-mCherry, POMC and NPY/AgRP neurons were counted in every other Arc section (Figure 10f–g) and the PSTh, which is located within the same sections containing the Arc and has been shown to provide input to all of these populations of VTA neurons (Faget et al., 2016), was used as a positive control to confirm functional tracing by RVdG (Figure 10h–l). Analysis of the absolute total number of labeled neurons in the different genotypes examined revealed a significant main effect of genotype (F (3,48) =4.115, p=0.011) due to higher Arc RVdG-mCherry labeling in the neurons retrogradely traced from vGlut2 neurons compared to other VTA neuron groups (p=0.002 vs MC3R, p=0.009 vs TH, p=0.036 vs GAD), which was no longer significant when the number of RVdG labeled cells was normalized to the number of starter cells in the VTA. Although POMC neurons in the Arc were labeled by RVdG-mCherry in all genotypes tested and NPY/AgRP neurons were labeled in both vGlut2-Cre and GAD-Cre mice, there were very few labeled POMC or NPY/AgRP neurons observed (Figure 10c, d, f-g, Table 2). Overall, only ~2–8 POMC and 0–2 NPY/AgRP neurons were labeled across all of the Arc sections examined (Figure 10c–e, Table 2). And in contrast to the data obtained with the fluorescent microspheres, slightly more of the RVdG labeled neurons co-localized with POMC vs NPY/AgRP neurons for all genotypes examined (Figure 10c–e, Table 2). There was a significant main effect of cell type (F (2, 48) =7.002, p=0.002) with fewer NPY/AgRP neurons co-expressing RVdG-mCherrry compared to non-POMC, non-NPY/AgRP (‘other’) neurons (p=0.001) but there were no differences in the number of POMC or NPY/AgRP neurons labeled with RVdG-mCherry (p=0.051). Thus, it appears that although POMC and AgRP neurons project to the VTA, few of them form direct synapses onto VTA neurons, suggesting that Arc POMC and AgRP neurons may predominantly release their neuropeptides extra-synaptically within the VTA.
4. Discussion
In these studies, we have defined the efferent projection patterns of VTA MC3R neurons, and we have identified the location of neurons providing afferent input to these cells. We have also demonstrated that POMC and AgRP neurons in the Arc form few direct synapses (as identified by RVdG tracing) onto any of the major neuron subtypes in the VTA, including VTA MC3R neurons, despite the robust labeling of POMC, AgRP, and other undefined Arc neurons after injection of general retrograde tracers into the VTA. The results of these studies defining the anatomy of VTA MC3R neurons provide valuable information, as these neurons are likely to be an important site of interaction between the melanocortin and mesolimbic dopamine systems in the neural control of feeding and body weight.
One of the most surprising and interesting results of these studies was the very low amount of direct synaptic input (as measured by RVdG labeling) from Arc POMC and AgRP neurons to any of the VTA neuron subtypes tested, including VTA MC3R neurons (Figure 7, 10c–f), despite the large number of Arc neurons labeled by RetroBeads injected into the VTA (Figure 10a–b, Table 2) and the previous identification of Arc POMC and AgRP neuron projections to the VTA (Dietrich et al., 2012; King & Hentges, 2011). This was also unexpected because Arc POMC and AgRP neurons release multiple neurotransmitters that would be expected to be released at classical direct synapses in the VTA. In addition to releasing the endogenous neuropeptide ligands for MC3Rs, α-MSH and AgRP, Arc POMC and AgRP neurons also release the classical fast neurotransmitters glutamate and GABA (Dicken, Tooker, & Hentges, 2012; Hentges, Otero-Corchon, Pennock, King, & Low, 2009; Horvath, Bechmann, Naftolin, Kalra, & Leranth, 1997), and this release is involved in the regulation of energy homeostasis (Krashes, Shah, Koda, & Lowell, 2013; Tong, Ye, Jones, Elmquist, & Lowell, 2008). Furthermore, synaptic release of GABA and glutamate from POMC and AgRP terminals has been observed in other brain regions, such as the PVN (Atasoy et al., 2014; Atasoy, Betley, Su, & Sternson, 2012; Krashes et al., 2014), and both POMC and AgRP neurons have been shown by electron microscopy to form direct synapses in the PVN (Atasoy et al., 2014), demonstrating that these neurons do form direct synapses in other parts of the brain. The low amount of synaptic connectivity observed in our experiments suggests that Arc POMC and AgRP neurons may not utilize GABA or glutamate transmission in the VTA due to the absence of direct synapses necessary for their transmission. Unlike glutamate and GABA, neuropeptide release may occur not only at a classical synapse but also at extra-synaptic release sites along the axon. Neuropeptides can then act near their release site or can travel over long distances to exert their effect on neurons far from the release site (i.e. volume transmission) (van den Pol, 2012; Zupanc, 1996). Based on the robust number of RetroBead-labeled cells in the Arc (Figure 10a–b, and (King & Hentges, 2011)) combined with the presence of AgRP terminals in close proximity to VTA TH neurons (Dietrich et al., 2012) and the low number of RVdG labeled cells observed, it appears that POMC and AgRP neurons likely utilize extra-synaptic neuropeptide transmission in the VTA. Neuropeptide release into the extracellular space along with its diffusion and the lack of reuptake machinery results in long extracellular half-life (Ludwig & Leng, 2006) which is consistent with the ability of α-MSH and AgRP to alter feeding for prolonged periods. This possibility is also supported by the previous demonstration that the majority of dense-core vesicles in POMC and AgRP neuron terminals in the PVN, which presumably contain α-MSH and AgRP for release, were located in extra-synaptic release sites (Atasoy et al., 2014). It is unclear whether α-MSH and AgRP are released from extra-synaptic release sites on axons traveling through the VTA on their way to other midbrain or hindbrain regions, or whether they are released from axons projecting directly to the VTA, however. Arc POMC and AgRP neurons have been shown to project to midbrain and hindbrain regions caudal to the VTA including the PAG, LDTg, PBN, and NTS, so it is possible that α-MSH and AgRP are released from these axons as they travel through the VTA on their way to more caudal regions. AgRP neurons have been reported to show little collateralization, however (Betley, Cao, Ritola, & Sternson, 2013), suggesting that direct projections to the VTA may be more likely. Further experiments will be necessary to better understand the exact anatomy, connections, and neurotransmitters released from POMC and AgRP neuron in the VTA, however.
Another important point that arises from these results is the potential under-representation of neuropeptide transmitting neurons in studies utilizing RVdG to identify inputs to specific neuronal populations. RVdG has been widely used to examine the afferent inputs to distinct neuronal populations in the brain. Thus, it appears that results from these prior studies should be interpreted carefully to allow for the likelihood that the labeled neurons only represent neurons providing direct, fast, classical neurotransmitter-mediated inputs and may exclude other neuropeptide containing neurons, although this will need to be examined on an individual basis.
In the VTA, MC3Rs are expressed in both dopamine and non-dopamine neurons (Lippert et al., 2014) and our experiments showed that VTA MC3R neurons receive input from and project to a wide variety of brain regions (Figure 1–2, 7–8), which roughly resembles the previously described circuit connectivity patterns of different populations of VTA neurons (Beier et al., 2015; Faget et al., 2016; Taylor et al., 2014; Watabe-Uchida et al., 2012; Yamaguchi et al., 2011), although we did observe a few differences. VTA DA, GABA, and glutamate neurons receive input from largely overlapping brain areas including the NAcc, PFC, VP, BST, LPO, LH, LHb, DR, PAG, LDTg, PPTg, and LPB, with some quantitative, but not qualitative differences in their inputs (Faget et al., 2016). Similarly, VTA MC3R neurons also received input from the aforementioned areas, although the inputs provided by the PFC and BST were very limited. Related to the efferent projections from the VTA, VTA GABA neurons project to PFC, NAcc, VP, MCPO, BST, CeA, LPO, LH and DR, whereas their projections to the LS are weak (Taylor et al., 2014). VTA MC3R neurons also projected to the NAcc, VP, BST, and LH, but, unlike VTA GABA neurons, VTA MC3R neuron axons robustly labeled the LS, whereas the axon labeling in the PFC, MCPO, LPO, and DR was mostly weak. In addition, within the amygdala, the BLp received the most input from VTA MC3R neurons, whereas the CeA receives the strongest input from VTA GABA neurons. There was also overlap in the projections of VTA MC3R neurons and dual dopamine/glutamate and glutamate only neurons. For example, VTA neurons co-expressing TH and vGlut2 have been shown to release both DA and glutamate in the NAcc (Hnasko et al., 2010; Stuber, Hnasko, Britt, Edwards, & Bonci, 2010), but also target the amygdala, VP/BST, and MCPO (Taylor et al., 2014), whereas ‘vGlut2-only’ neurons project to the VP, BST, MCPO, Tu (Taylor et al., 2014), and the parvalbumin-expressing neurons of NAcc (Qi et al., 2016). These projection patterns largely overlap with the projections of VTA MC3R neurons observed in our experiments. VTA MC3R neurons also sent projections to the LHb, which has been shown to receive input from ‘GABA-only’, ‘glutamate-only’, and the GABA/glutamate co-releasing VTA neurons (D. H. Root et al., 2014; Taylor et al., 2014). Thus, there is large overlap between the projections of VTA MC3R neurons with the other known VTA neuron subtypes, but there are some distinct differences as well. Some of these similarities and differences as well as potential physiological roles of these circuits are discussed in greater detail below.
VTA MC3R axons and retrogradely labeled neurons were concentrated in the medial aspects of the ventromedial striatum (Figure 3d) consistent with the ventromedial position of VTA MC3R neurons (Lippert et al., 2014; West et al., 2019) and the previously characterized mediolateral topographic organization of VTA neuron projections and inputs (Ikemoto, 2007; Yang et al., 2018). Overall, the brain regions providing input to VTA MC3R neurons were more widely distributed across the brain than the efferent projections of these cells, and some areas showed reciprocal connections, whereas other areas only received projections or provided input (Figure 11). For example, in the striatum, both the NAccSh and NAccC were reciprocally connected to the VTA MC3R neurons whereas the Tu and LSI only received input from VTA MC3R neurons. Some of the other reciprocally innervated brain regions of note were VP, CeA, LHb, PVN, LH, and SN. In contrast, the VTA MC3R neuron target areas which provided very little input back to the VTA MC3R included Tu, LSI, BST, SI, and BLA/BMA, whereas the LPO, DR, PAG, PPTg, SC, MnR, LDTg, LPB, and MPB provided more input to the VTA MC3R neurons than they received.
Figure 11. Summary of the major efferent projections targets and the areas providing afferent input to VTA MC3R neurons.
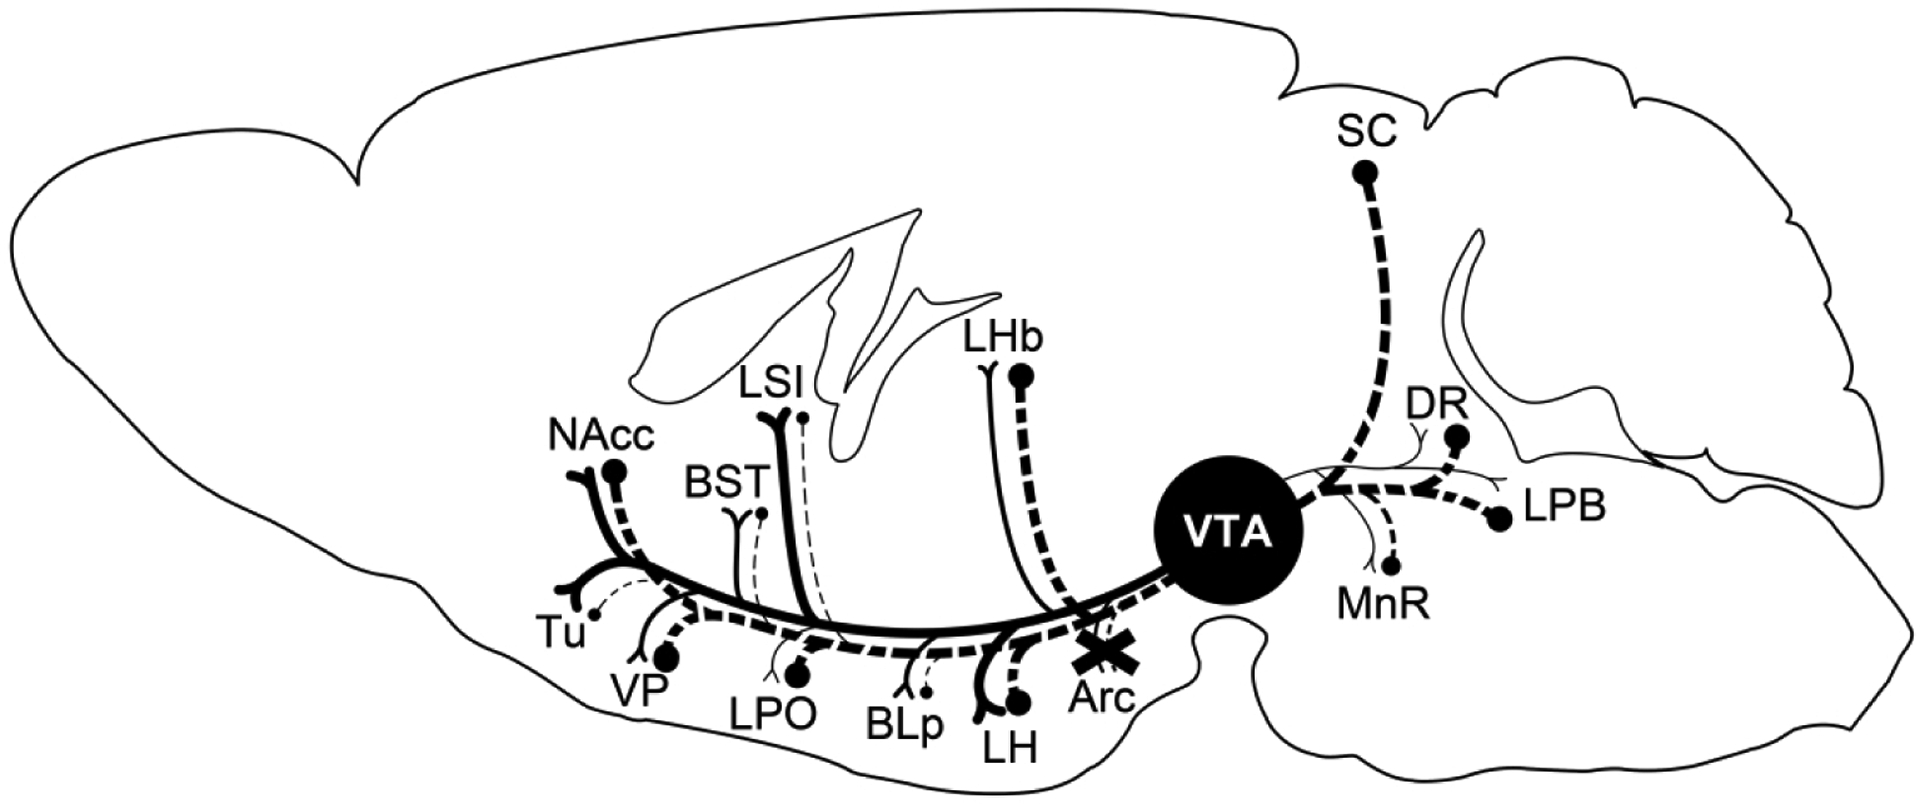
Solid lines represent efferent projections of the VTA MC3R neurons and dashed lines represent afferent input to VTA MC3R neurons. The thickness of the lines represents the relative amount of VTA MC3R projection axons or the number of neurons in the area providing input to VTA MC3R neurons. The “x” over Arc projections indicates the low afferent and efferent connectivity between Arc and the VTA.
There were a number of brain regions identified in these studies that were notable for either the presence or absence of efferent output from or afferent input to VTA MC3R neurons. The first notable finding was the near lack of labeling in the PFC. Although VTA MC3R neurons are present in all subnuclei of the VTA, they are highly concentrated in the ventromedial region including PN, IF, RLi, CLi (Figure 3a–c, 6b),(Lippert et al., 2014). Both the ventromedial location of the VTA MC3R neurons and their electrophysiological properties (West et al., 2019) are consistent with a unique population of medial neurons identified by Lammel, et al (Stephan Lammel et al., 2008) which project to the mPFC, NAcc medial shell and core, and basolateral amygdala. VTA MC3R neurons differed from the population identified by Lammel, et. al. (Stephan Lammel et al., 2008), however, in that their cortical projections were very sparse. And consistent with the low amount of cortical input to the VTA DA, glutamate, and GABA neurons reported previously (Faget et al., 2016), PFC input to the VTA MC3R neurons was also sparse (Table 1).
Another brain region that stood out, both in the amount of VTA MC3R axons present (Figure 2–4) and the reproducibility of their unique band-like appearance (Figure 3e) was the intermediate segment of LS. LS GABAergic neurons that project to the LH bidirectionally regulate food intake such that their activation inhibits feeding, whereas their inhibition increases feeding (Sweeney & Yang, 2016). Thus, VTA MC3R neurons could modulate these LS GABA neurons to regulate feeding, although this remains to be tested. The ventromedial location of the VTA MC3R neurons and the band-like appearance of their LSI projections appear to overlap with previously described VTA neural populations including a population of TH+ neurons co-expressing Neurogenic Differentiation Factor-6 (NEUROD6), transcription factor orthodenticle homeobox 2 (OTX2), CALBINDIN1, and aldehyde dehydrogenase 1a1 (ALDH1A1) (Khan et al., 2017; Poulin et al., 2018), as well as a population of TH+ neurons co-expressing CCK and another one co-expressing vGlut2 (Poulin et al., 2018). The potential molecular overlap between these neuronal populations with VTA MC3R neurons still needs to be established, but if confirmed, this could facilitate the study of LSI-projecting DA neurons.
VTA MC3R neuron axons and synaptophysin-positive puncta were identified in the LH (Figure 3–5) raising the possibility that, in addition to a potential indirect effect on the LH via the LS, VTA MC3R neurons may directly modulate LH neural circuitry and associated behaviors (Figure 2–5). Optogenetic stimulation of LH GABA neurons, including those projecting to the VTA, induces feeding and reward-associated behaviors (Barbano, Wang, Morales, & Wise, 2016; Jennings et al., 2015), whereas selective ablation of these neurons reduces feeding, body weight gain, and motivation to obtain palatable reward (Jennings et al., 2015) and stimulation of glutamatergic LH projections to the VTA results in conditioned place aversion (Nieh et al., 2016). The LH receives VTA GABAergic input, but little to no VTA glutamatergic input (Hnasko, Hjelmstad, Fields, & Edwards, 2012; Taylor et al., 2014) raising the possibility that VTA MC3R neurons could decrease feeding and food reward via direct inhibition of LH GABA neurons, including those projecting back to the VTA, as LH neurons also provided a strong reciprocal innervation to the VTA MC3R neurons (Figure 7–9). Future studies are required to understand the functional implication of the reciprocal connections between VTA MC3R neurons and the LH including the types of neurons that are interconnected between the two nuclei and the behaviors regulated by this network.
VTA MC3R neurons were also bidirectionally connected to the LHb (Figures 2, 7), raising the possibility that VTA MC3R neurons might participate in the regulation of aversive behaviors. LHb neurons are activated by aversive stimuli and activation of LHb terminals in the VTA produces conditioned place aversion through an increase in activity of VTA DA neurons projecting to the PFC (S. Lammel et al., 2012). Although VTA MC3R neurons received extensive input from LHb, they sent very few projections to PFC and therefore are unlikely to mediate aversive behavior directly through this circuit. VTA DA/GABA and glutamate neurons also project back to the LHb and regulate LHb output and resulting behaviors such that VTA glutamatergic signaling activates LHb circuitry and promotes aversion (Root, Mejias-Aponte, Qi, & Morales, 2014), whereas stimulation of VTA GABA release in the LHb promotes reward (Stamatakis et al., 2013). Thus, VTA MC3R neurons could alter reward and aversive behaviors through their release of GABA or glutamate in the LHb or through their reciprocal connections with the LHb, but future studies will be required to test this possibility and to discover the exact input-output circuitry responsible.
The PBN, which is known for its role in taste regulation (Boughter, Lu, Saites, & Tokita, 2019; Rosen, Victor, & Di Lorenzo, 2011) and appetite suppression (Carter, Soden, Zweifel, & Palmiter, 2013; Wu, Boyle, & Palmiter, 2009; Wu, Clark, & Palmiter, 2012), was notable for the abundance of its input to VTA MC3R neurons (Figure 7). Although the PBN is best known for its projections to the forebrain structures involved in appetite regulation (Herbert, Moga, & Saper, 1990; Karimnamazi, Travers, & Travers, 2002; Ricardo & Koh, 1978), both VTA DA and GABA neurons have been shown to receive direct input from the PBN (Beier et al., 2015) (Boughter et al., 2019) including PBN neurons involved in responding to pain, fear, and satiety stimuli (Campos, Bowen, Roman, & Palmiter, 2018; Carter et al., 2013). Additionally, VTA projecting PBN neurons have been shown to be responsive to both sweet and bitter stimuli (Boughter et al., 2019) suggesting that PBN may regulate both reward and aversion-associated behaviors through its action in the VTA. Further studies will be necessary to determine the role of PBN-VTA MC3R neuron circuit in feeding, taste, aversion, and reward processing, however.
Several important methodological limitations should be considered when interpreting these anatomical data. The ChR2-eYFP AAV used in our efferent tracing experiments results in a membrane-bound insertion of eYFP and labeling along the entire length of the neuronal membrane. This membrane labeling, coupled with abundance of dendritic arborization in the VTA (Figure 3a–c), prohibited precise identification and counting of starter neurons in the efferent tracing experiments, so we could not effectively normalize the fiber labeling in efferent target regions to the number of starter cells in the VTA to allow for more accurate comparisons between mice. It should be noted that we only analyzed mice which showed strong ChR-eYFP labeling in the VTA, and both the quantitative analyses of coverage area and fiber density and the synaptophysin labeling were normalized to the staining within the VTA, which should have helped minimize this potential issue. We also cannot rule out the possibility that a subset of MC3R-expressing neurons were missed in these experiments, although based on the heavy labeling within the VTA (Figure 3) and a comparison with the location of MC3R neurons in the VTA (see (West et al., 2019)) this would appear unlikely. Another limiting factor in the use of ChR2-eYFP as an efferent tracer is that it does not guarantee that the eYFP labeling observed represents direct synaptic contact with neurons in that brain region. To address this issue, we used the presence of synaptophysin-mRuby puncta as a marker for putative synapses. Although we observed clear synaptophysin-positive puncta, including in bulging varicosities along eYFP-positive fibers, electrophysiology experiments will be required to demonstrate functional connections of VTA MC3R axons in each of the brain regions examined.
RVdG is a powerful tool that can reveal whole-brain synaptic inputs of a neuronal subtype of interest, but there are also several limitations which should be considered when interpreting the data using RVdG to identify inputs to VTA MC3R neurons. For example, RVdG does not appear to label every presynaptic partner of the neuronal subtype of interest because the starter cell transduction usually has to be limited to avoid ectopic expression of TVA, which can allow for RVdG infection even at very low levels, and to maximize cell type specificity (for example, by using a lower titer of TVA as was done here and by (Faget et al., 2016)). Furthermore, trans-synaptic spread efficiency of RVdG has been estimated to be ~10% −50% (Callaway & Luo, 2015) and may be influenced by factors such as the proximity of the synapses to the post-synaptic cell or the difference in viral particle uptake efficiency of different input cells. With this in mind, we cannot rule out the possibility that the extremely low labeling in Arc neurons in all of the genotypes of mice tested here were due to ineffective labeling of these specific inputs by RVdG. We also cannot rule out the possibility that Arc POMC and AgRP neurons may be resistant to infection with RVdG. These possibilities appear unlikely however, because rabies virus has been used successfully to identify whole-brain inputs to VTA DA, GABA, and glutamate neurons (Faget et al., 2016; Watabe-Uchida et al., 2012), and inputs from the Arc to other areas such as the suprachiasmatic nucleus (Yuan et al., 2018) and the medial preoptic area (Kohl et al., 2018) have been identified with the use of RVdG. Furthermore, AgRP neurons have been labeled by monosynaptic rabies injection into the PVN (Betley et al., 2013), demonstrating that they are not highly resistant to RVdG infection. Thus, although the data presented here provides important information on the inputs to VTA MC3R neurons, including the lack of input from Arc POMC and AgRP neurons, additional studies will be required to confirm the exact organization of the functional connectivity of these circuits. Another potential issue with the retrograde tracing studies presented here is the fact that AAV1, the serotype of the TVA and RG helper AAVs, has been reported to retrogradely infect neurons (Rothermel, Brunert, Zabawa, Díaz-Quesada, & Wachowiak, 2013; Zingg et al., 2017). Thus, it is possible that some of the RVdG-labeled neurons could have arisen from low levels of TVA expression in MC3R neurons in other brain regions that project to the VTA and were retrogradely infected by AAV-TVA. A number of factors suggest this is unlikely, however. Retrograde infection with AAV typically requires injections of very high titers of AAVs above those used in these experiments. Furthermore, the same helper AAVs (in AAV1) have been shown to have no retrograde infection when injected into the VTA (Faget et al., 2016). Finally, if the helper AAVs did retrogradely infect neurons in our experiments, we would also expect to see BFP in brain regions outside the VTA, but no BFP was observed in any other brain regions in these studies. Thus, although we cannot rule out the possibility that the helper AAVs did retrogradely infect MC3R neurons projecting to the VTA, this seems unlikely.
Although these studies have provided important information on the efferent and afferent connectivity of VTA MC3R neurons, there are still some important unanswered questions. First, the neurotransmitter phenotype of VTA MC3R neurons projecting to the efferent targets is unknown. MC3Rs are expressed in both dopamine and non-dopamine neurons in the VTA (Lippert et al., 2014), so it remains to be determined which neurotransmitters are released by VTA MC3R neurons at the different efferent targets. It is also unknown whether VTA MC3R neuron projections to the different regions identified play specific roles in independent aspects of behavior or if they act in a concerted fashion. Further study will be required to answer these and other questions, however.
In summary, we have shown here that VTA MC3R neurons send strong projections to and receive afferent inputs from a discrete set of brain regions involved in the regulation of feeding, reward, and aversion. We have also shown that, although Arc neurons provide strong projections to the VTA, they form few direct synapses on any of the VTA neuron subtypes examined, suggesting that the transmission of α-MSH and AgRP to the VTA likely happens via extra-synaptic release. This work greatly contributes to our understanding of the anatomy of the interaction between the melanocortin and the mesolimbic systems and contributes to the growing body of work focused on understanding how molecularly distinct VTA neuron groups and their circuits control behavior. In addition, defining the anatomical organization of VTA MC3R neurons will allow for a more detailed analysis of the role that these neurons, and the circuits they are embedded in, play in the control of feeding and other behaviors.
Funding:
Funding for these studies was provided by NIH grant R01DK115503 (to AGR).
Data Availability Statement: The data that support the findings of this study are available from the corresponding author upon reasonable request.
Footnotes
Disclosures: The authors declare no conflicts of interest.
References
- Aransay A, Rodriguez-Lopez C, Garcia-Amado M, Clasca F, & Prensa L (2015). Long-range projection neurons of the mouse ventral tegmental area: a single-cell axon tracing analysis. Frontiers in Neuroanatomy, 9. doi: 10.3389/fnana.7015.00059 [DOI] [PMC free article] [PubMed] [Google Scholar]
- Atasoy D, Betley JN, Li WP, Su HH, Sertel SM, Scheffer LK, … Sternson SM (2014). A genetically specified connectomics approach applied to long-range feeding regulatory circuits. Nat Neurosci, 17(12), 1830–1839. doi: 10.1038/nn.3854 [DOI] [PMC free article] [PubMed] [Google Scholar]
- Atasoy D, Betley JN, Su HH, & Sternson SM (2012). Deconstruction of a neural circuit for hunger. Nature, 488(7410), 172–177. doi: 10.1038/nature11270 [DOI] [PMC free article] [PubMed] [Google Scholar]
- Barbano MF, Wang HL, Morales M, & Wise RA (2016). Feeding and Reward Are Differentially Induced by Activating GABAergic Lateral Hypothalamic Projections to VTA. J Neurosci, 36(10), 2975–2985. doi: 10.1523/JNEUROSCI.3799-15.2016 [DOI] [PMC free article] [PubMed] [Google Scholar]
- Beier KT, Gao XJ, Xie S, DeLoach KE, Malenka RC, & Luo L (2019). Topological Organization of Ventral Tegmental Area Connectivity Revealed by Viral-Genetic Dissection of Input-Output Relations. Cell Rep, 26(1), 159–167.e156. doi: 10.1016/j.celrep.2018.12.040 [DOI] [PMC free article] [PubMed] [Google Scholar]
- Beier KT, Steinberg EE, DeLoach KE, Xie S, Miyamichi K, Schwarz L, … Luo L (2015). Circuit Architecture of VTA Dopamine Neurons Revealed by Systematic Input-utput Mapping. Cell, 162(3), 622–634. doi: 10.1016/j.cell.2015.07.015 [DOI] [PMC free article] [PubMed] [Google Scholar]
- Betley JN, Cao ZF, Ritola KD, & Sternson SM (2013). Parallel, redundant circuit organization for homeostatic control of feeding behavior. Cell, 155(6), 1337–1350. doi: 10.1016/j.cell.2013.11.002 [DOI] [PMC free article] [PubMed] [Google Scholar]
- Boughter JD, Lu L, Saites LN, & Tokita K (2019). Sweet and bitter taste stimuli activate VTA projection neurons in the parabrachial nucleus. Brain Res, 1714, 99–110. doi: 10.1016/j.brainres.2019.02.027 [DOI] [PMC free article] [PubMed] [Google Scholar]
- Bromberg-Martin ES, Matsumoto M, & Hikosaka O (2010). Dopamine in Motivational Control: Rewarding, Aversive, and Alerting. Neuron, 68(5), 815–834. doi: 10.1016/j.neuron.2010.11.022 [DOI] [PMC free article] [PubMed] [Google Scholar]
- Butler AA (2006). The melanocortin system and energy balance. Peptides, 27(2), 281–290. doi: 10.1016/j.peptides.2005.02.029 [DOI] [PMC free article] [PubMed] [Google Scholar]
- Callaway EM, & Luo L (2015). Monosynaptic Circuit Tracing with Glycoprotein-Deleted Rabies Viruses. J Neurosci, 35(24), 8979–8985. doi: 10.1523/JNEUROSCI.0409-15.2015 [DOI] [PMC free article] [PubMed] [Google Scholar]
- Campos CA, Bowen AJ, Roman CW, & Palmiter RD (2018). Encoding of danger by parabrachial CGRP neurons. Nature, 555(7698), 617–622. doi: 10.1038/nature25511 [DOI] [PMC free article] [PubMed] [Google Scholar]
- Carter ME, Soden ME, Zweifel LS, & Palmiter RD (2013). Genetic identification of a neural circuit that suppresses appetite. Nature, 503(7474), 111–114. doi: 10.1038/nature12596 [DOI] [PMC free article] [PubMed] [Google Scholar]
- Cone RD (2005). Anatomy and regulation of the central melanocortin system. Nat Neurosci, 8(5), 571–578. doi: 10.1038/nn1455 [DOI] [PubMed] [Google Scholar]
- Cone RD (2006). Studies on the physiological functions of the melanocortin system. Endocr Rev, 27(7), 736–749. doi: 10.1210/er.2006-0034 [DOI] [PubMed] [Google Scholar]
- Cowley MA, Smart JL, Rubinstein M, Cerdán MG, Diano S, Horvath TL, … Low MJ (2001). Leptin activates anorexigenic POMC neurons through a neural network in the arcuate nucleus. Nature, 411(6836), 480–484. doi: 10.1038/35078085 [DOI] [PubMed] [Google Scholar]
- Dicken MS, Tooker RE, & Hentges ST (2012). Regulation of GABA and glutamate release from proopiomelanocortin neuron terminals in intact hypothalamic networks. J Neurosci, 32(12), 4042–4048. doi: 10.1523/JNEUROSCI.6032-11.2012 [DOI] [PMC free article] [PubMed] [Google Scholar]
- Dietrich MO, Bober J, Ferreira JG, Tellez LA, Mineur YS, Souza DO, … Horvath TL (2012). AgRP neurons regulate development of dopamine neuronal plasticity and nonfood-associated behaviors. Nat Neurosci, 15(8), 1108–1110. doi: 10.1038/nn.3147 [DOI] [PMC free article] [PubMed] [Google Scholar]
- Faget L, Osakada F, Duan J, Ressler R, Johnson AB, Proudfoot JA, … Hnasko TS (2016). Afferent Inputs to Neurotransmitter-Defined Cell Types in the Ventral Tegmental Area. Cell Rep, 15(12), 2796–2808. doi: 10.1016/j.celrep.2016.05.057 [DOI] [PMC free article] [PubMed] [Google Scholar]
- Hahn TM, Breininger JF, Baskin DG, & Schwartz MW (1998). Coexpression of Agrp and NPY in fasting-activated hypothalamic neurons. Nat Neurosci, 1(4), 271–272. doi: 10.1038/1082 [DOI] [PubMed] [Google Scholar]
- Hajnal A, Smith GP, & Norgren R (2004). Oral sucrose stimulation increases accumbens dopamine in the rat. Am J Physiol Regul Integr Comp Physiol, 286(1), R31–37. doi: 10.1152/ajpregu.00282.2003 [DOI] [PubMed] [Google Scholar]
- Hein LR, De Oliveira JA, De Campos KA, & Caltabiano PC (2012). Extended depth from focus reconstruction using NIH ImageJ plugins: quality and resolution of elevation maps. Microsc Res Tech, 75(11), 1593–1607. doi: 10.1002/jemt.22105 [DOI] [PubMed] [Google Scholar]
- Hentges ST, Otero-Corchon V, Pennock RL, King CM, & Low MJ (2009). Proopiomelanocortin expression in both GABA and glutamate neurons. J Neurosci, 29(43), 13684–13690. doi: 10.1523/JNEUROSCI.3770-09.2009 [DOI] [PMC free article] [PubMed] [Google Scholar]
- Herbert H, Moga MM, & Saper CB (1990). Connections of the parabrachial nucleus with the nucleus of the solitary tract and the medullary reticular formation in the rat. J Comp Neurol, 293(4), 540–580. doi: 10.1002/cne.902930404 [DOI] [PubMed] [Google Scholar]
- Hernandez L, & Hoebel BG (1988). Food reward and cocaine increase extracellular dopamine in the nucleus accumbens as measured by microdialysis. Life Sci, 42(18), 1705–1712. [DOI] [PubMed] [Google Scholar]
- Hnasko TS, Chuhma N, Zhang H, Goh GY, Sulzer D, Palmiter RD, … Edwards RH (2010). Vesicular glutamate transport promotes dopamine storage and glutamate corelease in vivo. Neuron, 65(5), 643–656. doi: 10.1016/j.neuron.2010.02.012 [DOI] [PMC free article] [PubMed] [Google Scholar]
- Hnasko TS, Hjelmstad GO, Fields HL, & Edwards RH (2012). Ventral tegmental area glutamate neurons: electrophysiological properties and projections. J Neurosci, 32(43), 15076–15085. doi: 10.1523/JNEUROSCI.3128-12.2012 [DOI] [PMC free article] [PubMed] [Google Scholar]
- Hommel JD, Trinko R, Sears RM, Georgescu D, Liu ZW, Gao XB, … DiLeone RJ (2006). Leptin receptor signaling in midbrain dopamine neurons regulates feeding. Neuron, 51(6), 801–810. doi: 10.1016/j.neuron.2006.08.023 [DOI] [PubMed] [Google Scholar]
- Horvath TL, Bechmann I, Naftolin F, Kalra SP, & Leranth C (1997). Heterogeneity in the neuropeptide Y-containing neurons of the rat arcuate nucleus: GABAergic and non-GABAergic subpopulations. Brain Res, 756(1–2), 283–286. [DOI] [PubMed] [Google Scholar]
- Hyland BI, Reynolds JN, Hay J, Perk CG, & Miller R (2002). Firing modes of midbrain dopamine cells in the freely moving rat. Neuroscience, 114(2), 475–492. [DOI] [PubMed] [Google Scholar]
- Ikemoto S (2007). Dopamine reward circuitry: Two projection systems from the ventral midbrain to the nucleus accumbens-olfactory tubercle complex. Brain Research Reviews, 56(1), 27–78. doi: 10.1016/j.brainresrev.2007.05.004 [DOI] [PMC free article] [PubMed] [Google Scholar]
- Inoue K, Kiriike N, Kurioka M, Fujisaki Y, Iwasaki S, & Yamagami S (1997). Bromocriptine enhances feeding behavior without changing dopamine metabolism. Pharmacol Biochem Behav, 58(1), 183–188. [DOI] [PubMed] [Google Scholar]
- Jansone B, Bergstrom L, Svirskis S, Lindblom J, Klusa V, & Wikberg JES (2004). Opposite effects of gamma(1)- and gamma(2)-melanocyte stimulating hormone on regulation of the dopaminergic mesolimbic system in rats. Neuroscience Letters, 361(1–3), 68–71. doi: 10.1016/j.neulet.2003.12.006 [DOI] [PubMed] [Google Scholar]
- Jennings JH, Ung RL, Resendez SL, Stamatakis AM, Taylor JG, Huang J, … Stuber GD (2015). Visualizing hypothalamic network dynamics for appetitive and consummatory behaviors. Cell, 160(3), 516–527. doi: 10.1016/j.cell.2014.12.026 [DOI] [PMC free article] [PubMed] [Google Scholar]
- Karimnamazi H, Travers SP, & Travers JB (2002). Oral and gastric input to the parabrachial nucleus of the rat. Brain Res, 957(2), 193–206. doi: 10.1016/s0006-8993(02)03438-8 [DOI] [PubMed] [Google Scholar]
- Kenny PJ (2011). Reward mechanisms in obesity: new insights and future directions. Neuron, 69(4), 664–679. doi: 10.1016/j.neuron.2011.02.016 [DOI] [PMC free article] [PubMed] [Google Scholar]
- Khan S, Stott SR, Chabrat A, Truckenbrodt AM, Spencer-Dene B, Nave KA, … Ang SL (2017). Survival of a Novel Subset of Midbrain Dopaminergic Neurons Projecting to the Lateral Septum Is Dependent on NeuroD Proteins. J Neurosci, 37(9), 2305–2316. doi: 10.1523/JNEUROSCI.2414-16.2016 [DOI] [PMC free article] [PubMed] [Google Scholar]
- King CM, & Hentges ST (2011). Relative number and distribution of murine hypothalamic proopiomelanocortin neurons innervating distinct target sites. Plos One, 6(10), e25864. doi: 10.1371/journal.pone.0025864 [DOI] [PMC free article] [PubMed] [Google Scholar]
- Klusa V, Svirskis S, Opmane B, Muceniece R, & Wikberg JES (1999). Behavioural responses of gamma-MSH peptides administered into the rat ventral tegmental area. Acta Physiologica Scandinavica, 167(2), 99–104. [DOI] [PubMed] [Google Scholar]
- Kohl J, Babayan BM, Rubinstein ND, Autry AE, Marin-Rodriguez B, Kapoor V, … Dulac C (2018). Functional circuit architecture underlying parental behaviour. Nature, 556(7701), 326–331. doi: 10.1038/s41586-018-0027-0 [DOI] [PMC free article] [PubMed] [Google Scholar]
- Krashes MJ, Shah BP, Koda S, & Lowell BB (2013). Rapid versus delayed stimulation of feeding by the endogenously released AgRP neuron mediators GABA, NPY, and AgRP. Cell Metab, 18(4), 588–595. doi: 10.1016/j.cmet.2013.09.009 [DOI] [PMC free article] [PubMed] [Google Scholar]
- Krashes MJ, Shah BP, Madara JC, Olson DP, Strochlic DE, Garfield AS, … Lowell BB (2014). An excitatory paraventricular nucleus to AgRP neuron circuit that drives hunger. Nature, 507(7491), 238–242. doi: 10.1038/nature12956 [DOI] [PMC free article] [PubMed] [Google Scholar]
- Lammel S, Hetzel A, Haeckel O, Jones I, Liss B, & Roeper J (2008). Unique properties of mesoprefrontal neurons within a dual mesocorticolimbic dopamine system. Neuron, 57(5), 760–773. doi: 10.1016/j.neuron.2008.01.022 [DOI] [PubMed] [Google Scholar]
- Lammel S, Lim BK, & Malenka RC (2014). Reward and aversion in a heterogeneous midbrain dopamine system. Neuropharmacology, 76, 351–359. doi: 10.1016/j.neuropharm.2013.03.019 [DOI] [PMC free article] [PubMed] [Google Scholar]
- Lammel S, Lim BK, Ran C, Huang KW, Betley MJ, Tye KM, … Malenka RC (2012). Input-specific control of reward and aversion in the ventral tegmental area. Nature, 491(7423), 212–217. doi: 10.1038/nature11527 [DOI] [PMC free article] [PubMed] [Google Scholar]
- Liang NC, Hajnal A, & Norgren R (2006). Sham feeding corn oil increases accumbens dopamine in the rat. Am J Physiol Regul Integr Comp Physiol, 291(5), R1236–1239. doi: 10.1152/ajpregu.00226.2006 [DOI] [PubMed] [Google Scholar]
- Lindblom J, Opmane B, Mutulis F, Mutule I, Petrovska R, Klusa V, … Wikberg JE (2001). The MC4 receptor mediates alpha-MSH induced release of nucleus accumbens dopamine. Neuroreport, 12(10), 2155–2158. [DOI] [PubMed] [Google Scholar]
- Lippert RN, Ellacott KL, & Cone RD (2014). Gender-specific roles for the melanocortin-3 receptor in the regulation of the mesolimbic dopamine system in mice. Endocrinology, 155(5), 1718–1727. doi: 10.1210/en.2013-2049 [DOI] [PMC free article] [PubMed] [Google Scholar]
- Ludwig M, & Leng G (2006). Dendritic peptide release and peptide-dependent behaviours. Nat Rev Neurosci, 7(2), 126–136. doi: 10.1038/nrn1845 [DOI] [PubMed] [Google Scholar]
- Nieh EH, Vander Weele CM, Matthews GA, Presbrey KN, Wichmann R, Leppla CA, … Tye KM (2016). Inhibitory Input from the Lateral Hypothalamus to the Ventral Tegmental Area Disinhibits Dopamine Neurons and Promotes Behavioral Activation. Neuron, 90(6), 1286–1298. doi: 10.1016/j.neuron.2016.04.035 [DOI] [PMC free article] [PubMed] [Google Scholar]
- Osakada F, Mori T, Cetin AH, Marshel JH, Virgen B, & Callaway EM (2011). New rabies virus variants for monitoring and manipulating activity and gene expression in defined neural circuits. Neuron, 71(4), 617–631. doi: 10.1016/j.neuron.2011.07.005 [DOI] [PMC free article] [PubMed] [Google Scholar]
- Palmiter RD (2007). Is dopamine a physiologically relevant mediator of feeding behavior? Trends in Neurosciences, 30(8), 375–381. doi: 10.1016/j.tins.2007.06.004 [DOI] [PubMed] [Google Scholar]
- Paxinos G, & Franklin KBJ (2001). The Mouse Brain in Stereotaxic Coordinates (2nd ed). San Diego, CA: Academic. [Google Scholar]
- Pei H, Patterson CM, Sutton AK, Burnett KH, Myers MG, & Olson DP (2019). Lateral Hypothalamic Mc3R-Expressing Neurons Modulate Locomotor Activity, Energy Expenditure, and Adiposity in Male Mice. Endocrinology, 160(2), 343–358. doi: 10.1210/en.2018-00747 [DOI] [PMC free article] [PubMed] [Google Scholar]
- Poulin JF, Caronia G, Hofer C, Cui Q, Helm B, Ramakrishnan C, … Awatramani R (2018). Mapping projections of molecularly defined dopamine neuron subtypes using intersectional genetic approaches. Nat Neurosci, 21(9), 1260–1271. doi: 10.1038/s41593-018-0203-4 [DOI] [PMC free article] [PubMed] [Google Scholar]
- Preibisch S, Saalfeld S, & Tomancak P (2009). Globally optimal stitching of tiled 3D microscopic image acquisitions. Bioinformatics, 25(11), 1463–1465. doi: 10.1093/bioinformatics/btp184 [DOI] [PMC free article] [PubMed] [Google Scholar]
- Qi J, Zhang S, Wang HL, Barker DJ, Miranda-Barrientos J, & Morales M (2016). VTA glutamatergic inputs to nucleus accumbens drive aversion by acting on GABAergic interneurons. Nat Neurosci. doi: 10.1038/nn.4281 [DOI] [PMC free article] [PubMed] [Google Scholar]
- Ricardo JA, & Koh ET (1978). Anatomical evidence of direct projections from the nucleus of the solitary tract to the hypothalamus, amygdala, and other forebrain structures in the rat. Brain Res, 153(1), 1–26. doi: 10.1016/0006-8993(78)91125-3 [DOI] [PubMed] [Google Scholar]
- Roitman MF, Stuber GD, Phillips PE, Wightman RM, & Carelli RM (2004). Dopamine operates as a subsecond modulator of food seeking. J Neurosci, 24(6), 1265–1271. doi: 10.1523/JNEUROSCI.3823-03.2004 [DOI] [PMC free article] [PubMed] [Google Scholar]
- Root DH, Mejias-Aponte CA, Qi J, & Morales M (2014). Role of Glutamatergic Projections from Ventral Tegmental Area to Lateral Habenula in Aversive Conditioning. Journal of Neuroscience, 34(42), 13906–13910. doi: 10.1523/jneurosci.2029-14.2014 [DOI] [PMC free article] [PubMed] [Google Scholar]
- Root DH, Mejias-Aponte CA, Zhang S, Wang HL, Hoffman AF, Lupica CR, & Morales M (2014). Single rodent mesohabenular axons release glutamate and GABA. Nat Neurosci. doi: 10.1038/nn.3823 [DOI] [PMC free article] [PubMed] [Google Scholar]
- Roseberry AG (2013). Altered feeding and body weight following melanocortin administration to the ventral tegmental area in adult rats. Psychopharmacology (Berl), 226(1), 25–34. doi: 10.1007/s00213-012-2879-6 [DOI] [PubMed] [Google Scholar]
- Roselli-Rehfuss L, Mountjoy KG, Robbins LS, Mortrud MT, Low MJ, Tatro JB, … Cone RD (1993). Identification of a receptor for gamma melanotropin and other proopiomelanocortin peptides in the hypothalamus and limbic system. Proc Natl Acad Sci U S A, 90(19), 8856–8860. [DOI] [PMC free article] [PubMed] [Google Scholar]
- Rosen AM, Victor JD, & Di Lorenzo PM (2011). Temporal coding of taste in the parabrachial nucleus of the pons of the rat. J Neurophysiol, 105(4), 1889–1896. doi: 10.1152/jn.00836.2010 [DOI] [PMC free article] [PubMed] [Google Scholar]
- Rothermel M, Brunert D, Zabawa C, Díaz-Quesada M, & Wachowiak M (2013). Transgene expression in target-defined neuron populations mediated by retrograde infection with adeno-associated viral vectors. J Neurosci, 33(38), 15195–15206. doi: 10.1523/JNEUROSCI.1618-13.2013 [DOI] [PMC free article] [PubMed] [Google Scholar]
- Rueden CT, Schindelin J, Hiner MC, DeZonia BE, Walter AE, Arena ET, & Eliceiri KW (2017). ImageJ2: ImageJ for the next generation of scientific image data. BMC Bioinformatics, 18(1), 529. doi: 10.1186/s12859-017-1934-z. [DOI] [PMC free article] [PubMed] [Google Scholar]
- Sanchez MS, Barontini M, Armando I, & Celis ME (2001). Correlation of increased grooming behavior and motor activity with alterations in nigrostriatal and mesolimbic catecholamines after alpha-melanotropin and neuropeptide glutamine-isoleucine injection in the rat ventral tegmental area. Cellular and Molecular Neurobiology, 21(5), 523–533. doi: 10.1023/a:1013871407464 [DOI] [PMC free article] [PubMed] [Google Scholar]
- Sato Y, Nakajima S, Shiraga N, Atsumi H, Yoshida S, Koller T, … Kikinis R (1998). Three-dimensional multi-scale line filter for segmentation and visualization of curvilinear structures in medical images. Med Image Anal, 2(2), 143–168. doi: 10.1016/s1361-8415(98)80009-1 [DOI] [PubMed] [Google Scholar]
- Savitt JM, Jang SS, Mu W, Dawson VL, & Dawson TM (2005). Bcl-x is required for proper development of the mouse substantia nigra. J Neurosci, 25(29), 6721–6728. doi: 10.1523/JNEUROSCI.0760-05.2005 [DOI] [PMC free article] [PubMed] [Google Scholar]
- Schindelin J, Arganda-Carreras I, Frise E, Kaynig V, Longair M, Pietzsch T, … Cardona A (2012). Fiji: an open-source platform for biological-image analysis. Nature Methods, 9(7), 676–682. doi: 10.1038/nmeth.2019 [DOI] [PMC free article] [PubMed] [Google Scholar]
- Schultz W (1998). Predictive reward signal of dopamine neurons. J Neurophysiol, 80(1), 1–27. [DOI] [PubMed] [Google Scholar]
- Sears JC, & Broihier HT (2016). FoxO regulates microtubule dynamics and polarity to promote dendrite branching in Drosophila sensory neurons. Dev Biol, 418(1), 40–54. doi: 10.1016/j.ydbio.2016.08.018 [DOI] [PMC free article] [PubMed] [Google Scholar]
- Shanmugarajah L, Dunigan AI, Frantz KJ, & Roseberry AG (2017). Altered sucrose self-administration following injection of melanocortin receptor agonists and antagonists into the ventral tegmental area. Psychopharmacology (Berl). doi: 10.1007/s00213-017-4570-4 [DOI] [PubMed] [Google Scholar]
- Shutter JR, Graham M, Kinsey AC, Scully S, Lüthy R, & Stark KL (1997). Hypothalamic expression of ART, a novel gene related to agouti, is up-regulated in obese and diabetic mutant mice. Genes Dev, 11(5), 593–602. [DOI] [PubMed] [Google Scholar]
- Soille P, & Vincent LM (1990). Determining watersheds in digital pictures via flooding simulations. Proc. SPIE, 1360, 240–250. doi: 10.1117/12.24211 [DOI] [Google Scholar]
- Stamatakis AM, Jennings JH, Ung RL, Blair GA, Weinberg RJ, Neve RL, … Stuber GD (2013). A Unique Population of Ventral Tegmental Area Neurons Inhibits the Lateral Habenula to Promote Reward. Neuron, 80(4), 1039–1053. doi: 10.1016/j.neuron.2013.08.023 [DOI] [PMC free article] [PubMed] [Google Scholar]
- Stuber GD, Hnasko TS, Britt JP, Edwards RH, & Bonci A (2010). Dopaminergic terminals in the nucleus accumbens but not the dorsal striatum corelease glutamate. J Neurosci, 30(24), 8229–8233. doi: 10.1523/JNEUROSCI.1754-10.2010 [DOI] [PMC free article] [PubMed] [Google Scholar]
- Sweeney P, & Yang Y (2016). An Inhibitory Septum to Lateral Hypothalamus Circuit That Suppresses Feeding. J Neurosci, 36(44), 11185–11195. doi: 10.1523/JNEUROSCI.2042-16.2016 [DOI] [PMC free article] [PubMed] [Google Scholar]
- Szczypka MS, Mandel RJ, Donahue BA, Snyder RO, Leff SE, & Palmiter RD (1999). Viral gene delivery selectively restores feeding and prevents lethality of dopamine-deficient mice. Neuron, 22(1), 167–178. [DOI] [PubMed] [Google Scholar]
- Taniguchi H, He M, Wu P, Kim S, Paik R, Sugino K, … Huang ZJ (2011). A resource of Cre driver lines for genetic targeting of GABAergic neurons in cerebral cortex. Neuron, 71(6), 995–1013. doi: 10.1016/j.neuron.2011.07.026 [DOI] [PMC free article] [PubMed] [Google Scholar]
- Taylor SR, Badurek S, Dileone RJ, Nashmi R, Minichiello L, & Picciotto MR (2014). GABAergic and Glutamatergic Efferents of the Mouse Ventral Tegmental Area. Journal of Comparative Neurology, 522(14), 3308–3334. doi: 10.1002/cne.23603 [DOI] [PMC free article] [PubMed] [Google Scholar]
- Tong Q, Ye CP, Jones JE, Elmquist JK, & Lowell BB (2008). Synaptic release of GABA by AgRP neurons is required for normal regulation of energy balance. Nat Neurosci, 11(9), 998–1000. doi: 10.1038/nn.2167 [DOI] [PMC free article] [PubMed] [Google Scholar]
- Torre E, & Celis ME (1986). Alpha msh injected into the substantia nigra or intraventricularly alters behavior and the striatal dopaminergic activity. Neurochemistry International, 9(1), 85–90. doi: 10.1016/0197-0186(86)90035-5 [DOI] [PubMed] [Google Scholar]
- Torre E, & Celis ME (1988). Cholinergic mediation in the ventral tegmental area of alpha melanotropin induced excessive grooming changes of the dopamine activity in the nucleus accumbens and caudate putamen. Life Sciences, 42(17), 1651–1658. doi: 10.1016/0024-3205(88)90444-4 [DOI] [PubMed] [Google Scholar]
- van den Pol AN (2012). Neuropeptide transmission in brain circuits. Neuron, 76(1), 98–115. doi: 10.1016/j.neuron.2012.09.014 [DOI] [PMC free article] [PubMed] [Google Scholar]
- van den Pol AN, Yao Y, Fu LY, Foo K, Huang H, Coppari R, … Broberger C (2009). Neuromedin B and gastrin-releasing peptide excite arcuate nucleus neuropeptide Y neurons in a novel transgenic mouse expressing strong Renilla green fluorescent protein in NPY neurons. J Neurosci, 29(14), 4622–4639. doi: 10.1523/JNEUROSCI.3249-08.2009 [DOI] [PMC free article] [PubMed] [Google Scholar]
- Volkow ND, Wang GJ, & Baler RD (2011). Reward, dopamine and the control of food intake: implications for obesity. Trends Cogn Sci, 15(1), 37–46. doi: 10.1016/j.tics.2010.11.001 [DOI] [PMC free article] [PubMed] [Google Scholar]
- Vong L, Ye C, Yang Z, Choi B, Chua S, & Lowell BB (2011). Leptin action on GABAergic neurons prevents obesity and reduces inhibitory tone to POMC neurons. Neuron, 71(1), 142–154. doi: 10.1016/j.neuron.2011.05.028 [DOI] [PMC free article] [PubMed] [Google Scholar]
- Watabe-Uchida M, Zhu L, Ogawa SK, Vamanrao A, & Uchida N (2012). Whole-Brain Mapping of Direct Inputs to Midbrain Dopamine Neurons. Neuron, 74(5), 858–873. doi: 10.1016/j.neuron.2012.03.017 [DOI] [PubMed] [Google Scholar]
- Webber ES, Bonci A, & Krashes MJ (2015). The elegance of energy balance: Insight from circuit-level manipulations. Synapse, 69(9), 461–474. doi: 10.1002/syn.21837 [DOI] [PubMed] [Google Scholar]
- West KS, Lu C, Olson DP, & Roseberry AG (2019). α-MSH increases the activity of MC3R-expressing neurons in the ventral tegmental area. J Physiol. doi: 10.1113/JP277193 [DOI] [PMC free article] [PubMed] [Google Scholar]
- Wickersham IR, Lyon DC, Barnard RJ, Mori T, Finke S, Conzelmann KK, Young JA, Callaway EM. Monosynaptic restriction of transsynaptic tracing from single, genetically targeted neurons. Neuron. 2007. March 1;53(5):639–47. doi: 10.1016/j.neuron.2007.01.033. [DOI] [PMC free article] [PubMed] [Google Scholar]
- Wickersham IR, Finke S, Conzelmann KK, Callaway EM. Retrograde neuronal tracing with a deletion-mutant rabies virus. Nat Methods. 2007. January;4(1):47–9. doi: 10.1038/nmeth999. Epub 2006 Dec 10. [DOI] [PMC free article] [PubMed] [Google Scholar]
- Wise RA (2006). Role of brain dopamine in food reward and reinforcement. Philos Trans R Soc Lond B Biol Sci, 361(1471), 1149–1158. doi: 10.1098/rstb.2006.1854 [DOI] [PMC free article] [PubMed] [Google Scholar]
- Wise RA, Spindler J, & Legault L (1978). Major attenuation of food reward with performance-sparing doses of pimozide in the rat. Can J Psychol, 32(2), 77–85. [DOI] [PubMed] [Google Scholar]
- Wu Q, Boyle MP, & Palmiter RD (2009). Loss of GABAergic signaling by AgRP neurons to the parabrachial nucleus leads to starvation. Cell, 137(7), 1225–1234. doi: 10.1016/j.cell.2009.04.022 [DOI] [PMC free article] [PubMed] [Google Scholar]
- Wu Q, Clark MS, & Palmiter RD (2012). Deciphering a neuronal circuit that mediates appetite. Nature, 483(7391), 594–597. doi: 10.1038/nature10899 [DOI] [PMC free article] [PubMed] [Google Scholar]
- Yamaguchi T, Wang HL, Li X, Ng TH, & Morales M (2011). Mesocorticolimbic glutamatergic pathway. J Neurosci, 31(23), 8476–8490. doi: 10.1523/JNEUROSCI.1598-11.2011 [DOI] [PMC free article] [PubMed] [Google Scholar]
- Yang H, de Jong JW, Tak Y, Peck J, Bateup HS, & Lammel S (2018). Nucleus Accumbens Subnuclei Regulate Motivated Behavior via Direct Inhibition and Disinhibition of VTA Dopamine Subpopulations. Neuron, 97(2), 434–449.e434. doi: 10.1016/j.neuron.2017.12.022 [DOI] [PMC free article] [PubMed] [Google Scholar]
- Yen HH, & Roseberry AG (2014). Decreased consumption of rewarding sucrose solutions after injection of melanocortins into the ventral tegmental area of rats. Psychopharmacology (Berl). doi: 10.1007/s00213-014-3663-6 [DOI] [PubMed] [Google Scholar]
- Yetnikoff L, Lavezzi HN, Reichard RA, & Zahm DS (2014). An update on the connections of the ventral mesencephalic dopaminergic complex. Neuroscience. doi: 10.1016/j.neuroscience.2014.04.010 [DOI] [PMC free article] [PubMed] [Google Scholar]
- Yuan XS, Wei HH, Xu W, Wang L, Qu WM, Li RX, & Huang ZL (2018). Whole-Brain Monosynaptic Afferent Projections to the Cholecystokinin Neurons of the Suprachiasmatic Nucleus. Front Neurosci, 12, 807. doi: 10.3389/fnins.2018.00807 [DOI] [PMC free article] [PubMed] [Google Scholar]
- Zingg B, Chou XL, Zhang ZG, Mesik L, Liang F, Tao HW, & Zhang LI (2017). AAV-Mediated Anterograde Transsynaptic Tagging: Mapping Corticocollicular Input-Defined Neural Pathways for Defense Behaviors. Neuron, 93(1), 33–47. doi: 10.1016/j.neuron.2016.11.045 [DOI] [PMC free article] [PubMed] [Google Scholar]
- Zupanc GK (1996). Peptidergic transmission: from morphological correlates to functional implications. Micron, 27(1), 35–91. doi: 10.1016/0968-4328(95)00028-3 [DOI] [PubMed] [Google Scholar]