

Abstract
MicroRNAs (miRs) are small non-coding RNAs that can have large impacts on oncogenic pathways. Possible functions of dysregulated miRs have not been studied in neurofibromatosis type 1 (NF1) plexiform neurofibromas (PNFs). In PNFs, Schwann cells (SCs) have biallelic NF1 mutations necessary for tumorigenesis. We analyzed a miR-microarray comparing to normal and PNF SCs and identified differences in miR expression, and we validated in mouse PNFs versus normal mouse SCs by qRT-PCR. Among these, miR-155 was a top overexpressed miR, and its expression was regulated by RAS/MAPK signaling. Overexpression of miR-155 increased mature Nf1−/− mouse SC proliferation. In SC precursors, which model tumor initiating cells, pharmacological and genetic inhibition of miR-155 decreased PNF-derived sphere numbers in vitro and we identified Maf as a miR-155 target. In vivo, global deletion of miR-155 significantly decreased tumor number and volume, increasing mouse survival. Fluorescent nanoparticles entered PNFs, suggesting that an anti-miR might have therapeutic potential. However, treatment of established PNFs using anti-miR-155 peptide nucleic acid-loaded nanoparticles marginally decreased tumor numbers and did not reduce tumor growth. These results suggest that miR-155 plays a functional role in PNF growth and/or SC proliferation, and that targeting neurofibroma miRs is feasible, and might provide novel therapeutic opportunities.
Introduction
Neurofibromatosis type 1 (NF1) is a common autosomal dominantly inherited disease, affecting 1:2500 individuals worldwide (1). At least half of NF1 patients develop plexiform neurofibromas (PNFs), benign tumors associated mainly with large nerve trunks, and nearly all form dermal neurofibromas associated with skin nerve endings (1–4). The primary pathogenic cells in neurofibromas are Schwann cells (SCs) and Schwann cell precursors (SCPs), in which Nf1 loss initiates tumors in mice (5). In mice, loss of Nf1 in SCs and SCPs at embryonic day 12.5 (E12.5) causes PNF and dermal neurofibromas in a wild type microenvironment (6). Dermal and PNFs also develop in mice using HOXB7-Cre or Prss56-Cre as a driver, ablating Nf1 in boundary cap cells (7, 8). In mouse PNFs, proliferating SCs lose most contact with nerve axons, as in human neurofibromas (9).
NF1 encodes neurofibromin, a Ras-GTPase activating protein (Ras-GAP) (10–12). Therefore, loss of NF1 activates the Ras/MEK/ERK pathway and increases AP-1 binding and activity (13). Blocking the Ras/MEK/ERK pathway is effective in shrinking most mouse and human PNFs, although tumors re-grow after stopping drug treatment (14–17). Other pathways, such as PI3K/AKT and cyclic AMP, are also altered upon loss of NF1 (12). MEK inhibition also delays tumor growth, suggesting a potential role in tumor initiation (18).
MicroRNAs (miRs) are small non-coding, endogenous, single stranded RNAs that regulate gene expression post-transcriptionally. MiRs can have a significant impact on many pathways, including the oncogenic signaling pathways in solid tumors (19–23). MiRNA profiling studies have shown elevated levels of miR-155 in many cancers (24, 25). MiR-155 is processed from the B-cell integration cluster (BIC) and B-cell targeted overexpression of BIC/miR-155 causes B-cell lymphoma in mice (26). MiR-155 deficient mutant mice survive but show impaired T cell–dependent antibody responses (27). In vivo preclinical studies found that complementary anti-miR molecules, chemically modified antagomiRs, and peptide nucleic acids (PNAs) can target endogenous miRs (28–31). Because of their stability and excellent binding affinity, PNAs are effective anti-miRs but show non-specific organ biodistribution. To overcome this, a biodegradable polymer, poly(lactic-co-glycolicacid)(PLGA)-coated nanoparticles (NPs) delivery system was developed for encapsulating anti-miRs. This increased miR specificity and in vivo efficacy by 25-fold (24).
Recent studies have shown that miR-29c, miR- 34a, miR-214, miR-10b, miR-204, and miR- 21 are elevated in both dermal neurofibromas (32–35) and NF1-associated malignant peripheral nerve sheath tumors (MPNSTs) which are the aggressive sarcomas that can develop in PNFs. However, miR function in NF1 PNF formation has not been studied. Here we show that miR-155 contributes to PNF initiation in the context of loss of Nf1. In vivo treatment of PNFs using anti-miR-155-PNAs-loaded nanoparticles (anti-miR-155-PNAs-NPs) marginally decreased tumor numbers but did not reduce the growth of established tumors. These results suggest that miR-155 plays a functional role in the speed of PNF growth and/or SC proliferation, supporting the idea that targeting miRs might provide novel therapies for PNFs.
Materials and Methods
Animals
We housed mice in temperature- and humidity-controlled facilities on 12-hour dark-light cycles with free access to food and water. The animal care and use committees of Cincinnati Children’s Hospital Medical Center approved all animal procedures. IACUC guidelines were followed with animal subjects. In DhhCre transgenic mice, Cre-mediated recombination activity results in deletion of the floxed-Nf1 allele in SCs/SCPs at E12.5. Genotyping was performed as described (6). We purchased the miR-155 mice (26) (designed miR-155 −/− ) from the Jackson Laboratory (Maine, NE). We bred the miR-155 −/− mice with Nf1fl/fl mice to obtain miR-155+/−;Nf1fl/+ mice. We also bred the miR-155 −/− mice with Nf1fl/+;DhhCre mice to obtain miR-155+/−;Nf1fl/+;DhhCre mice. We interbred the offspring to obtain miR-155 −/−;Nf1fl/fl;DhhCre mice. Randomized littermates (miR-155+/−; Nf1fl/fl;DhhCre and miR-155 −/−;Nf1fl/+;DhhCre) were used as controls.
Mouse MRI and volumetric measurements
Mouse MRI was performed as described (14). Based on our previous control data, at least 11 mice are needed to detect a mean change of 40% of total volume with 80% power. We scanned miR-155+/−; Nf1fl/fl;DhhCre mice (n=11) and miR-155 −/−;Nf1fl/+;DhhCre mice (n=13) at 7 and 12 months of age. Mouse volumetric measurements was performed as described (36). Mouse genotypes were blind to the person who performed the volumetric measurements.
Human miR microarray and the miR-to-target gene network construction
We re-analyzed the published human miR microarray datasets (GSE14038) on normal human SCs (n=10) and human PNF SCs (n=11). Briefly, raw CEL files were pre-processed and gene expression levels were normalized using Bioconductor/affy package’s Robust Multi-array Average (RMA) method. Differentially expressed (DE) genes were predicted using Bioconductor/limma package (37).
To generate a miR-to-gene network, we selected DE genes (|fold change| > 2.5x and FDR q < 0.05) and miRNAs (|fold change| > 1.5x and p < 0.01). A DE-miRNA and a DE-gene were connected if the pair had stringent mirSVR scores (< −1.2 for top 5% prediction) based on conserved miRNAs (“Good miSVR score, Conserved miRNA” dataset, http://www.microrna.org) (38). We used mirSVR < 0.1 as an interaction cutoff.
RNA sequencing
RNA sequencing was performed as described in Supplemental information. We used |fold change| > 2 x and adjusted P < 0.05 as cutoffs to detect DEGs. We deposited the data to GEO (GSE156391, https://www.ncbi.nlm.nih.gov/geo/query/acc.cgi?acc=GSE156391).
Histology and Immunohistochemistry
We sacrificed mice 24 hours after last MRI for analysis. We stained 6-μm paraffin embedded sections with either hematoxylin and eosin for histology or incubated sections overnight at 4°C with anti-Ki67 (Cell Signaling, Danvers, MA, Cat # 12202S, 1:200) or MAF (1:100, Invitrogen, Cat# PA523179). For fluorescence microscopy, we used Alexa-594 fluorescent conjugated anti-rabbit secondary antibody (1:400, Thermo Fisher Scientifics, Waltham, MA, Cat# A11037) and counterstained with bisbenzamide (DAPI) to identify the nuclei. Visualization methods were as described (6).
TUNEL assay
The TUNEL assay was performed according to Roche In situ cell death detection kit, TMR red instructions (Roche Diagnostics Gmbh, Mannheim, Germany, Cat #: Sigma-Aldrich 12156792910) on deparaffinized sections. We stained the nuclei with DAPI. We counted TUNEL+ cells and DAPI+ nuclei in at least three cross sections per sample. Data are presented as average percentage of TUNEL+ cells per sample.
Neurofibroma sphere formation
Mouse neurofibroma/DRG-derived sphere culture was performed as described (39). We dissected mouse tumors from DRG/tumors and cut them into 1 mm3 pieces in L-15 media supplemented with Pen/Strep (Thermo Fisher Scientifics, Cat# 15-140-122), Collagenase Type I (0.5mg/mL, Worthington Boichemical, Lakewood, NJ, Cat # LS004196), and Dispase protease II (2.5mg/mL, Sigma-Aldrich, Burlington, MA, Cat # 04942078001). We dissociated the tumors for 4 hours at 37°C while shaking at 170 RPM. We then passed the dissociated cells through a 40mm cell strainer. We plated the trypan blue negative cells at 1 × 10⁴ cells/well in 24-well low-binding plates in 1mL sphere medium containing DMEM:F-12 (3:1) + 20 ng/ml rhEGF (R&D Systems, Minneapolis, MN, Cat # 236-EG-200), 20 ng/ml rh bFGF (R&D Systems, Cat# 233-FB-025 ), 1% B-27 (Thermo Fisher Scientifics, Cat# 17504–044), and 2 μg/ml heparin (Sigma-Aldrich, St Louis, MO, Cat# H3149 ) at 37°C and 5% CO2. We added 0.25 mL sphere medium to each well twice a week. We used secondary spheres for all experiments.
Lentiviral transduction
MiR-155 lentivirus inhibitor and non-target (NT) control were obtained from GeneCopoeia (Rockville, MD, USA). MiR-155 overexpression and mutant control were obtained from Applied Biological Materials Inc (Richmond, BC, Canada). For spheres, we transduced secondary Nf1fl/fl;DhhCre neurofibroma/DRG-derived spheres with purified shRNAs or NT control lentivirus (Sigma, St Louis, MO, USA) at multiplicity of infection (MOI) of 1:10–1:50 for 4 days and counted sphere numbers. For miR-155 overexpression in SC experiments, we incubated purified lentiviral particles with SCs at a MOI of 1:50 for 10 days in the presence of puriomycin (1ug/mL) and then plated cells for proliferation assays on days 0, 4, and 8. Relative or absolute miR-155 expression was confirmed by qRT-PCR (Supplemental information).
Western blots
Western blots were performed using antibodies recognizing MAF(1:100, Abcam, Cambridge, MA, Cat # Ab77071) and β-actin (1:10,000, Cell Signaling, MA, Cat# 5125S) as described in Supplemental information. Three different tumor/cell lysates were analyzed per antigen.
Anti-miR-155-PLGA-coated nanoparticle in vivo treatment
PNAs were synthesized by GenScript (Piscataway, New Jersey, USA). The PNAs sequences were: anti-miR-155: 5′-ACCCCTATCACAATTAGCATTAA-3′; anti-scramble: 5′-ACCCAATCGTCAAATTCCATATA-3′. Anti-miR-155 PLGA-coated nanoparticles (anti-miR-155-PNAs-NPs) were generated using a double emulsion solvent evaporation method as described (40). Nanoparticle surfaces were modified as described with the cell-penetrating peptide, penetratin (ANTP) (41).
For IVIS fluorescence reflectance images, we injected near-IR fluorescent (IR-780) loaded anti-miR-155-PNAs-NPs by tail vein at 0.9mg/kg. IVIS fluorescence reflectance images were performed at 0, 2, 4, 24, 48, 72, 96, and 120 hours after injection.
For efficacy analysis, we treated tumor-bearing mice for 2 months (14, 15). Randomization was to scramble control (n=5) or anti-miR-155-PNAs-NPs treatment (0.9mg/kg) (n=5) by tail vein injection 3X per week in the first week, then 2X per week for 7 weeks. Mice were weighed twice a week to monitor drug toxicities. Mice were sacrificed and analyzed 24 hours after the last dose.
Statistics and power analysis
We used a Gehan-Breslow-Wilcox log-rank test for Kaplan Meier analysis. We used mixed effects model analysis to analyze significance of tumor volume change as described (14, 15). We used unpaired 2-tailed Student’s t tests to analyze significance of cell proliferation, cell death, and quantification in tissue sections when two samples were compared. Data were reported as mean ± SEM. P<0.05 was considered significant.
Results
MiR-155 is overexpressed in mouse and human PNFs
We performed microRNA-microarray analysis on publicly available mRNA data from NF1 human PNF SCs (n= 11) and normal human SCs (NHSC, n=10) (42). We identified 43 miRs that showed >1.5-fold change in expression in PNF SCs compared to NHSCs (p<0.01). Among these, 30 miRs were upregulated and 13 were down-regulated (Figure 1A, Supplemental table 1). To identify miRs likely to be relevant to PNF formation or growth, we used miR expression microarray data to construct a potential DemiR-to-(target) DEG network. We identified miR-155 as deregulated and as having the highest miR-SVR score, suggesting that miR-155 might regulate some of the potential (correlated) target genes (Figure 1B). We confirmed relative miR-155 over-expression in mouse PNFs normalized to wild type DRG and in cultured PNF-derived spheres normalized to WT SCs, by qRT-PCR (Figure 1C). We also confirmed relative miR expression levels for 4 other upregulated miRs (miR-96, miR-126*, miR-409–5p and miR-382) that showed top miR-SVR scores, by qRT-PCR (Table 1).
Figure 1. MiR-155 is overexpressed in both mouse and human plexiform neurofibromas.
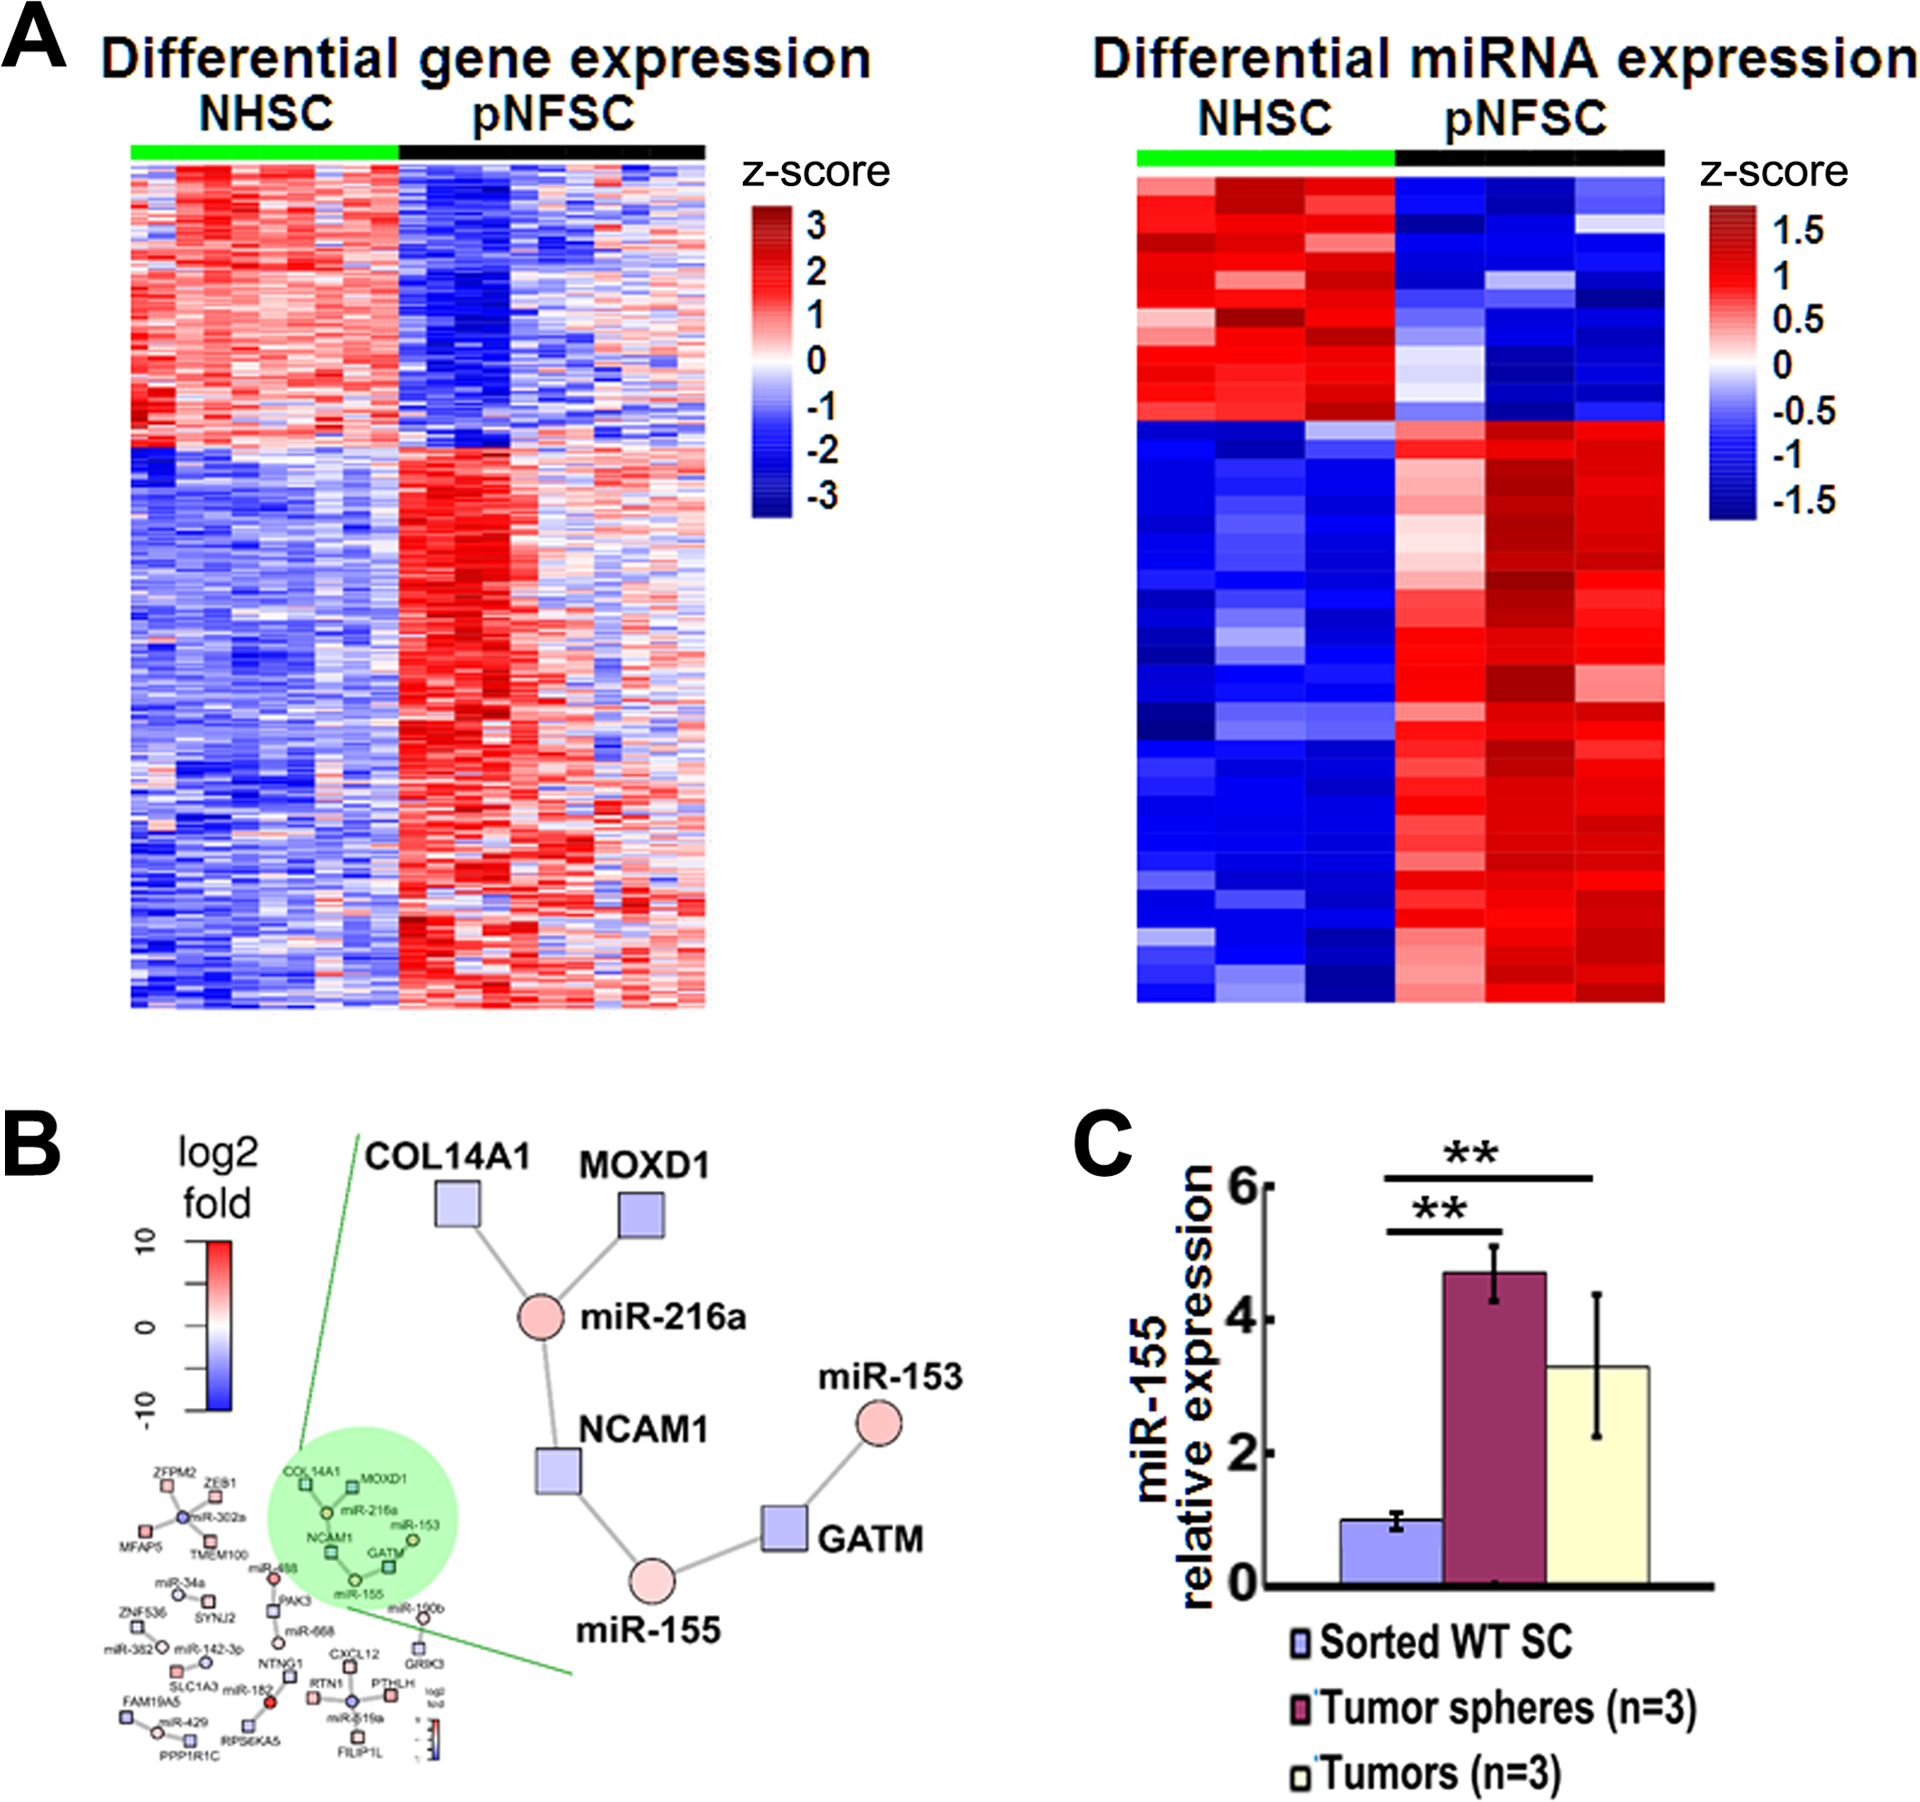
A. Heatmap of differential gene expression (left) and microRNA expression (right) in normal human Schwann cells (NHSC, n=10) and human plexiform neurofibroma Schwann cells (PNFSC, n=11). B. A miR-mRNA network analysis using miRs and PNF microarray data showing miR-155 was one of the top upregulated miRs with the highest miR-SVR score. C. MiR-155 relative expression in mouse PNFs and their derived spheres, normalizing to wild type (WT, n=3) SCs (for sphere) or dorsal toot ganglia (DRGs, for PNF, n=3), by qRT-PCR. **=p<0.01
Table 1. List of miRs confirmed by qRT-PCR in mouse plexiform neurofibromas and mouse plexiform neurofibroma-derived spheres.
Five upregulated miRs with top mirSVR scores were selected for confirmation in both mouse plexiform neurofibromas (PNFs) and mouse PNF-derived spheres. Wild type (WT) DRGs were used as controls for PNF normalization, WT SCs were used as controls for PNF-derived sphere normalization. To determine the MEK-association, mouse PNF-derived spheres were treated with an ERK inhibitor, SCH772984, at 0.5μM for 24 hours for qRT-PCR to check miR-155 relative mRNA expression, normalized to vehicle controls.
| miRNAs | Fold change in microarray | Fold change in qRT-PCR (normalized to wild type Schwann cells) | fold change after SCH772984 treatment | |
|---|---|---|---|---|
| mouse neurofibroma derived spheres | mouse neurofibromas | |||
| miR-96 | 7.73 | 3.3 ± 0.20 | 21.15 ± 17.27 | 1.03 |
| miR-126* | 3.14 | 2.8 ± 2.39 | 28.96 ± 25.46 | 0.59 |
| miR-155 | 3.10 | 4.69 ± 0.40 | 3.32 ± 0.54 | 0.44 |
| miR-409-5P | 2.62 | 2.38 ± 0.68 | 2.57 ± 1.06 | 0.86 |
| miR-382 | 2.24 | 2.18 ± 0.48 | 2.88 ± 2.04 | 1.02 |
Target(s) downstream of MEK/ERK might be envisioned to identify targetable genes and pathways with reduced toxicity for PNFs. To determine the correlation between these upregulated miRs and RAS/MEK/ERK activity, we treated mouse PNF-derived spheres with an ERK inhibitor, SCH772984, for 24 hours. Among the 5 miRs, 3 changed their relative expression levels after treatment as assessed by qRT-PCR (Table 1), suggesting an association between ERK activation and miR expression. Among these, miR-155 showed the highest fold change after SCH772984 treatment. Given that miR-155 has been extensively studied in other cancers but not in PNF (43–45), we focused on studying the function of this miR in PNF.
Pharmacological and genetic inhibition of miR-155 decreases mouse PNF sphere number in vitro
Neurofibroma sphere cultures provide a system to study tumor initiating cells. To test for a potential role of miR-155, we treated secondary mouse PNF derived- spheres with anti-miR-155 PNAs or a scramble control for 4 days. Treatment with the anti-miR-155-PNAs significantly decreased sphere numbers compared to the control (Figure 2A). QRT-PCR showed that PNAs significantly inhibited absolute miR-155 expression levels at 1μM or 5μM compared to scramble control. The absolute miR-155 expression levels were 808763 copy/ng (control) and 663323 copy/ng (anti-miR-155 PNAs) at 1 μM, and 759650 copy/ng (control) and 608870 copy/ng (anti-miR-155 PNAs) at 5μM (Figure 2B).To validate these results, we also tested the effect on sphere number using a lentivirus-expressed miR-155 inhibitor (miR-155i). We detected significantly decreased sphere numbers compared to the non-target (NT) control (Figure 2C) and qRT-PCR similarly confirmed the decreased relative or absolute expression of miR-155 compared to NT control (Figure 2D, Supplemental Figure 1).
Figure 2. MiR-155 regulates neurofibroma sphere numbers.
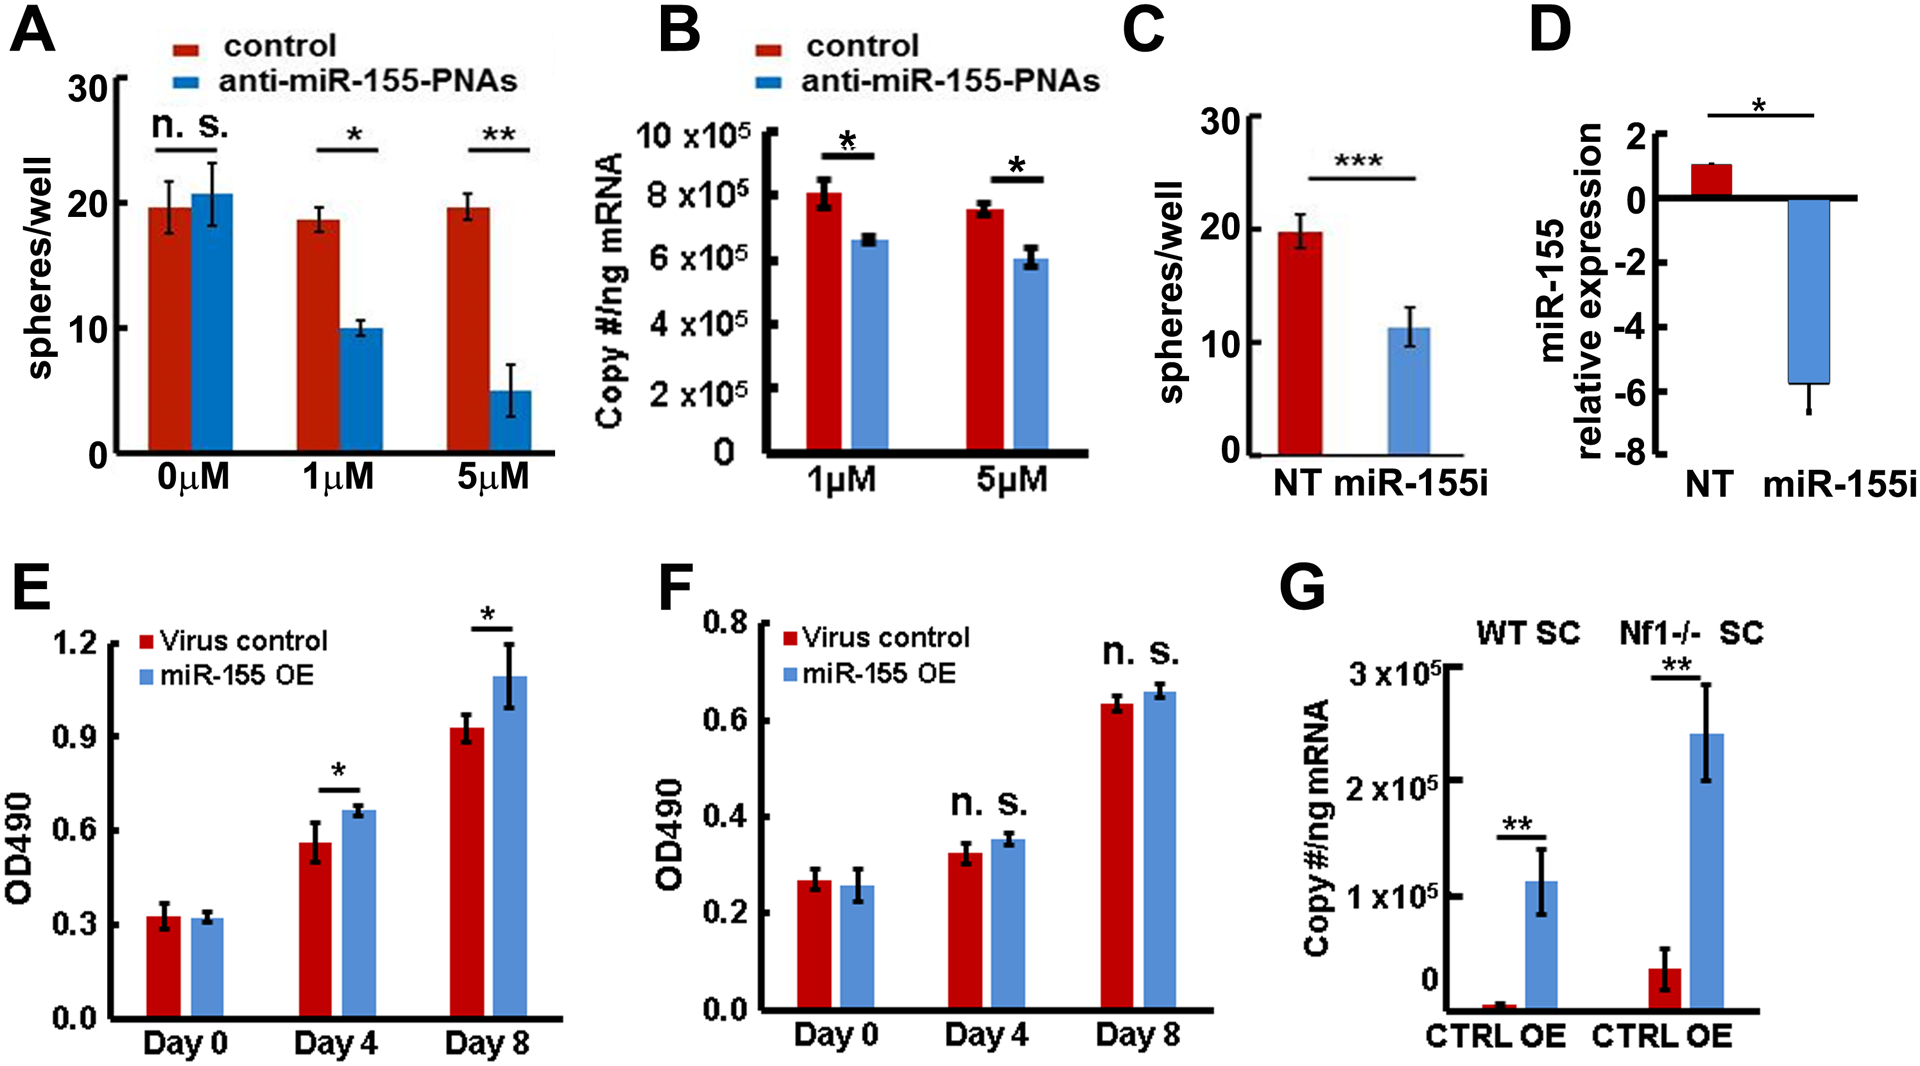
A. Anti-miR-155- peptide nucleic acids (PNAs) significantly inhibited mouse neurofibroma sphere numbers at 4 days. B. Anti-miR-155-PNAs inhibited absolute miR-155 expression (blue bars) in mouse neurofibroma derived spheres compared to scramble control (red bars) as confirmed by qRT-PCR. C. Lentivirus expressed miR-155 inhibitor (miR-155i) significantly inhibited mouse neurofibroma sphere numbers by 7 days (blue bar) compared to non-target control (NT, red bar). D. Lentivirus expressed miR-155 inhibitor (miR-155i) significantly inhibited miR-155 expression in mouse neurofibroma derived spheres (blue bar) compared to NT control (red bar) as confirmed by qRT-PCR. E. Overexpression of miR-155 (blue bars) increased mature Nf1−/− SC growth compared to control (red bars). F. Overexpression of miR-155–5P (blue bars) did not increase mature wild type SC growth compared to control (red bars). G. Absolute miR-155 expression in miR-155–5P overexpression (miR-155 OE, blue bars) or miR-155–5P mutant control (CTRL, red bars) in wild type SCs and Nf1−/− SCs. Three independent experiments were performed in A- G. *p<0.05, **p<0.01, n. s =no significant difference.
Overexpression of miR-155 increases SC proliferation in the context of loss of Nf1
To test whether miR-155 also plays a role in mature SCs, we overexpressed mature mouse miR-155–5P (designated miR-155) or mutant miR-155–5P (designated control) in E12.5 Nf1+/+ WT and Nf1−/− SCs using a miR-155 overexpression lentivirus. Overexpression of miR-155 increased Nf1−/− SC proliferation (Figure 2E) compared to mutant control but not that of Nf1+/+ WT SCs (Figure 2F), suggesting that miR-155 might selectively function as an onco-miR in the context of loss of Nf1. We confirmed absolute miR-155 expression by qRT-PCR. The absolute miR-155 expressions were 5826 copy/ng (control) and 112233 copy/ng (miR-155 OE) in WT SCs, and 36414 copy/ng (control) and 239934 copy/ng (miR-155 OE) in Nf1−/− SCs (Figure 2G).
Global deletion of miR-155 prolongs mouse survival and delays mouse PNF formation in vivo
To test if miR-155 plays a role in PNF formation or growth in vivo, we bred the miR-155 global deletion mouse (miR-155−/−) (26) to Nf1fl/fl and DhhCre mice. We obtained miR-155−/−;Nf1fl/fl;DhhCre mice after two generations. Kaplan-Meier survival analysis revealed a significant survival difference between miR-155−/−;Nf1fl/fl;DhhCre mice and littermates miR-155+/−;Nf1fl/fl;DhhCre and miR-155−/−;Nf1fl/+;DhhCre mice (p<0.01) (Figure 3A). It is not possible to obtain littermate miR-155/+/+;Nf1fl/fl;DhhCre mice in this breeding strategy, but we did detect significantly longer survival comparing the miR-155−/−;Nf1fl/fl;DhhCre mice with previously published cohorts of miR-155+/+;Nf1fl/fl;DhhCre mice that harbored similar genetic background (6). In a separate cohort, no significant difference was detected in survival time between miR-155+/+;Nf1fl/fl;DhhCre and miR-155+/−;Nf1fl/fl;DhhCre mice (not shown), justifying the use of heterozygous mice as controls. We quantified total tumor burden by volumetric measurement of MRI scans, followed by mixed effects analysis of tumor volume. Tumor size was smaller at 7- and 12-month in miR-155−/−;Nf1fl/fl;DhhCre mice (n= 13) compared to littermate controls (miR-155+/−;Nf1fl/fl;DhhCre, n=11) (p<0.05, Figure 3B).
Figure 3. Global deletion of miR-155 prolongs survival and decreases tumor number and size in the Nf1fl/fl;DhhCre neurofibroma mouse model.
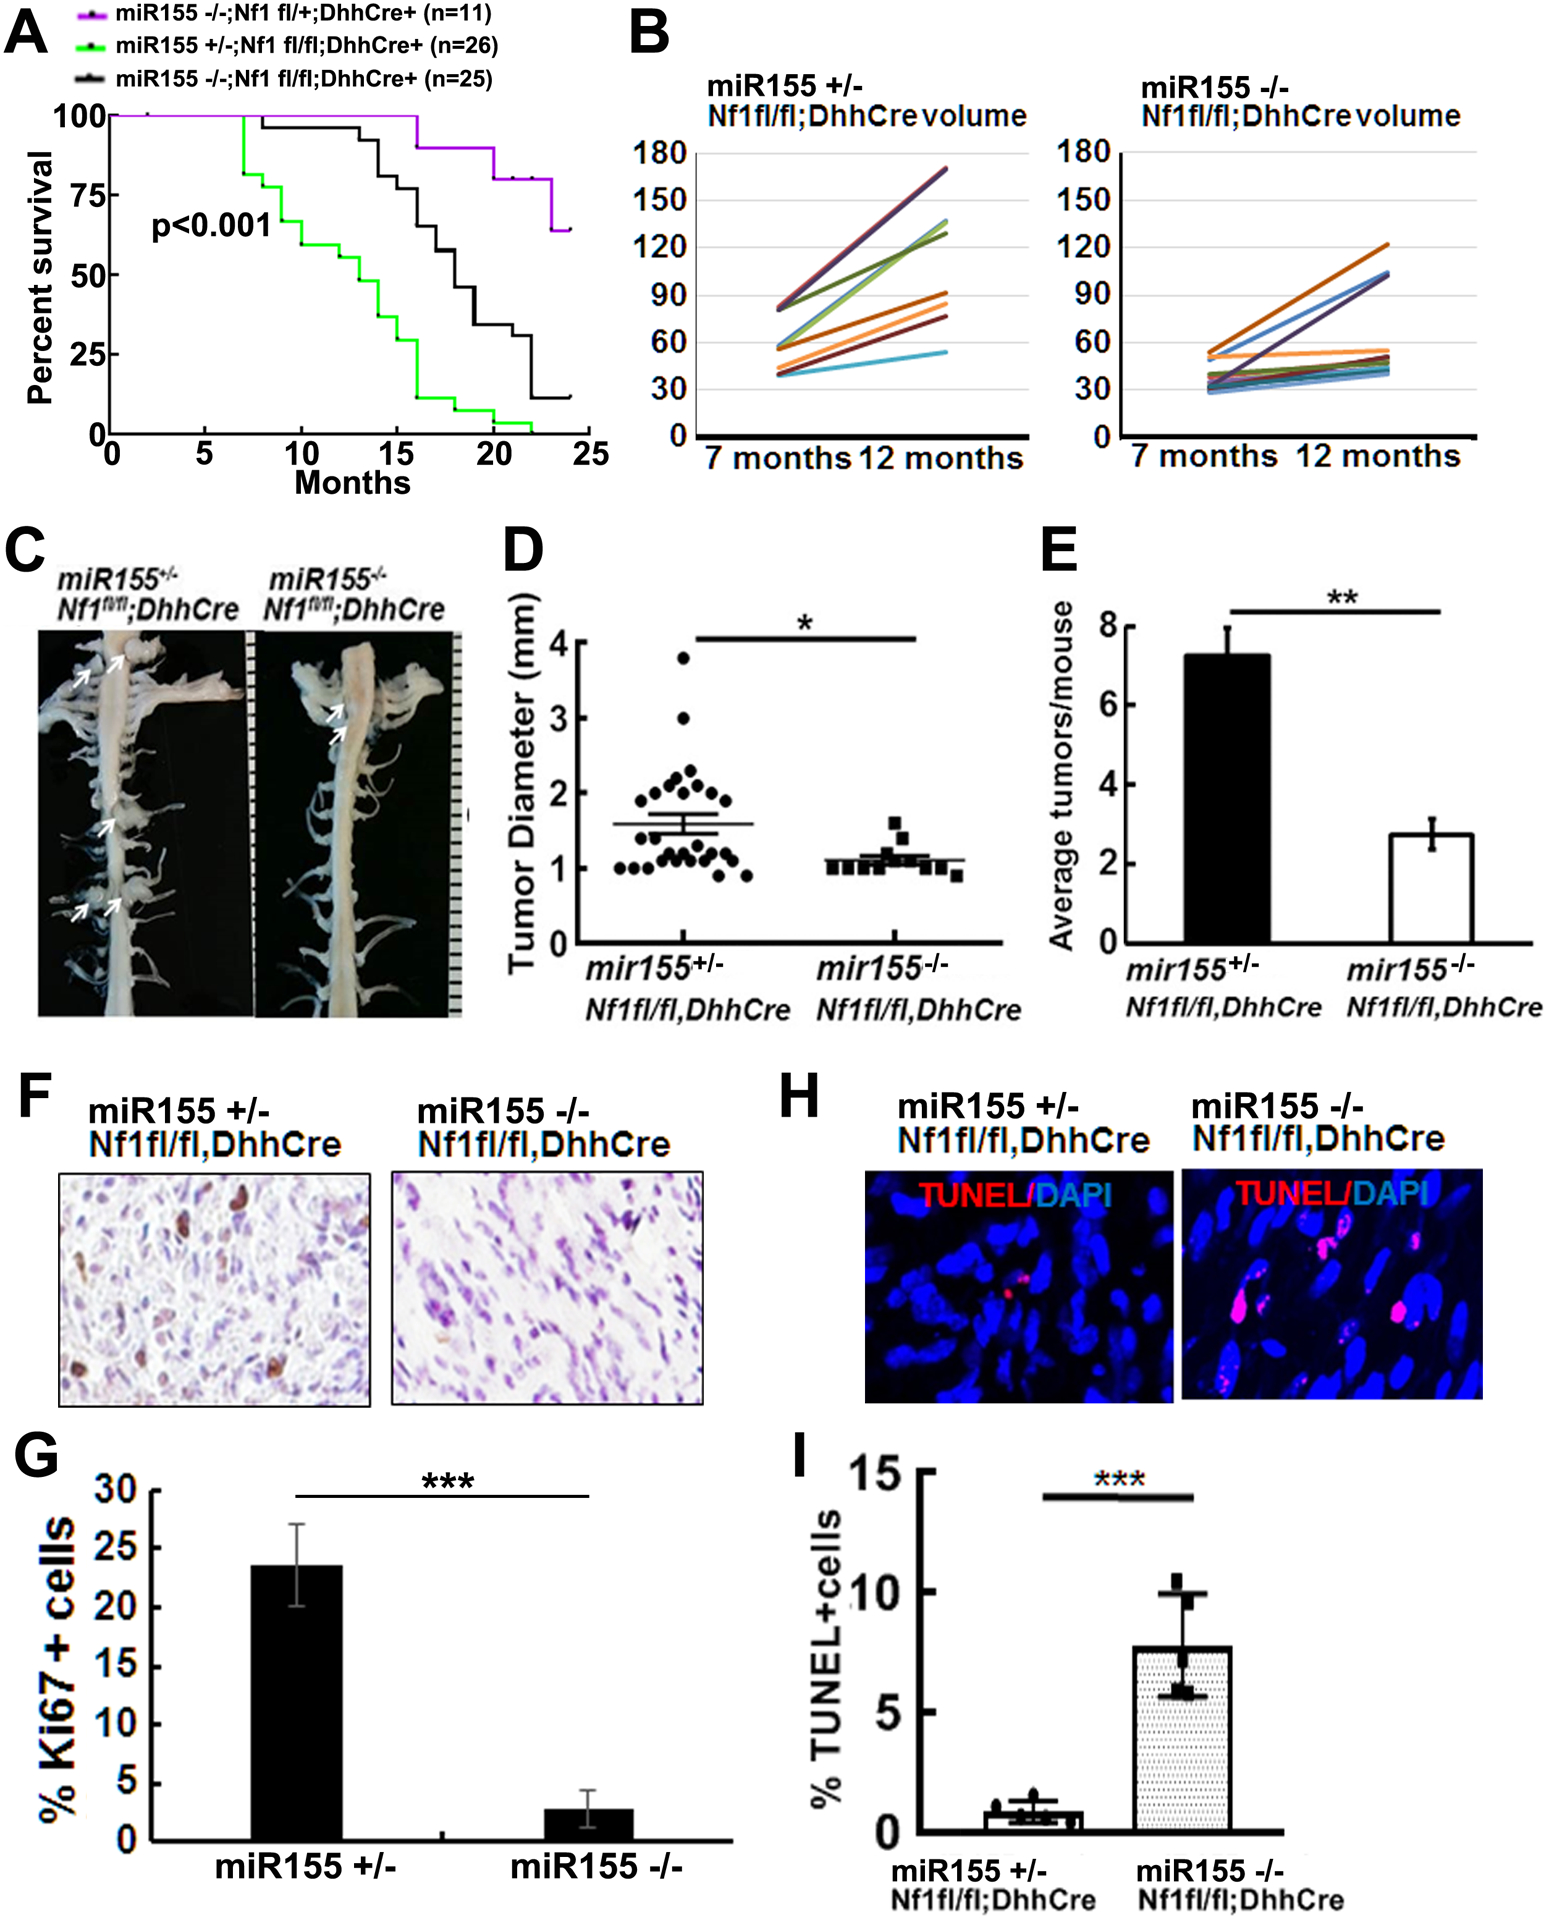
A. Kaplan-Meier survival curve. Purple: miR-155 −/−;Nf1fl/+;DhhCre, Green: miR-155 +/−;Nf1fl/fl;DhhCre, Black: miR-155 −/−;Nf1fl/fl;DhhCre+. B. Tumor volume for each mouse volume at 7- and 12-month in littermate control miR-155 +/−;Nf1fl/fl;DhhCre mice) (left) and miR-155 −/−;Nf1fl/fl;DhhCre+ (right). C. Representative gross dissections of para-spinal PNFs and nerve roots in 7-month of age miR-155 +/−;Nf1fl/fl;DhhCre (left) and miR-155 −/−;Nf1fl/fl;DhhCre+ (right). White arrows pointed to tumors. Ruler showing 1 mm markings. D. Tumor diameter in the miR-155 +/−;Nf1fl/fl;DhhCre mice (circle, n=4 mice with 28 tumors) and miR-155 −/−;Nf1fl/fl;DhhCre mice (square, n=4 mice with 12 tumors) at 7-month. E. Average tumor number per mouse at 7-month in the miR-155 +/−;Nf1fl/fl;DhhCre mice (black bar, n=4) and miR-155 −/−;Nf1fl/fl;DhhCre+ (white bar, n=4). F. Representative pictures of cell proliferation shown as Ki67+ cells in miR-155 +/−;Nf1fl/fl;DhhCre mice (left) and miR-155 −/−;Nf1fl/fl;DhhCre mice(right). G. Quantification of percent of Ki67+ cells in miR-155 +/−;Nf1fl/fl;DhhCre mice (left black bar, n=5) and miR-155 −/−;Nf1fl/fl;DhhCre mice (right black bar, n=5). H. Representative pictures of cell death shown as TUNEL+ cells (red) in miR-155 +/−;Nf1fl/fl;DhhCre mice (left) and miR-155 +/−;Nf1fl/fl;DhhCre mice (right). I. Quantification of percent TUNEL+ cells in miR-155 +/−;Nf1fl/fl;DhhCre mice (white bar, n=5) and miR-155 −/−;Nf1fl/fl;DhhCre mice (grey bar, n=5). Statistics: B: mixed model analysis, D, E, G and I: unpaired student t test. *=p<0.05, **=p<0.01, ***=p<0.001.
We previously showed that all Nf1fl/fl;DhhCre mice develop paraspinal PNFs (16). If miR-155 contributes to PNF initiation, then we should detect reduced tumor numbers in miR-155−/−;Nf1fl/fl;DhhCre mice. We performed whole body dissection on 7-month miR-155−/−;Nf1fl/fl;DhhCre (n=5) and littermate controls (miR-155+/−;Nf1fl/fl;DhhCre mice, n=5). On gross imaging, we detected smaller tumors in miR-155−/−;Nf1fl/fl;DhhCre mice (Figure 3C, right) compared to age-matched littermates controls (Figure 3C, left). Consistent with volumetric MRI scan results, tumor diameter measured on spinal root dissected sections was also significantly smaller in miR-155−/−;Nf1fl/fl;DhhCre mice versus miR-155+/−; Nf1fl/fl;DhhCre mice at 7-months of age (Figure 3D). The average PNF number/mouse was significantly decreased in miR-155−/−;Nf1fl/fl;DhhCre mice versus miR-155+/−; Nf1fl/fl;DhhCre mice at 7-month of age (Figure 3E).
H&E staining of paraffin sections showed that all tumors were GEM-grade 1 PNF, a characteristic of the Nf1fl/fl;DhhCre model (not shown). To determine the potential mechanisms underlying altered tumor size, we performed Ki67 and TUNEL staining on 5-month Nf1fl/fl;DhhCre and miR-155−/−;Nf1fl/fl;DhhCre mouse DRGs/tumors from a different cohort of mice. Ki67+ - proliferating cells numbers in PNF tissue sections were significantly decreased in miR-155−/−;Nf1fl/fl;DhhCre PNF compared to miR-155+/−;Nf1fl/fl;DhhCre tumors (Figure 3F, 3G, p<0.001). The numbers of apoptotic cells (TUNEL+) were slightly increased in miR-155−/−;Nf1fl/fl;DhhCre mouse PNFs (Figure 3H, 3I, p <0.001). Therefore, similar to MEK inhibition (15–17), global deletion of miR-155 regulates Nf1-deficient SC proliferation in PNFs.
An AP-1 element binds to the miR-155 promoter to activate miR-155 expression
Activator protein-1 (AP-1) transcription factors are a major target of RAS/MAPK signaling. To test if miR-155 expression is regulated by MEK/ERK in PNF-derived cells, we treated mouse PNF-derived spheres with PD0325901, an allosteric MEK inhibitor, for 24 hours. MiR-155 expression level was decreased significantly (Figure 4A). To determine if miR-155 is regulated by AP-1 transcription factors, we treated mouse PNF-derived spheres with a dominant-negative AP-1 (c-Fos) lentivirus for 3 days. QRT-PCR showed that miR-155 expression was similarly decreased (Figure 4B). We further identified a putative AP-1 family member, c-Fos, with a binding site 11kb upstream of the mouse miR-155 transcriptional start site by a bioinformatics search (Figure 4C). When Nf1fl/fl;DhhCre PNF DNA was subjected to chromatin immunoprecipitation (ChIP) using an anti-c-Fos antibody, we detected that c-Fos was bound to this miR-155 promoter region site, as confirmed by PCR (Figure 4D). These results suggest that miR-155 is directly activated by AP-1 in sphere cells.
Figure 4. MEK regulates miR-155 expression through AP-1 binding to miR-155.
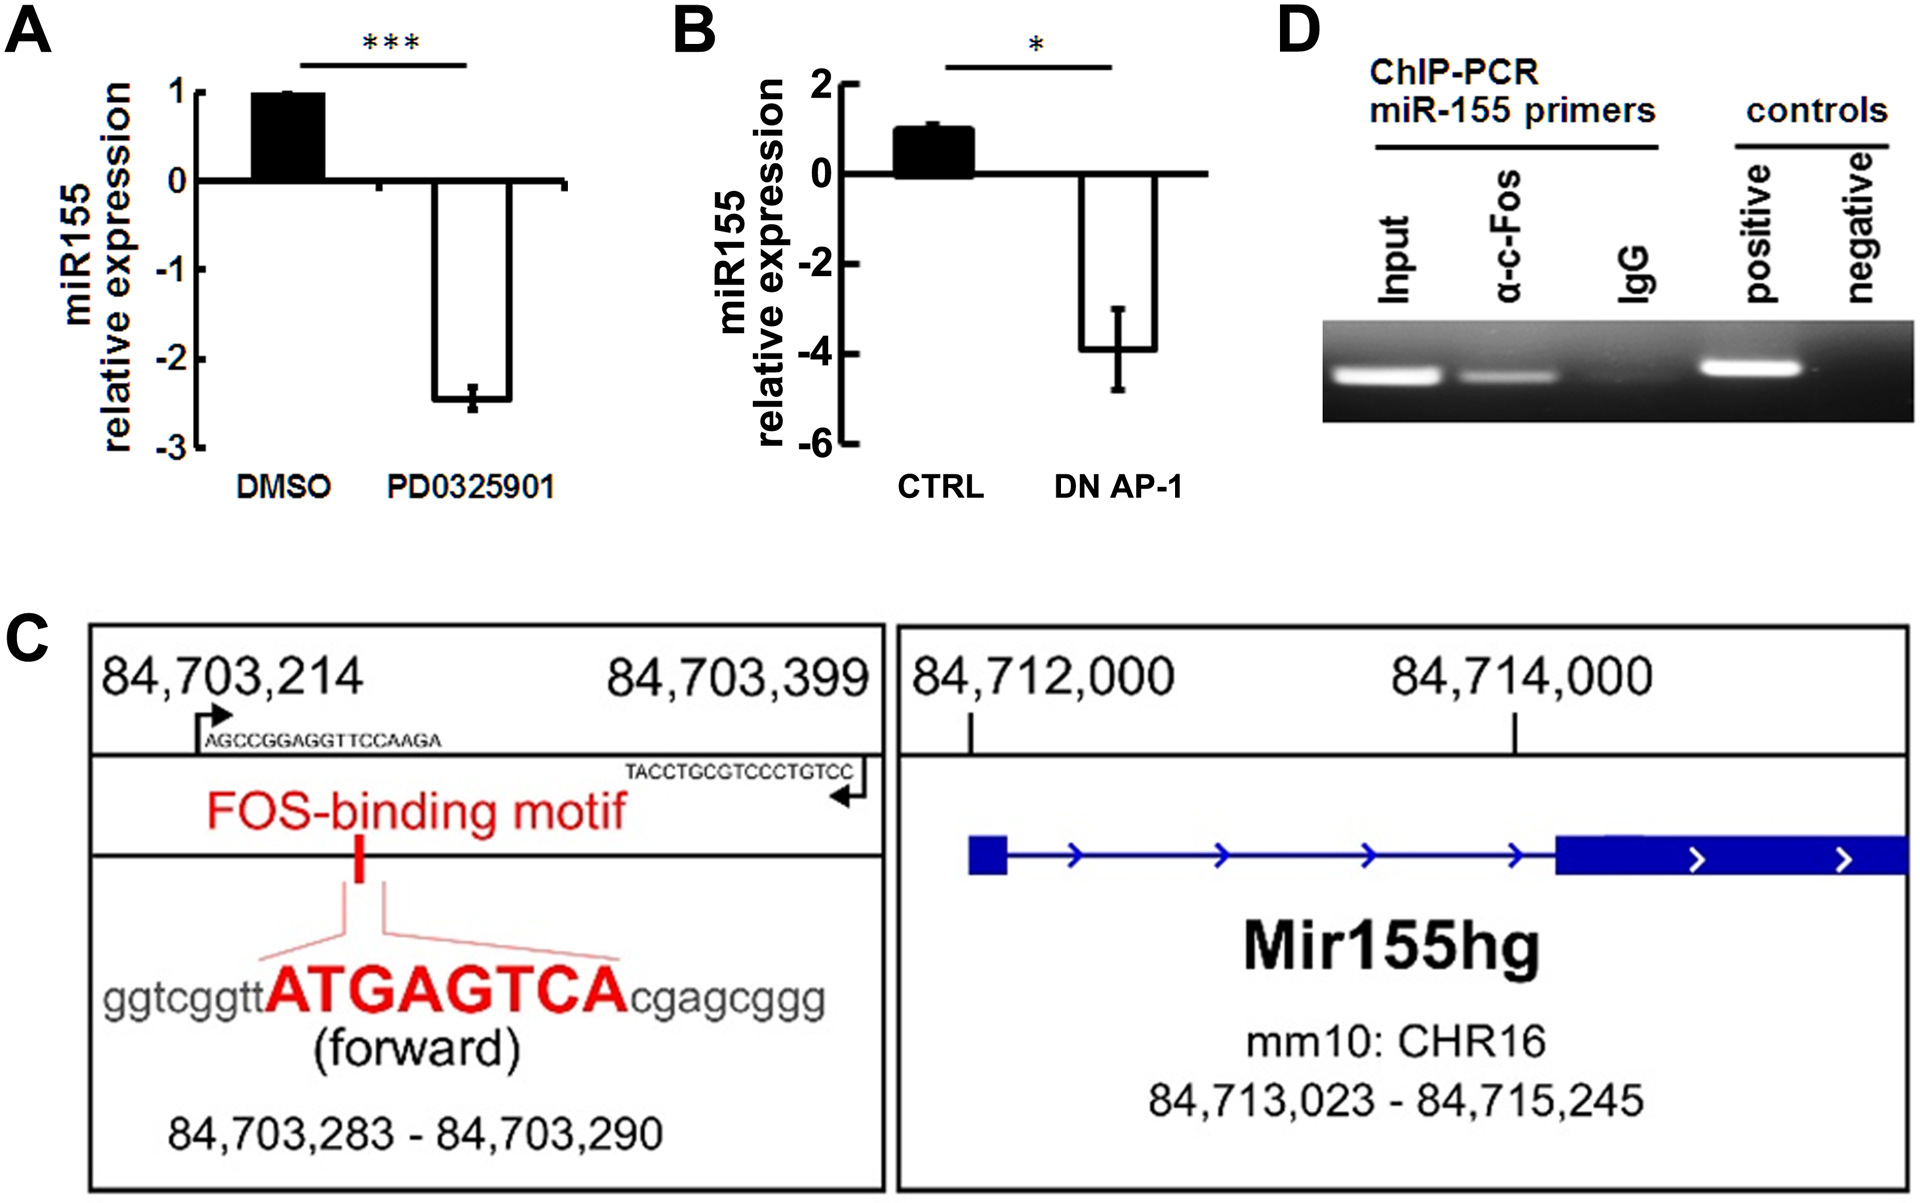
A. qRT-PCR showing miR-155 is downregulated after a MEK inhibitor, PD0325901, treatment (n=3/group). B. qRT-PCR showing that miR-155 is downregulated after dominant negative AP-1 lentivirus treatment (n=3/group). C. Schematic, exon 1 mouse miR-155 gene (forward strand, chr16: 84,713,023 – 84,715,245). One putative AP-1 binding motif is between Exon 1 and Exon 2; the binding motif sequence is shown in bold red. D. Representative image of CHIP PCR showing that c-Fos binds to miR-155 promoter. Three independent experiments were performed.
Maf is a target of miR-155 in PNF-derived spheres
MiRs can regulate multiple targets to exert their functions. To define potential miR-155 targets involved in PNFs, we performed RNA sequencing on miR-155−/−;Nf1fl/fl;DhhCre mouse PNFs and age/background matched Nf1fl/fl;DhhCre mouse PNFs. We obtained a differential expressed gene list by comparing these two genotypes’ gene expression data (Supplemental table 2). We also used miRanda prediction to search for miR targets and obtained a list of potential targets of miR-155 among these genes. Comparing the miR-155 predicted targets with the miR-155−/−;Nf1fl/fl;DhhCre vs Nf1fl/fl;DhhCre RNAseq differential gene expression list and to two previously published microarray/RNAseq data (46, 47), we identified 13 shared genes (Figure 5A). Among these, 2 genes were down-regulated and 11 genes were up-regulated in the miR-155−/−;Nf1fl/fl;DhhCre vs Nf1fl/fl;DhhCre RNAseq genes (Figure 5B). By comparison of mir-SVR score, gene expression change, and miR-to-gene network, we identified Maf as the top co-regulated gene.
Figure 5. Maf is a direct target of miR-155.
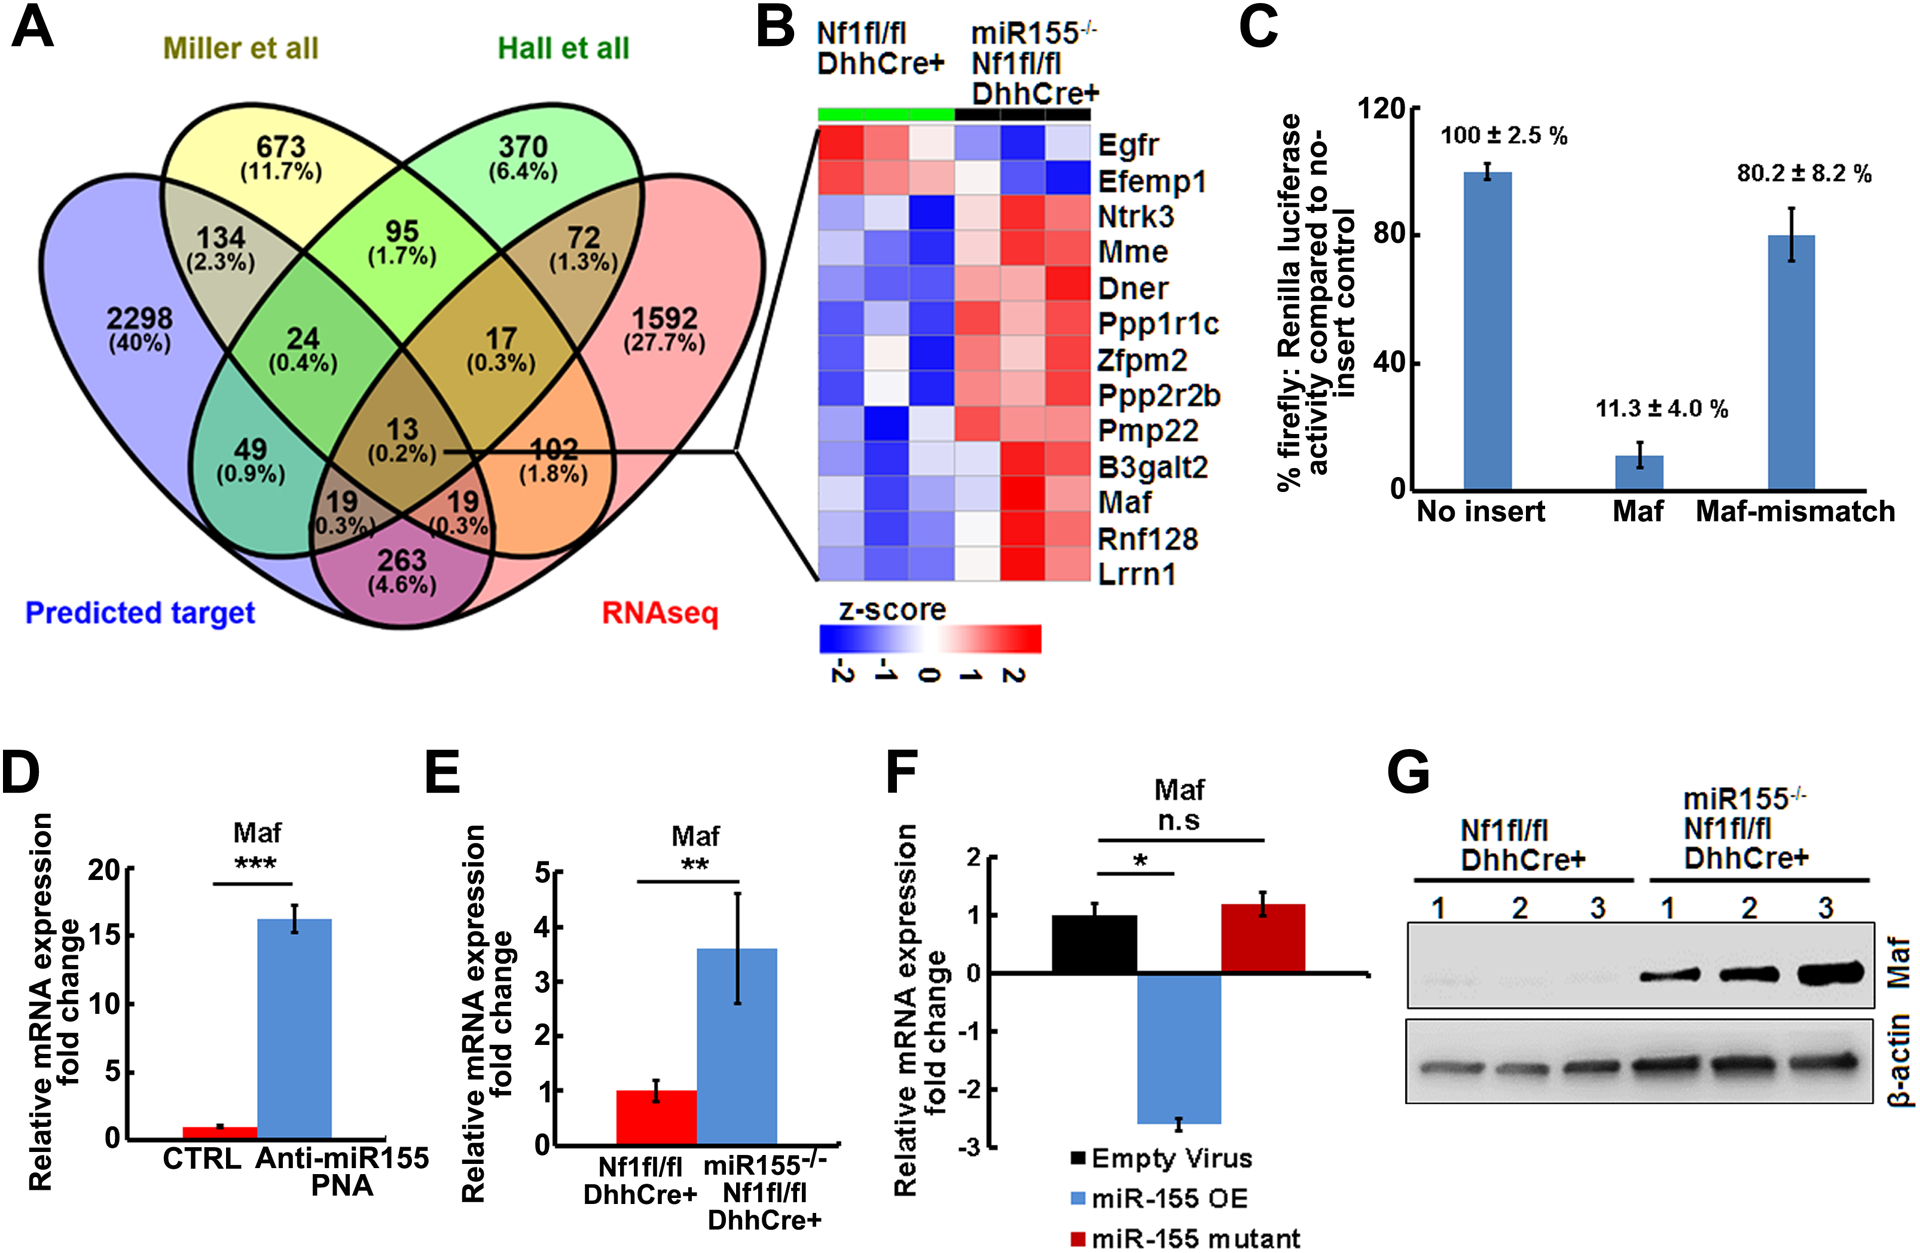
A. Venn diagram showing the overlaps of genes between the predicted miR-155 targets, miR-155−/−;Nf1fl/fl;DhhCre vs Nf1fl/fl;DhhCre PNF RNAseq differential expressed genes, and published differential expressed genes on mouse PNF microarray (Miller et al) or RNA sequencing (Hall et al). B. Heap map of 13 shared genes in miR-155−/−;Nf1fl/fl;DhhCre vs Nf1fl/fl;DhhCre PNF RNAseq. C. Luciferase reporter assay showing Maf was a target of miR-155.
D. qRT-PCR showing Maf relative mRNA expressions in anti-miR-155-PNA treated mouse PNF-derived spheres (blue bar, n=3) compared to scramble control (CTRL,red bar, n=3). E. qRT-PCR of the relative mRNA expression in miR-155−/−;Nf1fl/fl;DhhCre mice (blue bar, n=3) normalized to Nf1fl/fl;DhhCre mice (red bar, n=3). F. qRT-PCR showing Maf relative mRNA expressions in miR-155–5P overexpression (miR-155 OE) in WT or Nf1−/− SCs compared to mutant miR-155–5P control (CTRL). Three independent experiments were performed. G. Representative Western blot of MAF on tumors from Nf1fl/fl;DhhCre and miR-155−/−;Nf1fl/fl;DhhCre mice (n=3/group). Beta-actin was used as loading control.
We used the pmirGLO dual-luciferase miRNA target expression vector system to confirm whether Maf is a target of miR-155. We cloned the predicted best Maf binding motif or mutated motif into this vector and performed luciferase reporter assay using immortalized wild type mouse SCs that are derived from the Nf2fl/fl mouse model for transfection. Here, firefly luciferase is the primary reporter gene and reduced firefly luciferase expression indicates the binding of endogenous or introduced miRNAs to the cloned miRNA target sequence. The firefly luciferase was activated by CMV promoter in the presence of miR-155 mimic. CMV alone caused luciferase transcriptional activity, which was markedly decreased by miR-155 Maf insertion (11.3 ± 4.0 %). Slightly decreased luciferase activity was detected in miR-155 Maf mismatch (80.2 ± 8.2 %) (Figure 5C), suggesting that Maf is a direct target of miR-155.
As predicted by the RNAseq results, Maf mRNA was increased after treatment of mouse PNF-derived spheres with anti-miR-155 PNAs (Figure 5D) and in vivo in miR-155−/−;Nf1fl/fl;DhhCre mouse tumors/DRGs normalized to Nf1fl/fl;DhhCre mouse PNFs (Figure 5E). Conversely, when normalized to empty vector virus control, overexpression of miR-155–5P in Nf1−/− SCs decreased Maf expression to 2.6 folds, while no significant change (1.2-fold) of Maf expression was detected in the mutant control (Figure 5F). Furthermore, Western blots showed that MAF protein expression was increased in the miR-155−/−;Nf1fl/fl;DhhCre PNFs compared to Nf1fl/fl;DhhCre PNFs (Figure 5G). These results indicate that Maf is a direct target of miR-155 in PNF.
Administration of anti-miR-155-PNAs-NPs in vivo marginally decreases tumor number but does not reduce the growth of established tumors
We tested whether miR-155 might also be a therapeutic target in PNFs using a nanoparticle delivery system, as systemic delivery of anti-miR-155-PNAs encapsulated in polymer nanoparticles slowed the growth of pre-B-cell lymphomas in vivo (24). We first tested if it was possible to deliver anti-miR-155-PNAs to PNFs. We injected anti-miR-155-PNAs-NPs containing near-IR fluorescent dye (IR-780). This dye has high tissue penetration and can be viewed using detection in an IVIS machine after tail vein injection to mice. We detected the highest fluorescence radiance at 96 hours after a single injection (Figure 6A). We also imaged individual organs harvested from mice injected intravenously with anti-miR-155-PNAs-NPs IR-780. We found that fluorescence remained enriched in tumors and in lungs 5 days after injection (Figure 6B). To determine whether the PNAs were also retained within cells, we injected TAMRA-labeled anti-miR-155-PNAs-NPs, which can be viewed by confocal microscopy, at 0.9 mg/kg by tail vein injection. Four days after injection we collected PNFs. PNAs were enriched in PNF cells, as evidenced by co-staining with FITC phalloidin-labeled actin and DAPI-labeled nuclei (Figure 6C).More importantly, miR-155 expression decreased and the inhibition reached its highest levels at 72 hours after the single injection (Figure 6D).
Figure 6. Administration of anti-miR-155-PNAs-NPs in vivo marginally reduces tumor numbers.
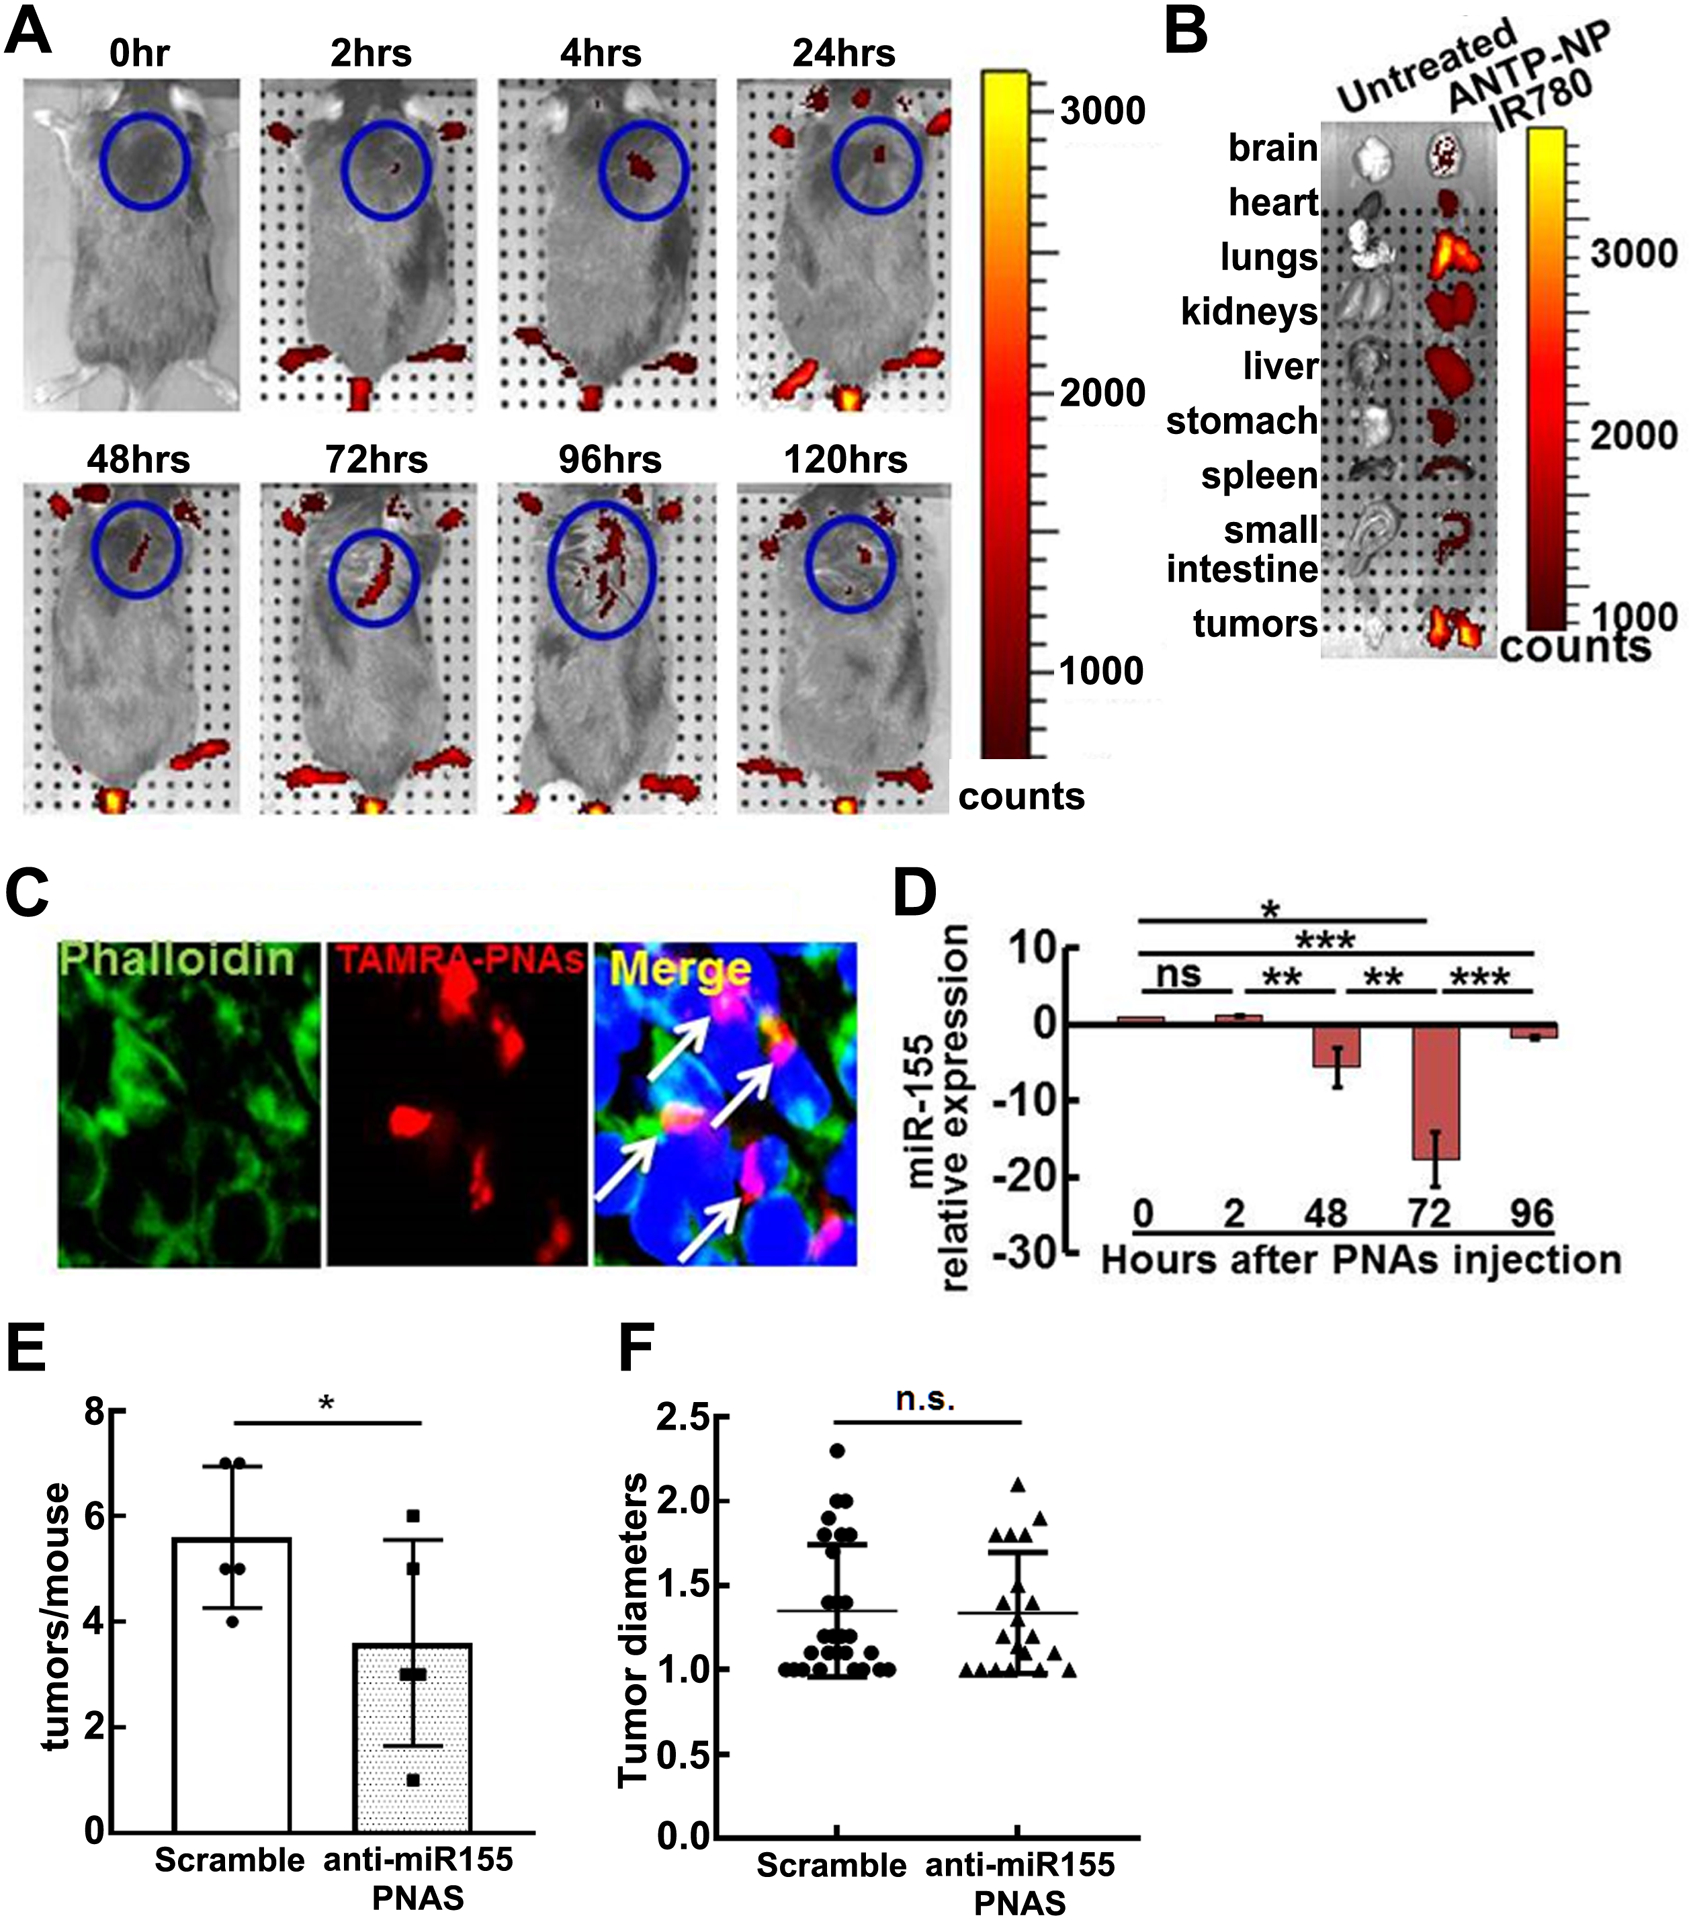
A. Representative IVIS fluorescence reflectance images of mice injected intravenously with IR-780 loaded anti-miR-155-PNAs-NPs at 0, 2, 48, 72, and 96 hours after injection (0.9 mg/kg) of anti-miR-155-PNAs . Fluorescence was quantified and expressed as radiance (x109 photon / sec/ cm2). B. Representative IVIS image of organs harvested from mice with or without anti-miR-155-PNAs-NPs IR-780 120-hrs after injection. C. Confocal microscopy of TAMRA-labeled anti-miR-155-PNAs-NPs localization in tumors. Arrow: cells with PNAs-uptake. Red, TAMRA-labeled PNAs; Green, FITC phalloidin-labeled actin; Blue, labeled nuclei. D. QRT-PCR of miR-155 relative expression on tumors at 0, 2, 48, 72, and 96 hours after one dose (0.9 mg/kg) of anti-miR-155-PNAs-NPs injection as normalized to vehicle controls (n=3/group). E. Average tumors/mouse in scramble (white bar, n=5) and anti-miR-155-PNAs –NPs (grey bar, n=5). F. Tumor diameters in scramble (black circle, n=28) and anti-miR-155-PNAs (black triangle, n=20).
Given these encouraging results, we treated a small group of mice with anti-miR-155-PNAs-NPs or scramble control for 2 months by tail vein injection. Gross dissection showed marginally decreased tumor number (Figure 6E) but no change in tumor diameter (Figure 6F) compared to control. Immunohistochemistry showed decreased cell proliferation as detected by Ki67 in anti-miR-155-PNAs-NPs treated tumors compared to scramble controls (Figure 7A, 7B) but no effect on cell death as detected by TUNEL (not shown), supporting a role for miR-155, like MEK, in PNF cell proliferation. Immunofluorescence staining showed that MAF expression increased significantly in anti-miR-155-PNAs-NPs treated tumors compared to scramble controls (Figure 7C, 7D), confirming indirectly that the anti-miR-155-PNAs-NPs was hitting its target. This preliminary result is consistent with the idea that anti-miR-155-PNAs-NPs might affect tumor growth speed but is unlikely sufficient to significantly reduce the size of established tumors.
Figure 7. Anti-miR-155-PNAs effectively inhibits cell proliferation and increased target protein expression.
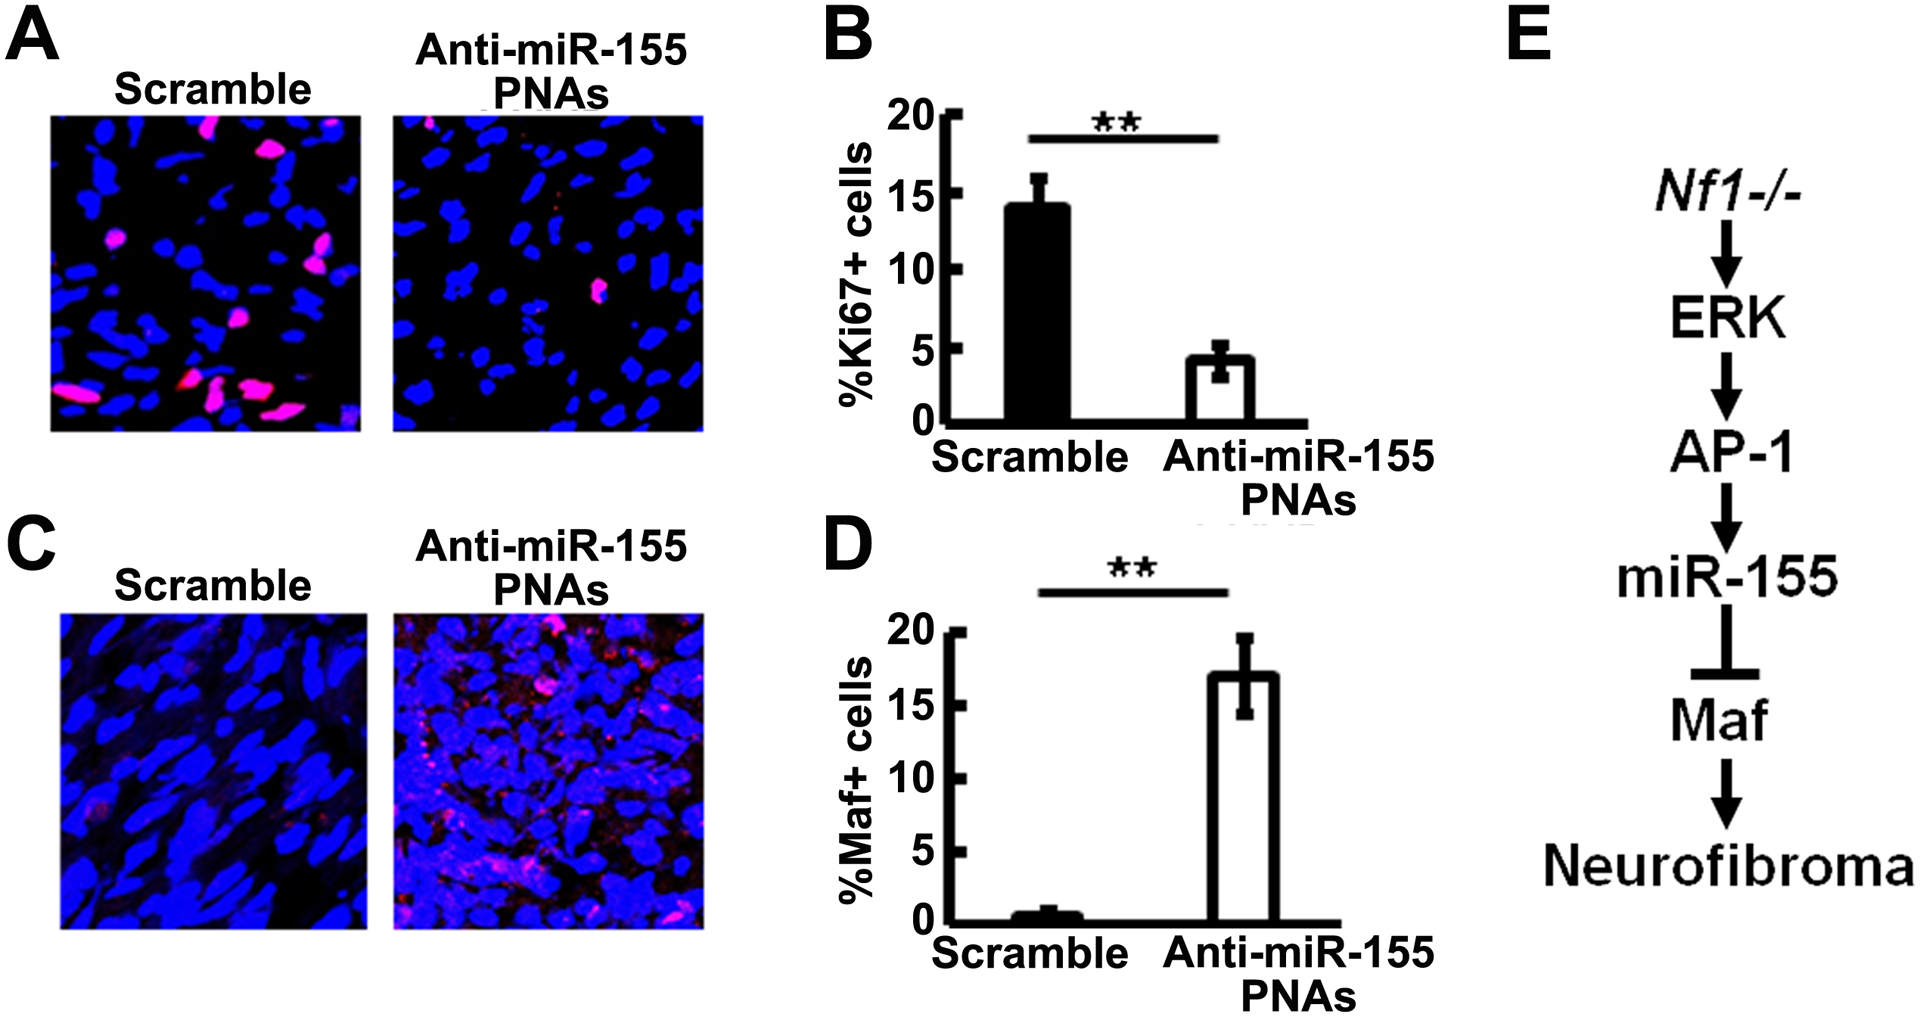
A. Representative immunofluorescence pictures of Ki67+ staining (Red) in scramble (left) and anti-miR-155-PNA (right) treated mouse plexiform neurofibromas. DAPI (blue) was used for nuclei labelling. B. Quantification of Ki67+% cells in scramble (black bar, n=3) and anti-miR-155-PNA (white bar, n=4) treated mouse plexiform neurofibromas. C. Representative immunofluorescence pictures of MAF+ staining (Red) in scramble (left) and anti-miR-155-PNA (right) treated mouse plexiform neurofibromas. DAPI (blue) was used for nuclei labelling. D. Quantification of MAF+% cells in scramble (black bar, n=3) and anti-miR-155-PNA (white bar, n=4) treated mouse plexiform neurofibromas. E. Schematic showing a model of PNF formation: Loss of Nf1 in SC/SCP elevated MEK/ERK levels to activate AP-1. AP-1 binds to miR-155, which in turn regulates one of its main targets, Maf, to contribute to PNF formation.
Discussion
We identified that miR-155 was overexpressed in PNF SCs by microRNA-microarray analysis and provided several lines of evidence suggesting that miR-155 acts an oncogene in the context of loss of Nf1. First, miR-155 expression was regulated by elevated MAPK signaling in NF1 mutant cells. Second, miR-155 contributed to SC precursor growth in spheres, a model of tumor initiation, and to mature SC proliferation. Third, global deletion of miR-155 in a mouse model delayed PNF growth and prolonged mouse survival. Finally, nanoparticles targeting miR-155 entered PNFs and modulated miR-155 expression and tumor cell proliferation, supporting the hypothesis and suggesting that this approach may be useful to deliver therapeutics.
MiR-155 has been studied in several cancers (43–45). MiR-155 is overexpressed in human B cell lymphomas (48) and targeted B-cell overexpression of miR-155 or miR- 150 drives development of B-cell lymphoma (27, 49), both of which suggest that miR-155 is an oncogene contributing to lymphomagenesis. A recent meta-analysis from 6 published articles (9 studies) containing 1259 glioma patients shows that miR-155 has a prognostic role in glioma patients, in which high miR-155 expression is linked to poor overall survival in gliomas (50). Using qRT-PCR, we showed that miR-155 mRNA expression is similarly elevated in mouse PNF SC, mouse PNF SCP-like cells, and in human PNF SC. We studied miR-155 because it showed the highest miR-SVR (target gene) score among the SC miRs analyzed and its expression was MAPK-associated. MiR-155 overexpression did not noticeably affect WT SCs, which have lower levels of RAS/MEK/ERK signaling than NF1-mutant SCs (51). This result suggests that miR-155 might functions as an onco-miR in NF1 deficient cells, but further experiments are needed for evidence. Of note, ERK activates and recruits AP-1 to miR-155 promoter to increase the transcription of miR-155 (52). NF1 is RAS-GAP and MAF is regulated through RAS/MAPK/AP-1 signaling in malignant peripheral nerve sheath tumor (MPNST) cell lines (53). We showed that miR-155 is directly activated by AP-1 in PNF-derived sphere cells and identified the AP-1 target Maf as an mRNA regulated by miR-155 in a MEK-dependent manner. Maf protein plays a role in the regulation of several cellular processes, including embryonic lens fiber, kidney, liver, and pancreatic duct cell development, increased T-cell susceptibility to apoptosis, and chondrocyte terminal differentiation (54). MAF serves either as an oncogene or as a tumor suppressor, depending on the cell context. Transcription factor MAF is a checkpoint that programs macrophages in lung cancer (55). The p53 transcription factor negatively regulates Maf, a target of miR-155, to modulate microglia behavior in in acute and chronic neuroinflammation (56).
We found that Maf mRNA increased in both mouse PNF-derived spheres treated with anti-miR-155 PNAs and in miR-155−/−;Nf1fl/fl;DhhCre mouse tumors/DRGs. This identification of Maf as a target of miR-155 in the SC lineage is consistent with findings in other cell types. In normal SCs, MAPK signaling stabilizes the MAF protein, resulting in enhanced cell differentiation (57). When MAPK signaling is elevated in the setting of Nf1 loss, the MAF stabilization may be counteracted by MAF targeted by miR-155, potentially affecting aspects of cell differentiation. Mature miR-155 of mouse (MIMAT0000165) and human (MIMAT0000646) are different only at one position. Although the best aligned (by miRanda) target regions (3’UTR) of mouse Maf and human MAF transcripts are not well preserved except counterparts of miR-155’s 3rd-7th and 8th-9th nucleotides (Supplemental Figure 2), computational predictions using miRanda score, Energy, and miRSVR score suggest that both mouse Maf and human MAF are regulatory targets of miR-155. Indeed, in NF1 mutant MPNST cells MAF regulates AKT pathways, cell survival, and cell differentiation (53). Besides Maf, there are 10 remaining miR-155 target genes showing increased expression in the miR-155 deletion mouse. It is noted that all of these 10 genes were significantly de-regulated in published human neurofibroma-like initiating cell microarray data set (GSE122773) (47), with six down regulated genes (PPP1R1C, PMP22, PPP2K2B, B3GALT2, RNF128, and LRRN1) and four upregulated genes (NTRK3, MME, DNER, and ZFPM2). Among these genes, the most well studied one is PMP22. We have shown that Runx regulates PMP22 to contribute to neurofibromagenesis (47). The other genes might also have a role on PNF phenotype, but further experiments are needed for validation.
MEK inhibition shrinks PNFs, but some individuals stop drug treatment due to toxicity (17) and so we reasoned that targeting downstream of MEK/ERK might provide effective alternative therapies. Each miRNA binds with high affinity to complementary sites on its numerous miRNA targets. Therefore, a potential advantage of miRNA-based therapy is the ability to target several genes simultaneously, often genes in a similar pathway being co-targeted. We hypothesized that miR-155, which is downstream of MEK/ERK, might be a target for therapy (28). However, anti-miR-155-PNAs-NPs in vivo only marginally decreased tumor number and did not reduce the growth of established tumors. In contrast, 70% of PNFs shrink in response to MEK inhibition (15, 16). It is possible that the blood nerve barrier (BNB) would not permit the anti-miR-155-PNAs-NPs to enter the nerve, which cannot enter the normal brain (58), and it is unknown whether the anti-miR-155-PNAs-NPs can penetrate the normal BNB. However, we found that the BNB in the Nf1fl/fl;DhhCre mouse is damaged, allowing anti-miR-155-PNAs-NPs to be enriched in the Nf1fl/fl;DhhCre mouse tumors. Although absolute miR-155 expression level change will determine the in vivo inhibitory effects directly, the decreased Ki67 expression and increased MAF expression in the treatment group compared to scramble control suggests that anti-miR-155-PNA effectively inhibited miR-155 expression in vivo. Thus, although anti-miR-155 has shown efficacy against in lymphoma in vivo, it does not eliminate sufficient oncogenic signaling downstream of Nf1 loss to confer significant therapeutic benefit. Multiple pathways are involved in PNF formation and growth downstream of NF1 loss. Among these, ERK is a kinase that phosphorylates multiple substrates, affecting many genes and pathways, of which only a subset of which are predicted to be affected by blockade of miR-155. Combinational therapies with other ERK-dependent anti-miR-PNAs, or other Ras pathway inhibitors, might offer better therapeutic efficacy.
Global deletion of miR-155 in the context of PNF significantly decreased tumor cell proliferation, and increased cell apoptosis. The effect of anti-miR-155-PNA mimicked the decrease in PNF cell proliferation, but not the effect on apoptosis, and modestly decreased PNF size and number. Whether this discordance is caused by different adaptations in these contexts, and/or to exclusion of the PNAs from some cell types, such as immune cells, within the tumors is not known. MiR-155 is important for immuno-function, and in monocytes, macrophages, and myeloid dendritic cells, miR-155 is induced by exposure to inflammatory cytokines such as IFN-β and IFN-γ (59). MiR‐155 contributes to Th1 differentiation in CD4+ T cells by inhibiting IFN‐γ signaling (60).
In summary, we have shown that miR-155 plays a functional role in Nf1 PNF growth and SC proliferation (Figure 7E). Additionally, a nanoparticle based delivery system can be used for delivering anti-miR-peptide in vivo. These anti-miR-155-PNAs-NPs inhibits miR-155 expression in vivo and marginally reduces tumor numbers, suggesting potential therapeutic efficacy.
Supplementary Material
Acknowledgements
We thank Drs. Mark Saltzman and Christopher J. Cheng (Yale School of Engineering and Applied Science) for providing fluorescence-conjugated nanoparticles to fulfill part of the in vivo experiments. This work was supported by NIH R01 NS097233 to JW. NIH R0 NS28840 and R37 NS096356 to NR.
Footnotes
Conflict of interest
The authors declare no conflict of interests.
References
- 1.Boyd KP, Korf BR, Theos A. Neurofibromatosis type 1. J Am Acad Dermatol. 2009;61(1):1–14. [DOI] [PMC free article] [PubMed] [Google Scholar]
- 2.Varan A, Sen H, Aydin B, Yalcin B, Kutluk T, Akyuz C. Neurofibromatosis type 1 and malignancy in childhood. Clin Genet. 2016;89(3):341–5. [DOI] [PubMed] [Google Scholar]
- 3.Prada CE, Jousma E, Rizvi TA, Wu J, Dunn RS, Mayes DA, et al. Neurofibroma-associated macrophages play roles in tumor growth and response to pharmacological inhibition. Acta Neuropathol. 2013;125(1):159–68. [DOI] [PMC free article] [PubMed] [Google Scholar]
- 4.Rice FL, Houk G, Wymer JP, Gosline SJC, Guinney J, Wu J, et al. The evolution and multi-molecular properties of NF1 cutaneous neurofibromas originating from C-fiber sensory endings and terminal Schwann cells at normal sites of sensory terminations in the skin. PloS One. 2019;14(5):e0216527. [DOI] [PMC free article] [PubMed] [Google Scholar]
- 5.Zhu Y, Ghosh P, Charnay P, Burns DK, Parada LF. Neurofibromas in NF1: Schwann cell origin and role of tumor environment. Science. 2002;296(5569):920–2. [DOI] [PMC free article] [PubMed] [Google Scholar]
- 6.Wu J, Williams JP, Rizvi TA, Kordich JJ, Witte D, Meijer D, et al. Plexiform and dermal neurofibromas and pigmentation are caused by Nf1 loss in desert hedgehog-expressing cells. Cancer Cell. 2008;13(2):105–16. [DOI] [PMC free article] [PubMed] [Google Scholar]
- 7.Chen Z, Mo J, Brosseau J-P, Shipman T, Wang Y, Liao C-P, et al. patiotemporal Loss of NF1 in Schwann Cell Lineage Leads to Different Types of Cutaneous Neurofibroma Susceptible to Modification by the Hippo Pathway. Cancer Discov. 2019;9(1):114–29. [DOI] [PMC free article] [PubMed] [Google Scholar]
- 8.Radomska KJ, Coulpier F, Gresset A, Schmitt A, Debbiche A, Lemoine S, et al. Cellular Origin, Tumor Progression, and Pathogenic Mechanisms of Cutaneous Neurofibromas Revealed by Mice with Nf1 Knockout in Boundary Cap Cells. Cancer Discov. 2019;9(1):130–47. [DOI] [PubMed] [Google Scholar]
- 9.Zheng H, Chang L, Patel N, Yang J, Lowe L, Burns DK, et al. Induction of abnormal proliferation by nonmyelinating schwann cells triggers neurofibroma formation. Cancer Cell. 2008;13(2):117–28. [DOI] [PubMed] [Google Scholar]
- 10.McCormick F Ras signaling and NF1. Curr Opin Genet Dev. 1995;5(1):51–5. [DOI] [PubMed] [Google Scholar]
- 11.Le LQ, Parada LF. Tumor microenvironment and neurofibromatosis type I: connecting the GAPs. Oncogene. 2007;26(32):4609–16. [DOI] [PMC free article] [PubMed] [Google Scholar]
- 12.Ratner N, Miller SJ. A RASopathy gene commonly mutated in cancer: the neurofibromatosis type 1 tumour suppressor. Nat Rev Cancer. 2015;15(5):290–301. [DOI] [PMC free article] [PubMed] [Google Scholar]
- 13.Kraniak JM, Sun D, Mattingly RR, Reiners JJ, Jr., Tainsky MA. The role of neurofibromin in N-Ras mediated AP-1 regulation in malignant peripheral nerve sheath tumors. Mol Cell Biochem. 2010;344(1–2):267–76. [DOI] [PMC free article] [PubMed] [Google Scholar]
- 14.Wu J, Dombi E, Jousma E, Scott Dunn R, Lindquist D, Schnell BM, et al. Preclincial testing of sorafenib and RAD001 in the Nf1(flox/flox);DhhCre mouse model of plexiform neurofibroma using magnetic resonance imaging. Pediatric Blood Cancer. 2012;58(2):173–80. [DOI] [PMC free article] [PubMed] [Google Scholar]
- 15.Jessen WJ, Miller SJ, Jousma E, Wu J, Rizvi TA, Brundage ME, et al. MEK inhibition exhibits efficacy in human and mouse neurofibromatosis tumors. J Clin. Invest 2013;123(1):340–7. [DOI] [PMC free article] [PubMed] [Google Scholar]
- 16.Dombi E, Baldwin A, Marcus LJ, Fisher MJ, Weiss B, Kim A, et al. Activity of Selumetinib in Neurofibromatosis Type 1-Related Plexiform Neurofibromas. New Engl J Med. 2016;375(26):2550–60. [DOI] [PMC free article] [PubMed] [Google Scholar]
- 17.Gross AM, Wolters PL, Dombi E, Baldwin A, Whitcomb P, Fisher MJ, et al. Selumetinib in Children with Inoperable Plexiform Neurofibromas. New Engl J Med. 2020. 382(15):1430–1442. [DOI] [PMC free article] [PubMed] [Google Scholar]
- 18.Jousma E, Rizvi TA, Wu J, Janhofer D, Dombi E, Dunn RS, et al. Preclinical assessments of the MEK inhibitor PD-0325901 in a mouse model of Neurofibromatosis type 1. Pediatric Blood Cancer. 2015;62(10):1709–16. [DOI] [PMC free article] [PubMed] [Google Scholar]
- 19.Baulcombe D DNA events. An RNA microcosm. Science. 2002;297(5589):2002–3. [DOI] [PubMed] [Google Scholar]
- 20.Gordon JE, Wong JJ, Rasko JE. MicroRNAs in myeloid malignancies. Bri J Haematol. 2013;162(2):162–76. [DOI] [PubMed] [Google Scholar]
- 21.Berdasco M, Esteller M. Aberrant epigenetic landscape in cancer: how cellular identity goes awry. Dev Cell. 2010;19(5):698–711. [DOI] [PubMed] [Google Scholar]
- 22.Vasilatou D, Papageorgiou S, Pappa V, Papageorgiou E, Dervenoulas J. The role of microRNAs in normal and malignant hematopoiesis. Eur J Haematol. 2010;84(1):1–16. [DOI] [PubMed] [Google Scholar]
- 23.O’Connell RM, Rao DS, Chaudhuri AA, Baltimore D. Physiological and pathological roles for microRNAs in the immune system. Nat Rev Immunol. 2010;10(2):111–22. [DOI] [PubMed] [Google Scholar]
- 24.Babar IA, Cheng CJ, Booth CJ, Liang X, Weidhaas JB, Saltzman WM, et al. Nanoparticle-based therapy in an in vivo microRNA-155 (miR-155)-dependent mouse model of lymphoma. Proc Natl Acad Sci U S A. 2012;109(26):E1695–704. [DOI] [PMC free article] [PubMed] [Google Scholar]
- 25.Jiang S, Zhang LF, Zhang HW, Hu S, Lu MH, Liang S, et al. A novel miR-155/miR-143 cascade controls glycolysis by regulating hexokinase 2 in breast cancer cells. EMBO J. 2012;31(8):1985–98. [DOI] [PMC free article] [PubMed] [Google Scholar]
- 26.Rodriguez A, Vigorito E, Clare S, Warren MV, Couttet P, Soond DR, et al. Requirement of bic/microRNA-155 for normal immune function. Science. 2007;316(5824):608–11. [DOI] [PMC free article] [PubMed] [Google Scholar]
- 27.Thai TH, Calado DP, Casola S, Ansel KM, Xiao C, Xue Y, et al. Regulation of the germinal center response by microRNA-155. Science. 2007;316(5824):604–8. [DOI] [PubMed] [Google Scholar]
- 28.Fabani MM, Abreu-Goodger C, Williams D, Lyons PA, Torres AG, Smith KG, et al. Efficient inhibition of miR-155 function in vivo by peptide nucleic acids. Nucle Acids Res. 2010;38(13):4466–75. [DOI] [PMC free article] [PubMed] [Google Scholar]
- 29.Krutzfeldt J, Rajewsky N, Braich R, Rajeev KG, Tuschl T, Manoharan M, et al. Silencing of microRNAs in vivo with ‘antagomirs’. Nature. 2005;438(7068):685–9. [DOI] [PubMed] [Google Scholar]
- 30.Ma L, Reinhardt F, Pan E, Soutschek J, Bhat B, Marcusson EG, et al. Therapeutic silencing of miR-10b inhibits metastasis in a mouse mammary tumor model. Nat Biotech. 2010;28(4):341–7. [DOI] [PMC free article] [PubMed] [Google Scholar]
- 31.Zhang Y, Roccaro AM, Rombaoa C, Flores L, Obad S, Fernandes SM, et al. LNA-mediated anti-miR-155 silencing in low-grade B-cell lymphomas. Blood. 2012;120(8):1678–86. [DOI] [PubMed] [Google Scholar]
- 32.Subramanian S, Thayanithy V, West RB, Lee CH, Beck AH, Zhu S, et al. Genome-wide transcriptome analyses reveal p53 inactivation mediated loss of miR-34a expression in malignant peripheral nerve sheath tumours. J Pathol. 2010;220(1):58–70. [DOI] [PMC free article] [PubMed] [Google Scholar]
- 33.Chai G, Liu N, Ma J, Li H, Oblinger JL, Prahalad AK, et al. MicroRNA-10b regulates tumorigenesis in neurofibromatosis type 1. Cancer Sci. 2010;101(9):1997–2004. [DOI] [PMC free article] [PubMed] [Google Scholar]
- 34.Presneau N, Eskandarpour M, Shemais T, Henderson S, Halai D, Tirabosco R, et al. MicroRNA profiling of peripheral nerve sheath tumours identifies miR-29c as a tumour suppressor gene involved in tumour progression. Bri J Cancer. 2013;108(4):964–72. [DOI] [PMC free article] [PubMed] [Google Scholar]
- 35.Gong M, Ma J, Li M, Zhou M, Hock JM, Yu X. MicroRNA-204 critically regulates carcinogenesis in malignant peripheral nerve sheath tumors. Neuro Oncol. 2012;14(8):1007–17. [DOI] [PMC free article] [PubMed] [Google Scholar]
- 36.Solomon J, Warren K, Dombi E, Patronas N, Widemann B. Automated detection and volume measurement of plexiform neurofibromas in neurofibromatosis 1 using magnetic resonance imaging. Comput Med Imaging Graph. 2004;28(5):257–65. [DOI] [PubMed] [Google Scholar]
- 37.Ritchie ME, Phipson B, Wu D, Hu Y, Law CW, Shi W, et al. limma powers differential expression analyses for RNA-sequencing and microarray studies. Nucleic Acids Res. 2015;43(7):e47. [DOI] [PMC free article] [PubMed] [Google Scholar]
- 38.John B, Enright AJ, Aravin A, Tuschl T, Sander C, Marks DS. Human MicroRNA targets. PLoS Biol. 2004;2(11):e363. [DOI] [PMC free article] [PubMed] [Google Scholar]
- 39.Wu J, Keng VW, Patmore DM, Kendall JJ, Patel AV, Jousma E, et al. Insertional Mutagenesis Identifies a STAT3/Arid1b/beta-catenin Pathway Driving Neurofibroma Initiation. Cell Rep. 2016;14(8):1979–90. [DOI] [PMC free article] [PubMed] [Google Scholar]
- 40.Woodrow KA, Cu Y, Booth CJ, Saucier-Sawyer JK, Wood MJ, Saltzman WM. Intravaginal gene silencing using biodegradable polymer nanoparticles densely loaded with small-interfering RNA. Nat Mater. 2009;8(6):526–33. [DOI] [PMC free article] [PubMed] [Google Scholar]
- 41.Cheng CJ, Saltzman WM. Enhanced siRNA delivery into cells by exploiting the synergy between targeting ligands and cell-penetrating peptides. Biomaterials. 2011;32(26):6194–203. [DOI] [PMC free article] [PubMed] [Google Scholar]
- 42.Miller SJ, Rangwala F, Williams J, Ackerman P, Kong S, Jegga AG, et al. Large-scale molecular comparison of human schwann cells to malignant peripheral nerve sheath tumor cell lines and tissues. Cancer Res. 2006;66(5):2584–91. [DOI] [PubMed] [Google Scholar]
- 43.Higgs G, Slack F. The multiple roles of microRNA-155 in oncogenesis. J Clin Bioinforma. 2013;3(1):17. [DOI] [PMC free article] [PubMed] [Google Scholar]
- 44.Martin EC, Krebs AE, Burks HE, Elliott S, Baddoo M, Collins-Burow BM, et al. miR-155 induced transcriptome changes in the MCF-7 breast cancer cell line leads to enhanced mitogen activated protein kinase signaling. Genes Cancer. 2014;5(9–10):353–64. [DOI] [PMC free article] [PubMed] [Google Scholar]
- 45.Trotta R, Chen L, Costinean S, Josyula S, Mundy-Bosse BL, Ciarlariello D, et al. Overexpression of miR-155 causes expansion, arrest in terminal differentiation and functional activation of mouse natural killer cells. Blood. 2013;121(16):3126–34. [DOI] [PMC free article] [PubMed] [Google Scholar]
- 46.Miller SJ, Jessen WJ, Mehta T, Hardiman A, Sites E, Kaiser S, et al. Integrative genomic analyses of neurofibromatosis tumours identify SOX9 as a biomarker and survival gene. EMBO Mol Med. 2009;1(4):236–48. [DOI] [PMC free article] [PubMed] [Google Scholar]
- 47.Hall A, Choi K, Liu W, Rose J, Zhao C, Yu Y, et al. RUNX represses Pmp22 to drive neurofibromagenesis. Sci Adv. 2019;5(4):eaau8389. [DOI] [PMC free article] [PubMed] [Google Scholar]
- 48.Kluiver J, Poppema S, de Jong D, Blokzijl T, Harms G, Jacobs S, et al. BIC and miR-155 are highly expressed in Hodgkin, primary mediastinal and diffuse large B cell lymphomas. J Pathol. 2005;207(2):243–9. [DOI] [PubMed] [Google Scholar]
- 49.Xiao C, Calado DP, Galler G, Thai T-H, Patterson HC, Wang J, et al. MiR-150 controls B cell differentiation by targeting the transcription factor c-Myb. Cell. 2007;131(1):146–59. [DOI] [PubMed] [Google Scholar]
- 50.Zhou Y, Wang X, Liu Z, Huang X, Li X, Cheng K, et al. Prognostic role of microRNA-155 expression in gliomas: A meta-analysis. Clin Neurol Neurosurg. 2019;176:103–9. [DOI] [PubMed] [Google Scholar]
- 51.Sherman LS, Ratner N. Immunocytochemical assay for Ras activity. Methods Enzymol. 2001;333:348–55. [DOI] [PubMed] [Google Scholar]
- 52.Yin Q, Wang X, McBride J, Fewell C, Flemington E. B-cell receptor activation induces BIC/miR-155 expression through a conserved AP-1 element. J Biol Chem. 2008;283(5):2654–62. [DOI] [PMC free article] [PubMed] [Google Scholar]
- 53.Brundage ME, Tandon P, Eaves DW, Williams JP, Miller SJ, Hennigan RH, et al. MAF mediates crosstalk between Ras-MAPK and mTOR signaling in NF1. Oncogene. 2014;33(49):5626–36. [DOI] [PMC free article] [PubMed] [Google Scholar]
- 54.Zhang C, Guo ZM. Multiple functions of Maf in the regulation of cellular development and differentiation. Diabetes Metab Res Rev. 2015;31(8):773–8. [DOI] [PMC free article] [PubMed] [Google Scholar]
- 55.Liu M, Tong Z, Ding C, Luo F, Wu S, Wu C, et al. Transcription factor c-Maf is a checkpoint that programs macrophages in lung cancer. J Clin Invest. 2020;130(4):2081–96. [DOI] [PMC free article] [PubMed] [Google Scholar]
- 56.Su W, Hopkins S, Nesser NK, Sopher B, Silvestroni A, Ammanuel S, et al. The p53 transcription factor modulates microglia behavior through microRNA-dependent regulation of c-Maf. J Immunol. 2014;192(1):358–66. [DOI] [PMC free article] [PubMed] [Google Scholar]
- 57.Kim M, Wende H, Walcher J, Kuhnemund J, Cheret C, Kempa S, et al. Maf links Neuregulin1 signaling to cholesterol synthesis in myelinating Schwann cells. Genes Dev. 2018;32(9–10):645–57. [DOI] [PMC free article] [PubMed] [Google Scholar]
- 58.Ganguly S, Chaubey B, Tripathi S, Upadhyay A, Neti PV, Howell RW, et al. Pharmacokinetic analysis of polyamide nucleic-acid-cell penetrating peptide conjugates targeted against HIV-1 transactivation response element. Oligonucleotides. 2008;18(3):277–86. [DOI] [PMC free article] [PubMed] [Google Scholar]
- 59.O’Connell RM, Taganov KD, Boldin MP, Cheng G, Baltimore D. MicroRNA-155 is induced during the macrophage inflammatory response. Proc Natl Acad Sci U S A. 2007;104(5):1604–9. [DOI] [PMC free article] [PubMed] [Google Scholar]
- 60.Banerjee A, Schambach F, DeJong CS, Hammond SM, Reiner SL. Micro-RNA-155 inhibits IFN-gamma signaling in CD4+ T cells. Eur J Immunol. 2010;40(1):225–31. [DOI] [PMC free article] [PubMed] [Google Scholar]
Associated Data
This section collects any data citations, data availability statements, or supplementary materials included in this article.