Fig. 2.
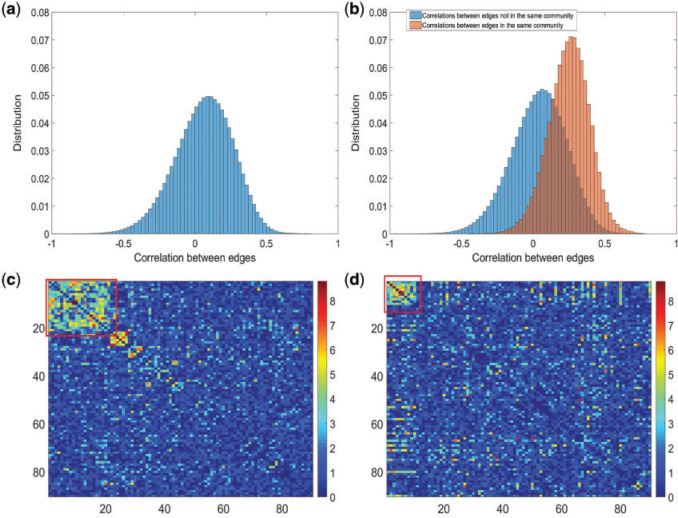
(a) Histogram of 8 018 010 correlations between all 4005 edges. (b) Reflects our estimated network topology and correlation matrix in that  , and the correlations between edges in the same networks are more correlated than correlations between edges not in the same community. (c) and (d) Inferences with dependence structure between edges vs. inferences with independence assumption: the disease-related connectivity network is larger when accounting for dependence structure between edges and agrees better with findings in previous studies. Each entry in the heatmaps is—log transformed
  -value of an edge between the column and row nodes and a hotter point indicates more significant difference between diagnosis groups. We order the brain regions by listing regions in the diagnosis group related-network first.

