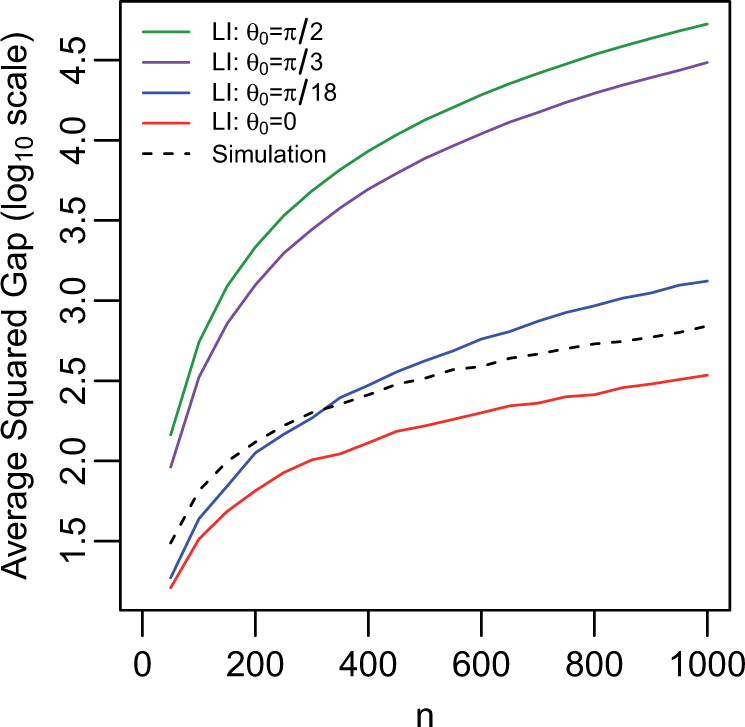
Fig. 2.

Expected average gap between imputed trajectories and the true unobserved trajectory. The length of the interval of missingness,  , ranges from
  to
to  by increments of
  . For each value of
  , the average over
  simulations are used to estimate the average squared gap for the simulation approach. While for small
  and small
  LI can be a better approximation to the true trajectory, asymptotically the simulation approach is better for any amount of curvature.
