Abstract
BACKGROUND:
Ultrasound is commonly the first-line imaging modality for assessing the visceral organ dimensions without any risk of radiation. An abnormal size of the spleen may indicate disease, but the evaluation is challenging because of the normal size changes with age. In addition, published normal value charts for children may vary by population and methods.
OBJECTIVES:
Determine normal growth curves for splenic length in relationship to sex, age, body weight, height, body mass index, and body surface area of healthy children in Saudi Arabia.
DESIGN:
A retrospective review of ultrasonography images
SETTING:
Tertiary referral hospital
SUBJECTS AND METHODS:
We included all normal ultrasonography exams of splenic length (from full-term neonates to 16 years of age) performed between 2003 and 2018. The greatest longitudinal distance of the spleen from the dome to the tip (splenic length) measured at the hilum in the coronal plane was obtained by ultrasonography.
MAIN OUTCOME MEASURES:
The relationship between the longitudinal length of the spleen and sex, age, height, weight, body mass index, and body surface area.
SAMPLE SIZE:
1028 healthy children
RESULTS:
Height had the most significant correlation with the length of the spleen (P<.001). There was a consistent difference in splenic length according to sex. The spleen was longer in males than in females in children older than 2 years. In terms of splenic growth according to age, our data showed a statistically significant correlation between the ages of 0-24 months and 2-16 years. There was a significant difference between cases from Saudi Arabia, the United States (P=.023) and India (P=.045).
CONCLUSION:
We developed scatter plots between splenic lengths and body parameters among Saudi children for children from 0 day to 24 months and children from 2 years to 16 years for reference.
LIMITATION:
Retrospective study. Ultrasound techniques in patient positioning, and cursor placement differed from other studies, which can affect measurements of splenic length.
CONFLICTS OF INTEREST:
None.
INTRODUCTION
Ultrasonography of the spleen is a routine real-time exam used to evaluate size, shape and echo texture without any risk of radiation. In adults, the indicators of moderate splenomegaly include an antero-posterior length greater than two-thirds of the distance between the anterior and posterior abdominal wall, with a craniocaudal length exceeding the upper limit of 11 to 14 centimeters.1 Massive splenomegaly should be considered if the interpolar diameter is greater than 20 cm.2 The definition and grading of splenomegaly in healthy children is not standardized. Some authors use the adult criteria, whereas others consider these measurements irrelevant because spleen size is relative to body parameters.3 Among several body growth parameters, spleen size is considered an important parameter in the clinical evaluation of spleen growth and abnormalities. Spleen length is influenced by the overall body parameters of an individual, including age, height, weight, body mass index (BMI) and body surface area (BSA).4-10 Many diseases can affect the spleen size, varying from infection to malignant disorders.11,12 Therefore, the need to have a reliable reference for the spleen size in children is valuable for clinical assessment.
There are few studies that have defined the normal limits of spleen size in healthy children around the world, but none from Saudi Arabia. These studies have shown that spleen size correlates better with particular body parameters.6-7,9-10,13-15 One study reported that body weight was better correlated with the longitudinal dimensions of the spleen than with the body surface area of pediatric subjects.16 Another study found a significant correlation between height and splenic length.6 In a study with a larger sample size than other studies, Ezeofor et al7 reported a significant correlation between splenic length and age. Some reports showed no statistically significant difference in splenic length with respect to sex,6,9,14,16 whereas other studies showed a statistically significant difference.7,17 Most studies have shown a strong correlation between the child's age and body parameters with splenic length in children. However, to the best of our knowledge, so far there are no published data or growth curves for healthy children from Saudi Arabia.
Our study aimed to establish the normal standards of spleen length in relationship to child age and body parameters in Saudi Arabia. This will assist in predicting changes in spleen size and early identification of abnormal ultrasound findings. In conditions that necessitate more investigations, such as growth, treatment of children with infectious, hematological, infiltrative, splenic trauma, immunologic and malignant states as well and evaluation of treatment response.17 An assessment of organ size is an integral part of the evaluation and treatment of disease, particularly before splenectomy.18
SUBJECTS AND METHODS
This retrospective study was approved by the institutional review board of King Faisal Specialist Hospital and Research Center. Informed consent was waived. The study included all normal ultrasound exams of the spleen performed between July 2003 and May 2018 at King Faisal Specialist Hospital and Research Center. The age group ranged from full-term neonate to 16 years old. Only healthy subjects were included in the study. Their age, weight and height were recorded on the day of the ultrasound study. Children's weight-for-age and height-for-age percentiles were between the 5th and the 95th percentiles based on the Growth Charts for Saudi Children and Adolescents, endorsed by the Health Services Council of Saudi Arabia (https://www.moh.gov.sa/HealthAwareness/EducationalContent/BabyHealth/Documents/Intermediate%201%20Compatibility%20Mode.pdf). Patients who did not have normal growth curves were not included in the study. Grayscale 2D ultrasound images of the spleen were stored in PACS (picture archiving and communication system). The length of the organs and height were recorded to the nearest 0.1 cm, and the weight to the nearest 0.1 kg. We used the following inclusion criteria: healthy full-term term newborn to 16 years old with no personal or family history of any disease. Any patients with underlying hematological disease, malignancy, metabolic disorders or infection were excluded. Only patients who came for screening or routine abdominal ultrasound examination and had normal scans (liver, kidney and spleen) were included. Most of these patients were screened for abdominal pain. A spleen is considered normal based on echogenicity, an absence of lesions and normal size according to the available reference standard.14
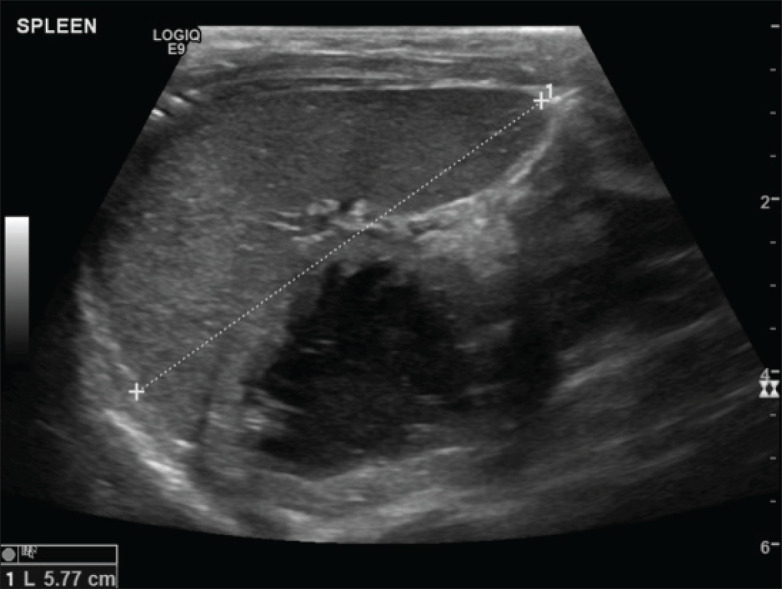
All the retrospective ultrasound examinations were reviewed by a pediatric consultant radiologist to ensure that the examinations met the inclusion criteria and the sizes were not incorrectly measured for any reason, such as intense crying, movement or other reasons. Spleen measurements were performed in the lateral decubitus position. At least three longitudinal measurements of the spleen were performed between the most superomedial and the most inferolateral margins (Figure 1).
Figure 1. Normal ultrasound of the spleen (maximum longitudinal length measurement).
Statistical analysis was carried out using IBM SPSS Statistics version 20 (SPSS Inc., Chicago, IL, United States). Descriptive statistical methods were used when appropriate. Differences among groups were determined by the paired samples t test and the non-parametric Mann–Whitney test; more than two groups were assessed with analysis of variance. Data were summarized by the median and interquartile range (IQR) or mean and standard deviation (SD). Relationships between ultrasound measured spleen size, age and body parameters were assessed with the Pearson correlation coefficient; to identify the exact pattern of the relationship, nonlinear regression analysis was performed. Multiple regression analysis was applied in a backward stepwise fashion to test the independent effect of all factors on spleen length. Spleen length growth curves and upper limits defined by the 90% upper confidence limit are presented in graphs according to height, weight, and BSA.
RESULTS
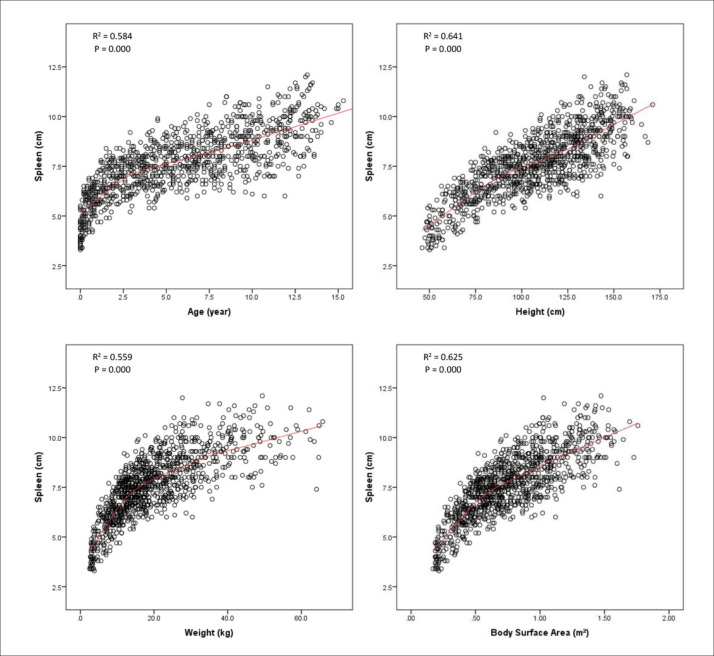
The study involved 1028 normal ultrasound exams: 532 males (51.8%) and 496 females (48.2%). The age distribution ranged from newborn to 16.4 years; 234 were less than 2 years (22.8%) and 724 were more than 2 years old (77.2%); the median age was 5.4 years (Figure 2). The median (IQR) length of the spleen of all patients was 7.6 (2.1) centimeters. Splenic length correlated with age, height, weight and body surface area in both sexes (Figure 3). The spleen was longer in males than in females. The median (IQR) for males was 7.8 (2.3) centimeters, while for females the median (IQR) was 7.5 (1.9) centimeters (P=.036). However, this difference was only true for children aged more than 2 years (P=.001), as shown in Table 1 and Table 2, while for children less than 2 years the difference was not statistically signifi-cant (P=.835). Spleen size by age category is shown in Tables 3 and 4. As a group, the splenic length showed the strongest correlation with patient height in the univariate analysis (R2=.641) (Table 5, Figure 4). On multivariate analysis, age and weight indicated significantly strong correlations with splenic length, whereas BMI showed weaker correlations (Table 6).
Figure 2. Age distribution of the study population (n=1028).
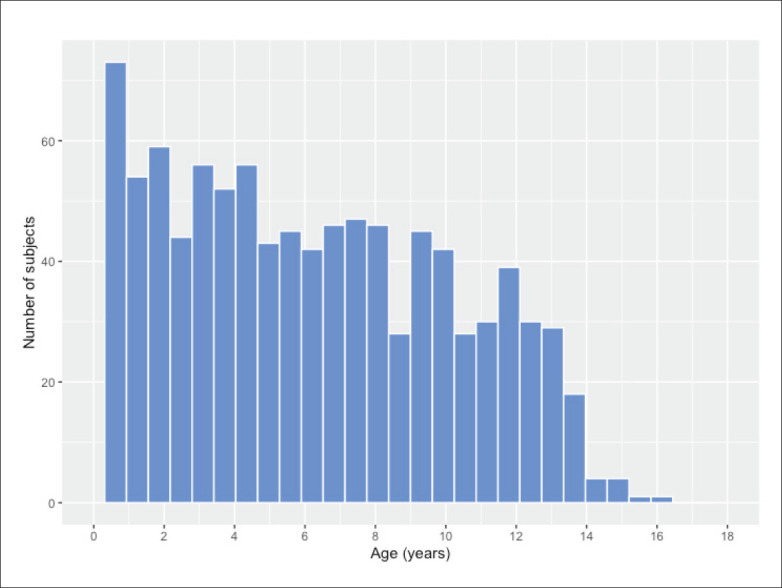
Figure 3. Spleen growth curve by age, height, weight and body surface area in males (n=532) and females (n=496) (P<.001 for all correlations).
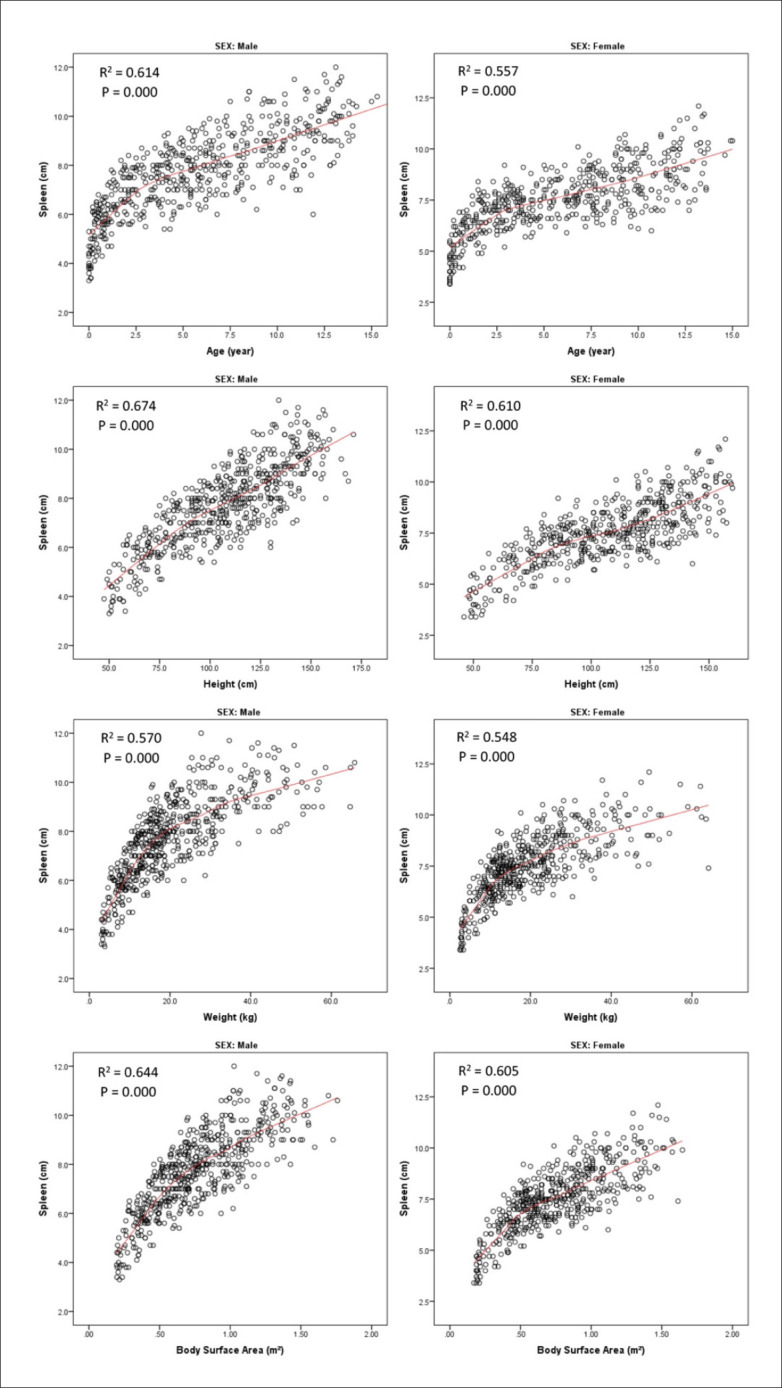
Table 1.
Spleen length in male children aged older than 2 years.
| Age years | Height cm | No | Mean cm | SD | Minimum cm | Maximum cm | Percentiles | |
|---|---|---|---|---|---|---|---|---|
| 5th | 95th | |||||||
| 2-3 | 82-97 | 40 | 7.09 | 0.88 | 5.6 | 8.7 | 5.7 | 8.3 |
| 3-4 | 86-108 | 38 | 7.29 | 0.76 | 5.5 | 8.7 | 6.3 | 8.5 |
| 4-5 | 93-118 | 48 | 7.71 | 1.10 | 5.4 | 9.9 | 5.9 | 9.3 |
| 5-6 | 99-122 | 45 | 7.88 | 0.85 | 6.2 | 9.5 | 6.5 | 9.4 |
| 6-7 | 106-126 | 43 | 8.10 | 0.99 | 6.0 | 9.9 | 6.6 | 9.7 |
| 7-8 | 111-131 | 28 | 8.28 | 1.06 | 6.8 | 10.6 | 6.8 | 9.9 |
| 8-9 | 116-134 | 29 | 8.62 | 1.23 | 6.2 | 11.0 | 6.8 | 10.9 |
| 9-10 | 120-140 | 30 | 9.05 | 0.94 | 7.3 | 10.7 | 6.9 | 11.1 |
| 10-11 | 125-148 | 27 | 9.06 | 1.07 | 7.1 | 11.5 | 7.5 | 10.8 |
| 11-12 | 130-155 | 27 | 8.94 | 1.24 | 6.0 | 11.1 | 7.0 | 10.9 |
| 12-14 | 134-167 | 46 | 9.90 | 1.00 | 8.0 | 12.0 | 8.2 | 11.6 |
| 14-16 | 148-171 | 7 | 9.97 | 0.81 | 8.7 | 10.8 | 8.9 | 10.7 |
Table 2.
Spleen length in female children aged more than 2 years.
| Age years | Height cm | No | Mean cm | SD | Minimum cm | Maximum cm | Percentiles | |
|---|---|---|---|---|---|---|---|---|
| 5th | 95th | |||||||
| 2-3 | 75-99 | 39 | 7.03 | 0.80 | 5.2 | 9.2 | 6.0 | 8.2 |
| 3-4 | 87-109 | 51 | 7.33 | 0.67 | 6.1 | 9.1 | 6.2 | 8.3 |
| 4-5 | 93-114 | 29 | 7.00 | 0.80 | 5.7 | 8.8 | 5.8 | 8.4 |
| 5-6 | 101-119 | 27 | 7.84 | 0.85 | 6.2 | 9.2 | 6.6 | 9.1 |
| 6-7 | 106-128 | 34 | 7.70 | 0.78 | 5.9 | 10.1 | 6.7 | 9.1 |
| 7-8 | 109-132 | 43 | 8.06 | 0.96 | 6.2 | 9.7 | 6.6 | 9.4 |
| 8-9 | 114-135 | 27 | 8.10 | 1.07 | 6.3 | 10.1 | 6.5 | 9.8 |
| 9-10 | 118-141 | 41 | 8.62 | 1.16 | 6.2 | 10.7 | 6.8 | 10.3 |
| 10-11 | 125-150 | 26 | 8.28 | 1.17 | 6.0 | 10.2 | 6.3 | 10.0 |
| 11-12 | 129-155 | 28 | 9.05 | 1.09 | 7.0 | 11.0 | 6.2 | 10.0 |
| 12-14 | 137-160 | 38 | 9.43 | 1.34 | 7.0 | 12.1 | 6.2 | 10.2 |
| 14-16 | 146-160 | 3 | 10.17 | 0.40 | 9.7 | 10.4 | 9.8 | 10.4 |
Table 3.
Longitudinal length of the spleen in children aged 24 months or less.
| Age (months) | Height cm | No | Mean cm | SD | Percentiles | Suggested upper limit | |
|---|---|---|---|---|---|---|---|
| 5th | 95th | ||||||
| <1 | 46-56 | 32 | 4.14 | 0.61 | 3.4 | 5.3 | 5.5 |
| 1-3 | 50-63 | 26 | 4.90 | 0.87 | 3.8 | 6.3 | 6.5 |
| 3-5 | 55-71 | 22 | 5.43 | 0.74 | 4.3 | 6.4 | 6.5 |
| 5-7 | 57-71 | 16 | 5.69 | 0.82 | 4.4 | 6.8 | 7 |
| 7-9 | 63-75 | 22 | 5.79 | 0.67 | 4.8 | 6.6 | 7 |
| 9-11 | 65-78 | 18 | 5.79 | 0.69 | 4.9 | 6.7 | 7 |
| 11-15 | 67-84 | 29 | 6.16 | 0.75 | 4.9 | 7.3 | 7.5 |
| 15-18 | 73-83 | 19 | 6.65 | 0.66 | 5.7 | 7.7 | 8 |
| 18-24 | 74-92 | 50 | 6.80 | 0.89 | 5.3 | 8.0 | 8 |
Table 4.
Longitudinal length of the spleen in children aged between 2 and 16 years.
| Age (years) | No | Mean cm | SD | Percentiles | Suggested upper limit | |
|---|---|---|---|---|---|---|
| 5th | 95th | |||||
| 2-3 | 79 | 7.06 | 0.84 | 5.8 | 8.3 | 8.5 |
| 3-4 | 89 | 7.31 | 0.71 | 6.1 | 8.5 | 8.5 |
| 4-5 | 77 | 7.44 | 1.05 | 5.8 | 9.1 | 9 |
| 5-6 | 72 | 7.87 | 0.85 | 6.5 | 9.2 | 9.5 |
| 6-7 | 77 | 7.92 | 0.92 | 6.6 | 9.5 | 9.5 |
| 7-8 | 71 | 8.15 | 1.00 | 6.6 | 9.7 | 10 |
| 8-9 | 56 | 8.37 | 1.18 | 6.6 | 10.3 | 10.5 |
| 9-10 | 71 | 8.80 | 1.08 | 7.0 | 10.6 | 10.5 |
| 10-11 | 53 | 8.68 | 1.18 | 7.0 | 10.3 | 10.5 |
| 11-12 | 55 | 9.00 | 1.16 | 7.0 | 10.8 | 11 |
| 12-14 | 84 | 9.69 | 1.18 | 8.0 | 11.6 | 12 |
| 14-16 | 10 | 10.03 | 0.69 | 8.9 | 10.7 | 12 |
Table 5.
Univariate analysis of relation between spleen length and age, weight, height, body mass index (BMI) or body surface area (BSA) in males and females.
| Variable | Spleen length | |||||
|---|---|---|---|---|---|---|
| All (n=1028) | Male (n=532) | Female (n=496) | ||||
| β | R2 | β | R2 | β | R2 | |
| Age | 0.305 | 0.584 | 0.320 | 0.614 | 0.288 | 0.557 |
| Height | 0.046 | 0.641 | 0.049 | 0.674 | 0.043 | 0.610 |
| Weight | 0.098 | 0.559 | 0.102 | 0.570 | 0.095 | 0.548 |
| BMI | 0.232 | 0.157 | 0.229 | 0.136 | 0.232 | 0.178 |
| BSA | 3.892 | 0.625 | 4.073 | 0.644 | 3.684 | 0.605 |
Note: All betas were significant as P value <.001.
Figure 4. Spleen growth curve by age, height, weight and body surface area for all patients (n=1028) (P<.001 for all correlations).
Table 6.
Multiple regression analysis of relation between spleen length and age, height, weight, body mass index (BMI), body surface area (BSA) and gender.
| Variable | Spleen length | |||||
|---|---|---|---|---|---|---|
| All (n=1028) | Male (n=532) | Female (n=496) | ||||
| β | P | β | P | β | P | |
| Age | 0.006 | .859 | 0.006 | .898 | 0.006 | .906 |
| Height | 0.089 | .000 | 0.096 | .003 | 0.081 | .005 |
| Weight | 0.003 | .954 | -0.014 | .859 | 0.003 | .965 |
| BMI | 0.180 | .000 | 0.187 | .000 | 0.186 | .000 |
| BSA | -4.495 | .240 | -4.191 | .463 | -4.101 | .422 |
| Gender | -0.134 | .024 | ||||
| R2 | 0.668 | 0.693 | 0.645 | |||
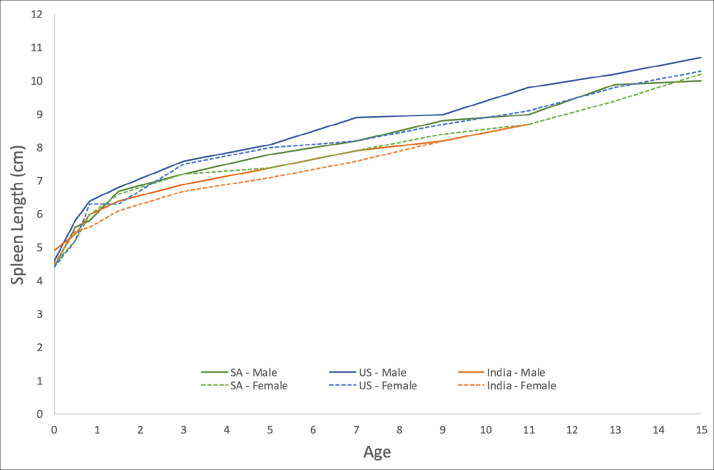
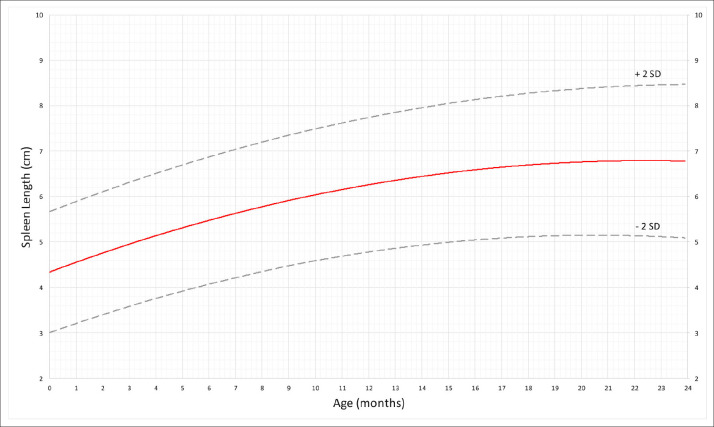
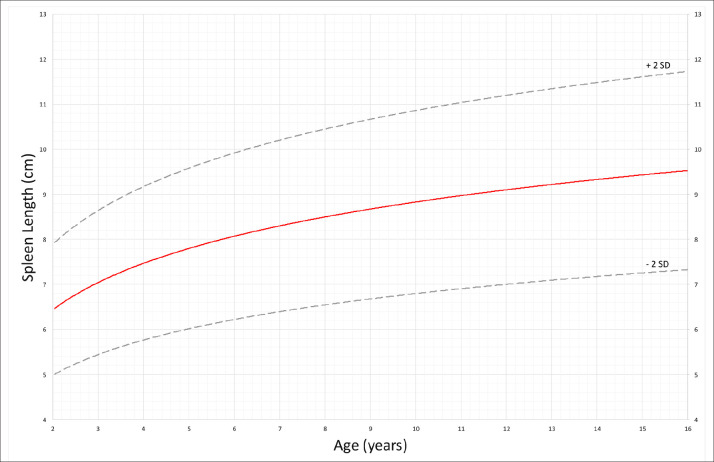
In Table 7, age groups were rearranged to match the other studies (United States and India).6,10 There was a statistically significant difference between the Saudi Arabia and the United States (P=.023) and Saudi Arabia and India (P=.045); however, differences were not clinically important (+/− 2 mm differences). The plots of the mean splenic length versus age for all three countries are shown in Figure 5. Figures 6 and 7 show a smoothed plot of mean length with two standard deviations of the mean for children from 0 day to 24 months and children from 2 years to 14 years, respectively.
Table 7.
Spleen Length Comparison between Saudi, US and Indian children in centimeters (Saudi Arabia vs United States (P=.045), Saudi Arabia vs India (P=.045) groups.6,10
| Age group | Sex | Spleen length comparison between Saudi, US and Indian children in cm | ||||||||
|---|---|---|---|---|---|---|---|---|---|---|
| Saudi Arabia | United States | India | ||||||||
| No. | Mean | SD | No. | Mean | SD | No. | Mean | SD | ||
| 0-3 months | F | 31 | 4.5 | .83 | 22 | 4.4 | 0.57 | 11 | 4.5 | 0.53 |
| M | 27 | 4.4 | .83 | 35 | 4.6 | 0.84 | 10 | 4.9 | 1.44 | |
| 3-6 months | F | 9 | 5.2 | .80 | 6 | 5.2 | 0.47 | 9 | 5.5 | 0.51 |
| M | 22 | 5.6 | .70 | 10 | 5.8 | 0.65 | 26 | 5.4 | 0.61 | |
| 6-12 months | F | 24 | 6.0 | .76 | 15 | 6.3 | 0.68 | 23 | 5.6 | 0.61 |
| M | 33 | 5.8 | .65 | 12 | 6.4 | 0.78 | 28 | 6.0 | 0.86 | |
| 1-2 years | F | 46 | 6.6 | .89 | 18 | 6.3 | 0.69 | 33 | 6.1 | 0.74 |
| M | 42 | 6.7 | .84 | 17 | 6.8 | 0.72 | 44 | 6.4 | 1.01 | |
| 2-4 years | F | 90 | 7.2 | .74 | 24 | 7.5 | 0.83 | 53 | 6.7 | 0.74 |
| M | 78 | 7.2 | .82 | 22 | 7.6 | 1.07 | 79 | 6.9 | 1.01 | |
| 4-6 years | F | 56 | 7.4 | .92 | 36 | 8.0 | 0.74 | 53 | 7.1 | 0.90 |
| M | 93 | 7.8 | .99 | 18 | 8.1 | 1.01 | 62 | 7.4 | 0.99 | |
| 6-8 years | F | 77 | 7.9 | .90 | 25 | 8.2 | 0.99 | 20 | 7.6 | 0.99 |
| M | 71 | 8.2 | 1.01 | 26 | 8.9 | 0.91 | 31 | 7.9 | 0.94 | |
| 8-10 years | F | 68 | 8.4 | 1.14 | 26 | 8.7 | 0.92 | 27 | 8.2 | 1.02 |
| M | 59 | 8.8 | 1.10 | 15 | 9.0 | 1.02 | 35 | 8.2 | 1.02 | |
| 10-12 years | F | 54 | 8.7 | 1.19 | 34 | 9.1 | 1.09 | 21 | 8.7 | 1.20 |
| M | 54 | 9.0 | 1.15 | 19 | 9.8 | 1.05 | 32 | 8.7 | 1.84 | |
| 12-14 years | F | 38 | 9.4 | 1.34 | 30 | 9.8 | 1.02 | |||
| M | 46 | 9.9 | 1.00 | 18 | 10.2 | 0.81 | ||||
| 14-16 years | F | 3 | 10.2 | .40 | 13 | 10.3 | 0.69 | |||
| M | 7 | 10.0 | .81 | 13 | 10.7 | 0.90 | ||||
| Total | 1028 | 454 | 597 | |||||||
Figure 5. Mean spleen lengths by age in children from Saudi Arabia, India and the United States.
Figure 6. Mean splenic length and 2 standard deviations of the mean by age for children younger than 24 months old (n=234).
Figure 7. Mean splenic length and 2 standard deviations of the mean by age for children 2 years to 16 years old (n=794).
DISCUSSION
In children, it is important to determine pathological changes in spleen size. The normal ranges should be known to recognize any pathological changes. The size of the spleen may vary by age group. This study provides a practical and comprehensive guide to the normal splenic length in the Saudi pediatric population. The normal range limit of the spleen determined in this study could be used as a reference in daily practice in local radiology clinics. To the best of our knowledge, this study is the only study from Saudi Arabia that has evaluated the relationship between spleen size and the overall body size of the individual, including age, height, weight, BMI and BSA.
Our results provide a standard set of normal ranges of spleen size according to age, height, weight, BMI, BSA and sex of the children, as determined by ultra-sonography. We also found age and height to be significantly correlated with spleen size across all ages and in both sexes. It has been found in most studies that splenic length correlates better with height.6,9,10,14-15 However, in a few other studies, the patient's weight showed the strongest correlation with splenic length.16,19
There are disagreements regarding the correlation between sex and spleen size in children. In adulthood, spleen size is larger in men than in women,7,17 while other studies have indicated no differences in splenic length between the sexes.9-10,14 We found a noticeable difference in splenic length by sex in patients older than 2 years of age. The spleen was longer in males than in females. Although there were statistically significant differences in splenic length between the sexes, these differences were not considered clinically significant. Therefore, we present splenic length graphs based on the age group regardless of sex. In terms of splenic growth according to age, our data showed a statistically significant difference before and after 24 months of age. Consistent with other studies, the splenic length increased rapidly until 24 months, while the growth rate was reduced thereafter.6,14,18
There was a significant difference between Saudi Arabia and the United States (P=.023) and Saudi Arabia and India (P=.045). We highly advise that our splenic length graph may be the best available for clinical use in our region. Our database of 1028 cases is considerably greater than in other studies,6,9,10,13-15 and the smoothed plot of mean length with two standard deviations of the mean is an ideal for reference in everyday scanning situations for children from 0 day to 24 months (Figure 6) and children from 2 years to 14 years (Figure 7).
There are some limitations to our study. The study data were retrospectively evaluated but checked by pediatric radiologists. Routine splenic length measurements by ultrasound were performed by experienced sonographers following standard protocols. Additionally, patient positioning and differences in cursor placement can affect the measurements of splenic length. Another limitation is that the sample was not randomly chosen from different parts of the country; however, this hospital is the largest referral hospital in Saudi Arabia and thus the results may be generalizable.
In conclusion, nomograms for each ethnic group are ideal to enable better interpretation of sonographic assessments in the pediatric population. Scatterplots between age and splenic length were established among Saudi children. We have graphed and tabulated the correlation of age with splenic length in this study, and believe that these tables and graphs can be used routinely to assess conditions that lead to changes in spleen size.
Funding Statement
None.
REFERENCES
- 1.Robertson F, Leander P, Ekberg O. Radiology of the spleen. Eur Radiol. 2001;11(1):80–95. Epub 2001/02/24. doi: 10.1007/s003300000528. PubMed PMID: 11194923. [DOI] [PubMed] [Google Scholar]
- 2.Goerg C, Schwerk WB, Goerg K, Have-mann K. Sonographic patterns of the affected spleen in malignant lymphoma. J Clin Ultrasound. 1990;18(7):569–74. Epub 1990/09/01. PubMed PMID: 2170456. [DOI] [PubMed] [Google Scholar]
- 3.Park A, Heniford BT, Hebra A, Fitzgerald PJSE. Pediatric laparoscopic splenectomy. 2000;14(6):527–31. doi: 10.1007/s004640000152. [DOI] [PubMed] [Google Scholar]
- 4.Benter T, Kluhs L, Teichgraber U. Sonography of the spleen. J Ultrasound Med. 2011;30(9):1281–93. Epub 2011/08/31. PubMed PMID: 21876100. [DOI] [PubMed] [Google Scholar]
- 5.Chiorean L, Zdrenghea M, Badea R. Ultrasonography of the spleen. Pictorial essay. Med Ultrason. 2014;16(1):48–59. Epub 2014/02/26. PubMed PMID: 24567925. [DOI] [PubMed] [Google Scholar]
- 6.Dhingra B, Sharma S, Mishra D, Kumari R, Pandey RM, Aggarwal S. Normal values of liver and spleen size by ultrasonography in Indian children. Indian Pediatr. 2010;47(6):487–92. [DOI] [PubMed] [Google Scholar]
- 7.Ezeofor SN, Obikili EN, Anyanwu GE, Onuh AC, Mgbor SO. Sonographic assessment of the normal limits of the spleen in healthy school children in South-East Nigeria. Niger J Clin Pract. 2014;17(4):484–8. Epub 2014/06/10. doi: 10.4103/1119-3077.134046. PubMed PMID: 24909474. [DOI] [PubMed] [Google Scholar]
- 8.Haddad-Zebouni S, Hindy R, Slaba S, Aoun N, Mourani C, Abi Ghanem S, et al. Ultrasonographic evaluation of the kidney, liver and spleen size in children. Arch Pediatr. 1999;6(12):1266–70. [DOI] [PubMed] [Google Scholar]
- 9.Konus OL, Ozdemir A, Akkaya A, Erbas G, Celik H, Isik S. Normal liver, spleen, and kidney dimensions in neonates, infants, and children: evaluation with sonography. AJR Am J Roentgenol. 1998;171(6):1693–8. [DOI] [PubMed] [Google Scholar]
- 10.Megremis SD, Vlachonikolis IG, Tsilimigaki AM. Spleen length in childhood with US: normal values based on age, sex, and somatometric parameters. Radiology. 2004;231(1):129–34. [DOI] [PubMed] [Google Scholar]
- 11.Zhang B, Lewis SM. A study of the reliability of clinical palpation of the spleen. Clin Lab Haematol. 1989;11(1):7–10. [DOI] [PubMed] [Google Scholar]
- 12.Joshi R, Singh A, Jajoo N, Pai M, Kalantri SP. Accuracy and reliability of palpation and percussion for detecting hepatomegaly: a rural hospital-based study. Indian J Gastroenterol. 2004;23(5):171–4. [PubMed] [Google Scholar]
- 13.Özdikici M The relationship between splenic length in healthy children from the Eastern Anatolia Region and sex, age, body height and weight. J Ultrason. 2018;18(72):5–8. Epub 2018/05/31. doi: 10.15557/JoU.2018.0001. PubMed PMID: 29844934; PubMed Central PMCID: PMCPMC5911712. [DOI] [PMC free article] [PubMed] [Google Scholar]
- 14.Rosenberg HK, Markowitz RI, Kolberg H, Park C, Hubbard A, Bellah RD. Normal splenic size in infants and children: sonographic measurements. AJR Am J Roentgenol. 1991;157(1):119–21. Epub 1991/07/01. [DOI] [PubMed] [Google Scholar]
- 15.Thapa NB SS, Pradhan A, Rijal K, Pradhan A, Basnet S. Sonographic assessment of the normal dimensions of liver, spleen, and kidney in healthy children at tertiary care hospital. Kathmandu Univ Med J. 2016;13:286–91. [DOI] [PubMed] [Google Scholar]
- 16.Safak AA, Simsek E, Bahcebasi T. Sono-graphic assessment of the normal limits and percentile curves of liver, spleen, and kidney dimensions in healthy school-aged children. J Ultrasound Med. 2005;24(10):1359–64. [DOI] [PubMed] [Google Scholar]
- 17.Niederau C, Sonnenberg A, Muller JE, Erckenbrecht JF, Scholten T, Fritsch WP. Sonographic measurements of the normal liver, spleen, pancreas, and portal vein. Radiology. 1983;149(2):537–40. Epub 1983/11/01. doi: 10.1148/radiology.149.2.6622701. PubMed PMID: 6622701. [DOI] [PubMed] [Google Scholar]
- 18.Pelizzo G, Guazzotti M, Klersy C, Nakib G, Costanzo F, Andreatta E, et al. Spleen size evaluation in children: Time to define splenomegaly for pediatric surgeons and pediatricians. PloS one. 2018;13(8):e0202741–e. doi: 10.1371/journal.pone.0202741. PubMed PMID: 30138410. [DOI] [PMC free article] [PubMed] [Google Scholar]
- 19.Warnakulasuriya DTD, Peries P, Rathnasekara YAC, Jayawardena KTM, Upasena A, Wickremasinghe AR. Ultrasonographic parameters of the liver, spleen and kidneys among a cohort of school children in Sri Lanka. BMC Pediatr. 2017;17(1):192. Epub 2017/11/18. doi: 10.1186/s12887-017-0943-4. PubMed PMID: 29145822; PubMed Central PMCID: PMCPMC5692795. [DOI] [PMC free article] [PubMed] [Google Scholar]


