

Abstract
Colorectal cancer (CRC) is a commonly diagnosed cancer with poor prognosis and high mortality rate. Hyperthermia (HT) is an adjunctive therapy to enhance the antitumor effects of traditional chemo- or radio- therapy. Here, we report that a cluster of essential regulator genes and speed-limit enzymes of glucose metabolism were significantly elevated under HT from a glucose metabolism PCR array analysis. Under low glucose supply or glucose metabolism inhibition, CRC cells displayed increased sensitivity to HT treatments. By transcript sequencing from the established HT resistant (HTR) colon cancer cell line LoVo HTR, we observed that IGF2BP1, an RNA-binding protein, was significantly upregulated in HTR cells compared with parental cells. Furthermore, LDHA mRNA was identified as an IGF2BP1 direct target. An RNA immunoprecipitation assay and RNA pull-down assay consistently illustrated IGF2BP1 specifically bonds to the 3′ UTR of LDHA mRNA, leading to enhanced stability of LDHA mRNA. Finally, we demonstrated that inhibiting the IGF2BP1-promoted glycolysis sensitized colon cancer cells to HT treatment via both in vitro and in vivo experiments. Our findings suggest that targeting the IGF2BP1-LDHA-glycolysis pathway might be a promising therapeutic approach to enhance the anti-cancer effects of HT treatment.
Keywords: mild HT, IGF2BP1, RNA-binding protein, Warburg effect, glucose metabolism, LHDA
Graphical Abstract
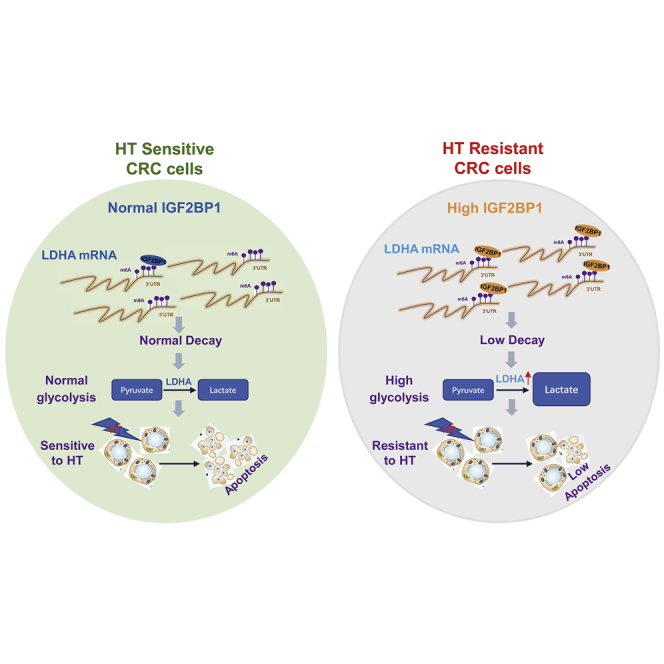
Glucose metabolism and IGF2BP1 are upregulated under HT treatment by RNA-seq analysis. IGF2BP1 promotes glucose metabolism of CRC cells via stabilization of LDHA expression by specific binding to 3′ UTR of LDHA mRNA. In vitro and in vivo experiments demonstrated inhibiting the IGF2BP1-promoted glycolysis sensitized colon cancer cells to HT.
Introduction
Colorectal cancer (CRC), a leading cause of cancer-related deaths worldwide, is a commonly diagnosed cancer with poor prognosis and high mortality rate.1,2 Currently, surgery is considered the primary therapeutic approach against colon cancer.3 In addition, radiotherapy, chemotherapy, and the implementation of neoadjuvant therapy are also promising approaches for patients with late-stage or metastatic CRC.4 Although the 5-year survival rate of colon cancer patients was improved, a large fraction of patients experienced therapeutic failure and developed local tumor recurrence.5 Mild hyperthermia (HT) is a heat-based cancer treatment that elevates the tumor temperature within the range of 39°C–45°C, resulting in a cancer-unfavorable outcome through activating cell death pathways.6,7 Studies revealed that in addition to direct suppressive effects on tumor cells, HT therapy could enhance the efficacy of chemo- and radio-therapies against cancer cells,8,9 representing a promising strategy for traditional drug-resistant cancers. Despite these advantages, widespread clinical administration of HT therapy has been limited by side effects that lead to protein denaturation and membrane damage of non-tumor tissues.10 Therefore, investigating new molecular targets to alleviate the side effects of HT treatment will contribute to improve the clinical outcomes of colon cancer patients.
The insulin-like growth factor-2 mRNA-binding protein1 (IGF2BP1), is a single-stranded RNA-binding protein that is overexpressed in diverse cancers.11 IGF2BP1 has been reported to facilitate mRNA expressions through modulating their stability and participating in multiple tumor progressions.12 In general, IGF2BP1 is defined as an am6A-binding protein, which targets more than 3,000 mRNA transcripts.13 IGF2BP1 recognizes the m6A modulation of mRNAs, which were methylated at the 3′ UTR by the methyltransferase complex, followed by recruitment of co-factors such as the ELAV-like RNA binding protein 1 (ELAVL1) to protect 3′ UTR-methylated mRNAs from degradation.14 Accumulating studies revealed that IGF2BP1 functioned as an oncogene and associated with poor prognosis in various human cancers, leading to promotion of tumor proliferation,15,16 an epithelial-to-mesenchymal transition phenotype,17 elevated migration and invasion,18 and chemoresistance.19 However, the roles of IGF2BP1 in regulating the HT-induced cancer cell death have not been elucidated yet.
Compared with un-transformed cells, cancer cells display an altered glucose metabolism phenotype characterized by enhanced conversion of glucose to lactate (aerobic glycolysis) to meet their energy demands and macromolecular biosynthesis for migration and proliferation, even in the presence of adequate oxygen.20 This new hallmark of cancer is called the “Warburg effect.”21 Moreover, the dysregulated cellular glucose metabolism has been shown to provide survival advantages of cancer cells under chemo- or/and radio-therapies, resulting in tumor occurrence.22 Recent studies reported that mild HT treatment accelerated glucose metabolism and induced oxidative stress,9,23 thus suggesting that blocking the HT-promoted anerobic glycolysis might be an effective approach against tumors. In this study, we characterized the HT-mediated glucose metabolism of colon cancer cells. The potential functions of IGF2BP1 in HT sensitivity were assessed. Moreover, the target mRNA of IGF2BP1 was identified. Our study will potentiate IGF2BP1 interference as a promising therapeutic strategy to enhance the anti-cancer effects of HT.
Results
HT treatments accelerate the glucose metabolic rate of colon cancer cells
Accumulating studies revealed that cancer cells predominantly utilize anaerobic glycolysis rather than mitochondrial oxidative phosphorylation for energy and metabolic intermediates’ production.20, 21, 22 We therefore hypothesized that the dysregulated glucose metabolism of colon cancer cells was associated with the anti-tumor effects of HT treatments. To characterize the glucose metabolism pattern of colon cancer cells under HT treatments, we performed a glucose metabolism PCR array analysis using the human glucose metabolism RT2 profiler PCR array kit. The expression profile of 84 key genes involved in the enzymatic pathways of glucose metabolism was assessed in colon cancer cells under normal temperature (control) or HT (42°C). Results from Figure 1A demonstrated that most of the genes were apparently upregulated under hyperthermic conditions. Among them, we observed significantly upregulated genes including ENO1, PGK1, HK2, LDHA, PFKP, ALDOA, PKD4, GPI, BPGM, and PKM2. Results from the PCR array were further verified by qRT-PCR experiments using LoVo cells with control (37°C) or HT treatment (42°C) (Figure 1B). To validate whether the above altered molecules under HT contributed to glucose metabolism, we examined three glucose metabolism readouts: glucose consumption, extracellular acidification rate (ECAR), which was analyzed by Seahorse extracellular flux24 and intracellular ATP levels of colon cancer cells under normal or HT (41°C, 43°C). Expectedly, the glucose metabolism as well as three glycolysis speed-limiting enzymes, Hexokinase 2 (HK2), Pyruvate kinase (PKM2), and lactate dehydrogenase-A (LDHA) were apparently elevated under hyperthermic conditions compared with 37°C (Figures 1C–1F). Taken together, these results demonstrated a HT-promoted glucose metabolism of colon cancer cells, indicating these enzymes might be therapeutic targets for enhancing the anti-cancer effects of HT treatments.
Figure 1.

Elevated glucose metabolism associates with HT resistance in colon cancer cells
(A) PCR array was performed in LoVo cells with normothermia (37°C) and HT (42°C) treatments. Differentially expressed glucose metabolism-related genes were presented by volcano plot. Red indicates upregulation and green indicates downregulation of gene expression. (B) The mRNA expressions of glycolysis enzymes were examined by qRT-PCR in LoVo cells under normothermia (37°C) or HT (42°C) treatments. (C–F) Glucose consumption (C), extracellular acidification rate (ECAR) (D), ATP level (E), and protein expressions (F) of glycolysis key enzymes were determined in LoVo cells under normothermia (37°C) or HT (41°C, 43°C) treatments. (G and H) The survival rates of LoVo parental and HTR cells under normothermia and HT were determined by MTT assay (G) and flow cytometry assay (H). (I–L) The glucose consumption (I), ECAR (J), and glycolysis key enzyme expressions (K and L) were measured from the LoVo parental and HTR cells. β-actin was an internal control for qRT-PCR and western blot. Data were presented as mean ± SD. ∗p < 0.05; ∗∗p < 0.01; ∗∗∗p < 0.001.
Glucose metabolism is positively associated with HT tolerance of colon cancer cells
Given that glucose metabolism was elevated by HT in colon cancer, to validate this correlation, we established a HT-resistant colon cancer cell line (LoVo HTR) via exposing cells to elevated high temperature (39°C to 43°C) to select the survival (resistant) cells. As shown in Figure 1G, the acquired HT-resistant cells could tolerate higher temperatures compared with LoVo parental cells. Under 41°C and 43°C, about 35% and 55% parental cells underwent cell death, while the LoVo HR cells displayed 11.5% and 18.3% cell death rates, respectively. Similar results were observed from flow cytometry experiments—that LoVo HTR cells were less sensitive to high temperature than parental cells (Figure 1H). We then assessed whether the elevated glucose metabolism of colon cancer cell contributed to HT resistance. Consistent results revealed that compared with LoVo parental cells, HT-resistant cells showed significantly increased glucose consumption, ECAR, and glycolysis key enzyme expressions (Figures 1I–IL). We next examined whether glucose metabolism is essential for the survival of colon cancer cells under HT. LoVo and HCT-116 cells were cultured under regular medium and low-glucose medium, then cells were exposed to normal (37°C) and HT (39°C, 41°C, or 43°C). Cell survival assays apparently illustrated that colon cancer cells were more sensitive to HT treatments under low-glucose supply (Figures 2A and 2B). We further inhibited cellular glucose metabolism by silencing LDHA expression or treating with glycolysis inhibitor oxamate in LoVo and HCT-116 cells. Expectedly, colon cancer cells with glycolysis inhibition displayed significantly increased susceptibilities to HT (Figures 2C–2F). To evaluate whether targeting glucose metabolism could overcome the HT resistance of colon cancer cells, LoVo HTR cells were exposed to normal or low-glucose medium. Results from Figure 2G clearly demonstrated an attenuated cell viability of HT-resistant cells under low-glucose supply compared with normal culture condition. Consistently, LoVo HTR cells with glycolysis key enzyme silencing and inhibitor treatment displayed significantly increased cell death rate with HT treatments (Figures 2H and 2I). Taken together, these results reveal that blocking glucose metabolism is an effective approach for overcoming HT resistance.
Figure 2.

Blocking glucose metabolism sensitizes colon cancer cells to HT
(A–F) LoVo and HCT-116 cells were cultured with regular medium or low-glucose medium (A and B), transfected with control siRNA or LDHA siRNA for 48 h (C and D), or treated with oxamate at 500 μM for 48 h (E and F), then cells were exposed to normothermia or HT (39°C, 41°C, or 43°C). Cell survival rates were determined by MTT assay. (G–I) LoVo HTR cells were cultured with regular medium or low-glucose medium (G), transfected with control siRNA or LDHA siRNA for 48 h (H), or treated with oxamate at 500 μM for 48 h (I), followed by exposing to normothermia or HT (39°C, 41°C, or 43°C). Cell survival rates were determined by MTT assay. Data were presented as mean ± SD. ∗p < 0.05; ∗∗p < 0.01; ∗∗∗p < 0.001.
IGF2BP1 functions as an oncogene to de-sensitize colon cancer cells to HT
To investigate the molecular mechanisms for the above-discovered positive correlation between the HT-mediated colon cancer cell death and glucose metabolism, an RNA sequencing (RNA-seq) experiment was carried out to compare differentially regulated mRNA expressions from parental and hyperthymia-resistant LoVo cells. We constructed four cDNA libraries prepared from LoVo parental and HTR cells, followed by sequencing on the Illumina HiSeq4000 platform to produce 150 nucleotide paired-end reads per sample. From a total of 80 M high-quality reads per sample, we compare the gene-expression patterns by calculating expression values in units of fragments per kilo base of exon model per million fragments mapped (FPKM). A total of differential expression results for 27,128 genes were yielded from RNA-seq. Intriguingly, among the significantly altered transcripts, we noticed IGF2BP1, an RNA-binding protein that was suggested to function as an oncogene in various cancers, was upregulated in LoVo HTR cells compared with parental cells (Figure 3A). Results from RNA-seq were further validated by qRT-PCR (Figure 3B) and western blot (Figure 3C). Consistent results showed mRNA and protein expressions of IGF2BP1 were significantly upregulated in LoVo HTR cells (Figure 3C). Moreover, under HT, IGF2BP1 mRNA was remarkedly elevated in colon cancer cells (Figure S1). These results suggested IGF2BP1 was positively associated with HT resistance. To validate the clinical relevance of IGF2BP1 in colon cancer, expressions of IGF2BP1 in 40 colon tumor tissues and their adjacent normal gastric tissues (Table 1) were detected by qRT-PCR and immunohistochemistry. Results demonstrated that the IGF2BP1 were significantly elevated in tumor tissues compared with normal tissues (Figures 3D, 3E, and S2). In addition, Kaplan-Meier plotter analysis illustrated that colon cancer patients with higher IGF2BP1 level were associated with lower survival rate (Figure 3F). Consistently, IGF2BP1 was upregulated in five colon cancer cells compared with normal colon epithelial cell lines, CRL-1790, and FHC (Figure 3G). To evaluate the direct roles of IGF2BP1 in the HT-induced colon cancer death, IGF2BP1 was overexpressed in LoVo and HCT-116 cells followed by exposing to HT at 37°C, 39°C, 41°C, or 43°C. As we expected, the 3-(4,5-dimethylthiazol-2-yl)-2,5-diphenyltetrazolium bromide (MTT) assay, clonogenic assay, and flow cytometry assay consistently demonstrated colon cancer cells with higher IGF2BP1 could better tolerate HT than control cells (Figures 3H–3J). In summary, the above results clearly demonstrated IGF2BP1 promoted HT resistance in colon cancer cells.
Figure 3.

IGF2BP1 contributes to HT resistance
(A) Transcriptome sequencing analysis was performed in LoVo parental and HT-resistant cells and presented as heatmap. Target genes with fold change >2 and <0.5 were selected for cluster analysis. Red indicates upregulation and green indicates downregulation of gene expression. (B and C) The mRNA (B) and protein (C) expressions of IGF2BP1 were measured in LoVo parental and HTR cells by qRT-PCR and western blot. β-actin was an internal control. (D) IGF2BP1 mRNA expressions were determined in 40 colon tumor tissues and their adjacent normal colon tissues. (E) Representative IHC results of IGF2BP1 expressions from colon tumor tissue and adjacent normal colon tissue. (F) Kaplan-Meier plot survival rate was analyzed in patients with low and high IGF2BP1 expression. (G) mRNA expressions of IGF2BP1 were detected from two normal colon epithelial cell lines and five colon cancer cell lines. (H) LoVo cells were transfected with control vector or IGF2BP1 overexpression vector for 48 h, followed by exposing to normothermia or HT. (I and J) Cell survival rate was determined by MTT assay, (I) clonogenic assay, and (J) flow cytometry assay. Data were presented as mean ± SD. ∗p < 0.05; ∗∗p < 0.01; ∗∗∗p < 0.001.
Table 1.
Characteristics of forty CRC patients enrolled in this study
| Characteristic | Cases | Percentages (%) |
|---|---|---|
| Age | ||
| <20 | 1 | 2.5 |
| 20–50 | 18 | 45 |
| >50 | 21 | 52.5 |
| Gender | ||
| Male | 17 | 42.5 |
| Female | 23 | 57.5 |
| Stage | ||
| I | 18 | 45 |
| II | 12 | 30 |
| III | 8 | 20 |
| IV | 2 | 5 |
| Differentiate | ||
| Well | 9 | 22.5 |
| Moderately | 27 | 67.5 |
| Poorly | 3 | 7.5 |
| Undifferentiated | 1 | 2.5 |
| Metastasis | ||
| No | 27 | 67.5 |
| Yes | 13 | 32.5 |
IGF2BP1 promotes glucose metabolism of colon cancer cells
The above results revealed correlations between the HT-modulated glucose metabolism and IGF2BP1 upregulation in colon cancer. To assess whether IGF2BP1 could regulate glucose metabolism, IGF2BP1 was overexpressed in colon cancer cells. Expectedly, the glycolytic phenotypes (glucose consumption and ECAR) from IGF2BP1-overexpressing CRC cells were significantly elevated (Figures 4A, 4B, and S3). Overexpression of IGF2BP1 upregulated glucose metabolism key enzymes, HK2, PKM2, and LDHA (Figures 4C and S3). Meanwhile, CRC cells with IGF2BP1 knockdown displayed reverse glycolytic phenotypes (Figure S4). Summarily, these results suggest that the IGF2BP1-promoted glucose metabolism might be a therapeutic target against HT-resistant colon cancer.
Figure 4.

IGF2BP1 promotes glucose metabolism via stabilizing LDHA mRNA through binding to 3′ UTR of LDHA mRNA
(A–C) Glucose consumption (A), ECAR (B), and glycolysis enzyme protein expressions (C) from LoVo cells without or with IGF2BP1 overexpression were measured. (D) Predicted binding motif of IGFBP2 on 3′ UTR of LDHA mRNA. (E) RNA immunoprecipitation (RIP) was performed in LoVo and HCT-116 cells using anti-IgG control or anti-IGF2BP1 antibody. LDHA and β-actin mRNA abundance in immunoprecipitated fraction were measured by qRT-PCR. (F) RNA pull-down assay was performed in LoVo and HCT-116 cells as described in the Materials and methods. Biotin-labeled 3′ UTR of wild-type (WT) or binding motif mutant LDHA was incubated with cell extracts. The IGF2BP1 protein was assayed by western blotting. β-actin was a negative control. (G) LoVo and HCT-116 cells were transfected with control shRNA or IGF2BP1 shRNA for 48 h; RIP experiments were performed using an anti-IgG control or anti-IGF2BP1 antibody. LDHA and β-actin mRNA abundance in immunoprecipitated fraction were measured by qRT-PCR. (H and I) The LDHA 3′ UTR reporter constructs containing the WT or mutant (Mut) IGF2BP1 binding motif were co-transfected with control shRNA or IGF2BP1 shRNA into LoVo and HCT-116 cells. The luciferase activities were measured using a dual-luciferase reporter assay kit. (J and K) LoVo and HCT-116 cells were treated with 5 μg/mL actinomycin D for 0, 2, 4, 6, and 8 h, and the relative LDHA mRNA levels were measured by qRT-PCR. The half-life of LDHA mRNA was analyzed by non-linear regression analysis. Data were presented as mean ± SD. ∗p < 0.05; ∗∗p < 0.01; ∗∗∗p < 0.001.
IGF2BP1 upregulates LDHA expression via direct binding to 3′ UTR of LDHA mRNA
Studies revealed that IGF2BP1 was a typical RNA-binding protein and the directly post-transcriptional regulation of target genes was the major molecular mechanism.11 Thus, we investigated the downstream RNA targets of IGF2BP1. Bioinformatics analysis predicted a protein-RNA interaction between IGF2BP1 and LDHA (Figure S5A). The 3′ UTR of LHDA mRNA contains multiple IGF2BP1-binding motifs (Figure S5B). Among them, one motif (Figure 4D) showed the strongest binding with IGF2BP1 by verified by electrophoretic mobility shift assay (EMSA) assays (Figures S6A and S6B). Since previous reports illustrated that IGF2BP1 physically associates with 3′ UTR of its target mRNA to enhance mRNA stability,11 we therefore hypothesized IGF2BP1 upregulates LDHA expression though enhancing the downstream target mRNA stability by directly binding on 3′ UTR of LHDA. To evaluate this, RNA immunoprecipitation (RIP) assay was performed in LoVo and HCT-116 cells using an antibody specifically against IGF2BP1. qRT-PCR results revealed that LDHA mRNA was significantly enriched in IGF2BP1 co-precipitated RNA fragments (Figure 4E) compared with the immunoglobulin G (IgG) control antibody. Moreover, results from RNA pull-down experiments using a biotin-labeled 3′ UTR fragment of LDHA containing the predicted binding motif demonstrated significant enrichment of IGF2BP1 protein, which bonds to LDHA 3′ UTR compared with the negative control (antisense RNA of binding motif) (Figure 4F). These results elucidated a specific association between IGF2BP1 and LDHA mRNA. To test whether IGF2BP1 upregulated LDHA mRNA through associating with it, colon cancer cells with control or IGF2BP1 knockdown were subjected to RIP analysis. Expectedly, cells with lower IGF2BP1 immunoprecipitated less amounts of LDHA mRNA fragments (Figure 4G). To further validate the direct binding of IGF2BP1 on the predicted binding motif on 3′ UTR, we conducted binding motif mutations on LDHA 3′ UTR and performed a dual-luciferase reporter assay. Results in Figures 4H and 4I consistently showed that compared with control cells, the IGF2BP1-silencing cells exhibited a significant enhancement of luciferase activity of the wild-type LDHA 3′ UTR reporter (Figures 4H and 4I). However, IGF2BP1-knockdown cells showed less repressive effects on the binding motif mutant LDHA 3′ UTR construct (Figures 4H and 4I), suggesting IGF2BP1 directly associated with the predicted binding motif on LHDA 3′ UTR. To examine the effects of IGF2BP1 on mRNA stability of LDHA via the above-described mechanisms, we carried out RNA stability assays to analysis the half-life of LDHA mRNA in control and IGF2BP1-silencing colon cancer cells. As shown in Figures 4J and 4K, the half-life of LDHA mRNA was 5.25 and 5.32 h in LoVo and HCT-116 cells, respectively, while the half-lives of LDHA mRNAs in IGF2BP1-knockdown cells were shorter than 2.5 hours. Taken together, these results clearly demonstrated that IGF2BP1 upregulated LDHA expression through direct bind to 3′ UTR of LDHA, leading to stabilization of LDHA mRNA.
Sensitization of colon cancer cells to HT through inhibiting the IGF2BP1-promoted glucose metabolism in vitro and in vivo
Given the above-revealed molecular mechanisms that IGF2BP1 promoted glucose metabolism via upregulating LDHA expression by promoting its mRNA stability, we therefore investigated the clinical significance of IGF2BP1 in the HT-induced glucose metabolism and cancer cell death. IGF2BP1 was silenced in LoVo and HCT-116 cells. Results in Figures S7A–S7D demonstrated that the glycolysis rates of CRC cells with lower IGF2BP1 expressions were only slightly promoted by HT, indicating the HT-promoted glycolysis upregulation was majorly through the activation of IGF2BP1. Expectedly, consistent results from the MTT assay and clonogenic assay analysis showed colon cancer cells with lower IGF2BP1 were more sensitive to HT (41°C and 43°C) compared with control cells (Figures 5A–5C), indicating that blocking IGF2BP1 is an effective approach against HT resistance in colon cancer. To investigate whether the IGF2BP1-promoted HT resistance was through suppression of cellular metabolism, IGF2BP1 was overexpressed in LoVo and HCT-116 cells, the glucose metabolisms of which were then blocked by LDHA inhibitor oxamate followed by HT treatment. As we expected, overexpression of IGF2BP1 rendered colon cancer cells resistant to HT (Figures 5D–5G). However, further blocking glucose metabolism significantly overrode the IGF2BP1-mediated HT resistance (Figures 5D–5G). Taken together, these results suggest IGF2BP1 de-sensitized colon cancer cells to HT treatment through activating glucose metabolism.
Figure 5.

Inhibiting the IGF2BP1-promoted glucose metabolism sensitizes colon cancer cells to HT
(A and B) LoVo and HCT-116 cells without or with IGF2BP1 silencing were exposed to normothermia or hypothermia. Cell survival rates were determined by MTT assay and (C) clonogenic assay. (D and E) LoVo and HCT-116 cells without or with IGF2BP1 overexpression were treated with oxamate at the indicated concentrations, followed by normothermia or hypothermia treatment. Cell survival rates were determined by MTT assay and (F and G) flow cytometry assay. Data were presented as mean ± SD. ∗p < 0.05; ∗∗p < 0.01.
To investigate whether the above in vitro antitumor effects of silencing IGF2BP1 and HT could be reproduced in vivo, we established a xenograft mouse model by injection of LoVo HT-resistant cells without or with IGF2BP1 knockdown into the mammary fat pads of 6-week-old nude mice. After tumors formed, we separated mice into four groups: control short hairpin RNA (shRNA) and 37°C, IGF2BP1 knockdown and 37°C, control shRNA and 42°C, and IGF2BP1 knockdown and 42°C. Expectedly, 28 days after treatments, most control shRNA infected mice that received normothermia treatment died within 2 months. Compared with mice that only received HT treatment, mice with IGF2BP1 knockdown and normothermia treatments showed slightly improved survival rates (Figure 6A). Importantly, mice with IGF2BP1 knockdown and HT treatments achieved a significantly prolonged survival rate (Figure 6A). Meanwhile, consistent results demonstrated that mice with IGF2BP1 knockdown and HT treatment had significantly decreased tumor size compared to those from other groups (Figures 6B and 6C), suggesting an in vivo synergistically antitumor growth by the combination of IGF2BP1 silencing and HT treatments. Moreover, qRT-PCR analysis from mouse tumors showed that the mRNA expressions of glycolysis key enzymes, LDHA, PKM2, and HK2 were significantly induced under 42°C but silencing IGF2BP1 successfully blocked the HT-induced glycolysis enzymes in xenograft tumors (Figures 6D–6F). In summary, these in vivo results revealed that IGF2BP1 inhibition re-sensitized xenograft tumors generated from HTR cells to HT treatment through glucose metabolism inhibition, presenting the combination of IGF2BP1 inhibition with HT as an effective therapeutic approach against colon cancer.
Figure 6.

In vivo mice xenograft tumor experiment shows silencing IGF2BP1 sensitizes the HTR cancer-cell-derived tumors to HT
(A) LoVo HTR cells stably transfected with control shRNA or IGF2BP1 shRNA were subcutaneously injected into BALB/c mice (n = 10). After the establishment of xenograft tumors, mice were grouped as described in the Materials and methods and treated with normothermia or HT. The survival rates of mice were recorded. (B) Tumor volumes from the above treated mice were measured each 5 days. (C) Representative mouse xenograft tumors from the above treatment groups. (D–F) Mice from the above treatments were sacrificed and the mRNA expressions of LDHA (D), PKM2 (E), and HK2 (F) from tumors were detected by qRT-PCR. Data were presented as mean ± SD. ∗p < 0.05; ∗∗p < 0.01; ∗∗∗p < 0.001.
Discussion
Thermotherapy, as an anticancer therapeutic approach, has recently been widely studied from basic and clinical investigators. In contrast to chemo- and radio-therapeutic strategies, thermotherapy is not restricted by the molecular genetics and signal transduction pathways that regulate cancer cell progression but is applicable to various cancer types.6 However, the HT approach has limitations, since high temperature will suppress both the malignant and healthy cells due to low selectivity.6,7 Moreover, resistance to HT treatments is another the major barrier in clinical applications.7 Thus, investigating the underlying molecular mechanism for overcoming this obstacle is one of the main focuses of the current hyperthermic therapeutics research. As an RNA-binding protein, IGF2BP1 has been reported to function as an oncogene in cancers, associating with poor overall survival and prognosis in various types of human cancers.15, 16, 17, 18, 19 Moreover, recent studies uncovered that IGF2BP1 post-transcriptionally regulates its essential mRNA target expressions, which play essential roles for the control of tumor cell proliferation, differentiation, metastasis, and chemoresistance.11 Therefore, IGF2BP1 has been regarded as a potentially therapeutic target for various cancers.11 In this study, we proposed an IGF2BP1-promoted glucose metabolism, which leads to HT resistance in colon cancer, suggesting IGF2BP1 inhibition has synergistic anticancer effects with HT treatment.
Accumulating evidence elucidated elevated glucose metabolism in cancer cells, a phenomenon called the “Warburg effect,” characterized by preferential dependence on anaerobic glycolysis even under plenty of oxygen supply.20 Moreover, the Warburg effect has been demonstrated to link to chemo- or radio-therapies.21 Recent studies revealed that mild HT accelerated bioenergetics of cancer cells in real time.23 However, the regulatory mechanisms for the HT-mediated cancer cell apoptosis have not been fully understood. This study first utilized Seahorse XF technology to assess the HT-induced metabolic alterations of colon cancer cells. We found under mild HT (41°C– 43°C), glucose metabolism of colon cancer cells was significantly increased. Under low-glucose supply, colon cancer cells displayed more sensitivity to HT treatments, indicating that targeting glucose metabolism could effectively enhance the HT treatment efficiency. It was known that HT simultaneously activates antiapoptosis pathways through activating antiapoptotic pathways such as Hsp90 and survivin, which eventually lead to HT resistance.25 By establishment of HT-resistant colon cancer cells, we observed that glucose metabolism was significantly elevated in HTR cells compared with parental cells. Our results elucidated a new mechanism for HTR in cellular metabolism aspect.
To solve the HT resistance in colon cancer, it is essential to uncover the molecular mechanism for developing specifically effective strategies. We found IGF2BP1 was significantly upregulated in HTR cells. In addition, results revealed IGF2BP1 functioned as an oncogene in colon cancer. Recent studies revealed that IGF2BP1 upregulated mRNA expression of c-Myc through binding to the 3′ UTR of c-Myc, leading to stabilizing mRNA.26 Since c-Myc is a well-studied oncogene that promotes glutamine metabolism,27 it is possible that IGF2BP1 may also regulate glutamine metabolism through activating the c-Myc signaling pathways. In this study, we reported that LDHA, a glycolysis speed-limiting enzyme, was a direct target of IGF2BP1. Bioinformatics analysis suggested multiple binding motifs exist on 3′ UTR of LDHA. We further identified one strongest-binding motif, which was verified by RIP and RNA pull-down assays. Furthermore, a luciferase assay clearly showed specific binding of IGF2BP1 on the binding motif in 3′ UTR of LDHA. Importantly, silencing IGF2BP1 by shRNA effectively overrode the resistance of HTR cells from both in vitro and in vivo models.
The discoveries of this study demonstrated that targeting the IGF2BP1-promoted glucose metabolism under HT can be used to enhance the effects of thermotherapy on colon cancer, leading to opening new avenues for future clinical administrations based on HT plus metabolism interventions. However, this study still has limitations, in that it lacks investigating the precise molecular components for the IGF2BP1-mediated LDHA mRNA stabilization under normothermia and HT. It was known that some co-factors of IGF2BP1, such as the ELAV-like RNA binding protein 1 (ELAVL1), could be recruited by IGF2BP1 to protect m6A-containing mRNAs from degradation.11 Whether the mRNA of LDHA is methylated at m6A resulting in recognition by IGF2BP1 needs to be further evaluated.
In summary, we demonstrated the biological roles and mechanisms of IGF2BP1 in regulating the LDHA-mediated glucose metabolism, which contributes to thermotherapy resistance. This study suggests targeting the IGF2BP1-promoted glucose metabolism under mild HT might be a therapeutic strategy against colon cancer.
Materials and methods
Patient sample collections
This study was approved by the Institutional Ethical Review Boards of the Affiliated Cancer Hospital & Institute of Guangzhou Medical University and complied with the Declaration of Helsinki. Written informed consent was obtained from all patients. A total of 40 colon cancer patients with no preoperative chemo- or radio-treatments were enrolled in this study (Table 1). Samples were collected from patients who were diagnosed and underwent primary surgical resection in the Department of Abdominal Surgery, Affiliated Cancer Hospital & Institute of Guangzhou Medical University during 2017–2019. After surgery, colon tumor tissues and corresponding adjacent normal tissues were immediately frozen by liquid nitrogen and stored at −80°C for further analysis.
Cell culture and reagents
Normal human colon epithelial cell lines, CRL-1790 and FHC, and five human colon cancer cell lines, DLD-1, HCT-116, HT-29, SW620, and LoVo, were obtained from the American Type Culture Collection (ATCC, Manassas, VA, USA). Cells were cultured in Dulbecco’s modified Eagle’s medium (DMEM) (Thermo Fisher Scientific, Shanghai, China) supplemented with 10% heat-inactivated fetal bovine serum (Gibco, Carlsbad, CA, USA), 100 U/mL penicillin G, and 100 μg/mL streptomycin (Thermo Fisher Scientific) at 37°C with a humidified air containing 5% CO2. The low-glucose DMEM medium was purchased from Thermo Fisher (Shanghai, China). The HT treatment protocol was followed as reported previously.23 The HT-resistant colon cancer cell line LoVo was established by repeated exposing of cells to gradually increased HT conditions to select the survival cells. The rabbit anti-IGF2BP1 (#8482), anti-hexokinase 2 (#2867), anti-PKM2 (#4053), anti-LDHA (#3582), and anti-β-actin (#4970) antibodies were purchased from Cell Signaling Technology (Danvers, MA, USA). Oxamate was purchased from Sigma-Aldrich (Shanghai, China).
Transfections of small interfering RNA (siRNA), shRNA, and plasmid DNA
Transfections were conducted using the Lipofectamine 3000 reagent (Invitrogen, Carlsbad, CA, USA) according to the manufacturer’s instructions. Colon cancer cells were seeded in 6-well plates at a density of 5 × 10⁵ cells/well overnight before transfection. When cells achieved 70% confluence, control siRNA, siLDHA, IGF2BP1 overexpression plasmid, or shIGF2BP1 and their negative controls were transfected into cells for 48 h. siRNA and shRNA knockdown efficiency were validated by qRT-PCR in colon cancer cell lines. IGF2BP1 overexpression vector and control vector were obtained from Origene.com. The control siRNA and siLDHA were synthesized by Gene-Pharma (Shanghai, China). The IGF2BP1 shRNA and the scramble negative controls were synthesized from RiboBio (Guangzhou, China). siRNAs were transfected at 50 nM. Forty-eight hours post-transfection, cells were further analyzed in downstream experiments. Transfection was performed in triplicate.
Colony-formation assay
Colon cancer cells (500 cells/well) were seeded in 6-well plates and exposed to normothermia or HT each day for 2 weeks. Cell culture medium was refreshed every 3 days. Cell colonies were then fixed with 4% paraformaldehyde (Sangon, China) for 10 min and stained with 0.5% crystal violet (Beyotime, China) for 15 min at room temperature. Colonies were counted under the microscope. Experiments were repeated three times and performed in triplicate.
Bioinformatics analysis
The binding motif of IGF2BP1 on 3′ UTR of LDHA mRNA was predicted by starBase of ENCORI (http://starbase.sysu.edu.cn/). The Kaplan-Meier plotter survival rate for colon cancer patients with low or high IGF2BP1 level was analyzed by Ualcan (ualcan.path.uab.edu).
Measurement of cellular glucose metabolism
The glucose consumption of colon cancer cells was measured using the glucose uptake assay kit (#ab136955, Abcam, Shanghai, China) according to the manufacturer’s instruction. The ECAR was detected by the Seahorse XF glycolysis stress test kit from Agilent Technologies using the Seahorse XFp analyzer (Agilent, Santa Clara, CA, USA) according to the manufacturer’s instructions. An equal number of cells from each treatment were applied. Results were normalized by protein amount of each sample. Total RNA for PCR array was isolated from colon cancer cells using a RNeasy mini kit (QIAGEN, Hilden, Germany). The expression profile of 84 key genes involved in the regulation and enzymatic pathways of glucose metabolism was analyzed using the human glucose metabolism RT2 profiler PCR array (SABiosciences-QIAGEN, Hilden, Germany). The relative quantification was calculated using the 2−ΔΔCt method. The alterations of expression in the 84 genes is presented as a volcano plot. Experiments were performed in triplicate and repeated three times.
RNA isolation and qRT-PCR
Total RNAs from colon cancer cells and tumor tissues were isolated using TRIzol reagent (Invitrogen, Carlsbad, CA, USA) according to the manufacturer’s instruction. The quality and quantity of RNA samples were checked by a NanoDrop ND-2000 spectrophotometer (Thermo Scientific, Rockford, IL, USA). RNA samples were DNase treated. cDNA synthesis was performed using 1 μg RNA sample by a high-capacity cDNA reverse transcription kit (Thermo Fisher Scientific, Waltham, MA, USA) according to the manufacturer’s instructions. The qRT-PCR reactions were conducted using the SYBR green qPCR SuperMix reagents (Thermo Fisher Scientific, Waltham, MA, USA) and the CFX96 touch sequence detection facility (Bio-Rad, Hercules, CA, USA). β-actin were used as an internal control. The reaction conditions were as follows: 95°C for 3 min, followed by 40 cycles of 95°C for 30 s and 60°C for 30 s. The relative expressions were calculated using the 2−ΔΔCT method. Experiments were performed in triplicate and three independent experiments were conducted.
RNA-seq analysis
Total RNA for RNA-seq experiments was isolated from colon cancer cells using a RNeasy mini kit (QIAGEN, Hilden, Germany). The quality and quantity of RNA samples were assessed by measuring the absorbance at 260 nm/280 nm (A260/A280) using Smartspec plus (Bio-Rad, USA). The integrity of RNA was further verified by 1.5% agarose gel electrophoresis. For each sample, 2 μg of the total RNA was used for RNA-seq library preparation by VAHTS stranded mRNA-seq library prep kit (Vazyme). The polyadenylated mRNAs were purified and concentrated with oligo (dT)-conjugated magnetic beads (Invitrogen, Carlsbad, CA, USA). After fragmentation, polyadenylated mRNAs were converted into double-strand cDNA followed by ligation into VAHTS RNA adapters (Vazyme). Purified ligation products corresponding to 200–500 bps were digested, amplified, purified, and quantified for sequencing. For high-throughput sequencing, the libraries were prepared following the manufacturer’s instructions and applied to the Illumina HiSeq X Ten system for 150-nt paired-end sequencing. The Illumina HiSeq4000 system was used to collect sequencing data (Illumina, San Diego, CA, USA).
RIP
Total RNA for RIP experiments was isolated from colon cancer cells using a RNeasy mini kit (QIAGEN, Hilden, Germany). RIP was conducted using the Magna RIPTM RNA-binding protein immunoprecipitation kit (Millipore, Bedford, MA, USA) according to the manufacturer’s instructions. In brief, cells were lysed in RIP lysis buffer from the kit. Anti-IGF2BP1 (dilution 1:50) or anti-IgG (ab172730, Abcam) antibody with A/G immunomagnetic beads were premixed in immunoprecipitation buffer then added into cell lysates to immuno-precipitate IGF2BP1-RNA complexes followed by treatment with proteinase K. Purified RNA samples were subjected to qPCR and RT-PCR to measure enrichment of LDHA mRNA, which bond with IGF2BP1 protein. Experiments were repeated three times.
RNA pull-down assay
RNA pull-down was conducted according to previous report.28 In brief, a fragment of LDHA 3′ UTR containing the predicted binding motif and the negative control (antisense RNA of binding motif) were in vitro transcribed using a biotin RNA labeling mix (Roche, Shanghai, China), followed by treatment with RNase-free DNase I and purified using an RNeasy mini kit (QIAGEN, Shanghai, China). Proteins from colon cancer cell extracts were mixed with biotinylated RNA at 50 pmol/mg. The mixture was incubated with streptavidin agarose beads (Invitrogen, Carlsbad, CA, USA) then washed three times with NaCl/Pi at room temperature. Protein samples were detected by western blot. Glyceraldehyde 3-phosphate dehydrogenase (GAPDH) was a negative control. Experiments were repeated three times.
Dual-luciferase reporter gene assay
The LDHA wild-type 3′ UTR and binding motif mutant 3′ UTR vector were constructed from Genechem (Shanghai, China). In brief, colon cancer cells were seeded in 24-well plates at a density of 5 × 10⁴ cells/well. Cells were then co-transfected with control shRNA or IGF2BP1 shRNA and the above described pGL3-reporter luciferase reporter plasmid using Lipofectamine 2000 (Thermo Fisher Scientific, Waltham, MA, USA). After 48 h, luciferase activity was measured using a dual-luciferase reporter assay system (Promega, Fitchburg, WI, USA) according to the manufacturer’s instructions. Firefly luciferase activity was normalized to that of the Renilla luciferase. Experiments were performed in triplicate and repeated three times.
RNA stability assay
The RNA stability assay was performed according to previous reports.28 In brief, the half-life of LDHA mRNA was assessed by treating cells with actinomycin D (5 μg/mL). Cells were collected at 0, 2, 4, 6, and 8 h. Total RNA was isolated using a RNeasy mini kit (QIAGEN, Hilden, Germany). The LDHA mRNA levels were detected by qRT-PCR. Experiments were performed in triplicate and repeated three times.
Immunohistochemical staining
For immunohistochemical staining of IGF2BP1 protein, paraffin-embedded human colon-tumor tissues were sectioned and de-paraffinized with xylene followed by dehydration with a graded series of alcohol. Antigen retrieval was conducted by heating in 0.1 M citrate buffer, followed by blocking with blocking buffer (Thermo Fisher Scientific, Waltham, MA, USA). Slices were stained with anti-IGF2BP1 antibody (1:100) at 4°C overnight. Then, samples on slices were incubated with a horseradish peroxidase (HRP)-labeled goat anti-rabbit secondary antibody. After washing, sections were scanned by Pannoramic 250 flash III (3DHistech, Hungary).
Cell viability assay
The cell viability was determined by an MTT (3-(4,5-dimethylthiazol-2-yl)-2,5-diphenyltetrazolium bromide) assay (Sigma, St. Louis, MO, USA) according to the manufacturer’s instructions. Cells (5 × 10³) were seeded into 96-well plates and cultured for 24 h. Medium was refreshed and cells were stained with 0.5 mg/mL MTT for 4 h at 37°C. After washing by PBS, 200 μL of dimethylsulfoxide (DMSO) was added into each well for 2 h at 37°C to dissolve precipitates. The optical density (OD) of each well was measured at 490 nm using a spectrometer reader. Relative viability was calculated from the absorbance of HT-treated cells/the absorbance of control cells and normalized by cell protein concentrations. Experiments were performed in triplicate and repeated three times.
Flow cytometry analysis
The colon cancer cell death under HT and/or gene silencing was determined by flow cytometry analysis using an annexin V-PE apoptosis detection kit (BD Biosciences) according to the manufacturer’s instructions. 5 × 10⁵ cells/well were seeded in 6-well plates and incubated until they were about 70% confluent. The cyclopamine medium was replaced with fresh media, and the cells were incubated for 48 h before analysis. The labeled cells (7 × 10³/sample) were analyzed using FACScan flow cytometry (BD Biosciences) and the FlowJo software. Experiments were performed in triplicate and repeated three times.
Western blotting
Total proteins were isolated from colon cancer cells, which were lysed on ice by radioimmunoprecipitation assay (RIPA) lysis buffer (Tris 20 mM, NaCl 150 mM, 1% Triton X-100) containing 1× protease inhibitor cocktail (Sigma-Aldrich, Shanghai, China). Lysates were centrifuged at 10,000 × g at 4°C to collect the supernatant. Protein was quantified by Bradford assay (Bio-Rad, Hercules, CA, USA). Forty microgram protein of each sample was resolved on a 10% SDS-PAGE gel and transferred onto nitrocellulose membranes. Membranes were blocked with 5% BSA in tris-buffered saline tween20 (TBST) (0.1% Tween-20) for 1 h at room temperature. After washing with TBST, membranes were incubated with primary antibodies at 1:1,000 at 4°C for overnight. Membranes were completely washed by TBST then incubated with horseradish peroxidase-linked secondary antibody at 1:3,000 at room temperature for 1 h. Protein bands were detected usingba Pierce ECL western blotting kit (Thermo Fisher Scientific, Carlsbad, CA, USA) using an imaging system according to the manufacturer’s protocol. β-actin was an internal control. Experiments were repeated three times.
In vivo xenograft mice experiments
The animal protocol was approved by the Ethics Committee of the Affiliated Cancer Hospital & Institute of Guangzhou Medical University and complied with the animal guidelines of the Institutional Animal Care and Use Committee of Guangzhou Medical University. BALB/c nude mice (5–6 weeks of age) were maintained in the experimental animal center of Guangzhou Medical University in a pathogen-free environment. LoVo HT-resistant cells were stably transfected with control shRNA or shIGF2BP1. 8 × 10⁶ cells with or without IGF2BP1 knockdown were subcutaneously injected into the mice in a volume of 100 mL to establish xenograft models until tumors reached a size of greater than 100 mm3. Mice were divided into four groups with 10 mice per group: control shRNA under normothermia, shIGF2BP1 under normothermia, control shRNA under HT (42°C), and shIGF2BP1 under HT (42°C). For the HT treatment, the tumor-bearing mice were suspended on wood shelves with cloth belts around the chest, then the tumor-bearing latter part of the body of mice were heated with 37°C or 42°C water for 1 h, followed by blow-drying using a dryer. Treatment was performed twice a day for 40 days. Tumor size was monitored every 3 days, and mouse survival was monitored daily. Tumor volumes were calculated as length × width2 × 0.5. After 80 days, all the survival mice were euthanized by CO2 method. Xenograft tumor tissues were surgically dissected stored at −80°C for downstream analysis.
Statistical analysis
Experiments were performed in triplicate and repeated three times. Statistical analysis was performed using the GraphPad Prism 6.0 software (GraphPad Software, La Jolla, CA, USA). Data were presented as mean ± SD. Student’s t test was applied to compare differences in two groups. One-way ANOVA was applied to compare the continuous variables among multiple groups. p <0.05 was considered as statistically significant.
Ethical approval and consent to participate
This study was approved by the Institutional Ethical Review Boards of the Affiliated Cancer Hospital & Institute of Guangzhou Medical University, and written informed consent was obtained from all patients.
Availability of supporting data
The authors declare that all the data supporting the findings in this study are available in this study, and its supplementary materials are available from the corresponding author through reasonable request.
Acknowledgments
The authors are highly thankful to all the medical doctors and scientific researchers in the Department of Abdominal Surgery, Affiliated Cancer Hospital & Institute of Guangzhou Medical University.
Author contributions
K.-j.L. and J.-x.F. designed the study. J.-x.F. and G.-j.L. carried out the experiments. X.-l.Z. analyzed and interpreted the results. Y.-l.F. performed the statistical analysis. X.-l.Z. wrote and edited the manuscript. All of the authors have given written informed consent for publication.
Declaration of interests
The authors declare no competing interests.
Footnotes
Supplemental Information can be found online at https://doi.org/10.1016/j.omtn.2020.12.020.
Supplemental information
References
- 1.Cappell M.S. Pathophysiology, clinical presentation, and management of colon cancer. Gastroenterol. Clin. North Am. 2008;37:1–24, v. doi: 10.1016/j.gtc.2007.12.002. [DOI] [PubMed] [Google Scholar]
- 2.Udayasiri D.K., Skandarajah A., Hayes I.P. Laparoscopic Compared With Open Resection for Colorectal Cancer and Long-term Incidence of Adhesional Intestinal Obstruction and Incisional Hernia: A Systematic Review and Meta-analysis. Dis. Colon Rectum. 2020;63:101–112. doi: 10.1097/DCR.0000000000001540. [DOI] [PubMed] [Google Scholar]
- 3.Dienstmann R., Salazar R., Tabernero J. Personalizing colon cancer adjuvant therapy: selecting optimal treatments for individual patients. J. Clin. Oncol. 2015;33:1787–1796. doi: 10.1200/JCO.2014.60.0213. [DOI] [PubMed] [Google Scholar]
- 4.Meyers B.M., Cosby R., Quereshy F., Jonker D. Adjuvant Chemotherapy for Stage II and III Colon Cancer Following Complete Resection: A Cancer Care Ontario Systematic Review. Clin. Oncol. (R. Coll. Radiol.) 2017;29:459–465. doi: 10.1016/j.clon.2017.03.001. [DOI] [PubMed] [Google Scholar]
- 5.Hangaard Hansen C., Gögenur M., Tvilling Madsen M., Gögenur I. The effect of time from diagnosis to surgery on oncological outcomes in patients undergoing surgery for colon cancer: A systematic review. Eur. J. Surg. Oncol. 2018;44:1479–1485. doi: 10.1016/j.ejso.2018.06.015. [DOI] [PubMed] [Google Scholar]
- 6.Mallory M., Gogineni E., Jones G.C., Greer L., Simone C.B., 2nd Therapeutic hyperthermia: The old, the new, and the upcoming. Crit. Rev. Oncol. Hematol. 2016;97:56–64. doi: 10.1016/j.critrevonc.2015.08.003. [DOI] [PubMed] [Google Scholar]
- 7.Zhang X., Li Y., Huang Q., Wang H., Yan B., Dewhirst M.W., Li C.Y. Increased resistance of tumor cells to hyperthermia mediated by integrin-linked kinase. Clin. Cancer Res. 2003;9:1155–1160. [PubMed] [Google Scholar]
- 8.Chu K.F., Dupuy D.E. Thermal ablation of tumours: biological mechanisms and advances in therapy. Nat. Rev. Cancer. 2014;14:199–208. doi: 10.1038/nrc3672. [DOI] [PubMed] [Google Scholar]
- 9.Zhu Q., Zhang A., Liu P., Xu L.X. Study of tumor growth under hyperthermia condition. Comput. Math. Methods Med. 2012;2012:198145. doi: 10.1155/2012/198145. [DOI] [PMC free article] [PubMed] [Google Scholar]
- 10.Hegyi G., Szigeti G.P., Szász A. Hyperthermia versus Oncothermia: Cellular Effects in Complementary Cancer Therapy. Evid. Based Complement. Alternat. Med. 2013;2013:672873. doi: 10.1155/2013/672873. [DOI] [PMC free article] [PubMed] [Google Scholar]
- 11.Huang X., Zhang H., Guo X., Zhu Z., Cai H., Kong X. Insulin-like growth factor 2 mRNA-binding protein 1 (IGF2BP1) in cancer. J. Hematol. Oncol. 2018;11:88. doi: 10.1186/s13045-018-0628-y. [DOI] [PMC free article] [PubMed] [Google Scholar]
- 12.Müller S., Glaß M., Singh A.K., Haase J., Bley N., Fuchs T., Lederer M., Dahl A., Huang H., Chen J. IGF2BP1 promotes SRF-dependent transcription in cancer in a m6A- and miRNA-dependent manner. Nucleic Acids Res. 2019;47:375–390. doi: 10.1093/nar/gky1012. [DOI] [PMC free article] [PubMed] [Google Scholar]
- 13.Chen X.Y., Zhang J., Zhu J.S. The role of m6A RNA methylation in human cancer. Mol. Cancer. 2019;18:103. doi: 10.1186/s12943-019-1033-z. [DOI] [PMC free article] [PubMed] [Google Scholar]
- 14.Bi Z., Liu Y., Zhao Y., Yao Y., Wu R., Liu Q., Wang Y., Wang X. A dynamic reversible RNA N6 -methyladenosine modification: current status and perspectives. J. Cell. Physiol. 2019;234:7948–7956. doi: 10.1002/jcp.28014. [DOI] [PubMed] [Google Scholar]
- 15.Müller S., Bley N., Glaß M., Busch B., Rousseau V., Misiak D., Fuchs T., Lederer M., Hüttelmaier S. IGF2BP1 enhances an aggressive tumor cell phenotype by impairing miRNA-directed downregulation of oncogenic factors. Nucleic Acids Res. 2018;46:6285–6303. doi: 10.1093/nar/gky229. [DOI] [PMC free article] [PubMed] [Google Scholar]
- 16.Liu Z., Wu G., Lin C., Guo H., Xu J., Zhao T. IGF2BP1 over-expression in skin squamous cell carcinoma cells is essential for cell growth. Biochem. Biophys. Res. Commun. 2018;501:731–738. doi: 10.1016/j.bbrc.2018.05.057. [DOI] [PubMed] [Google Scholar]
- 17.Zirkel A., Lederer M., Stöhr N., Pazaitis N., Hüttelmaier S. IGF2BP1 promotes mesenchymal cell properties and migration of tumor-derived cells by enhancing the expression of LEF1 and SNAI2 (SLUG) Nucleic Acids Res. 2013;41:6618–6636. doi: 10.1093/nar/gkt410. [DOI] [PMC free article] [PubMed] [Google Scholar]
- 18.Stöhr N., Köhn M., Lederer M., Glass M., Reinke C., Singer R.H., Hüttelmaier S. IGF2BP1 promotes cell migration by regulating MK5 and PTEN signaling. Genes Dev. 2012;26:176–189. doi: 10.1101/gad.177642.111. [DOI] [PMC free article] [PubMed] [Google Scholar]
- 19.Faye M.D., Beug S.T., Graber T.E., Earl N., Xiang X., Wild B., Langlois S., Michaud J., Cowan K.N., Korneluk R.G., Holcik M. IGF2BP1 controls cell death and drug resistance in rhabdomyosarcomas by regulating translation of cIAP1. Oncogene. 2015;34:1532–1541. doi: 10.1038/onc.2014.90. [DOI] [PubMed] [Google Scholar]
- 20.Bose S., Le A. Glucose Metabolism in Cancer. Adv. Exp. Med. Biol. 2018;1063:3–12. doi: 10.1007/978-3-319-77736-8_1. [DOI] [PubMed] [Google Scholar]
- 21.Pavlova N.N., Thompson C.B. The Emerging Hallmarks of Cancer Metabolism. Cell Metab. 2016;23:27–47. doi: 10.1016/j.cmet.2015.12.006. [DOI] [PMC free article] [PubMed] [Google Scholar]
- 22.Zhu J., Thompson C.B. Metabolic regulation of cell growth and proliferation. Nat. Rev. Mol. Cell Biol. 2019;20:436–450. doi: 10.1038/s41580-019-0123-5. [DOI] [PMC free article] [PubMed] [Google Scholar]
- 23.Mitov M.I., Harris J.W., Alstott M.C., Zaytseva Y.Y., Evers B.M., Butterfield D.A. Temperature induces significant changes in both glycolytic reserve and mitochondrial spare respiratory capacity in colorectal cancer cell lines. Exp. Cell Res. 2017;354:112–121. doi: 10.1016/j.yexcr.2017.03.046. [DOI] [PMC free article] [PubMed] [Google Scholar]
- 24.Zhang J., Zhang Q. Using Seahorse Machine to Measure OCR and ECAR in Cancer Cells. Methods Mol. Biol. 2019;1928:353–363. doi: 10.1007/978-1-4939-9027-6_18. [DOI] [PubMed] [Google Scholar]
- 25.Vriend L.E.M., van den Tempel N., Oei A.L., L’Acosta M., Pieterson F.J., Franken N.A.P., Kanaar R., Krawczyk P.M. Boosting the effects of hyperthermia-based anticancer treatments by HSP90 inhibition. Oncotarget. 2017;8:97490–97503. doi: 10.18632/oncotarget.22142. [DOI] [PMC free article] [PubMed] [Google Scholar]
- 26.Weidensdorfer D., Stöhr N., Baude A., Lederer M., Köhn M., Schierhorn A., Buchmeier S., Wahle E., Hüttelmaier S. Control of c-myc mRNA stability by IGF2BP1-associated cytoplasmic RNPs. RNA. 2009;15:104–115. doi: 10.1261/rna.1175909. [DOI] [PMC free article] [PubMed] [Google Scholar]
- 27.Dang C.V., Le A., Gao P. MYC-induced cancer cell energy metabolism and therapeutic opportunities. Clin. Cancer Res. 2009;15:6479–6483. doi: 10.1158/1078-0432.CCR-09-0889. [DOI] [PMC free article] [PubMed] [Google Scholar]
- 28.Cheng C., Ding Q., Zhang Z., Wang S., Zhong B., Huang X., Shao Z. PTBP1 modulates osteosarcoma chemoresistance to cisplatin by regulating the expression of the copper transporter SLC31A1. J. Cell. Mol. Med. 2020;24:5274–5289. doi: 10.1111/jcmm.15183. [DOI] [PMC free article] [PubMed] [Google Scholar]
Associated Data
This section collects any data citations, data availability statements, or supplementary materials included in this article.
Supplementary Materials
Data Availability Statement
The authors declare that all the data supporting the findings in this study are available in this study, and its supplementary materials are available from the corresponding author through reasonable request.