

Abstract
The activation of the renin-angiotensin system (RAS) induced by increased angiotensin II (AngII) levels has been implicated in muscle atrophy, which is involved in the pathogenesis of congestive heart failure. Although peroxisome proliferator-activated receptor gamma (PPARγ) activation can suppress RAS, the exact role of PPARγ in AngII-induced muscle atrophy is unclear. Here we identified PPARγ as a negative regulator of miR-29b, a microRNA that is able to promote multiple types of muscle atrophy. Suppression of miR-29b could prevent AngII-induced muscle atrophy both in vitro and in vivo. IGF1, PI3K(p85α), and Yin Yang 1 (YY1) were identified as target genes of miR-29b, and overexpression of these targets could rescue AngII-induced muscle atrophy. Importantly, inhibition of PPARγ was sufficient to induce muscle atrophy, while PPARγ overexpression could attenuate that. These data indicate that the PPARγ/miR-29b axis mediates AngII-induced muscle atrophy, and increasing PPARγ or inhibiting miR-29b represents a promising approach to counteract AngII-induced muscle atrophy.
Keywords: muscle atrophy, angiotensin II, PPARγ, miR-29b
Graphical Abstract
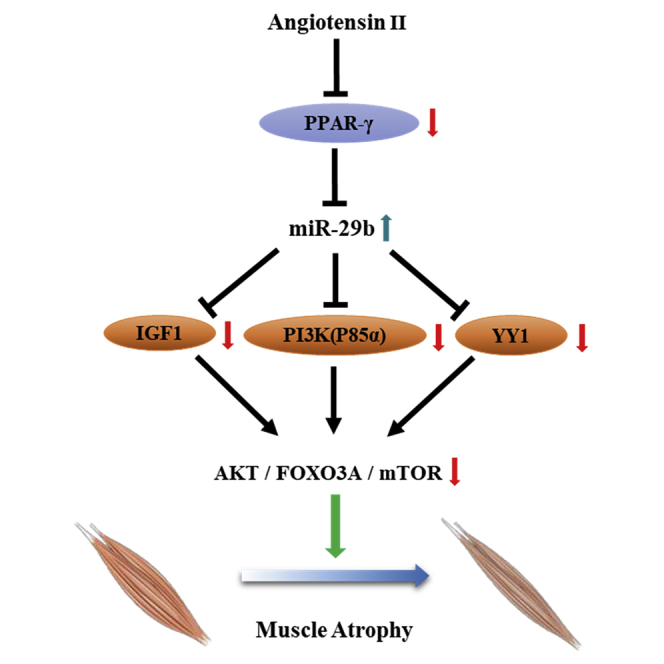
Xiao and colleagues report that the PPARγ/miR-29b axis mediates Ang II-induced muscle atrophy via inhibition of the target genes IGF1, PI3K(p85α), and Yin Yang 1 (YY1) and the AKT/FOXO3A/mTOR pathway. Their work implies that overexpression of PPARγ and inhibition of miR-29b are novel approaches to counteract AngII-induced muscle atrophy.
Introduction
Congestive heart failure (CHF) is a major cause of mortality and morbidity worldwide, leading to a great burden to society.1,2 Among CHF patients, 30%–50% also suffer from muscle atrophy caused by increased circulating angiotensin II (AngII) levels.1,3, 4, 5, 6, 7 Muscle atrophy worsens CHF patients’ quality of life and prognosis; however, no effective pharmacological treatment is available.6, 7, 8, 9, 10, 11 Therefore, it is imperative that effective therapeutic strategies should be developed.12
The molecular mechanisms of muscle atrophy are imperfectly understood.13 Multiple pathways contribute to muscle atrophy, but ultimately the imbalance of excessive protein degradation without a corresponding increase in protein synthesis leads to a net muscle tissue loss.13, 14, 15 Muscle-specific RING-finger 1 (MURF-1) and Atrogin-1 (MAFBX) are commonly induced in muscle atrophy.16 MicroRNAs (miRNAs or miRs) are a central player of the diverse intracellular signaling network involved in essential biological processes.17 Dysregulation of miRNAs has been reported to participate in muscle atrophy, including miR-29b, a miRNA that we recently identified to promote multiple types of muscle atrophy.18,19 However, whether miR-29b contributes to AngII-induced muscle atrophy remains unclear. Moreover, considering the complexity of the atrophic program, other levels of regulation should also be investigated.
Peroxisome proliferator-activated receptor gamma (PPARγ) is a transcription factor from the nuclear receptor family of peroxisome proliferator-activated receptors (PPARs).20 PPAR activation can inhibit the activation of the renin-angiotensin system (RAS) induced by increased AngII, which has been implicated in muscle atrophy.21, 22, 23 In addition, PPARγ agonists can promote the biogenesis of functional mitochondria, while muscle atrophy is correlated with mitochondrial dysfunction.12,24, 25, 26, 27 However, whether PPARγ inhibition is responsible for muscle atrophy, especially induced by AngII, is still unclear.
In this study, we first found that miR-29b contributed to AngII-induced muscle atrophy both in vitro and in vivo. PPARγ was identified as an upstream regulator of miR-29b in AngII-induced muscle atrophy. Finally, we demonstrated that PPARγ inhibition was necessary and sufficient to induce muscle atrophy in vivo. Our data imply that overexpression of PPARγ is a promising approach to counteract muscle atrophy.
Results
miR-29b is elevated in AngII-induced muscle atrophy
To investigate the expression levels of miR-29b in AngII-induced muscle atrophy, we first utilized C2C12-differentiated myotubes, which were treated with AngII and confirmed the successful induction of the in vitro muscle atrophy model by decreased myotube diameter and increased Atrogin-1 and Murf-1 (Figures S1A and S1B). In successful in vitro muscle atrophy samples, we found that miR-29b levels were significantly increased (Figure S1C). In addition, muscle atrophy was also induced in vivo by AngII infusion that led to decreased gastrocnemius weight (GW), myofiber cross-sectional area (CSA), grip strength, and elevated Atrogin-1 and Murf-1 (Figures S1D–S1G). The elevation of miR-29b in gastrocnemius muscles was confirmed in vivo as well (Figure S1H). Together, these data suggested that miR-29b was upregulated in AngII-induced muscle atrophy both in vitro and in vivo, suggesting a potential functional role of miR-29b in this model.
miR-29b inhibition ameliorates AngII-induced muscle atrophy both in vitro and in vivo
In fully differentiated C2C12 myotubes treated with AngII, miR-29b inhibitors were used to counteract muscle atrophy. miR-29b inhibition significantly ameliorated AngII-induced muscle atrophy, as evidenced by increased myotube diameter, decreased Atrogin-1 and Murf-1, and increased phosphorylation of AKT(Ser-473), FOXO3A(Ser-253), mTOR, P70S6K, and EIF-4EBP1 (Figure 1).
Figure 1.

miR-29b inhibition ameliorates AngII-induced muscle atrophy in vitro
(A) Immunofluorescent staining for C2C12 myotubes followed by determination of myotube diameter when C2C12 myotubes were transfected with negative control inhibitor (NC-1) and miR-29b inhibitor (29b-I) in AngII-induced muscle atrophy model. Scale bar: 50 μm. n = 4 per group. (B) Quantitative real-time PCR analysis of Atrogin-1 and Murf-1 expressions when C2C12 myotubes were transfected with NC-1 and 29b-I in AngII-induced muscle atrophy model. n = 3, 4, 3. (C) Western blot analysis for the AKT/FOXO3A/mTOR pathway (AKT, FOXO3A, mTOR, P70S6K, 4EBP1) when C2C12 myotubes were transfected with NC-1 and 29b-I in AngII-induced muscle atrophy model. n = 3 per group. Data are shown as mean ± SD. ∗p < 0.05. ∗∗p < 0.01. See also Figure S1.
To extend this finding in vivo, we treated mice with intramuscular injection (gastrocnemius muscles) of miR-29b sponges, followed by AngII infusion. The miR-29b sponge significantly reduced miR-29b levels and attenuated AngII-induced muscle atrophy, as evidenced by increased gastrocnemius weight, better grip strength, reduced Atrogin-1 and Murf-1, increased myofiber CSA, and increased phosphorylation of AKT(Ser-473), FOXO3A(Ser-253), mTOR, P70S6K, and EIF-4EBP1(Figures 2A–2E; Figure S2). In addition, cell apoptosis in skeletal muscle has also been reported to be involved in AngII-induced muscle atrophy.1,3 Here we found that the miR-29b sponge significantly mitigated cell apoptosis, as evidenced by reduced percentage of terminal deoxynucleotidyl transferase (TdT)-mediated dUTP nick end labeling (TUNEL) staining-positive cells and decreased ratios of Bax to Bcl2 and Cleaved-caspase 3 to Caspase 3 (Figures 2F and 2G). Collectively, these data indicate that miR-29b inhibition is able to mitigate muscle atrophy induced by AngII in mice.
Figure 2.

miR-29b inhibition ameliorates AngII-induced muscle atrophy in vivo
(A) Quantitative real-time PCR analysis of miR-29b expression when mice were treated with Fugw (control) and miR-29b sponge in AngII-induced muscle atrophy. n = 4, 4, 5, 5. (B) Gastrocnemius weight from control and AngII mice treated with Fugw or miR-29b sponge. n = 5, 6, 5, 6. (C) The grip strength of right hindlimb from control and AngII mice treated with Fugw or miR-29b sponge. n = 4, 4, 5, 4. (D) Quantitative real-time PCR analysis of Atrogin-1 and Murf-1 expression when control and AngII mice treated with Fugw or miR-29b sponge. n = 5–6 per group. (E) Wheat germ agglutinin (WGA) staining was performed to quantify muscle fiber cross-sectional area (CSA) from control and AngII mice treated with Fugw or miR-29b sponge. Scale bar: 20 μm. n = 5 per group. (F) TUNEL staining was performed to quantify apoptosis from control and AngII mice treated with Fugw or miR-29b sponge. Scale bar: 20 μm. n = 5, 5, 4, 5. (G) Western blot analysis for the ratio Bax/Bcl2, Cleaved-caspase 3/Caspase 3 when control and AngII mice treated with Fugw or miR-29b sponge. n = 3 per group. Data are shown as mean ± SD. ∗p < 0.05. ∗∗p < 0.01. See also Figure S2.
miR-29b mediates AngII-induced muscle atrophy by targeting IGF1, PI3K(p85α), and Yin Yang 1
As IGF1 and PI3K(p85α) have been identified as targets of miR-29b,18 we determined their expressions in differentiated C2C12 cells treated with AngII and found that they were significantly decreased (Figure S3A). Moreover, the decrease of both targets was also observed in gastrocnemius muscles of our in vivo AngII model, in which the miR-29b sponge could attenuate these changes (Figure S3B). To further determine if IGF1 and PI3K(p85α) are responsible for the pro-atrophy effects of AngII in vitro, we overexpressed IGF1 or PI3K(p85α) in AngII-induced muscle atrophy in the in vitro model and found that they could attenuate AngII-induced muscle atrophy (Figure S3C), suggesting they might be functional downstream targets of miR-29b. To further demonstrate this, we combined the miR-29b inhibitor and small interfering RNAs (siRNAs) to IGF1 or PI3K(p85α). We found that IGF1 or PI3K(p85α) inhibition could attenuate the inhibitory effects of miR-29b inhibitor in AngII-induced muscle atrophy (Figure S3D and S3E). These data suggested that IGF1 and PI3K(p85α) at least partly mediated the effects of miR-29b in AngII-induced muscle atrophy.
We previously have shown that Yin Yang 1 (YY1) triggered the upregulation of miR-29b;18 however, it is unclear if a synergistic pathway might exist here. Reporter assays showed that endogenous miR-29b reduced the luciferase activity in cells transfected with a construct carrying the 3′ untranslated region (3′UTR) of YY1 but had no effect when the 3′UTR of YY1 was mutated, suggesting that YY1 is also a direct target gene of miR-29b (Figure 3A). Moreover, miR-29b could also negatively regulate YY1 at protein level (Figures 3B–3E). We also found that YY1 was decreased in differentiated C2C12 cells treated with AngII and in our AngII-treated in vivo mouse model (Figures 3F and 3G). To further investigate if YY1 mediates the pro-atrophy effects of AngII in vitro, we overexpressed YY1 in AngII-induced muscle atrophy in the in vitro model and found it could attenuate AngII-induced muscle atrophy (Figure 3H), suggesting YY1 might be a functional downstream target of miR-29b. To further confirm this, we transfected AngII-treated differentiated C2C12 cells with either miR-29b inhibitor or miR-29b inhibitor combined with YY1 siRNAs; we found that the reduction of YY1 was responsible for miR-29b in AngII-induced muscle atrophy at least in vitro (Figure 3I). These data suggested that YY1 at least partly mediated the effects of miR-29b in AngII-induced muscle atrophy.
Figure 3.

miR-29b mediates AngII-induced muscle atrophy by targeting Yin Yang 1 (YY1)
(A) TargetScan and luciferase assay analysis of the direct interact with YY1 and miR-29b. n = 6 per group. (B) Quantitative real-time PCR analysis of Yy1 expression in C2C12 myotubes transfected with miR-29b mimic. n = 6 per group. (C) Quantitative real-time PCR analysis of Yy1 expression in C2C12 myotubes transfected with miR-29b inhibitor. n = 6 per group. (D) Western blot analysis of YY1 expression in C2C12 myotubes transfected with miR-29b mimic. n = 3 per group. (E) Western blot analysis of YY1 expression in C2C12 myotubes transfected with miR-29b inhibitor. n = 3 per group. (F) Western blot analysis of YY1 expression in C2C12 myotubes treated with AngII. n = 3 per group. (G) Western blot analysis of YY1 expression in the gastrocnemius from control and AngII treated mice. n = 3 per group. (H) Immunofluorescent staining for C2C12 myotubes and quantitative real-time PCR analysis of Atrogin-1 and Murf-1 expression showed that overexpression of YY1 reduced muscle atrophy induced by AngII. n = 4 per group for staining. n = 3–4 for quantitative real-time PCR. Scale bar: 100 μm. (I) Immunofluorescent staining for C2C12 myotubes and quantitative real-time PCR analysis of Atrogin-1 and Murf-1 expression when knockdown YY1 together with miR-29b inhibition in AngII-induced muscle atrophy. n = 4 per group for staining. n = 6 for quantitative real-time PCR. Scale bar: 100 μm. Data are shown as mean ± SD. ∗p < 0.05. ∗∗p < 0.01. ns, no significance. See also Figure S3.
PPARγ acts as an upstream regulator of miR-29b
To investigate if there exist other factors that induce the upregulation of miR-29b, we compared the upstream regulators of miR-29b-1 and miR-29b-2 and identified four commonly predicted genes, including IRF1, EBF1, ZNF263, and PPARγ, with DIANA TOOLS (miRGen v.3).28 Among them, PPARγ is of particular interest, as its coactivator 1-alpha (PGC-1α) has been reported to protect skeletal muscle from atrophy by suppressing FoxO3 action and atrophy-specific gene transcription.29 The promoter region implied that PPARγ transcription factors might mediate the transcription of miR-29b (Figure 4A). We therefore performed chromatin immunoprecipitation (ChIP) assays to investigate the promoter occupation of miR-29b and PPARγ, which was detected on both miR-29b-1 and miR-29b-2 promoters (Figure 4B). miR-29b promotor luciferase reporter assays showed that PPARγ reduced cellular luciferase activity, suggesting that PPARγ is a negative regulatory factor of miR-29b at the transcriptional level (Figures 4C and 4D). We further observed that PPARγ knockdown/inhibition increased miR-29b, while PPARγ overexpression/activation decreased miR-29b (Figures 4E and 4F; Figures S4A–S4C). Moreover, we found that PPARγ was decreased in differentiated C2C12 cells treated with AngII and in the AngII-induced mouse muscle atrophy model (Figures 4G and 4H). To determine if the regulation of PPARγ is specific to AngII-induced muscle atrophy, we checked PPARγ expressions in other models for atrophy that we have previously tested, including differentiated C2C12 cells treated with H2O2, Dex, and tumor necrosis factor alpha (TNF-α) (in vitro models of muscle atrophy), and Den, Dex, and fasting-induced in vivo models. We found that PPARγ was commonly decreased in all these muscle atrophy models (Figures S4D–S4I), which is consistent with our previous finding that miR-29b is a common regulator of muscle atrophy.
Figure 4.

PPARγ acts as an upstream regulator of miR-29b
(A) Schematic illustration of the binding sites of PPARγ in the promoter structures of miR-29b: the position of miR-29b-1: chr6:31221817-31221836 [−]; the position of miR-29b-2: chr1:195018028-195018047 [+]. (B) ChIP-PCR assay showed that PPARγ could bind to the promotor of miR-29b. n = 3 per group. (C) Luciferase assay analysis of the regulation function of PPARγ and miR-29b-1. n = 6 per group. (D) Luciferase assay analysis of the regulation function of PPARγ and miR-29b-2. n = 6 per group. (E) Quantitative real-time PCR analysis of miR-29b expression when C2C12 myotubes were transfected with sh-scramble and PPARγ shRNAs. n = 5, 7, 7. (F) Quantitative real-time PCR analysis of miR-29b expression when C2C12 myotubes were transfected with Fugw and PPARγ overexpression lentivirus. n = 4 per group. (G) Western blot analysis of PPARγ protein level in AngII-induced muscle atrophy in vitro. n = 3 per group. (H) Western blot analysis of PPARγ protein level in AngII-induced muscle atrophy in vivo. n = 3 per group. Data are shown as mean ± SD. ∗p < 0.05. ∗∗p < 0.01. See also Figure S4.
We subsequently determined if PPARγ could control muscle atrophy. We found that inhibition of PPARγ by short hairpin RNAs (shRNAs) and two distinct inhibitors for PPARγ induced muscle atrophy in differentiated C2C12 cells, as evidenced by decreased myotube diameter, increased Atrogin-1 and Murf-1, and phosphorylation of AKT(Ser-473), FOXO3A(Ser-253), mTOR, P70S6K, and EIF-4EBP1(Figure 5; Figure S5). Moreover, PPARγ overexpression and agonists attenuated muscle atrophy induced by AngII (Figure 6), Dex, and TNF-α (Figures S6A and S6B).
Figure 5.

PPARγ inhibition with shRNAs promotes muscle atrophy in vitro
(A) Immunofluorescent staining for C2C12 myotubes followed by determination of myotube diameter in C2C12 myotubes were treated with PPARγ shRNAs. Scale bar: 100 μm. n = 4 per group. (B) Quantitative real-time PCR analysis of Atrogin-1 and Murf-1 expressions when C2C12 myotubes were treated with PPARγ shRNAs. n = 6, 4, 5–6. (C) Western blot analysis for the AKT/FOXO3A/mTOR pathway (AKT, FOXO3A, mTOR, P70S6K, 4EBP1) when C2C12 myotubes were treated with PPARγ shRNAs. n = 4 per group. Data are shown as mean ± SD. Sh-PPARγ-A and Sh-PPARγ-B group are compared with sh-scramble group. ∗p < 0.05. ∗∗p < 0.01. See also Figure S5.
Figure 6.

Overexpression of PPARγ ameliorates AngII-induced muscle atrophy in vitro
(A) Immunofluorescent staining for C2C12 myotubes followed by determination of myotube diameter and quantitative real-time PCR analysis of Atrogin-1 and Murf-1 expression when myotubes were transfected with Fugw and PPARγ overexpression lentivirus in AngII-induced muscle atrophy model. Scale bar: 100 μm. n = 4 for staining and n = 6, 5, 5, 5 for quantitative real-time PCR. (B) Immunofluorescent staining for C2C12 myotubes followed by determination of myotube diameter and quantitative real-time PCR analysis of Atrogin-1 and Murf-1 expression when myotubes were treated with PPARγ agonist rosiglitazone in AngII-induced muscle atrophy model. Ros, rosiglitazone. Scale bar: 100 μm. n = 3 for staining and n = 6 for quantitative real-time PCR. Data are shown as mean ± SD. ∗p < 0.05. ∗∗p < 0.01. See also Figure S6.
To investigate if PPARγ might control muscle atrophy by acting as an upstream regulator of miR-29b, we combined PPARγ suppression with miR-29b inhibition in differentiated C2C12 cells. We observed that inhibition of miR-29b could abolished PPARγ suppression-induced muscle atrophy in differentiated C2C12 cells, confirming that PPARγ controls muscle atrophy by acting as an upstream regulator of miR-29b at least in vitro (Figures S6C and S6D).
To extend this finding in vivo, we treated mice with intramuscular injection of lentiviral shRNA for PPARγ in gastrocnemius muscles. Muscle atrophy was induced, as evidenced by reduced gastrocnemius weight; decreased grip strength; decreased myofiber CSA; elevated atrogenes, including Atrogin-1, MuRF-1, MuRF-2, Foxo3, Nedd4, Mul1, Znf216, and CbIb; increased apoptosis; increased protein ubiquitination and autophagy; decreased mtDNA copy numbers; and decreased phosphorylation of AKT(Ser-473), FOXO3A(Ser-253), mTOR, P70S6K, and EIF-4EBP1 (Figures 7A–7H; Figures S7A–7C). Consistently, miR-29b was elevated in gastrocnemius muscles, while IGF1, PI3K(p85α), and YY1 were decreased with intramuscular injection of shRNA for PPARγ (Figure 7I; Figure S7D). Collectively, these data suggested that PPARγ inhibition was sufficient to induce muscle atrophy in vivo.
Figure 7.

PPARγ inhibition promotes muscle atrophy in vivo
(A) Gastrocnemius muscle morphology and weight in sh-scramble- and PPARγ shRNA-treated mice. Scale bar: 1 cm. n = 6. (B) The grip strength of right hindlimb in sh-scramble- and PPARγ shRNA-treated mice. n = 5, 6. (C) WGA staining was performed to quantify muscle fiber CSA from sh-scramble- and PPARγ shRNA-treated mice. Scale bar: 20 μm. n = 6 per group. (D) Quantitative real-time PCR analysis of Atrogin-1 and Murf-1 expression in sh-scramble- and PPARγ shRNA-treated mice. n = 5, 6. (E) TUNEL staining was performed to quantify apoptosis from sh-scramble- and PPARγ shRNA-treated mice. Scale bar: 50 μm. n = 4 per group. (F) Western blot analysis for the ratio Bax/Bcl2 and Cleaved-caspase3/Caspase3 from sh-scramble- and PPARγ shRNA-treated mice. n = 3 per group. (G) Western blot analysis for LC3II, P62 and ubiquitin protein expression in sh-scramble- and PPARγ shRNA-treated mice. n = 3 per group. (H) Quantitative real-time PCR analysis the ratio of mtDNA/genomicDNA in sh-scramble- and PPARγ shRNA-treated mice. n = 5 per group. (I) Quantitative real-time PCR analysis of miR-29b expression in sh-scramble- and PPARγ shRNA-treated mice. n = 6 per group. Data are shown as mean ± SD. ∗p < 0.05. ∗∗p < 0.01. See also Figure S7.
Importantly, we also found that lentivirus for PPARγ overexpression could attenuate AngII-induced muscle, as evidenced by increased gastrocnemius weight, better grip strength, increased myofiber CSA, reduced Atrogin-1 and MuRF-1, attenuated apoptosis, and increased phosphorylation of AKT(Ser-473), FOXO3A(Ser-253), mTOR, P70S6K, and EIF-4EBP1 (Figure 8; Figure S8A). Consistently, IGF1, PI3K(p85α), and YY1 were increased with intramuscular injection of lentivirus for PPARγ overexpression (Figure S8B). These data confirm that PPARγ overexpression could ameliorate AngII-induced muscle atrophy.
Figure 8.

Overexpression of PPARγ ameliorates AngII-induced muscle atrophy in vivo
(A) Quantitative real-time PCR analysis of PPARγ expression in control and AngII mice treated with Fugw or PPARγ overexpression lentivirus. n = 4, 5, 5, 5. (B) Gastrocnemius weight from control and AngII mice treated with Fugw or PPARγ overexpression lentivirus. n = 6. Scale bar is 1cm. (C) The grip strength of right hindlimb from control and AngII mice treated with Fugw or PPARγ overexpression lentivirus. n = 5, 6, 5, 6. (D) WGA staining was performed to quantify muscle fiber CSA from control and AngII mice treated with Fugw or PPARγ overexpression lentivirus. Scale bar: 20 μm. n = 3–4 per group. (E) Quantitative real-time PCR analysis of Atrogin-1 and Murf-1 expressions in control and AngII mice treated with Fugw or PPARγ overexpression lentivirus. n = 5–6 per group. (F) Western blot analysis of Atrogin-1 and MuRF-1 expression in control and AngII mice treated with Fugw or PPARγ overexpression lentivirus. n = 3 per group. (G) TUNEL staining was performed to quantify apoptosis from control and AngII mice treated with Fugw or PPARγ overexpression lentivirus. Scale bar: 20 μm. n = 4 per group. (H) Western blot analysis for the ratio Bax/Bcl2 and Cleaved-caspase 3/Caspase 3 in control and AngII mice treated with Fugw or PPARγ overexpression lentivirus. n = 3 per group. Data are shown as mean ± SD. ∗p < 0.05. ∗∗p < 0.01. See also Figure S8.
Discussion
CHF is a leading cause of mortality and morbidity, and muscle atrophy is a critical predictor of poor outcome in CHF patients, causing significant clinical, social, and economic burden.2,8 The detailed mechanism of muscle atrophy in CHF patients is unclear; however, clinical studies have shown increased AngII level in CHF patients with muscle atrophy, and, moreover, AngII has been found to be sufficient to induce muscle atrophy in rodents.1,22,30,31 Currently there is no approved drug for the treatment of muscle atrophy, and finding a therapeutic intervention is still a challenge today.10 Understanding the molecular mechanism underlying AngII-induced muscle atrophy will help develop effective therapeutic approaches to counteract muscle loss.22 Here, we reported that PPARγ controlled AngII-induced muscle atrophy, acting as an upstream regulator of miR-29b, and suggested PPARγ and miR-29b as promising therapeutic targets for AngII-induced muscle atrophy.
miRNAs have emerged as important regulators of gene expression.32 The regulatory role of miRNAs has been implicated in a variety of biological processes, including development, metabolism, proliferation, and differentiation.32, 33, 34, 35 In muscle, miRNAs control various physiological and pathological processes, from myogenesis and muscle homeostasis to different responses to environmental stimuli, such as exercise.36 Multiple miRNAs, including miR-1, miR-133, miR-23a, miR-21, miR-206, miR-27, miR-628, and miR-431, have been implicated in individual muscle atrophy models.6,18,37, 38, 39 However, less is known specifically about miRNAs in AngII-induced muscle atrophy. Recently, we reported that miR-29b was commonly increased in five different models of skeletal muscle atrophy, including muscle atrophy induced by denervation, Dex, fasting, aging, and cancer cachexia. These data indicated that upregulation of miR-29b might be a common driver of muscle atrophy.18 However, whether miR-29b contributes to AngII-induced muscle atrophy is unclear.39 In this study, we found that miR-29b was elevated in fully differentiated C2C12 myotubes treated with AngII and in an AngII-induced mouse muscle atrophy model. Moreover, miR-29b inhibition was sufficient to ameliorate AngII-induced muscle atrophy both in vitro and in vivo. We provide direct evidence that miR-29b controls AngII-induced muscle atrophy and further support our previous study that miR-29b is a common driver of muscle atrophy.26,39
Considering the complexity of the atrophic program, other levels of regulation must be involved. PPARγ is a ligand-activated transcription factor from the nuclear receptor family of PPARs and has emerged as a transcriptional regulator of metabolism and as a nutrient-sensing signaling sensor.26 PPARγ is a key integrator of cellular signals in various tissues.26 Dysregulation of PPARγ has been linked to the development of many disease conditions, such as obesity, type 2 diabetes, hypertension, atherosclerosis, and metabolic syndrome.21,40 PPARγ is most abundantly expressed in adipose tissue and is also expressed in other tissues, such as skeletal muscle, lower intestine, and heart.20 PPARγ is best known for its role in regulating adipogenic and lipogenic pathways.20 In addition, PPARγ plays a role in the regulation of lipid and glucose homeostasis and has an anti-inflammatory and anti-cancer effect.41 Given that the skeletal muscle is a key metabolic organ and PPARγ is a target for treating metabolic organs,20 we investigated the role of PPARγ in controlling muscle atrophy. The expression of PPARγ in skeletal muscles of tumor-bearing rats has been reported to be significantly increased, and PPARγ agonist GW1929 could ameliorate muscle loss in tumor-bearing mouse experimental cachexia.42 However, the role of PPARγ in AngII induced muscle atrophy is completely unknown. Here, we found that PPARγ was decreased in differentiated C2C12 cells treated with AngII and also an AngII-induced mouse muscle atrophy model. Moreover, PPARγ was found to control AngII-induced muscle atrophy both in vitro and in vivo. These data suggested that PPARγ was a promising regulator of AngII-induced muscle atrophy. Importantly, we showed that PPARγ worked as an upstream regulator of miR-29b in muscle atrophy, though how such interaction between PPARγ and miR-29b regulates muscle atrophy in vivo is unclear.
In conclusion, our study indicates that the PPARγ/miR-29b axis mediates AngII-induced muscle atrophy. Overexpression of PPARγ and inhibition of miR-29b might be promising approaches to counteract AngII-induced muscle atrophy.
Materials and methods
Animal experiments
Ten-week-old male C57BL/6 mice were purchased from Cavens Lab Animal (Changzhou, China) and maintained in an SPF laboratory animal facility of Shanghai University (Shanghai, China). AngII was dissolved in 0.9% NaCl with 1 mM acetic acid. AngII (1.5 μg/kg/min) was delivered chronically by an implanted osmotic minipump (ALZET model 2001). Pair feeding of AngII- and vehicle-treated mice was conducted to correct for the AngII-induced anorexia.1,3,22 Mice were sacrificed 7 days after AngII administration. Gastrocnemius muscles were harvested, and muscle weight was measured. Muscle specimens were immediately snap frozen in liquid nitrogen and stored at −80°C until further analyses and embedded for histological analyses. The other types of in vivo muscle atrophy models used in this study were as we previously described.18 All procedures with animals were in accordance with the guidelines on the use and care of laboratory animals for biomedical research published by National Institutes of Health (No. 85-23, revised 1996), and the experimental protocol was reviewed and approved by the ethical committees of School of Life Science, Shanghai University (2017-007).
Cell culture and transfection
C2C12 cells were cultured in high-glucose Dulbecco’s modified Eagle’s medium (DMEM) supplemented with 10% fetal bovine serum and 1% penicillin and streptomycin at 37°C with 5% CO2. For differentiation, C2C12 myoblasts were planted on culture plates coated with 0.1% gelatin and switched into differentiation medium (DMEM containing 2% horse serum and 1% penicillin and streptomycin). After 4 days, myotubes were formed. Transfection of C2C12 cells was performed using Lipofectamine 2000 according to the instruction manual.
To induce muscle atrophy in vitro, cells were incubated with 500 nM AngII in differentiation medium for 48 h. After incubation, cells were harvested or used for morphological analysis. The other types of in vitro muscle atrophy models used in this study were as we previously described.18
Plasmids
The shRNA sequences of PPARγ were obtained from Genetic Perturbation Platform, which were ligated into the PLKO.1-TRC vectors. The sequences used were as follows: shPPARγ-A: 5′-GGAAAGACAACGGACAAATCA−3′; shPPARγ-B: 5′-ACAGGAA AGACAACGGACAAA-3′. The Coding sequence (CDS) of PPARγ was obtained from the NCBI. Gene fragments were obtained by PCR. PPARγ CDS sequence was ligated into Pwpxl-GFP. PCR primers we used were as follows: forward primer: 5′-GGGACGC GTATGGGTGAAACTCTGGGAGA-3′; reverse primer:5′-GGGACTAGTCTAATA CAAGTCCTTGTAGATC-3′. The CDS sequence of YY1 was obtained from the NCBI. Gene fragments were obtained by PCR. YY1 CDS sequence was ligated into FUGW. PCR primers we used were as follows: forward primer: 5′-GCGGGATCCATGGCCTCGGGCGACACC-3′; reverse primer: 5′-GCGGAATT CTCACTGGTTGTTTTTGGCTTTA-3′. PI3K(p85α): pBS-p85α was a gift from Lewis Cantley (Addgene plasmid #1407). Fugw-IGF1 was obtained as we previously described.18 Fugw was used as a control plasmid.
Quantitative real-time PCR
Total RNA was isolated from muscle or cells using RNeasy Mini Kit (QIAGEN) according to the manufacturer’s protocol. The Bulge-Loop miRNA qPCR Primer Set (RiboBio) was used to determine the expression levels of miRNAs by quantitative real-time PCR with Takara SYBR Premix Ex Taq (TliRNaseH Plus) in a Roche Real-Time PCR Detection System. 5S was used as an internal control. For mRNA analysis, cDNA was synthesized using Takara PrimeScript 1st Strand cDNA Synthesis Kit and was subjected to qPCR with Takara SYBR Premix Ex Taq. To correct for potential variances between samples regarding differences in mRNA extraction and reverse transcription efficiency, gene expression was normalized to the expression of the reference gene 18S. The primer sequences were as we previously described.18
Western blot
Protein samples were extracted from muscles or cells by lysis buffer (KeyGEN, China) with a protease inhibitor cocktail (KeyGEN, China). Lysates were cleared by centrifugation (4°C, 10 min, 12,000 × g). The concentration of protein sample was determined by the BCA Protein Assay Kit (TaKaRa). Equal amounts of protein were separated by SDS-PAGE and blotted onto polyvinylidene fluoride (PVDF) membranes (Millipore). Then the membranes were incubated with specific primary antibody followed by horseradish peroxidase-conjugated secondary antibody. The signal was visualized by ECL Chemiluminescent Substrate (Tanon) and detected by Tanon luminescent imaging system. The primary antibodies used as were follows: IGF1 (1:1,000, Bioworld Technology, #BS6817), PI3K(p85α) (1:500, Cell Signaling Technology, #13666), YY1 (1:1,000, Proteintech, #66281-1-Ig), Bax (1:1,000, Abclonal Technology, #A12009), Bcl2 (1:1,000, Abclonal Technology, #A11025), Caspase 3 (1:1,000, Abclonal Technology, #A2156), P-AKT (T308) (1:1,000, Cell Signaling Technology, #2965), P-AKT (S473) (1:1,000, Cell Signaling Technology, #4051), AKT (1:1,000, Proteintech, #10176-2-AP), P-FOXO3A (S253) (1:1,000, Cell Signaling Technology, #9466S), P-FOXO1(T24)/FOXO3A(T32) (1:1,000, Cell Signaling Technology, #9464S), FOXO3A (1:1,000, Abclonal Technology, #A0102), P-mTOR (1:1,000, Cell Signaling Technology, #2971S), mTOR (1:1,000, Cell Signaling Technology, #2972S), P-P70S6K (1:1,000, Cell Signaling Technology, #9205S), P70S6K (1:1,000, Cell Signaling Technology, #9202S), P-EIF-4EBP1 (1:1,000, Abclonal Technology, #AP0032), EIF-4EBP1 (1:1,000, Abclonal Technology, #A1248), P62 (1:1,000, Proteintech, #18420-1-AP), LC3 (1:1,000, Abclonal Technology, #A5618), UBC (Ubiquitin) (1:1,000, Abclonal Technology, #A2129), and GAPDH (1:10,000, Bioworld Technology, #MB001).
Luciferase reporter assays
The 3′UTR of YY1 was amplified from genomic DNA by PCR using primer pairs. The PCR product and the vector pGL3 basic were digested using respective restriction enzymes and ligated using T4 ligase.
For 3′UTR assays, HEK293T was co-transfected with 200 ng PGL3-basic-3′UTR (or 3′UTR mut), 5 ng Renilla (used as an internal control), and 50 nM miR-29b mimic or mimic negative control using Lipofectamine 2000 Reagent in 24-well plates for 48 h. The activation of firefly and Renilla luciferase was analyzed by a dual-luciferase reporter assay kit (Promega) according to the manufacturer’s instructions.
For YY1 3′UTR:
Forward primer, 5′-GCTCTAGATCAGTTACAGAAAG TGGTGCT-3′,
Reverse primer, 5′-GCTCTAGATAGTGTCCATGCACGGACC-3′.
The bold part is the seed sequence, and the underlined parts are the digestion sequences of XbaI.
Mutation in the miR-29b target site was generated by PCR from the plasmid PGL3-3′UTR of YY1, and the primers were used as follows:
Forward primer, 5′-GCTCTAGATCAGTTACAGAAAGACCACGA-3′,
Reverse primer, 5′- GCTCTAGATAGTGTCCATGCACGGACC-3′.
The bold part is the mutation seed sequence and the underlined sequences are the digestion sequences of XbaI.
The promotor of miR-29b was amplified from genomic DNA by PCR using primer pairs. The PCR product is inserted into the linearized pGL3-basic vector using ClonExpress MultiS One Step Cloning Kit (Vazyme Biotech, C113-01). PGL3-basic vector is linearized by restriction enzyme HindIII (New England Biolabs, #R3104). The primers were used as follows:
miR-29b-1 promotor:
Forward primer, 5′-CGATCTAAGTAAGCTTGCTGAGCTCTGCCACGC-3′
Reverse primer, 5′-CCGGAATGCCAAGCTCCACCATATGAAACCAGCTTCCTG-3′
miR-29b-2 promotor:
Forward primer, 5′-CGATCTAAGTAAGCTTAGAGGGTTATCTGTATAATACA-3′
Reverse primer, 5′-CCGGAATGCCAAGCTTCCCAAGATGCATAGTGTCGGT-3′
For promotor assays, HEK293T was transfected with PPARγ overexpression lentivirus on the first day; the next day, it was co-transfected with 200 ng miR-29b promotor (or PGL3-basic), and 5 ng Renilla (used as an internal control) using Lipofectamine 2000 Reagent in 24-well plates for 48 h. The activation of firefly and Renilla luciferase was analyzed by a dual-luciferase reporter assay kit (Promega) according to the manufacturer’s instructions.
Immunostaining of myotubes in vitro
Myotubes were fixed with 4% paraformaldehyde (30 min, room temperature), permeabilized with 0.1% Triton X-100 in PBS for 20 min at room temperature, blocked with 5% BSA, and then incubated with specific primary antibody (MF-20, DSHB, 1:100) and the secondary antibody host at 4°C. Nuclear staining was performed with 4′,6-diamidino-2-phenylindole (DAPI). Images were captured by fluorescence microscope (Leica), and the diameter of myotubes was measured by ImageJ. The experiments were blindly performed by the investigator, who did not know the group allocation.
Wheat germ agglutinin (WGA) staining and TUNEL staining
For WGA staining, muscle samples were snap frozen in cold isopentane with O.C.T. Compound (optimal cutting temperature compound, Sakura) on short axis at 10 μm. For staining, the sections were dried at room temperature for 30 min and then incubated with WGA and DAPI at room temperature for 30 min. Images were captured by confocal microscope (Zeiss), and the area of muscle fibers was measured by ImageJ.
For TUNEL staining, the sections were dried at room temperature for 30 min, fixed with 4% paraformaldehyde (30 min, room temperature), permeabilized with 0.1% Triton X-100 in PBS for 20 min at room temperature, blocked with 5% BSA at room temperature for 20 min, and then incubated with primary antibody (Laminin-γ, Santa Cruz Biotechnology) at 4°C overnight. After incubating with corresponding secondary antibody at room temperature for 2 h, sections were stained with TUNEL fluorescein isothiocyanate (FITC) Apoptosis Detection Kit (Vazyme, A111-03) according to the manufacturer’s instructions. The nuclei were stained with DAPI. The experiments were blindly performed by the investigator who did not know the group allocation.
ChIP
A total of 106 C2C12 cells were collected, and ChIP was carried out by the ChIP Assay Kit (Millipore). Briefly, cells were cross-linked with 1% formaldehyde for 10 min at 37°C. Fixation was stopped by adding 2.5 M glycine to a final concentration of 100 mM and incubating for 5 min at room temperature. Cells were harvested and washed twice with ice-cold PBS and centrifuged at 1,000 rpm for 5 min at 4°C. Chromatin was sonicated in the lysis buffer to ∼300 bp, and the extraction of DNA was performed as per the kit protocol. Chromatin was pulled down using the following antibodies: IgG (Abcam, #ab171870) and PPARγ (Abcam, #ab227074). After chromatin immunoprecipitation, the DNA was subjected to real-time PCR analysis. PCR primers we used were as follows: miR29b-1, forward primer: 5′-ATGCCATGAGTGACCGACA-3′ and reverse primer: 5′-GGAAGGTGAAGTCCGTGCAAT-3′; miR29b-2 forward primer: 5′-AGCCTACAGGGTCATGGGATAG-3′ and reverse primer: 5′-ACAAC TGAACCCAAGTAAGTCACC-3′.
Grip-strength test
A digital grip-strength meter (YLS-13A, Yiyan Technology, China) was used to measure the grip strength of mice as previously descried.18 Mice were allowed to grab the metal pull bar. The force at the time of release was recorded as the peak tension. Each mouse was tested five times with a 30 s break between tests. The experiments were blindly performed by the investigator, who did not know the group allocation.
mtDNA copy number measurement
The ratio of mtDNA to genomic DNA was calculated by dividing copies of Co1 with copies of GAPDH in each experiment. Quantitative real-time PCR was performed. The primers used were as follows: Mt-Co1, forward primer: 5′-CAGTCTAATGCTTACTCAGC-3′, reverse primer: 5′-GGGCAGTTACGATAACATTG-3′; GAPDH, forward primer: 5′-GGGAAGCCCATCACCATCTTC-3′, reverse primer: 5′-AGAGGGGCCATCCA CAGTCT-3′.
Lentivirus injections in mice
A single intramuscular injection of lentiviral particles was performed at the dose of 108 transduction unit (TU) per mouse. Three days after injection, osmotic minipump implanted procedure was performed. Finally, muscles were removed, weighed, frozen, and stored in 4% paraformaldehyde after another 1 week.
Statistical analysis
Results were presented as mean ± SD. An unpaired, two-tailed Student’s t test was used for comparisons between two groups. One-way ANOVA test was performed to compare multiple groups, followed by Bonferroni’s post hoc test. All analyses were performed using SPSS Statistics 20.0. Differences were considered significant with p <0.05.
Acknowledgments
This work was supported by the grants from Innovation Program of Shanghai Municipal Education Commission (2017-01-07-00-09-E00042 to J.X.); National Key Research and Development Project (2018YFE0113500 to J.X.); National Natural Science Foundation of China (82020108002, 81722008, and 81911540486 to J.X. and 81900359 to J.L.); a grant from Science and Technology Commission of Shanghai Municipality (18410722200 and 17010500100 to J.X.); the “Dawn” Program of Shanghai Education Commission (19SG34 to J.X.); Shanghai Sailing Program(19YF1416400 to J.L.); “Chen Guang” project supported by Shanghai Municipal Education Commission and Shanghai Education Development Foundation (19CG45 to J.L.); and the National Institutes of Health (grants UH3 TR000901 and HL122547 to S.D.). J.P.G.S. is supported by Horizon2020 ERC-2016-COG EVICARE (725229), Technobeat (668724), and Vrienden UMC Utrecht.
Author contributions
J.X. and L.Y. designed the study and instructed all experiments. J.X. drafted the manuscript. J.L, T.Y., Z.S., H.T., X.H., L.W. Z.W., and Z.G., performed the experiments and analyzed the data. J.P.G.S., G.C.R., and S.D. provided technical assistance and revised the manuscript.
Declaration of interests
The authors declare no competing interests.
Footnotes
Supplemental Information can be found online at https://doi.org/10.1016/j.omtn.2020.12.015.
Contributor Information
Liming Yang, Email: limingyanghmu@163.com.
Junjie Xiao, Email: junjiexiao@shu.edu.cn.
Supplemental information
References
- 1.Song Y.H., Li Y., Du J., Mitch W.E., Rosenthal N., Delafontaine P. Muscle-specific expression of IGF-1 blocks angiotensin II-induced skeletal muscle wasting. J. Clin. Invest. 2005;115:451–458. doi: 10.1172/JCI22324. [DOI] [PMC free article] [PubMed] [Google Scholar]
- 2.Braunwald E. The war against heart failure: the Lancet lecture. Lancet. 2015;385:812–824. doi: 10.1016/S0140-6736(14)61889-4. [DOI] [PubMed] [Google Scholar]
- 3.Shen C., Zhou J., Wang X., Yu X.Y., Liang C., Liu B., Pan X., Zhao Q., Song J.L., Wang J. Angiotensin-II-induced Muscle Wasting is Mediated by 25-Hydroxycholesterol via GSK3β Signaling Pathway. EBioMedicine. 2017;16:238–250. doi: 10.1016/j.ebiom.2017.01.040. [DOI] [PMC free article] [PubMed] [Google Scholar]
- 4.Springer J., Springer J.I., Anker S.D. Muscle wasting and sarcopenia in heart failure and beyond: update 2017. ESC Heart Fail. 2017;4:492–498. doi: 10.1002/ehf2.12237. [DOI] [PMC free article] [PubMed] [Google Scholar]
- 5.von Haehling S. Muscle wasting and sarcopenia in heart failure: a brief overview of the current literature. ESC Heart Fail. 2018;5:1074–1082. doi: 10.1002/ehf2.12388. [DOI] [PMC free article] [PubMed] [Google Scholar]
- 6.von Haehling S., Ebner N., Dos Santos M.R., Springer J., Anker S.D. Role of microRNAs in wasting in heart failure. Nat. Rev. Cardiol. 2017;14:566. doi: 10.1038/nrcardio.2017.123. [DOI] [PubMed] [Google Scholar]
- 7.Xiao J. Springer; 2018. Muscle Atrophy. [Google Scholar]
- 8.Anker S.D., Ponikowski P., Varney S., Chua T.P., Clark A.L., Webb-Peploe K.M., Harrington D., Kox W.J., Poole-Wilson P.A., Coats A.J. Wasting as independent risk factor for mortality in chronic heart failure. Lancet. 1997;349:1050–1053. doi: 10.1016/S0140-6736(96)07015-8. [DOI] [PubMed] [Google Scholar]
- 9.Zhou J., Liu B., Liang C., Li Y., Song Y.H. Cytokine Signaling in Skeletal Muscle Wasting. Trends Endocrinol. Metab. 2016;27:335–347. doi: 10.1016/j.tem.2016.03.002. [DOI] [PubMed] [Google Scholar]
- 10.Mallinson J.E., Murton A.J. Mechanisms responsible for disuse muscle atrophy: potential role of protein provision and exercise as countermeasures. Nutrition. 2013;29:22–28. doi: 10.1016/j.nut.2012.04.012. [DOI] [PubMed] [Google Scholar]
- 11.Benoit B., Meugnier E., Castelli M., Chanon S., Vieille-Marchiset A., Durand C., Bendridi N., Pesenti S., Monternier P.A., Durieux A.C. Fibroblast growth factor 19 regulates skeletal muscle mass and ameliorates muscle wasting in mice. Nat. Med. 2017;23:990–996. doi: 10.1038/nm.4363. [DOI] [PubMed] [Google Scholar]
- 12.Cohen S., Nathan J.A., Goldberg A.L. Muscle wasting in disease: molecular mechanisms and promising therapies. Nat. Rev. Drug Discov. 2015;14:58–74. doi: 10.1038/nrd4467. [DOI] [PubMed] [Google Scholar]
- 13.Malavaki C.J., Sakkas G.K., Mitrou G.I., Kalyva A., Stefanidis I., Myburgh K.H., Karatzaferi C. Skeletal muscle atrophy: disease-induced mechanisms may mask disuse atrophy. J. Muscle Res. Cell Motil. 2015;36:405–421. doi: 10.1007/s10974-015-9439-8. [DOI] [PubMed] [Google Scholar]
- 14.Hammers D.W., Merscham-Banda M., Hsiao J.Y., Engst S., Hartman J.J., Sweeney H.L. Supraphysiological levels of GDF11 induce striated muscle atrophy. EMBO Mol. Med. 2017;9:531–544. doi: 10.15252/emmm.201607231. [DOI] [PMC free article] [PubMed] [Google Scholar]
- 15.Hindi S.M., Mishra V., Bhatnagar S., Tajrishi M.M., Ogura Y., Yan Z., Burkly L.C., Zheng T.S., Kumar A. Regulatory circuitry of TWEAK-Fn14 system and PGC-1α in skeletal muscle atrophy program. FASEB J. 2014;28:1398–1411. doi: 10.1096/fj.13-242123. [DOI] [PMC free article] [PubMed] [Google Scholar]
- 16.Bodine S.C., Latres E., Baumhueter S., Lai V.K., Nunez L., Clarke B.A., Poueymirou W.T., Panaro F.J., Na E., Dharmarajan K. Identification of ubiquitin ligases required for skeletal muscle atrophy. Science. 2001;294:1704–1708. doi: 10.1126/science.1065874. [DOI] [PubMed] [Google Scholar]
- 17.Pardo P.S., Hajira A., Boriek A.M., Mohamed J.S. MicroRNA-434-3p regulates age-related apoptosis through eIF5A1 in the skeletal muscle. Aging (Albany NY) 2017;9:1012–1029. doi: 10.18632/aging.101207. [DOI] [PMC free article] [PubMed] [Google Scholar]
- 18.Li J., Chan M.C., Yu Y., Bei Y., Chen P., Zhou Q., Cheng L., Chen L., Ziegler O., Rowe G.C. miR-29b contributes to multiple types of muscle atrophy. Nat. Commun. 2017;8:15201. doi: 10.1038/ncomms15201. [DOI] [PMC free article] [PubMed] [Google Scholar]
- 19.Moraes L.N., Fernandez G.J., Vechetti-Júnior I.J., Freire P.P., Souza R.W.A., Villacis R.A.R., Rogatto S.R., Reis P.P., Dal-Pai-Silva M., Carvalho R.F. Integration of miRNA and mRNA expression profiles reveals microRNA-regulated networks during muscle wasting in cardiac cachexia. Sci. Rep. 2017;7:6998. doi: 10.1038/s41598-017-07236-2. [DOI] [PMC free article] [PubMed] [Google Scholar]
- 20.Lehrke M., Lazar M.A. The many faces of PPARgamma. Cell. 2005;123:993–999. doi: 10.1016/j.cell.2005.11.026. [DOI] [PubMed] [Google Scholar]
- 21.Stump M., Mukohda M., Hu C., Sigmund C.D. PPARγ Regulation in Hypertension and Metabolic Syndrome. Curr. Hypertens. Rep. 2015;17:89. doi: 10.1007/s11906-015-0601-x. [DOI] [PMC free article] [PubMed] [Google Scholar]
- 22.Du Bois P., Pablo Tortola C., Lodka D., Kny M., Schmidt F., Song K., Schmidt S., Bassel-Duby R., Olson E.N., Fielitz J. Angiotensin II Induces Skeletal Muscle Atrophy by Activating TFEB-Mediated MuRF1 Expression. Circ. Res. 2015;117:424–436. doi: 10.1161/CIRCRESAHA.114.305393. [DOI] [PMC free article] [PubMed] [Google Scholar]
- 23.Anker S.D., Negassa A., Coats A.J., Afzal R., Poole-Wilson P.A., Cohn J.N., Yusuf S. Prognostic importance of weight loss in chronic heart failure and the effect of treatment with angiotensin-converting-enzyme inhibitors: an observational study. Lancet. 2003;361:1077–1083. doi: 10.1016/S0140-6736(03)12892-9. [DOI] [PubMed] [Google Scholar]
- 24.Chandra M., Miriyala S., Panchatcharam M. PPARγ and Its Role in Cardiovascular Diseases. PPAR Res. 2017;2017:6404638. doi: 10.1155/2017/6404638. [DOI] [PMC free article] [PubMed] [Google Scholar]
- 25.Kvandová M., Majzúnová M., Dovinová I. The role of PPARgamma in cardiovascular diseases. Physiol. Res. 2016;65(Suppl 3):S343–S363. doi: 10.33549/physiolres.933439. [DOI] [PubMed] [Google Scholar]
- 26.Rangwala S.M., Lazar M.A. Peroxisome proliferator-activated receptor gamma in diabetes and metabolism. Trends Pharmacol. Sci. 2004;25:331–336. doi: 10.1016/j.tips.2004.03.012. [DOI] [PubMed] [Google Scholar]
- 27.Kadoguchi T., Kinugawa S., Takada S., Fukushima A., Furihata T., Homma T., Masaki Y., Mizushima W., Nishikawa M., Takahashi M. Angiotensin II can directly induce mitochondrial dysfunction, decrease oxidative fibre number and induce atrophy in mouse hindlimb skeletal muscle. Exp. Physiol. 2015;100:312–322. doi: 10.1113/expphysiol.2014.084095. [DOI] [PubMed] [Google Scholar]
- 28.Georgakilas G., Vlachos I.S., Zagganas K., Vergoulis T., Paraskevopoulou M.D., Kanellos I., Tsanakas P., Dellis D., Fevgas A., Dalamagas T., Hatzigeorgiou A.G. DIANA-miRGen v3.0: accurate characterization of microRNA promoters and their regulators. Nucleic Acids Res. 2016;44(D1):D190–D195. doi: 10.1093/nar/gkv1254. [DOI] [PMC free article] [PubMed] [Google Scholar]
- 29.Sandri M., Lin J., Handschin C., Yang W., Arany Z.P., Lecker S.H., Goldberg A.L., Spiegelman B.M. PGC-1alpha protects skeletal muscle from atrophy by suppressing FoxO3 action and atrophy-specific gene transcription. Proc. Natl. Acad. Sci. USA. 2006;103:16260–16265. doi: 10.1073/pnas.0607795103. [DOI] [PMC free article] [PubMed] [Google Scholar]
- 30.Yoshida T., Delafontaine P. Mechanisms of Cachexia in Chronic Disease States. Am. J. Med. Sci. 2015;350:250–256. doi: 10.1097/MAJ.0000000000000511. [DOI] [PMC free article] [PubMed] [Google Scholar]
- 31.Rezk B.M., Yoshida T., Semprun-Prieto L., Higashi Y., Sukhanov S., Delafontaine P. Angiotensin II infusion induces marked diaphragmatic skeletal muscle atrophy. PLoS ONE. 2012;7:e30276. doi: 10.1371/journal.pone.0030276. [DOI] [PMC free article] [PubMed] [Google Scholar]
- 32.Poller W., Dimmeler S., Heymans S., Zeller T., Haas J., Karakas M., Leistner D.M., Jakob P., Nakagawa S., Blankenberg S. Non-coding RNAs in cardiovascular diseases: diagnostic and therapeutic perspectives. Eur. Heart J. 2018;39:2704–2716. doi: 10.1093/eurheartj/ehx165. [DOI] [PMC free article] [PubMed] [Google Scholar]
- 33.Wang L., Lv Y., Li G., Xiao J. MicroRNAs in heart and circulation during physical exercise. J. Sport Health Sci. 2018;7:433–441. doi: 10.1016/j.jshs.2018.09.008. [DOI] [PMC free article] [PubMed] [Google Scholar]
- 34.Li Y., Liang Y., Zhu Y., Zhang Y., Bei Y. Noncoding RNAs in Cardiac Hypertrophy. J. Cardiovasc. Transl. Res. 2018;11:439–449. doi: 10.1007/s12265-018-9797-x. [DOI] [PubMed] [Google Scholar]
- 35.Lu D., Thum T. RNA-based diagnostic and therapeutic strategies for cardiovascular disease. Nat. Rev. Cardiol. 2019;16:661–674. doi: 10.1038/s41569-019-0218-x. [DOI] [PubMed] [Google Scholar]
- 36.Simionescu-Bankston A., Kumar A. Noncoding RNAs in the regulation of skeletal muscle biology in health and disease. J. Mol. Med. (Berl.) 2016;94:853–866. doi: 10.1007/s00109-016-1443-y. [DOI] [PMC free article] [PubMed] [Google Scholar]
- 37.Soares R.J., Cagnin S., Chemello F., Silvestrin M., Musaro A., De Pitta C., Lanfranchi G., Sandri M. Involvement of microRNAs in the regulation of muscle wasting during catabolic conditions. J. Biol. Chem. 2014;289:21909–21925. doi: 10.1074/jbc.M114.561845. [DOI] [PMC free article] [PubMed] [Google Scholar]
- 38.Hudson M.B., Woodworth-Hobbs M.E., Zheng B., Rahnert J.A., Blount M.A., Gooch J.L., Searles C.D., Price S.R. miR-23a is decreased during muscle atrophy by a mechanism that includes calcineurin signaling and exosome-mediated export. Am. J. Physiol. Cell Physiol. 2014;306:C551–C558. doi: 10.1152/ajpcell.00266.2013. [DOI] [PMC free article] [PubMed] [Google Scholar]
- 39.Bei Y., Xiao J. MicroRNAs in muscle wasting and cachexia induced by heart failure. Nat. Rev. Cardiol. 2017;14:566. doi: 10.1038/nrcardio.2017.122. [DOI] [PubMed] [Google Scholar]
- 40.Janani C., Ranjitha Kumari B.D. PPAR gamma gene--a review. Diabetes Metab. Syndr. 2015;9:46–50. doi: 10.1016/j.dsx.2014.09.015. [DOI] [PubMed] [Google Scholar]
- 41.Kim J.H., Song J., Park K.W. The multifaceted factor peroxisome proliferator-activated receptor γ (PPARγ) in metabolism, immunity, and cancer. Arch. Pharm. Res. 2015;38:302–312. doi: 10.1007/s12272-015-0559-x. [DOI] [PubMed] [Google Scholar]
- 42.Moore-Carrasco R., Figueras M., Ametller E., López-Soriano F.J., Argilés J.M., Busquets S. Effects of the PPARgamma agonist GW1929 on muscle wasting in tumour-bearing mice. Oncol. Rep. 2008;19:253–256. [PubMed] [Google Scholar]
Associated Data
This section collects any data citations, data availability statements, or supplementary materials included in this article.