

Abstract
The cell division cycle-associated (CDCA) protein family plays an essential role in tumor progression by cell division. However, the function of each CDCA family member in hepatocellular carcinoma (HCC) is not well known. This study is to find the roles of CDCAs in the prognosis of HCC patients by using ONCOMINE, UALCAN, Human Protein Atlas, Kaplan-Meier Plotter, and cBioPortal databases. Overexpression of CDCA mRNA and protein were found to be significantly associated with individual cancer stages and tumor grades in HCC patients. Higher mRNA expressions of 6 CDCA family members were found to be significantly associated with shorter overall survival (OS) in HCC patients. Multivariate analysis showed that overexpressions of CDCA mRNA were independent prognostic factors for shorter OS in HCC patients. Moreover, a high mutation rate of CDCAs (27%) was also detected in HCC patients, and genetic alteration in CDCAs was associated with shorter overall survival (OS) and disease-free survival (DFS) in HCC patients. Finally, a functional analysis showed that CDCAs were mainly enriched in the cell cycle (hsa04110) and oocyte meiosis. Overall, these results indicated that CDCA2/3/4/5/8 could be prognostic biomarkers of survival in HCC patients.
Keywords: Hepatocellular carcinoma (HCC), cell division cycle associated (CDCA), prognosis
Introduction
Hepatocellular carcinoma (HCC) is a very common primary malignant liver neoplasm [1]. It is estimated to be the fourth commonest cause of cancer-related death worldwide [2]. Also, in China, it is the fourth commonest type of cancer and the second commonest cause of cancer-related death [3,4]. The HCC long-term survival rate is still low, although we have obtained improvements in the HCC treatment as liver transplantation, interventional therapy, and radical surgical resection [5]. The overall 5-year survival rate of HCC is below 20% in the USA [6]. A major reason is that most patients are diagnosed at advanced stages. Thus, it is urgent to explore HCC’s molecular mechanisms of the development, progression, invasion, and metastasis. It is crucial to find out new biomarkers for HCC’s early diagnosis and treatment.
Cell division has an indispensable role in the course of life. Many studies have confirmed that any abnormality in the process of cell division can result in cancer [7-9]. The Cell Division Cycle Associated (CDCA) protein family has eight members (CDCA1-8). Six CDCA family members are detected in the mammalian cells (CDCA2, 3, 4, 5, 7 and 8). Knockdown of CDCA2 may cause cell cycle arrest and restraint of cell apoptosis and proliferation [10,11]. CDCA3 may regulate the cell cycle progression. During the G1 checkpoint of the cell cycle, the expression level is controlled by protein degradation and transcription [12]. CDCA4 can regulate the G1/S transition [13]. CDCA5 can regulate sister chromatid cohesion and separation which is involved in cell division [14]. CDCA7 has emerged as a vital transcription factor under modulation of c-Myc [15]. CDCA8 is an important regulator of mitosis [16].
In recent years, many studies have reported that CDCAs may be prognostic factors in several cancers [17,18]. Separately, CDCA3/4/5/8 genes have been confirmed to be associated with the prognosis of liver cancer through bioinformatics and clinical trials [37,40,42,51]. However, the systematic analysis of the CDCA gene family role in HCC patients is little. This study aims to systematically analyze the correlation of CDCA genes’ mRNA expression with HCC patients’ survival. The mRNA expressions of CDCAs were detected in normal and HCC tissues. Then, the significance of CDCA genes’ prognostic value for HCC was analyzed. Later, the gene-gene interaction network was built to detect the underlying mechanisms and function of CDCAs. This study is to discover the clinical value of CDCA genes, in order to offer a certain theoretical basis for allowing early diagnosis, prognosis evaluation, and treatment specific to hepatocellular carcinoma.
Materials and methods
Oncomine database
ONCOMINE database (www.oncomine.org) is an online cancer array database for RNA or DNA analysis which can be used to promote catching the gene-wide expression analyses [19]. In this study, the transcription expressions of CDCA genes in various cancer types were examined on the basis of the ONCOMINE dataset. A comparison of CDCAs’ mRNA expression was made between the clinical tumor tissues and adjacent normal specimens. The comparison between different transcriptional expressions was made with Student’s t-test. The threshold of fold-change and P value were respectively set at 1.5 and 0.01; data type was set as mRNA.
UALCAN
UALCAN (http://ualcan.path.uab.edu) is an open-access web platform on the basis of level 3 RNA-seq and 31 cancer types clinical data from the TCGA database. It is used to compare the genes transcriptional expressions in tumor and normal tissues, and the association between the gene mRNA expression and pathologic features [20]. In our study, UALCAN was used to analyze the mRNA expressions of CDCAs in HCC tissues and the correlation with pathologic findings. The comparison of different transcriptional expressions was made by Student’s t test and P<0.05 was considered as a significant difference.
Human protein atlas
The Human Protein Atlas (https://www.proteinatlas.org) is an online dataset which contains protein expression data by immunohistochemistry for nearly 20 kinds of cancer tissues and 48 normal tissues [21]. Users can obtain protein expression images that are differentially expressed in a given tumor. In this study, protein expressions of CDCAs family members in normal and HCC tissues were compared by immunohistochemical image.
Kaplan-Meier plots
Kaplan-Meier plotter (http://kmplot.com/) is an online tool which is capable to assess the effect of any gene or gene combination on survival in many cancers [22]. To analyze the cancer patients’ overall survival (OS), PFS, and the post-progression survival (PPS), all patients were divided into groups of high and low expression in accordance with the 50% median expression level. The K-M plotter webpage contains the survival curves, the number-at-risk cases, median values of mRNA expression, HRs, 95% CIs and P value. P value <0.05 was considered a significant difference. It was used to evaluate the prognostic value of CDCA genes.
Cancer Genome Atlas (TCGA) database
TCGA is a project designed to help researchers to find new roads for cancer prevention and treatment. The database contains sequencing and pathologic data of over 30 kinds of human tumors [23]. The clinicopathologic data and CDCAs mRNA expression data of 377 HCC patients were acquired from the GDC data portal (https://gdc.cancer.gov/access-data/gdc-data-portal/). 34 of 377 HCC patients were excluded because of the absence of part of the clinical data. The basic clinical data, including gender, race, age, pathologic stage, treatment type, and prior malignancy, are summarized in Table 2.
Table 2.
Univariate analysis of overall survival in 343 HCC patients
| Univariate analysis | |||
|---|---|---|---|
|
| |||
| P value | Hazard ratio | 95% CI | |
| Gender | 0.134 | 1.334 | 0.915-1.944 |
| Race | 0.810 | 0.962 | 0.702-1.318 |
| Age at Diagnosis | 0.290 | 0.818 | 0.563-1.187 |
| AJCC Pathologic T | 0.000 | 1.699 | 1.399-2.062 |
| AJCC Pathologic N | 0.295 | 1.120 | 0.906-1.384 |
| AJCC Pathologic M | 0.120 | 1.182 | 0.957-1.459 |
| AJCC Pathologic stage | 0.000 | 1.710 | 1.396-2.095 |
| Prior malignancy | 0.802 | 0.920 | 0.480-1.763 |
| Treatment type | 0.413 | 0.857 | 0.593-1.239 |
| CDCA2 | 0.007 | 0.598 | 0.412-0.867 |
| CDCA3 | 0.002 | 0.549 | 0.376-0.803 |
| CDCA4 | 0.003 | 0.568 | 0.392-0.824 |
| CDCA5 | 0.000 | 0.484 | 0.330-0.711 |
| CDCA7 | 0.347 | 0.838 | 0.580-1.211 |
| CDCA8 | 0.000 | 0.454 | 0.308-0.668 |
Statistical methods
Cox regression analysis was used to assess the correlation between CDCA mRNA expression and the patients’ survival data by SPSS software version 21.0. Above all, effect of clinical data and mRNA expression on survival was evaluated by univariate Cox regression. Then, the independent prognostic value of each gene and clinicopathologic features that affect the OS was assessed by multivariate Cox regression. P<0.05 was considered a significant difference.
cBioPortal
The cBioPortal is an open access resource (http://www.cbioportal.org/) that can analyze genomics data for thousands of samples in the TCGA database [24]. We made an analysis on the genomic profiles of 6 CDCA family members in PanCancer Atlas of TCGA. It covered mutations, putative copy-number alterations from GISTIC, and mRNA Expression z-Scores (RNASeq V2 RSEM) with a z-score threshold= ±1.8. Genetic mutations in CDCAs and their association with OS and DFS of HCC patients were shown as Kaplan-Meier plots. By Log-rank test, the difference between the survival curves was identified and P<0.05 was considered to have a statistical difference.
GSEA
GSEA is a software that can be used to confirm whether genes are involved in one signaling pathway or phenotype (http://software.broadinstitute.org/gsea/index.jsp) [25]. We conducted GSEA to examine the underlying mechanisms by using RNA-seq data of HCC patients from TCGA-LIHC (total 20530 features). The Kyoto Encyclopedia of Genesand Genomes (KEGG) gene set “c2.cp.kegg.v7.1.symbols.gmt” was used for further analysis. The metric for ranking genes was Pearson. The random sample permutation number was set as 1,000. P<0.01 and FDR (false discovery rate) q value <0.25 were considered to have statistical significance.
String
The Search Tool for Retrieval of Interacting Genes database (STRINGdb: https://string-db.org/) was used to acquire co-expression neighbor genes and the Protein-Protein Interaction (PPI) Networks information [26]. We utilized the multiple protein to input data and selected Homo sapiens as the data source. Combined score > 0.4 was considered to have statistical significance. Then the functional protein association network was established, and the 56 nodes were selected for further analysis. Cytoscape software 3.6.0 (http://www.cytoscape.org) was used to visualize and analyze the results of the STRING database. Then, the PPI was established and the node degree was analyzed.
Metascape
Metascape is an analysis database of gene annotation that has rapid data updating and extensive coverage. It can be used to perform GO enrichment analysis of the biological process (BP), the cellular component (CC), and the molecular function (MF), and pathway enrichment analysis [27]. An analysis of CDCAs and the neighbor genes was made by using KEGG and GO approaches in Metascape. Finally, we got the Gene Ontology (GO) and Kyoto Encyclopedia of Genes and Genomes (KEGG) enriched terms heatmap, as well as their network.
Results
Overexpression of different CDCA family members in HCC patients
To explore the therapeutic and prognostic value of different CDCA members in HCC patients, an analysis of mRNA expression levels and protein expression levels was made by using ONCOMINE database (www.oncomine. org), UALCAN (http://ualcan.path.uab.edu), and Human Protein Atlas (https://www.proteinatlas.org).
Six CDCA factors are recognized in mammalian cells. As Figure 1 and Table 1 show, a measurement and comparison of mRNA expression of 6 CDCA family members in 20 cancer types was made to normal tissues by using the ONCOMINE database. Higher mRNA expressions of CDCA2/3/4/5/7/8 were detected in HCC tissues in multiple datasets. Wurmbach observed a 1.813-fold increase in CDCA2 mRNA expression in HCC samples (P=1.94E-4) [28]. CDCA3 overexpression was found in HCC tissues, and the fold change was 3.241 by the Wurmbach Liver dataset (P=3.39E-8), and 1.633 by the Roessler Liver2 dataset (P=6.04E-42) [28,29]. In the Wurmbach Liver dataset and Roessler Liver2 dataset, 1.832-fold (1.55E-5) and 1.545-fold (8.68E-38) increases in CDCA4 mRNA expression were detected in HCC tissues compared to normal tissues [28,29]. CDCA5 overexpression was also detected in HCC tissues, and the fold change was 4.400 by Chen Liver dataset (P=4.55E-24) [30], and 2.422 by Wurmbach Liver dataset (4.84E-6) [28]. In Chen Liver dataset, a 1.955-fold increase in CDCA7 mRNA expression was found in HCC tissues compared to normal tissues (P=7.28E-8) [30]. Significant up-regulation of CDCA8 was detected in HCC tissues compared to normal tissues. The result from the Chen Liver dataset indicated that there were 2.194-fold (P=3.98E-10) and 5.159-fold (P=3.98E-24) increases in CDCA8 mRNA expression in HCC tissues [30]. Meanwhile, in the Roessler Liver dataset and Roessler Liver2 dataset, 1.76-fold (P=1.66E-6) and 1.583-fold (P=1.99E-37) increases in CDCA8 mRNA expression respectively, were found in HCC tissues compared to normal tissues [29]. CDCA8 overexpression was also found in the Wurmbach Liver dataset, and the fold change in HCC was 1.693 (P=2.19E-5) [28].
Figure 1.
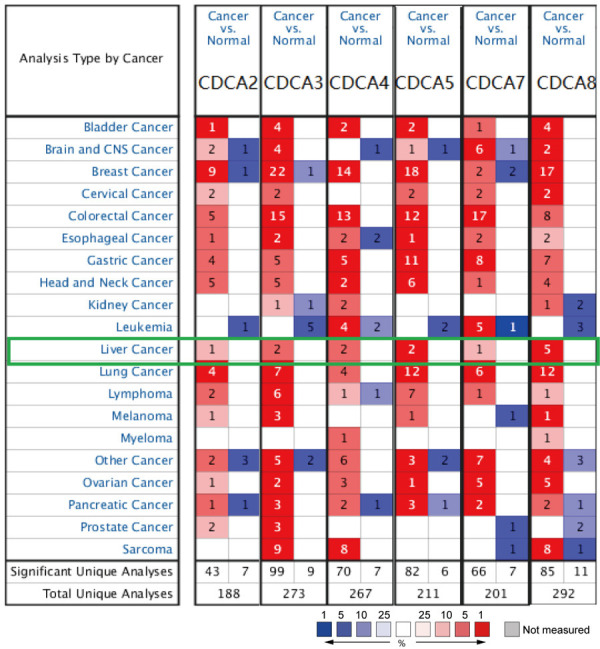
Transcriptional expression of six CDCA family members in different cancers (ONCOMINE database). mRNA expression of CDCAs in different types of cancers compared with normal tissues (red, overexpression; blue, downregulation). Difference of transcriptional expression was compared by Student’s t-test. Cut-off of p value and fold change were as follows: p value: 0.01, fold change: 1.5, gene rank: 10%, data type: mRNA.
Table 1.
Significant changes in CDCAs’ mRNA expression between HCC and normal liver tissues (ONCOMINE)
| Types of HCC vs. Liver | Fold Change | P value | t-test | Ref |
|---|---|---|---|---|
| CDCA2 | ||||
| Hepatocellular Carcinoma | 1.813 | 1.94E-04 | 3.877 | Wurmbach Liver [28] |
| CDCA3 | ||||
| Hepatocellular Carcinoma | 3.241 | 3.39E-08 | 6.686 | Wurmbach Liver [28] |
| Hepatocellular Carcinoma | 1.633 | 6.04E-42 | 16.083 | Roessler Liver2 [29] |
| CDCA4 | ||||
| Hepatocellular Carcinoma | 1.832 | 1.55E-05 | 4.765 | Wurmbach Liver [28] |
| Hepatocellular Carcinoma | 1.545 | 8.68E-38 | 14.390 | Roessler Liver2 [29] |
| CDCA5 | ||||
| Hepatocellular Carcinoma | 4.400 | 4.55E-24 | 11.810 | Chen Liver [30] |
| Hepatocellular Carcinoma | 2.422 | 4.84E-06 | 5.128 | Wurmbach Liver [28] |
| CDCA7 | ||||
| Hepatocellular Carcinoma | 1.955 | 7.28E-08 | 5.512 | Chen Liver [30] |
| CDCA8 | ||||
| Hepatocellular Carcinoma | 2.194 | 3.98E-10 | 7.291 | Chen Liver [30] |
| Hepatocellular Carcinoma | 5.159 | 3.98E-24 | 12.080 | Chen Liver [30] |
| Hepatocellular Carcinoma | 1.760 | 1.66E-06 | 6.008 | Roessler Liver [28] |
| Hepatocellular Carcinoma | 1.693 | 2.19E-05 | 4.676 | Wurmbach Liver [28] |
| Hepatocellular Carcinoma | 1.583 | 1.99E-37 | 14.357 | Roessler Liver2 [29] |
HCC: hepatocellular carcinoma; CDCA: cell division cycle-associated.
Next, the mRNA expressions of 6 CDCA family members were measured using UALCAN (http://ualcan.path.uab.edu). UALCAN resources were on the basis of level 3 RNA-seq and clinical data from the TCGA database, which is different from the ONCOMINE database. As Figure 2 shows, mRNA expressions of all 6 CDCA members were found to have significant up-regulation in HCC tissues compared to normal tissues (P<0.05).
Figure 2.
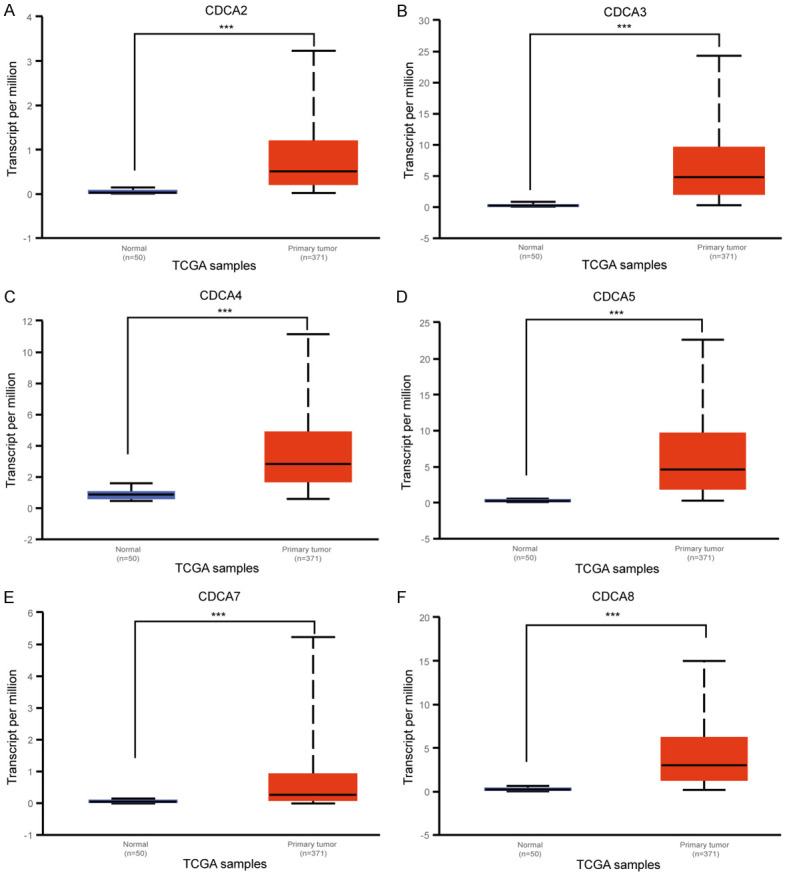
The mRNA expression of 6 CDCA family members in HCC tissues and adjacent normal liver tissues (UALCAN). The mRNA expressions of six CDCA family members were overexpressed in primary HCC tissues compared to normal tissues (A-F). ***P<0.001.
Lastly, we tried to detect the protein expression levels of 6 CDCA family members in HCC by the Human Protein Atlas (https://www.proteinatlas.org). As Figure 3 shows, CDCA5/8 proteins were not expressed or lowly detected in normal liver tissues, whereas they had moderate-high expressions in HCC tissues (Figure 3C, 3D). CDCA2 protein was not expressed in normal liver tissues, while moderate expression was detected in HCC tissues (Figure 3A). However, protein expression of CDCA4 was detected neither in normal liver tissues nor HCC tissues (Figure 3B). No protein expression of CDCA3/7 was found in the Human Protein Atlas dataset.
Figure 3.
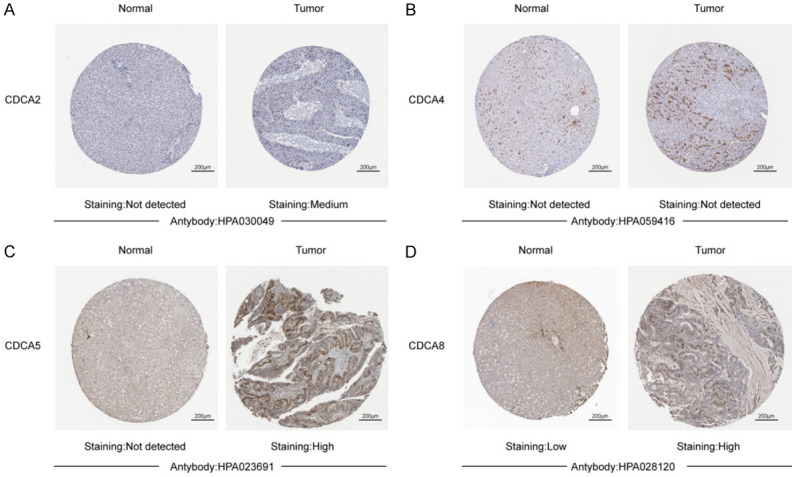
Immunohistochemical images of six CDCA family members in HCC tissues and normal liver tissues (Human Protein Atlas). CDCA5/8 proteins were not detected or lowly detected in normal liver tissues, but had high and moderate expressions in HCC tissues (C, D). CDCA2 protein was not detected in normal liver tissues, but had moderate expression in HCC tissues (A). CDCA4 was detected neither in normal liver tissues nor HCC tissues (B).
As a whole, our study showed that CDCA family members were overexpressed in HCC patients at the transcriptional and protein levels.
Correlation of mRNA expression of different CDCA family members with clinical characteristics of HCC patients
Since the overexpression of CDCA family members was proven in HCC, we speculated that overexpression of the CDCAs may be correlated with advanced clinical characteristics in HCC patients. We made an analysis on the correlation of the mRNA expression of 6 CDCA family members with the clinical characteristics of HCC patients by using UALCAN (http://ualcan.path.uab.edu), involving clinical stages and tumor grades of the patients. As Figure 4 shows, the CDCAs mRNA expression levels were associated with the patients’ individual cancer stages. Patients in advanced clinical stages were inclined to have higher CDCA mRNA expression (Figure 4). Stage 3 had the highest mRNA expression level. The CDCAs mRNA expression levels in Stage 3 were higher than those in Stage 4 due to the number of Stage 4 patients being limited (only 6 patients in Stage 4).
Figure 4.
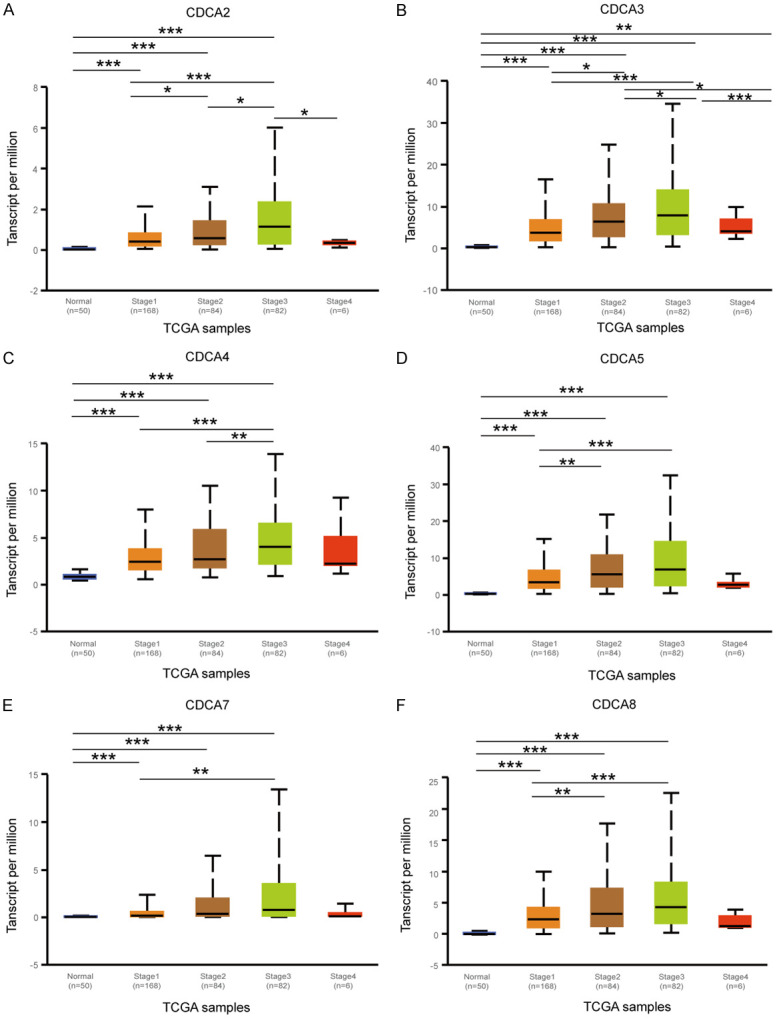
Relationship between mRNA expressions of 6 CDCA family members and individual cancer stages of HCC patients (UALCAN). The mRNA expressions of CDCAs were remarkably correlated with patients’ individual cancer stages. Patients with advanced clinical stages tended to have higher CDCA mRNA expression. Stage 3 had the highest mRNA expression level (A-F). *P<0.05, **P<0.01, ***P<0.001.
Similarly, as Figure 5 shows, the mRNA expression levels of 6 CDCA family members were positively associated with tumor grade. As the tumor grade increased, the CDCAs mRNA expression tended to be higher. The mRNA expressions of CDCA3/5/7 were found highest in tumor grade 4 (Figure 5B, 5D, 5E), whereas the mRNA expression of CDCA2/4/8 were found highest in grade 3 (Figure 5A, 5C, 5F).
Figure 5.
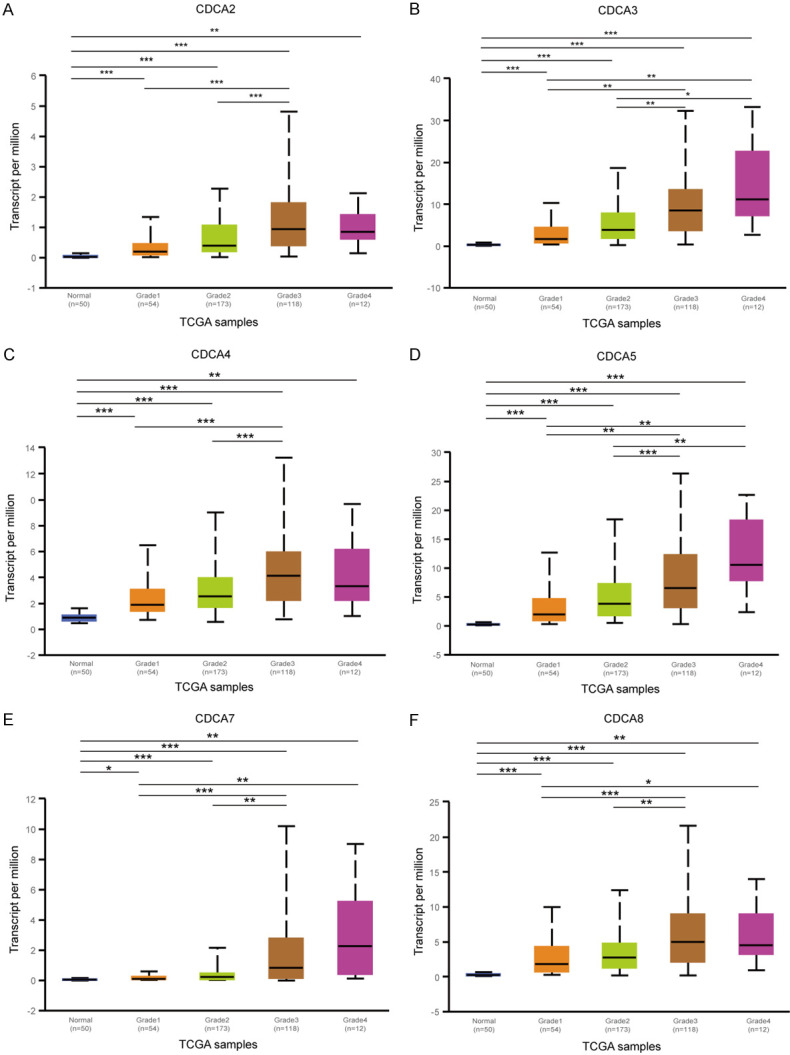
Association of mRNA expression of 6 CDCA family members with tumor grades of HCC patients tumor grades (UALCAN). As tumor grade increased, the mRNA expression of CDCAs tended to be higher. The highest mRNA expressions of CDCA3/5/7 were found in tumor grade 4 (B, D, E), while the highest mRNA expressions of CDCA2/4/8 were found in grade 3 (A, C, F). *P<0.05, **P<0.01, ***P<0.001.
Generally, the aforesaid findings suggested that the CDCAs mRNA levels are significantly related to clinical characteristics of HCC patients and can be a biomarker for HCC advanced stage.
Prognostic value of CDCA mRNA expression in HCC patients
Further, we analyzed the prognostic values of the CDCAs in HCC patients by Kaplan-Meier plotter (http://kmplot.com/analysis/). As Figure 6 shows, the mRNA expressions of all 6 CDCA family members were significantly correlated with the prognosis of HCC patients. Higher mRNA expression of CDCA2 (HR=1.94, 95% CI: 1.36-2.76, and P=0.00017), CDCA3 (HR=2.21, 95% CI: 1.47-3.34, and P=9.8e-05), CDCA4 (HR=2.07, 95% CI: 1.31-3.28, and P=0.0016), CDCA5 (HR=2.32, 95% CI: 1.62-3.32, and P=2.3e-06), CDCA7 (HR=1.73, 95% CI: 1.2-2.49, and P=0.0029), and CDCA8 (HR=2.69, 95% CI: 1.89-3.83, and P=1.2e-08) were significantly correlated to HCC patients’ shorter OS.
Figure 6.
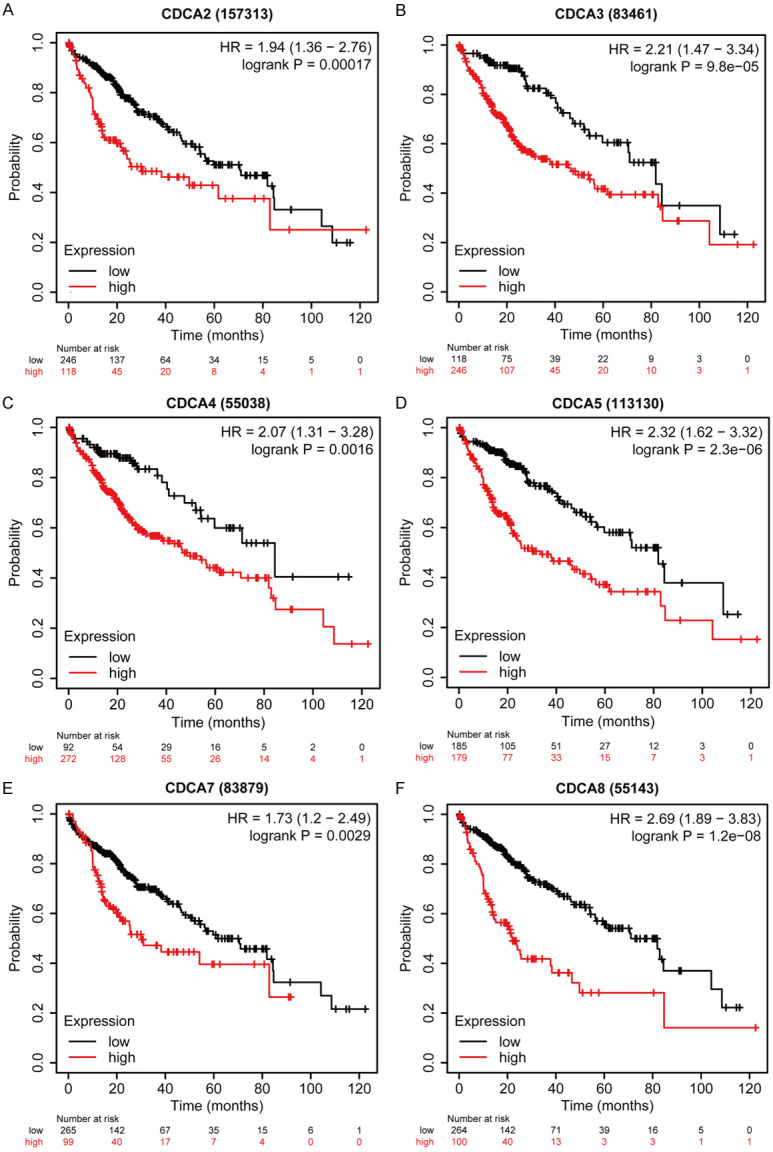
Prognostic value of mRNA expression of 6 CDCA family members in HCC patients (Kaplan-Meier Plotter). Higher mRNA expressions of CDCA2/3/4/5/7/8 were both significantly associated with shorter OS in HCC patients (A-F).
Those results showed that mRNA expressions of six CDCA family members were significantly correlated to the HCC patients’ prognosis and may be biomarkers for estimating the survival in HCC patients.
Independent prognostic value of CDCA mRNA expression in HCC patients
After CDCAs’ mRNA expressions were found to have significant association with the HCC prognosis, then we tried to assess the independent prognostic value of CDCA mRNA expression in terms of OS. We downloaded integrated clinical data (Table S1) and mRNA expression of CDCAs in 343 HCC patients from the GDC data portal in order to do a Cox survival regression analysis. Univariate analysis showed that higher pathologic stage (HR=1.710, 95% CI: 1.396-2.095, and P<0.001), Pathologic T (HR=1.699, 95% CI: 1.399-2.062, and P<0.001), and higher mRNA expressions of CDCA2 (HR=0.598, 95% CI: 0.412-0.867, and p=0.007), CDCA3 (HR=0.549, 95% CI: 0.376-0.803, and p=0.002), CDCA4 (HR=0.568, 95% CI: 0.392-0.824, and p=0.003), CDCA5 (HR=0.484, 95% CI: 0.330-0.711, and P<0.001), and CDCA8 (HR=0.454, 95% CI: 0.308-0.668, and P<0.001) were corelated to shorter OS in HCC patients (Table 2). Multivariate analysis showed that higher mRNA expressions of CDCA2 (HR=0.631, 95% CI: 0.428-0.928, and P=0.019), CDCA3 (HR=0.565, 95% CI: 0.381-0.839, and P=0.005), CDCA4 (HR=0.568, 95% CI: 0.386-0.835, and P=0.004), CDCA5 (HR=0.517, 95% CI: 0.348-0.769, and P=0.001), CDCA8 (HR=0.492, 95% CI: 0.332-0.728, and P<0.001) were independently correlated to shorter OS in HCC patients (Tables S2, S3, S4, S5, S6 and S7).
These results indicated that mRNA expressions of CDCA2/3/4/5/8 were independent prognostic factors for HCC patients’ OS.
Gene mutations in CDCAs and their correlations to HCC patients’ overall survival (OS) and disease-free survival (DFS)
We made an analysis on the gene mutations in CDCAs and their correlation to HCC patients’ OS and DFS. The cBioPortal (https://www.cbioportal.org/) platform provided data on the gene mutations of CDCA members. As Figure 7A shows, a high CDCAs mutation rate was found in HCC patients. Approximately 27% of all CDCAs were altered among the TCGA-LIHC patients. CDCA2 and CDCA5 were the highest two genes with gene mutations, and their mutation rates were 12%, and 10% (Figure 7A). Moreover, results from Kaplan-Meier plot and log-rank test indicated that gene mutations in CDCAs were correlated to shorter OS (Figure 7B, P=3.139e-4) and DFS (Figure 7C, P=1.662e-4). These results showed that gene mutations of CDCAs may affect HCC patients’ prognosis.
Figure 7.
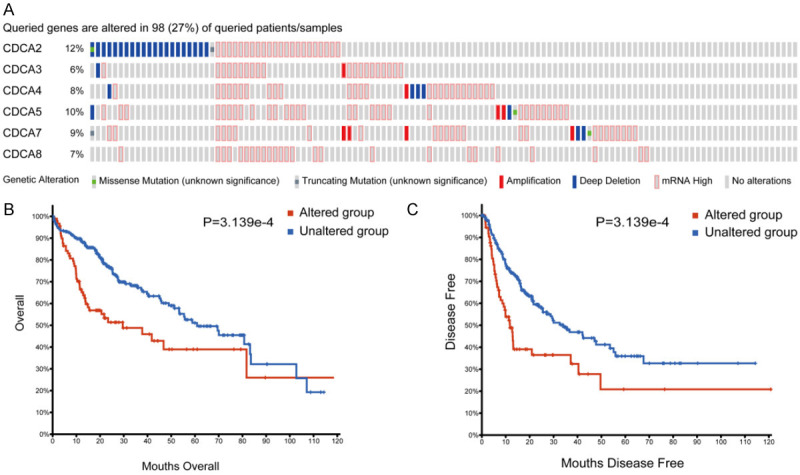
Genetic mutations in 6 CDCA family members and their association with OS and DFS of HCC patients (cBioPortal). High mutation rate (27%) of CDCAs was noted in HCC patients. CDCA2 and CDCA5 ranked as the two highest genes with mutations, and their mutation rates were 12%, 10% (A). Genetic alterations in CDCAs were associated with shorter OS (B) and DFS (C) of HCC patients.
Signaling pathway enrichment analysis of CDCA family members in HCC patients
Gene set enrichment analysis (GSEA) was made to identify differentially enriched biologic pathways of CDCAs in TCGA cohorts. GSEA results of the CDCA family members are shown in Figure 8A-F and Table S8, and suggested that the high expressions of CDCAs were significantly correlated with both cell cycle process and progesterone-mediated oocyte maturation. The low expressions of CDCAs were significantly correlated with metabolism pathways.
Figure 8.
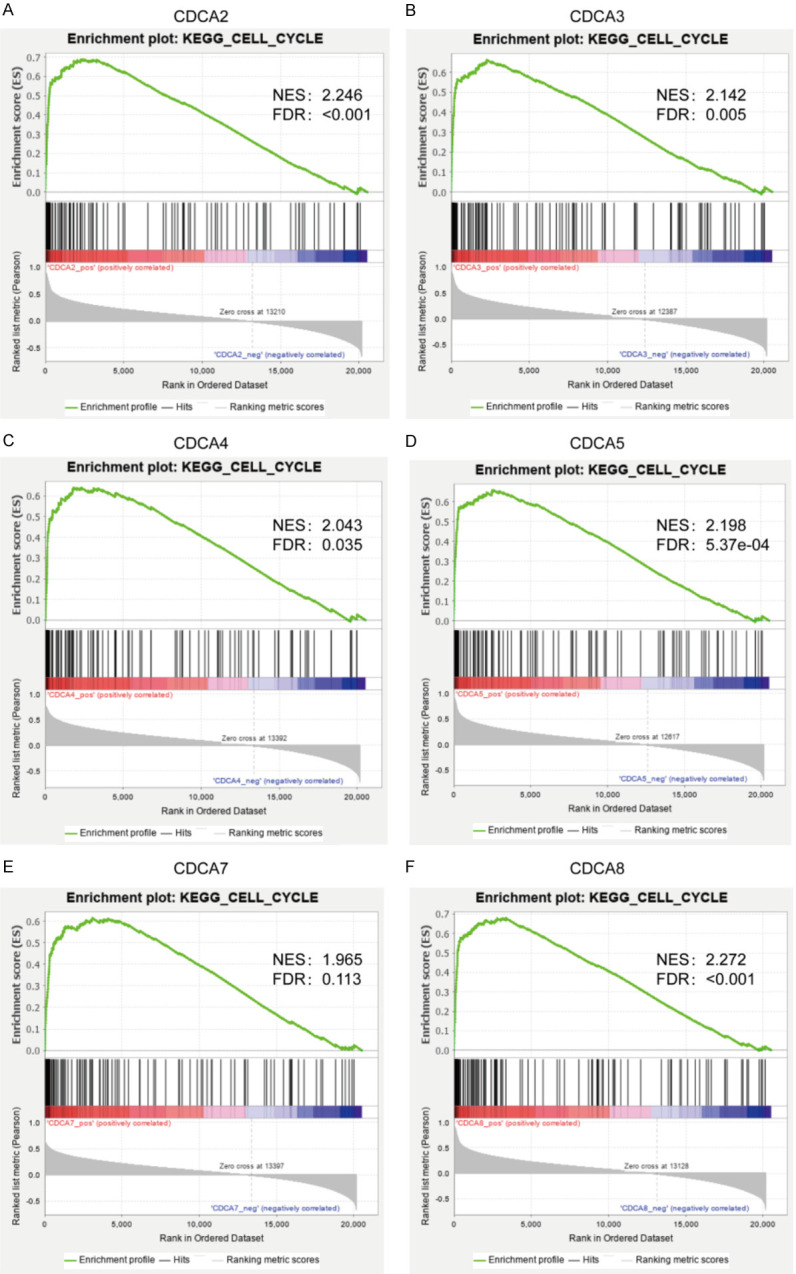
Signaling pathway enrichment analysis of CDCA family members in HCC patients (GSEA). High expressions of CDCAs were both significantly correlated with cell cycle process.
PPI network construction
We examined 50 neighbor genes that were co-expressed with CDCA genes by String (https://string-db.org/). Then, the functional protein association network was established (Figure 9A). We used Cytoscape to visualize and analyze the results of the STRING database. Then, a PPI network was established. The 56 genes were evaluated by degree in the PPI network. As shown in Figure 9B, CDC20, CDK1, BUB1, KIF2C, CCNB2, CCNB1, PLK1, NDC80, AURKB, and NUF2 were the top ten with highest degree discovered in our results.
Figure 9.
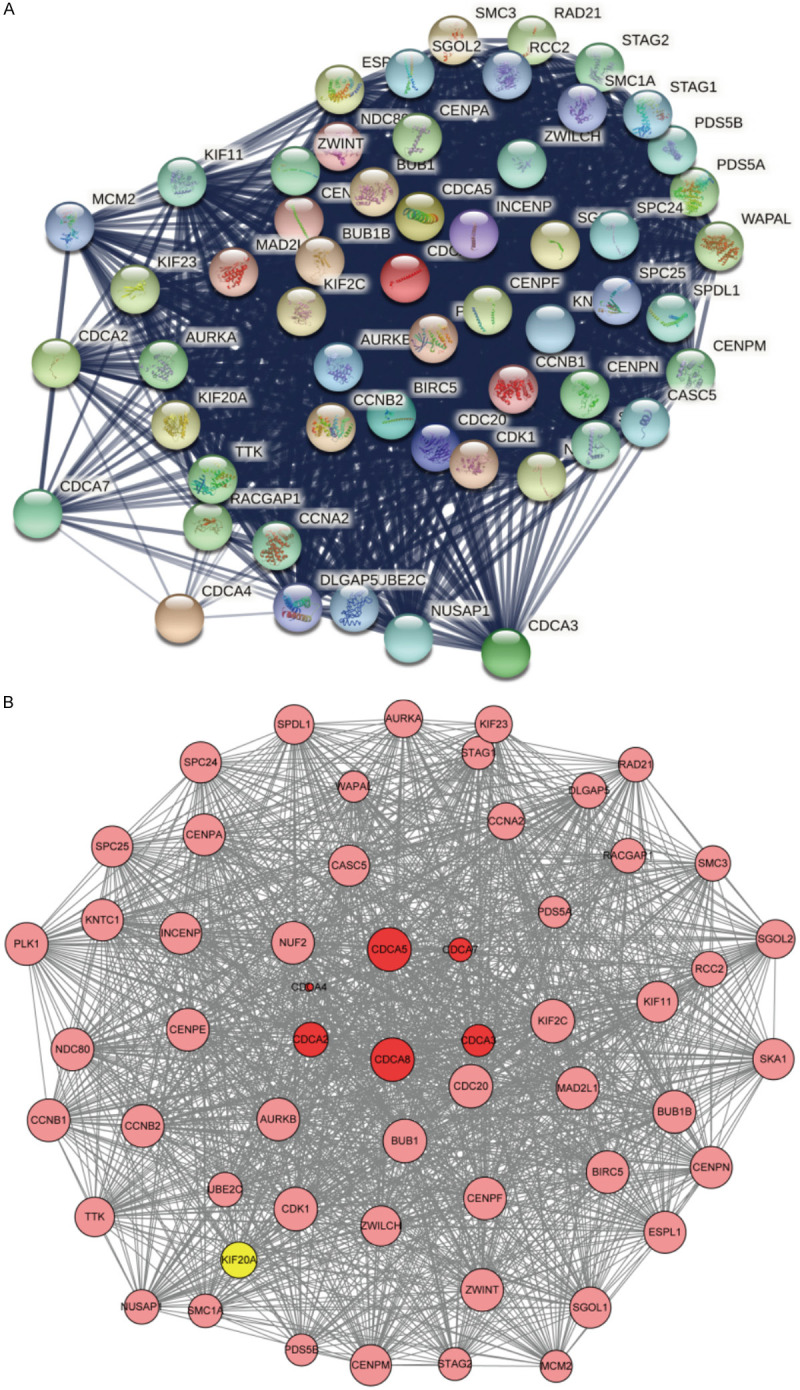
Functional protein association network of CDCAs and 50 co-expression genes (String and Cytoscape). 50 neighbor genes were co-expressed with CDCA genes (A). CDC20, CDK1, BUB1, KIF2C, CCNB2, CCNB1, PLK1, NDC80, AURKB, and NUF2 were the top ten discovered (B).
Predicted functions and pathways of CDCA genes and 50 CDCA-related genes in HCC patients
We performed functional and pathway enrichment analyses of CDCAs and their 50 frequently co-expressed neighbor genes using Metascape (http://metascape.org/). As shown in Figure 10A-C, the GO terms showed that the CDCAs were mostly associated with the processes below: cell division, chromosome, centromeric region, chromosome segregation, spindle and microtubule cytoskeleton organization related to mitosis. The KEGG pathway analysis showed that the CDCA family members were primarily concentrated in the cell cycle (hsa04110) and oocyte meiosis.
Figure 10.
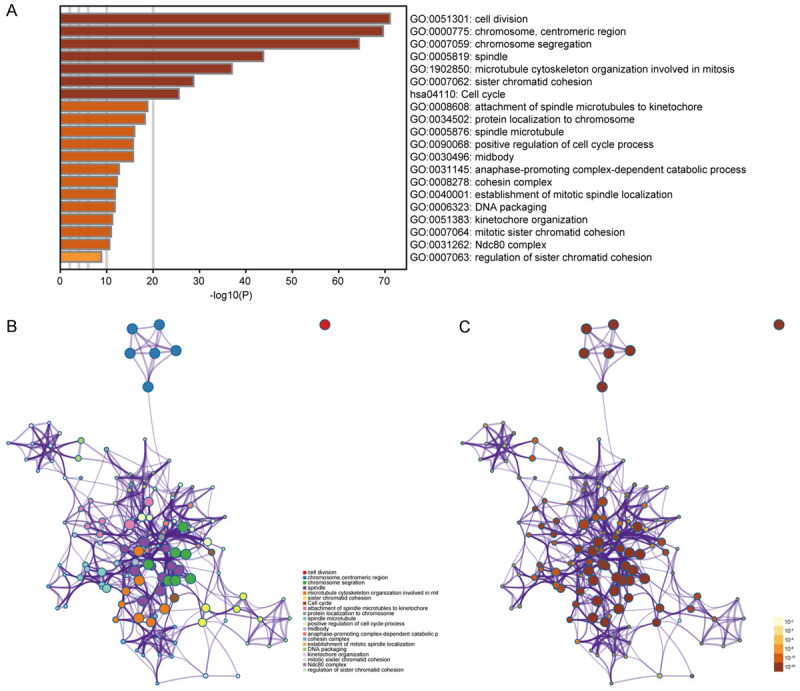
Functional and pathway enrichment analyses of CDCAs and their 50 frequently co-expressed neighbor genes (Metascape). Heatmap of the Gene Ontology (GO) and Kyoto Encyclopedia of Genes and Genomes (KEGG) enriched terms colored by P values (A). Network of GO and KEGG enriched terms colored by P values (B). Network of GO and KEGG enriched terms colored by clusters (C).
Discussion
Hepatocellular carcinoma has been found to be associated with mutations and/or the overexpression of oncogenic genes. It is important to find new targets for the prognosis and treatment of HCC. Although some members of the CDCA family have been proven to have crucial roles in HCC, the specific roles of CDCA family members in HCC were still to be illuminated. In our study, the expression, prognostic values, and mutations of different CDCA members in HCC were analyzed.
Unregulated cell cycle-mediated cell transformation and uncontrolled cell growth are the basic biologic characteristics of malignant tumors. Cell division plays an irreplaceable role in tumor progression. Studies have demonstrated that CDCA family member genes are involved in tumor cell proliferation, apoptosis, invasion activity, and even drug resistance. Some results also showed that CDCAs could function in different pathways.
CDCA2 may regulate the H3 (the primary mitotic histone) phosphorylation by PP1 (protein phosphatase 1) [31]. The chromatin organization is crucial in post-mitotic nuclei. Several studies suggested that CDCA2 represented a very strong prognostic marker for poor patient survival [32]. Previously, CDCA2 was proven to be involved in some cancer types such, as prostate cancer, colorectal cancer, and lung adenocarcinoma [33-35]. In a recent study, CDCA2 could act as an oncogene and is regulated by hypoxia and the HIF-1α pathway in prostate cancer [33]. In another study, CDCA2 overexpression may target CCND1 to accelerate colorectal cancer cell proliferation by the PI3K/AKT pathway [34]. In our study, higher CDCA2 mRNA and protein expressions were found in HCC tissues compared to normal tissues. The CDCA2 mRNA expression was correlated to patients’ individual cancer stages and tumor grades, as noted by previous studies. Additionally, higher CDCA2 mRNA expression was correlated with shorter OS of HCC patients, being an independent prognostic factor for shorter OS in HCC patients.
Overexpression of CDCA3 may be associated with tG1 arrest in the cell cycle. A current study shows that CDCA3 acts as an oncogene, and may be a prognostic predictor and a therapeutic target for patients with gastric cancer [36]. In another bioinformatic study, CDCA3 mRNA expression level was higher than in the control sample. The highly expressed gene in the tumors of patients with breast cancer sharply decreased patient survival [18]. Guan’s bioinformatic analysis suggested that CDC20, CDCA3, cyclin (CCN) E1, and chromatin licensing and DNA replication factor 1 have a significant association with cell division, mitotic cell cycle, and positive regulation of cell proliferation in HCC [37]. CDCA3 can initiate several types of cancer. Similarly, our results indicated that CDCA3 mRNA expression level was higher in HCC patients. CDCA3 was an independent prognostic factor in HCC patients.
CDCA4 can regulate the G1/S transition. It was proven to have a key role in adjusting the transcription factor (TF) activities [38]. Xu’s study suggested that CDCA4 promoted proliferation and decreased apoptosis in MCF-7/ADM human breast cancer cells [39]. In another bioinformatic study, CDCA4 was correlated with HCC progression and prognosis [40]. In our study, CDCA4 has been demonstrated to have a unique role in regulating the cell cycle. The CDCA4 mRNA expression was found to be high in HCC tissues and was related to the prognosis of HCC patients.
CDCA5 is an important factor for the interaction between cohesin and chromatin in interphase. CDCA5 has been linked to the development of various human cancers. Experiments showed that there was increased CDCA5 expression in colorectal cancer and in noncancerous adjacent tissue, and CDCA5 up-regulation in colorectal cancer tissues was associated with shorter patient survival [41]. Hao et al demonstrated that CDCA5 is an oncogene in liver cancer and it interrupts cell behavior by the AKT pathway [42]. Another study demonstrated that CDCA5 expression was in connection with the increased tumor diameter and the microvascular invasion in HCC. CDCA5 was correlated to poor prognosis in HCC patients [43]. Likewise, our study showed that higher CDCA5 mRNA expression was significantly related to poorer OS, being an independent prognostic factor for shorter OS in HCC patients. This indicated that CDCA5 had an oncogenic effect in HCC.
Previously, much research demonstrated that CDCA7 played an oncogene role in several cancers, such as colorectal cancer, lung adenocarcinoma, and triple-negative breast cancer [44-46]. In current research, CDCA7 silencing in triple-negative breast cancer cell lines effectively impaired cell invasion, migration, and proliferation [46]. The strengths of CDCA7 immunostaining were correlated to the lymph node metastasis, invasion depth, tumor-node-metastasis stage, and distant metastasis in colorectal cancer. Moreover, compared to patients with high CDCA7 expression the, those with low CDCA7 expression had a higher overall survival rate of colorectal cancer [44]. We also found a similar CDCA7 tumorigenic effect in HCC in our study. The results indicated that higher CDCA7 mRNA and protein expressions in HCC tissues, and CDCA7 mRNA expression level were significantly related to patients’ individual cancer stages and tumor grades.
CDCA8 has an essential role in genomic transmission in the cell division process [47]. CDCA8 is a gene of cell cycle regulation, being upregulated at G2-M phases of the cell cycle [48]. CDCA8 is expressed highly in various tumors and accelerates tumor development. Gao et al [49] found that CDCA8 was expressed highly in bladder cancer compared to normal tissues, and its high expression has a significant association with a poor prognosis. CDCA8 may act as an effective therapeutic target for bladder cancer treatment. CDCA8 is a crucial mediator of estrogen-stimulated breast cancer cell growth and survival, so as to be used as a target in the treatment of breast cancer [50]. In a bioinformatics study, abnormal expression of CDCA8 could be taken as gene biomarker of HCC [51]. Our study also found that the expression level of CDCA8 was up-regulated in HCC tissues compared to that in non-carcinoma tissues, and the mRNA expression level of CDCA8 had a significant correlation with patients’ individual cancer stages and tumor grades. Higher CDCA8 mRNA expression was significantly related to poorer OS, being an independent prognostic factor for shorter OS in HCC patients. This indicates that CDCA8 is involved in the tumorigenesis of HCC.
In conclusion, our results found that mRNA and protein overexpressions occurred in all the CDCA family members, and CDCAs mRNA expression levels were linked to patients’ individual cancer stages and tumor grades. Higher CDCAs mRNA expression levels were correlated to shorter OS in HCC patients. The multivariate analysis indicated that higher mRNA expressions of CDCA2/3/4/5/8 were independent prognostic factors for shorter OS in HCC patients. Besides, a high mutation rate (27%) of CDCAs was found in HCC patients and the genetic alteration in CDCAs was correlated to shorter OS and DFS. Moreover, enriched biologic pathways of CDCAs were analyzed. The results showed that the high expression of CDCAs was significantly related to both cell cycle process and progesterone-mediated oocyte maturation. Finally, we examined 50 co-expressed genes and analyzed CDCAs’ functions and pathways and their 50 co-expression neighbor genes. The GO terms indicated that they were primarily enriched in cell division, chromosome, centromeric region, chromosome segregation, spindle, and microtubule cytoskeleton organization involved in mitosis. The KEGG pathway analysis indicated that they were primarily enriched in the cell cycle (hsa04110) and oocyte meiosis.
Based on the results above, several strengths of this analysis should be mentioned. First, this is the first study to comprehensively describe the correlation of the mRNA expressions of CDCA family members with the prognosis in HCC patients. Second, we revealed the expressions of six CDCAs based not only on ONCOMINE data sets but also confirmed by TCGA-LIHC data sets. Third, we confirmed the different expression and the function of CDCA family members in HCC at the transcriptional level, gene mutation level, and protein level. Fourth, based on the information presented in the current study, CDCAs may be biomarkers to predict the risk of disease progression and the OS for HCC patients. However, some limitations still existed in this study. First, the data we used to make analysis were acquired from online databases, and further studies consisting of larger sample sizes should be made to confirm our findings and CDCAs’ clinical application in the HCC treatment. Second, we did not evaluate the possible diagnostic and therapeutic roles of CDCA genes in HCC, and further studies should be made to determine whether CDCA genes can act as the diagnostic markers or therapeutic targets. Third, we did not study the mechanism of each CDCA gene in HCC, and further studies should be made to deeply explore the mechanism of CDCAs in HCC.
Conclusion
These results indicated that CDCA2/3/4/5/8 could be prognostic biomarkers of survival in HCC patients.
Acknowledgements
The results of the present study are in whole or part based upon data generated by the TCGA Research Network (http://cancergenome.nih.gov/) and the ONCOMINE dataset (www.oncomine.org).
Disclosure of conflict of interest
None.
Supporting Information
References
- 1.Kim HS, El-Serag HB. The epidemiology of hepatocellular carcinoma in the USA. Curr Gastroenterol Rep. 2019;21:17. doi: 10.1007/s11894-019-0681-x. [DOI] [PubMed] [Google Scholar]
- 2.Yang JD, Hainaut P, Gores GJ, Amadou A, Plymoth A, Roberts LR. A global view of hepatocellular carcinoma: trends, risk, prevention and management. Nat Rev Gastroenterol Hepatol. 2019;16:589–604. doi: 10.1038/s41575-019-0186-y. [DOI] [PMC free article] [PubMed] [Google Scholar]
- 3.Torre LA, Bray F, Siegel RL, Ferlay J, Lortet-Tieulent J, Jemal A. Global cancer statistics, 2012. CA Cancer J Clin. 2015;65:87–108. doi: 10.3322/caac.21262. [DOI] [PubMed] [Google Scholar]
- 4.Zhou M, Wang H, Zeng X, Yin P, Zhu J, Chen W, Li X, Wang L, Wang L, Liu Y, Liu J, Zhang M, Qi J, Yu S, Afshin A, Gakidou E, Glenn S, Krish VS, Miller-Petrie MK, Mountjoy-Venning WC, Mullany EC, Redford SB, Liu H, Naghavi M, Hay SI, Wang L, Murray CJL, Liang X. Mortality, morbidity, and risk factors in China and its provinces, 1990-2017: a systematic analysis for the Global Burden of Disease Study 2017. Lancet. 2019;394:1145–1158. doi: 10.1016/S0140-6736(19)30427-1. [DOI] [PMC free article] [PubMed] [Google Scholar]
- 5.Petrowsky H, Fritsch R, Guckenberger M, De Oliveira ML, Dutkowski P, Clavien PA. Modern therapeutic approaches for the treatment of malignant liver tumours. Nat Rev Gastroenterol Hepatol. 2020;17:755–772. doi: 10.1038/s41575-020-0314-8. [DOI] [PubMed] [Google Scholar]
- 6.Howlader N, Noone AM, Krapcho M. EEER Cancer Statistics Review, 1975-2016. Bethesda, MD, USA: National Cancer Institute; 2018. Available online: https://seer.cancer.gov/csr/1975_2016/(accessed on 21 July 2020) [Google Scholar]
- 7.Hanahan D, Weinberg RA. Hallmarks of cancer: the next generation. Cell. 2011;144:646–674. doi: 10.1016/j.cell.2011.02.013. [DOI] [PubMed] [Google Scholar]
- 8.Vader G, Lens SM. The Aurora kinase family in cell division and cancer. Biochim Biophys Acta. 2008;1786:60–72. doi: 10.1016/j.bbcan.2008.07.003. [DOI] [PubMed] [Google Scholar]
- 9.Collins I, Garrett MD. Targeting the cell division cycle in cancer: CDK and cell cycle checkpoint kinase inhibitors. Curr Opin Pharmacol. 2005;5:366–373. doi: 10.1016/j.coph.2005.04.009. [DOI] [PubMed] [Google Scholar]
- 10.Uchida F, Uzawa K, Kasamatsu A, Takatori H, Sakamoto Y, Ogawara K, Shiiba M, Bukawa H, Tanzawa H. Overexpression of CDCA2 in human squamous cell carcinoma: correlation with prevention of G1 phase arrest and apoptosis. PLoS One. 2013;8:e56381. doi: 10.1371/journal.pone.0056381. [DOI] [PMC free article] [PubMed] [Google Scholar]
- 11.Ryu B, Kim DS, Deluca AM, Alani RM. Comprehensive expression profiling of tumor cell lines identifies molecular signatures of melanoma progression. PLoS One. 2007;2:e594. doi: 10.1371/journal.pone.0000594. [DOI] [PMC free article] [PubMed] [Google Scholar]
- 12.Yoshida K. Cell-cycle-dependent regulation of the human and mouse Tome-1 promoters. FEBS Lett. 2005;579:1488–1492. doi: 10.1016/j.febslet.2005.01.055. [DOI] [PubMed] [Google Scholar]
- 13.Hayashi R, Goto Y, Ikeda R, Yokoyama KK, Yoshida K. CDCA4 is an E2F transcription factor family-induced nuclear factor that regulates E2F-dependent transcriptional activation and cell proliferation. J Biol Chem. 2006;281:35633–35648. doi: 10.1074/jbc.M603800200. [DOI] [PubMed] [Google Scholar]
- 14.Nguyen MH, Koinuma J, Ueda K, Ito T, Tsuchiya E, Nakamura Y, Daigo Y. Phosphorylation and activation of cell division cycle associated 5 by mitogen-activated protein kinase play a crucial role in human lung carcinogenesis. Cancer Res. 2010;70:5337–5347. doi: 10.1158/0008-5472.CAN-09-4372. [DOI] [PubMed] [Google Scholar]
- 15.Jenness C, Giunta S, Müller MM, Kimura H, Muir TW, Funabiki H. HELLS and CDCA7 comprise a bipartite nucleosome remodeling complex defective in ICF syndrome. Proc Natl Acad Sci U S A. 2018;115:E876–E885. doi: 10.1073/pnas.1717509115. [DOI] [PMC free article] [PubMed] [Google Scholar]
- 16.Higuchi T, Uhlmann F. Cell cycle: passenger acrobatics. Nature. 2003;426:780–781. doi: 10.1038/426780a. [DOI] [PubMed] [Google Scholar]
- 17.Chen C, Chen S, Luo M, Yan H, Pang L, Zhu C, Tan W, Zhao Q, Lai J, Li H. The role of the CDCA gene family in ovarian cancer. Ann Transl Med. 2020;8:190. doi: 10.21037/atm.2020.01.99. [DOI] [PMC free article] [PubMed] [Google Scholar]
- 18.Phan NN, Chiao C, Wang CY, Yu HG, Li KL, Huang PL, Chen CF, Lin YC. Distinct expression of CDCA3, CDCA5, and CDCA8 leads to shorter relapse free survival in breast cancer patient. Oncotarget. 2018;9:6977–6992. doi: 10.18632/oncotarget.24059. [DOI] [PMC free article] [PubMed] [Google Scholar]
- 19.Rhodes DR, Yu J, Shanker K, Deshpande N, Varambally R, Ghosh D, Barrette T, Pandey A, Chinnaiyan AM. ONCOMINE: a cancer microarray database and integrated data-mining platform. Neoplasia. 2004;6:1–6. doi: 10.1016/s1476-5586(04)80047-2. [DOI] [PMC free article] [PubMed] [Google Scholar]
- 20.Chandrashekar DS, Bashel B, Balasubramanya SAH, Creighton CJ, Ponce-Rodriguez I, Chakravarthi B, Varambally S. UALCAN: a portal for facilitating tumor subgroup gene expression and survival analyses. Neoplasia. 2017;19:649–658. doi: 10.1016/j.neo.2017.05.002. [DOI] [PMC free article] [PubMed] [Google Scholar]
- 21.Asplund A, Edqvist PH, Schwenk JM, Ponten F. Antibodies for profiling the human proteome-the human protein atlas as a resource for cancer research. Proteomics. 2012;12:2067–2077. doi: 10.1002/pmic.201100504. [DOI] [PubMed] [Google Scholar]
- 22.Nagy A, Lanczky A, Menyhart O, Gyorffy B. Author correction: validation of miRNA prognostic power in hepatocellular carcinoma using expression data of independent datasets. Sci Rep. 2018;8:11515. doi: 10.1038/s41598-018-29514-3. [DOI] [PMC free article] [PubMed] [Google Scholar]
- 23.Tomczak K, Czerwinska P, Wiznerowicz M. The Cancer Genome Atlas (TCGA): an immeasurable source of knowledge. Contemp Oncol (Pozn) 2015;19:A68–77. doi: 10.5114/wo.2014.47136. [DOI] [PMC free article] [PubMed] [Google Scholar]
- 24.Gao J, Aksoy BA, Dogrusoz U, Dresdner G, Gross B, Sumer SO, Sun Y, Jacobsen A, Sinha R, Larsson E, Cerami E, Sander C, Schultz N. Integrative analysis of complex cancer genomics and clinical profiles using the cBioPortal. Sci Signal. 2013;6:pl1. doi: 10.1126/scisignal.2004088. [DOI] [PMC free article] [PubMed] [Google Scholar]
- 25.Subramanian A, Kuehn H, Gould J, Tamayo P, Mesirov JP. GSEA-P: a desktop application for gene set enrichment analysis. Bioinformatics. 2007;23:3251–3253. doi: 10.1093/bioinformatics/btm369. [DOI] [PubMed] [Google Scholar]
- 26.Szklarczyk D, Franceschini A, Wyder S, Forslund K, Heller D, Huerta-Cepas J, Simonovic M, Roth A, Santos A, Tsafou KP, Kuhn M, Bork P, Jensen LJ, von Mering C. STRING v10: protein-protein interaction networks, integrated over the tree of life. Nucleic Acids Res. 2015;43:D447–452. doi: 10.1093/nar/gku1003. [DOI] [PMC free article] [PubMed] [Google Scholar]
- 27.Zhou Y, Zhou B, Pache L, Chang M, Khodabakhshi AH, Tanaseichuk O, Benner C, Chanda SK. Metascape provides a biologist-oriented resource for the analysis of systems-level datasets. Nat Commun. 2019;10:1523. doi: 10.1038/s41467-019-09234-6. [DOI] [PMC free article] [PubMed] [Google Scholar]
- 28.Wurmbach E, Chen YB, Khitrov G, Zhang W, Roayaie S, Schwartz M, Fiel I, Thung S, Mazzaferro V, Bruix J, Bottinger E, Friedman S, Waxman S, Llovet JM. Genome-wide molecular profiles of HCV-induced dysplasia and hepatocellular carcinoma. Hepatology. 2007;45:938–947. doi: 10.1002/hep.21622. [DOI] [PubMed] [Google Scholar]
- 29.Roessler S, Jia HL, Budhu A, Forgues M, Ye QH, Lee JS, Thorgeirsson SS, Sun Z, Tang ZY, Qin LX, Wang XW. A unique metastasis gene signature enables prediction of tumor relapse in early-stage hepatocellular carcinoma patients. Cancer Res. 2010;70:10202–10212. doi: 10.1158/0008-5472.CAN-10-2607. [DOI] [PMC free article] [PubMed] [Google Scholar]
- 30.Chen X, Cheung ST, So S, Fan ST, Barry C, Higgins J, Lai KM, Ji J, Dudoit S, Ng IO, Van De Rijn M, Botstein D, Brown PO. Gene expression patterns in human liver cancers. Mol Biol Cell. 2002;13:1929–1939. doi: 10.1091/mbc.02-02-0023.. [DOI] [PMC free article] [PubMed] [Google Scholar]
- 31.Qian J, Lesage B, Beullens M, Van Eynde A, Bollen M. PP1/Repo-man dephosphorylates mitotic histone H3 at T3 and regulates chromosomal aurora B targeting. Curr Biol. 2011;21:766–773. doi: 10.1016/j.cub.2011.03.047. [DOI] [PubMed] [Google Scholar]
- 32.Vagnarelli P. Repo-man at the intersection of chromatin remodelling, DNA repair, nuclear envelope organization, and cancer progression. Adv Exp Med Biol. 2014;773:401–414. doi: 10.1007/978-1-4899-8032-8_18. [DOI] [PubMed] [Google Scholar]
- 33.Zhang Y, Cheng Y, Zhang Z, Bai Z, Jin H, Guo X, Huang X, Li M, Wang M, Shu XS, Yuan Y, Ying Y. CDCA2 inhibits apoptosis and promotes cell proliferation in prostate cancer and is directly regulated by HIF-1alpha pathway. Front Oncol. 2020;10:725. doi: 10.3389/fonc.2020.00725. [DOI] [PMC free article] [PubMed] [Google Scholar]
- 34.Feng Y, Qian W, Zhang Y, Peng W, Li J, Gu Q, Ji D, Zhang Z, Wang Q, Zhang D, Sun Y. CDCA2 promotes the proliferation of colorectal cancer cells by activating the AKT/CCND1 pathway in vitro and in vivo. BMC Cancer. 2019;19:576. doi: 10.1186/s12885-019-5793-z. [DOI] [PMC free article] [PubMed] [Google Scholar]
- 35.Shi R, Xia W, Zhang C, Dong G, Wu Y, Wang A, Wang X, Jiang F, Sun Q, Sun J, Xu L. CDCA2 promotes lung adenocarcinoma cell proliferation and predicts poor survival in lung adenocarcinoma patients. Oncotarget. 2017;8:19768–19779. doi: 10.18632/oncotarget.15519. [DOI] [PMC free article] [PubMed] [Google Scholar]
- 36.Zhang Y, Yin W, Cao W, Chen P, Bian L, Ni Q. CDCA3 is a potential prognostic marker that promotes cell proliferation in gastric cancer. Oncol Rep. 2019;41:2471–2481. doi: 10.3892/or.2019.7008. [DOI] [PubMed] [Google Scholar]
- 37.Guan L, Luo Q, Liang N, Liu H. A prognostic prediction system for hepatocellular carcinoma based on gene co-expression network. Exp Ther Med. 2019;17:4506–4516. doi: 10.3892/etm.2019.7494. [DOI] [PMC free article] [PubMed] [Google Scholar]
- 38.Hayashi R, Goto Y, Ikeda R, Yokoyama KK, Yoshida K. CDCA4 is an E2F transcription factor family-induced nuclear factor that regulates E2F-dependent transcriptional activation and cell proliferation. J Biol Chem. 2006;281:35633–35648. doi: 10.1074/jbc.M603800200. [DOI] [PubMed] [Google Scholar]
- 39.Xu Y, Wu X, Li F, Huang D, Zhu W. CDCA4, a downstream gene of the Nrf2 signaling pathway, regulates cell proliferation and apoptosis in the MCF7/ADM human breast cancer cell line. Mol Med Rep. 2018;17:1507–1512. doi: 10.3892/mmr.2017.8095. [DOI] [PMC free article] [PubMed] [Google Scholar]
- 40.Gu Y, Li J, Guo D, Chen B, Liu P, Xiao Y, Yang K, Liu Z, Liu Q. Identification of 13 key genes correlated with progression and prognosis in hepatocellular carcinoma by weighted gene co-expression network analysis. Front Genet. 2020;11:153. doi: 10.3389/fgene.2020.00153. [DOI] [PMC free article] [PubMed] [Google Scholar]
- 41.Shen A, Liu L, Chen H, Qi F, Huang Y, Lin J, Sferra TJ, Sankararaman S, Wei L, Chu J, Chen Y, Peng J. Cell division cycle associated 5 promotes colorectal cancer progression by activating the ERK signaling pathway. Oncogenesis. 2019;8:19. doi: 10.1038/s41389-019-0123-5. [DOI] [PMC free article] [PubMed] [Google Scholar]
- 42.Chen H, Chen J, Zhao L, Song W, Xuan Z, Chen J, Li Z, Song G, Hong L, Song P, Zheng S. CDCA5, transcribed by E2F1, promotes oncogenesis by enhancing cell proliferation and inhibiting apoptosis via the AKT pathway in hepatocellular carcinoma. J Cancer. 2019;10:1846–1854. doi: 10.7150/jca.28809. [DOI] [PMC free article] [PubMed] [Google Scholar]
- 43.Tian Y, Wu J, Chagas C, Du Y, Lyu H, He Y, Qi S, Peng Y, Hu J. CDCA5 overexpression is an indicator of poor prognosis in patients with hepatocellular carcinoma (HCC) BMC Cancer. 2018;18:1187. doi: 10.1186/s12885-018-5072-4. [DOI] [PMC free article] [PubMed] [Google Scholar]
- 44.Li S, Huang J, Qin M, Zhang J, Liao C. High expression of CDCA7 predicts tumor progression and poor prognosis in human colorectal cancer. Mol Med Rep. 2020;22:57–66. doi: 10.3892/mmr.2020.11089. [DOI] [PMC free article] [PubMed] [Google Scholar]
- 45.Wang H, Ye L, Xing Z, Li H, Lv T, Liu H, Zhang F, Song Y. CDCA7 promotes lung adenocarcinoma proliferation via regulating the cell cycle. Pathol Res Pract. 2019;215:152559. doi: 10.1016/j.prp.2019.152559. [DOI] [PubMed] [Google Scholar]
- 46.Ye L, Li F, Song Y, Yu D, Xiong Z, Li Y, Shi T, Yuan Z, Lin C, Wu X, Ren L, Li X, Song L. Overexpression of CDCA7 predicts poor prognosis and induces EZH2-mediated progression of triple-negative breast cancer. Int J Cancer. 2018;143:2602–2613. doi: 10.1002/ijc.31766. [DOI] [PubMed] [Google Scholar]
- 47.Dai C, Miao CX, Xu XM, Liu LJ, Gu YF, Zhou D, Chen LS, Lin G, Lu GX. Transcriptional activation of human CDCA8 gene regulated by transcription factor NF-Y in embryonic stem cells and cancer cells. J Biol Chem. 2015;290:22423–22434. doi: 10.1074/jbc.M115.642710. [DOI] [PMC free article] [PubMed] [Google Scholar]
- 48.Chang JL, Chen TH, Wang CF, Chiang YH, Huang YL, Wong FH, Chou CK, Chen CM. Borealin/Dasra B is a cell cycle-regulated chromosomal passenger protein and its nuclear accumulation is linked to poor prognosis for human gastric cancer. Exp Cell Res. 2006;312:962–973. doi: 10.1016/j.yexcr.2005.12.015. [DOI] [PubMed] [Google Scholar]
- 49.Gao X, Wen X, He H, Zheng L, Yang Y, Yang J, Liu H, Zhou X, Yang C, Chen Y, Chen M, Zhang S. Knockdown of CDCA8 inhibits the proliferation and enhances the apoptosis of bladder cancer cells. PeerJ. 2020;8:e9078. doi: 10.7717/peerj.9078. [DOI] [PMC free article] [PubMed] [Google Scholar]
- 50.Bu Y, Shi L, Yu D, Liang Z, Li W. CDCA8 is a key mediator of estrogen-stimulated cell proliferation in breast cancer cells. Gene. 2019;703:1–6. doi: 10.1016/j.gene.2019.04.006. [DOI] [PubMed] [Google Scholar]
- 51.Qi J, Zhou J, Tang XQ, Wang Y. Gene biomarkers derived from clinical data of hepatocellular carcinoma. Interdiscip Sci. 2020;12:226–236. doi: 10.1007/s12539-020-00366-8. [DOI] [PubMed] [Google Scholar]
Associated Data
This section collects any data citations, data availability statements, or supplementary materials included in this article.