

Abstract
The molecular repertoire of the “Ca2+-signaling toolkit” supports the specific kinetic requirements of Ca2+-dependent processes in different neuronal types. A well-known example is the unique expression pattern of calcium-binding proteins, such as parvalbumin, calbindin, and calretinin. These cytosolic Ca2+-buffers control presynaptic and somatodendritic processes in a cell-type-specific manner and have been used as neurochemical markers of GABAergic interneuron types for decades. Surprisingly, to date no typifying calcium-binding proteins have been found in CB1 cannabinoid receptor/cholecystokinin (CB1/CCK)-positive interneurons that represent a large population of GABAergic cells in cortical circuits. Because CB1/CCK-positive interneurons display disparate presynaptic and somatodendritic Ca2+-transients compared with other interneurons, we tested the hypothesis that they express alternative calcium-binding proteins. By in silico data mining in mouse single-cell RNA-seq databases, we identified high expression of Necab1 and Necab2 genes encoding N-terminal EF-hand calcium-binding proteins 1 and 2, respectively, in CB1/CCK-positive interneurons. Fluorescent in situ hybridization and immunostaining revealed cell-type-specific distribution of NECAB1 and NECAB2 throughout the isocortex, hippocampal formation, and basolateral amygdala complex. Combination of patch-clamp electrophysiology, confocal, and STORM super-resolution microscopy uncovered subcellular nanoscale differences indicating functional division of labor between the two calcium-binding proteins. These findings highlight NECAB1 and NECAB2 as predominant calcium-binding proteins in CB1/CCK-positive interneurons.
Keywords: basolateral amygdala, Ca2+-buffering, cerebral cortex, hippocampus, inhibitory cell
Introduction
Ionized calcium (Ca2+) is the most versatile intracellular messenger. To subserve pleiotropic physiological functions, Ca2+-signaling dynamics must be tightly controlled in a spatially and temporally restricted manner (Berridge et al. 2000). A myriad of proteins, the so-called “Ca2+-signaling toolkit,” were evolved to mediate and regulate Ca2+-entry, cytosolic free Ca2+-levels, and Ca2+-extrusion/uptake. A particularly large protein family, the EF-hand Ca2+-binding protein superfamily consists of several hundred proteins that play various physiological roles as Ca2+-sensors and/or Ca2+-buffers (Kawasaki and Kretsinger 2017; Schwaller 2020). Notably, each of the 249 EF-hand Ca2+-binding proteins encoded in the mouse genome show characteristic distribution patterns in the brain (Girard et al. 2015). The molecular and anatomical diversity together with the highly different Ca2+-binding kinetics of these proteins indicate that cell-type-specific regulation of the spatio-temporal properties of Ca2+-signaling is essential for specific computational functions in brain circuits. However, the cellular complexity in the brain represents a major challenge and hence our knowledge about how the specific molecular components of the “Ca2+-signaling toolkit” determine distinct physiological functions has remained rather limited in most cell types.
The cell-type-specific expression of cytosolic Ca2+-buffers belonging to the EF-hand superfamily, such as parvalbumin, calbindin, and calretinin has been widely demonstrated in cortical circuits. Visualization of the calcium-binding proteins by immunostaining paved the way for the characterization of the synaptic afferents and postsynaptic targets of major GABAergic interneuron types (Kosaka et al. 1987; Hendry et al. 1989; Gulyás and Freund 1996; Gulyás et al. 1996, 1999). Moreover, these neurochemical markers also turned out to be instrumental later to study the pathological reorganization of the synaptic inputs and outputs of GABAergic cell types in brain disorders, such as epilepsy and schizophrenia (Wittner et al. 2001, 2002; Tóth et al. 2010; Chung et al. 2016). In addition, electrophysiological and calcium imaging experiments demonstrated that these calcium-binding proteins play important physiological roles in establishing interneuron-specific temporal dynamics and spatial extent of axonal and somatodendritic Ca2+-signaling. For example, presynaptic parvalbumin concentration calibrates nanodomain coupling between calcium influx and neurotransmitter release (Eggermann and Jonas 2012). Moreover, the Ca2+-buffering capacity of parvalbumin sharpens the time course of local Ca2+-signals around postsynaptic microdomains during trains of synaptic inputs, and also extends the temporal window for synaptic integration by prolonging the decay of somatodendritic Ca2+-transients in cortical and hippocampal fast-spiking basket cells (Goldberg et al. 2003; Aponte et al. 2008). These subcellular compartment-specific functions of parvalbumin support the temporal precision of rhythmic perisomatic inhibition mediated by the fast-spiking basket cells targeting the somatic region of principal cells (Freund and Katona 2007) that is essential for the generation of synchronized network activity in cortical circuits (Bartos et al. 2007; Cardin et al. 2009; Sohal et al. 2009; Gulyás et al. 2010; Kvitsiani et al. 2013).
In contrast to the well-described physiological functions of parvalbumin-mediated Ca2+-buffering and parvalbumin-containing interneurons, how the kinetic properties of Ca2+-signaling determine the activity and functional importance of another major cortical interneuron type, the so-called CB1/CCK-positive interneuron has remained largely elusive (Freund and Katona 2007). Interestingly, these interneurons outnumber parvalbumin-positive cells in several cortical areas (Whissell et al. 2015; Nguyen et al. 2020) and form ~40% of cortical GABAergic axon terminals including also those that target the perisomatic domain of pyramidal cells (Szabó, Papp, et al. 2014b; Takács et al. 2015). Moreover, regular-spiking CB1/CCK-positive interneurons exhibit distinct presynaptic Ca2+-dynamics and dendritic Ca2+-buffering capacity compared with fast-spiking parvalbumin-containing interneurons (Rózsa et al. 2004; Hefft and Jonas 2005; Aponte et al. 2008; Kisfali et al. 2013; Lőrincz et al. 2016). Thus, it is conceivable to hypothesize that these inhibitory cells are equipped with unique molecular components of the “Ca2+-signaling toolkit.” However, a representative EF-hand calcium-binding protein that may shape cell-type-specific Ca2+-signaling dynamics in CB1/CCK-positive interneurons has not been identified yet.
To address this issue, we carried out a targeted in silico search among all Gene Ontology (GO)-predicted potential calcium-binding proteins in the mouse genome. Our data mining in CB1/CCK-positive interneuron expression datasets identified Necab1 and Necab2 genes encoding N-terminal EF-hand calcium-binding proteins 1 and 2, respectively, as candidates. Subsequent RNAscope-based fluorescent in situ hybridization (ISH) and immunostaining determined NECAB1 and NECAB2 as ubiquitous calcium-binding proteins in all CB1/CCK-positive interneurons throughout the isocortex, the hippocampal formation and the basolateral amygdala (BLA) complex. Furthermore, stochastic optical reconstruction microscopy (STORM) super-resolution imaging in biocytin-filled cells showed a striking presynaptic accumulation of NECAB2 that contrasted the preferential dendritic distribution of NECAB1. Our findings describe NECAB1 and NECAB2 as two major EF-hand calcium-binding proteins in CB1/CCK-positive interneurons providing insights into the molecular components that contribute to subcellular compartment- and interneuron-type-specific Ca2+-signaling mechanisms.
Materials and Methods
In Silico Analysis
A public mRNA expression database obtained from single-cell RNA-sequencing (RNA-seq) performed at the Karolinska Institute (Zeisel et al. 2015) was used to search for the calcium-binding proteins that are highly expressed by the CB1/CCK-positive interneurons in the hippocampal CA1 region and in the somatosensory cortex. Interneurons were first selected from the database using their previous sample annotation as GABAergic cells (Zeisel et al. 2015). Because a few copies of mRNA may occasionally appear for each gene when measured by RNA-seq approaches, only those cells were considered in the next filtering step that had Cnr1 mRNA (encoding the CB1 cannabinoid receptor protein) levels exceeding the 10% threshold of the highest Cnr1-expressing cell per brain region to avoid false positive cells in the sample. A Grubb’s test was also performed (iteration = 1, α = 0.05) for outlier detection. In the filtered cell population representing the CB1/CCK-positive interneurons, the expression levels of all genes (n = 660) that may have potential calcium-binding functions according to their GO term (Ashburner et al. 2000; Carbon et al. 2009, 2017) have been measured (database accessed: 23 February 2017). To avoid potential biases due to differences in cell-specific mRNA harvesting efficiency, the mRNA copy number value for individual genes in a given cell was normalized to the mean of the total mRNA copy number per cell in the dataset. Spearman’s rank correlation coefficients of the mRNA levels of “Necab” genes and other selected genes were calculated on the total pool of hippocampal GABAergic interneurons (n = 126) found in the database. The following annotations in Zeisel et al. (2015) were used for comparison of Cnr1 mRNA levels (IN: “Int5” and “Int6” subtypes; PC: “CA1Pyr1”; “CA1Pyr2” subtypes from the hippocampus and “S1Pyr DL/L23/L4/L5/L5a/L6/L6b” subtypes from the somatosensory cortex).
Preparation of Tissue Sections
All animal experiments were approved by the Hungarian Committee of the Scientific Ethics of Animal Research (license number: PE/EA/354-5/2018) and were performed according to the Hungarian Act of Animal Care and Experimentation (1998, XXVIII, Section 243/1998, renewed in 40/2013), which are in accordance with the European Communities Council Directive of 24 November 1986 (86/609/EEC; Section 243/1998). Mice were kept under approved laboratory conditions and all efforts were made to minimize pain and to reduce the number of animals used.
Perfusion
Male C57BL/6 mice (postnatal day 50–62, n = 6) were used for fixation via transcardial perfusion. After brief isoflurane (Aesica Queenborough Ltd, B506) anesthesia, Avertin (2,2,2, −tribromoethanol, Sigma, T48402; 2-methyl-2-butanol, Sigma, 152 463 in water; 0.4–0.8 mL; 1.25%) was injected intraperitoneally to induce deep anesthesia. Mice were perfused transcardially with 0.9% saline (Molar Chemicals, 07220-101-190) for 2 min, following with 4% paraformaldehyde (PFA, TAAB, P001) dissolved in 0.1 M phosphate buffer (PB, pH = 7.4 containing Na2HPO4, Sigma, 71 500 and NaH2PO4, Sigma, 71 500) for 20 min by using approximately 5 mL/min pump speed. After perfusion, the brains were removed from the skull and postfixed for 2 h or overnight (for GAD67 and PV-immunostaining) in 4% PFA, then 50 μm coronal sections were cut in PB using a Leica VT-1200S (Nussloch, Germany) vibratome.
Biocytin-Filling of Identified Interneurons
In order to visualize single CB1/CCK-positive interneurons, adult male C57BL/6 mice (postnatal day 28–35, n = 12) were decapitated during isoflurane anesthesia, then brains were quickly removed from the skull and 300 μm coronal sections were cut in ice-cold sucrose containing artificial cerebrospinal fluid (ACSF): 75 mM NaCl, 75 mM sucrose (Sigma, S7903), 2.5 mM KCl (Sigma, P3911), 25 mM glucose (Sigma, G8270), 1.25 mM NaH2PO4, 4 mM MgCl2 (Sigma, M2670), 0.5 mM CaCl2 (Sigma, 223 506), and 24 mM NaHCO3 (Sigma, S5761) using a Leica VT-1200S vibratome. Slices were pre-incubated at 34 °C in sucrose-containing ACSF for 1 h before placed to a submerged recording chamber containing standard ACSF (2.5 mM KCl, 10 mM glucose, 126 mM NaCl, 1.25 mM NaH2PO4, 2 mM MgCl2, 2 mM CaCl2, and 26 mM NaHCO3). During both preincubation and recording, ACSF solutions were oxygenated with 95% O2 and 5% CO2. Electrophysiological recordings were performed at 33 °C, and slices were visualized by a Nikon Eclipse FN1 microscope with infrared differential interference contrast (DIC) optics. Whole-cell patch-clamp recordings were obtained using borosilicate glass pipettes (3–4 MΩ) filled with an intracellular solution containing 126 mM K-gluconate (Sigma, G4500), 4 mM KCl, 10 mM HEPES (Sigma, H4034), 4 mM MgATP (Sigma, A9187), 0.3 mM Na2GTP (Sigma, 51 120), 10 mM PO-creatine (Sigma, P7936), and 0.2% biocytin (Sigma, B4261); pH 7.2, 270–290 mOsm. Interneurons with a large cell body and 2–3 major dendrites were selected for patch-clamp recording in the stratum radiatum of the CA1 subfield using the DIC image. All selected cells displayed an accommodating, regular firing pattern and multipolar morphology implicating a CB1/CCK-positive interneuron phenotype (Lee et al. 2015). Recordings were performed using MultiClamp700B amplifiers (Molecular Devices, San Jose, CA, USA). Signals were filtered at 3 kHz using a Bessel filter and digitized at 10 kHz with a Digidata analog-digital interface (Molecular Devices). Recorded traces were analyzed using Clampfit 10 software (Molecular Devices). After ~30 min of stable recording, slices were fixed immediately in 4% PFA in PB at 4 °C for 24 h.
Morphological Analysis of Biocytin-Filled Interneurons
After thorough washing in PB and permeabilization of cell membranes with 30 min incubation in a 0.5% Triton X-100 (Sigma, T98787-50ML) PB solution, single-cell biocytin staining was developed with Alexa-488-conjugated streptavidin (50 μL/mL, Jackson, 016-540-08) treatment of the 300 μm-thick electrophysiological slices. After several washing steps in PB, the slices were mounted onto glass slides in Vectashield (Vector Laboratories, H-1000-10), coverslipped and sealed with nail polish.
To define the specific interneuron type based on morphological criteria, confocal microscopy was used. Confocal z-stacks (2048 × 2048 × 150 voxels, voxel size: 0.03 × 0.03 × 1 μm) containing the filled interneuron in the center were acquired with a confocal microscope (NIKON-C2) by using 488 nm illumination. Subsequently, maximal intensity projections (MIPs) were generated to provide a more complete morphological image of the axonal arbor of the respective cell. To distinguish perisomatically targeting and dendritically targeting CB1/CCK-positive interneurons, the Bouton distribution index (BDI) was calculated as described earlier (Dudok et al. 2015). Briefly, cells with a BDI > 1 value were categorized as perisomatically targeting cells (the axon arbor was mainly restricted to the stratum pyramidale of the hippocampal CA1 region), interneurons with a BDI < 0.5 were identified as dendritically targeting interneurons (the axon arbor was mainly distributed in both the strata oriens and radiatum). A few morphologically ambiguous cells with 0.5 < BDI < 1 values were omitted from further analysis. After cell type identification, the 300 μm-thick electrophysiological slices were removed from the glass slides, washed extensively in PB and embedded in 2% agarose (Sigma, A9539). Resectioning to 10 or 20 μm thickness to aid antibody penetration in subsequent immunostaining was done in PB with a Leica VT-1200S vibratome.
Multiplex Fluorescent In Situ Hybridization
RNAscope multicolor ISH was utilized, because this approach enables simultaneous signal amplification and background suppression, and it is capable for highly sensitive single-molecule visualization of mRNA molecules while preserving tissue morphology (Wang et al. 2012). Adult C57BL/6 mice (postnatal day 60–70, n = 3) were decapitated under Avertin anesthesia. Mouse brains were rapidly dissected over ice and frozen in isopentane (Sigma, 277 258) on dry ice for 20 s. After embedding in optimal cutting temperature (OCT, Tissue-Tek, 4583) gel, a cryostat (Thermo Scientific, Microm GmbH, HM550) was used to cut 16 μm thick coronal sections at −20 °C. Sections were fixed onto Superfrost Ultra Plus slides (ThermoFisher, J488AMNZ) with 10% PFA in PB and a series of dehydration steps was performed by using 50%, 70%, and kept in 100% ethanol overnight (Molar Chemicals, 02910-101-340). Next day, the sections were dried, and a hydrophobic barrier was drawn around the slices with a hydrophobic pen (ImmEdger Hydrophobic Barrier, Vector Laboratories) for isolation. The sections were pretreated according to the RNAscope kit protocol to permeabilize the cells and unmask the target RNA. Then, the samples were incubated in a HybEZ hybridization oven at 40 °C with 150 μL of specific RNAscope probes for 2 h (Table 1). Washing was performed by immersing the samples in 1× wash buffer. A volume of 150 μL of the Detection Reagent (AMP1, AMP2, AMP3, AMP4) was used to intensify the signal. To mark the cell nuclei, a 30 min-long treatment with 4′,6-diamidino-2-phenylindole solution (DAPI; 1:1000; Calbiochem, 508 741) dissolved in 0.05 M Tris-buffered Saline (TBS, pH = 7.4, Trizma hydrochloride, Sigma, T3253, Trizma base, Sigma, T1503 and NaCl) was performed. Samples were covered in Hardset Vectashield antifade medium (Vector Laboratories, H-1400-10) and sealed with nail polish.
Table 1.
RNAscope probes used in fluorescent ISH
| Target | Cat. No. | Fluorescent amplification |
|---|---|---|
| Necab1 | 428 541 | Alexa 488 |
| Necab2 | 467 381-C3 | Atto 647 |
| Cnr1 | 420 721-C2 | Atto 550 |
Note: Referred in Materials and Methods/Multiplex Fluorescent In Situ Hybridization section.
In some experiments, RNAscope fluorescent ISH was combined with fluorescent immunostaining. After finishing the RNAscope assay, the sections were incubated in 4% PFA for 10 min, then washed in 0.05 M TBS supplemented with 0.1% Triton X-100. Blocking the nonspecific binding sites was done with 5% Normal Donkey Serum (NDS, Sigma, D9663) in TBS. Sections were next incubated in the respective primary antibody (Table 2) and DAPI (1:1000 concentration) containing TBS-solution at 4 °C overnight. The two primary antibodies against NECAB1 and NECAB2 have also been validated by antigen adsorption tests (Zhang et al. 2014) and in case of the antibody against NECAB2 in NECAB2-knockout mice (Zhang et al. 2018). On the next day after TBS washing steps, a 1 h-long incubation followed in a TBS-solution containing the respective fluorescent secondary antibody (Table 2). After washing steps, the sections were mounted in Hardset Vectashield antifade medium and sealed with nail polish.
Table 2.
RNAscope probes and antibodies used for combined ISH and immunostaining
| NECAB1 | NECAB2 | |
|---|---|---|
| RNAscope probes | Necab1-428 541 | Necab2-467 381-C3 |
| Primary antibodies | Rabbit anti-NECAB1 1:500 concentration (Atlas Antibodies, HPA023629) |
Rabbit anti-NECAB2 1:500 concentration (Atlas Antibodies, HPA013998) |
| Fluorescent amplification of the RNAscope channel | Alexa 488 | Atto 647 |
| Secondary antibody | Donkey anti-Rabbit Alexa 594 concentration 1:400 (Jackson, 711-585-152) |
Donkey anti-Rabbit Alexa 488 concentration 1:400 (Jackson, 711-545-152) |
Note: Referred in Materials and Methods/Multiplex Fluorescent In Situ Hybridization section.
Immunostaining
Fluorescent immunolabeling was used to visualize protein distribution in brain section as described (Barna et al. 2016). Briefly, all sections were immunostained in a free-floating manner in 12- or 24-well tissue culture plates (Greiner Bio-One CELLSTAR 12- or 24-well suspension culture plate, 665 102, 662 102) in 500–1000 μL volume on an orbital shaker (Biosan OS-10). Wells were preblocked with 1% Bovine Serum Albumin (BSA, Sigma-Aldrich, A2153) diluted in TBS to prevent the sections from sticking to the walls. After extensive washing in PB and TBS, sections were treated with a solution containing 5% NDS and 0.1–0.3% Triton X-100 in TBS for 45 min–1 h for blocking nonspecific binding sites and for enhancing antibody penetration, respectively.
Sections were then incubated with the primary antibodies (Table 3) in TBS-solution at room temperature or in 0.1 M PB buffer at 4 °C overnight. Next day, the sections were thoroughly washed and incubated with fluorescently-labeled secondary antibodies (Table 3) in TBS-solution for 4 h. After antibody incubation, the sections were washed in TBS and PB. Finally, the sections were either postfixed for 10 min in 4% PFA and mounted and dried on coverslips for subsequent super-resolution imaging or were mounted in Vectashield supplemented with DAPI (Vector Laboratories, H-1200-10), covered by a coverslip and sealed with nail polish for subsequent confocal microscopy. In case of GAD67- and PV-immunostaining, all incubation steps were performed in 0.1 M PB and DAPI (Sigma, 5 087 410 001) was applied together with the secondary antibody. Sections were mounted in Hardset Vectashield antifade medium (Vector Laboratories, H-1400-10).
Table 3.
Primary and secondary antibodies used in immunostaining
| Antibody type | Target | Species | Concentration | Source |
|---|---|---|---|---|
| Primary antibodies | Anti-CB1 | Guinea pig | 1:2000 | Fukudome et al. (2004) |
| Anti-NECAB1 | Rabbit | 1:300 | Atlas Antibodies, HPA023629 | |
| Anti-NECAB2 | Rabbit | 1:500 | Atlas Antibodies, HPA013998 | |
| Anti-CCK | Mouse | 1:3000 | CURE, 39161 | |
| Anti-GAD67 | Mouse | 1:2000 | Merck, MAB5406 | |
| Anti-PV | Mouse | 1:5000 | Swant, 235 | |
| Secondary antibodies | Anti-guinea pig, Alexa 488-conjugated | Donkey | 1:400 | Jackson, 706-545-148 |
| Anti-rabbit Alexa 594-conjugated | Donkey | 1:400 | Jackson, 711-585-152 | |
| Anti-mouse Alexa 488-conjugated | Donkey | 1:400 | Jackson, 715-545-150 | |
| Anti-guinea pig Alexa-594-conjugated | Donkey | 1:400 | Jackson, 706-585-148 | |
| Anti-rabbit Alexa 647-conjugated | Donkey | 1:400 | Jackson, 711-605-152 | |
| Anti-rabbit Alexa 488-conjugated | Donkey | 1:400 | Jackson, 711-545-152 | |
| Anti-mouse Alexa 594-conjugated | Donkey | 1:400 | Jackson, 715-585-150 | |
| Anti-mouse Alexa 647-conjugated | Donkey | 1:400 | Jackson, 715-605-150 |
Note: Referred in Materials and Methods/Immunostaining section.
Confocal Image Acquisition and Analysis of Fluorescent In Situ Hybridization
A NIKON-A1R confocal microscope equipped with a 60× oil-immersion objective was used to obtain high-resolution (500 nm/pixel) images of fluorescent ISH in the hippocampus, the somatosensory cortex, and the BLA complex. Freehand cellular regions of interests (ROIs) were selected based on the overlaid Cnr1 RNAscope and DAPI signals with the NIS Elements AR analysis software. ROI signal intensities were normalized to the background mean confocal signal intensities to obtain relative enrichment values for each interneuron. Cells were then categorized into “strong-CB1” and “weak-CB1” groups based on this enrichment value and topological information. The “strong-CB1” cells were considered as the putative GABAergic interneurons, whereas the “weak-CB1” cells were considered as the putative principal cells in all three regions (enrichment value cutoffs based on distribution of enrichment values per brain region: HC-CA1: 2, HC-CA3: 4.5, HC-DG: 3, SS-CTX: 3, BLA: 5) based on prior findings describing telencephalic Cnr1 mRNA expression levels in the different cell types (Marsicano and Lutz 1999). The Necab1 and Necab2 enrichment values were also obtained from the selected individual cells and plotted. Finally, each cell was categorized based on its Necab1 and Necab2 content to establish the ratio of “strong-CB1”- and “weak-CB1”-expressing cells that are also positive for Necab1 and/or Necab2.
Confocal Image Acquisition and Analysis of Fluorescent Immunostaining
A NIKON A1R microscope was used with 20× and 60× objectives to obtain high-resolution z-stacks of fluorescent immunostainings in the hippocampus, the somatosensory cortex, and the BLA complex. Cell bodies immunostained for CB1 receptors were selected manually and their NECAB1- or NECAB2-immunopositivity was evaluated. In case of the biocytin-filled hippocampal interneurons, separate anatomical sections were obtained during the reslicing of the electrophysiological slice preparation and used either for CB1- or NECAB1- or NECAB2-immunostaining. The presence of presynaptic CB1 receptors was verified in the axon terminals in case of all biocytin-filled regular-spiking multipolar interneurons. NECAB1- and NECAB2-immunostaining were also present in all identified interneurons and their levels were evaluated in the somatic, the dendritic, and the axonal compartments.
Correlated Stochastic Optical Reconstruction Microscopy and Confocal Microscopy
In order to perform STORM super-resolution imaging on biocytin-filled cells, the electrophysiological slices were resectioned into 10 μm-thick sections and used for subsequent immunostaining as described earlier (Barna et al. 2016). The sections were covered with 25 μL of freshly prepared Smart Buffer (Abbelight) imaging medium, then sealed with nail polish. Image acquisition was conducted by a NIKON Ti-E inverted microscope equipped with a NIKON N-STORM system, C2 scanner head and an Andor iXon Ultra 897 EMCCD camera. Images were obtained with a CFI Apo TIRF 100× objective (NA 1.49). Imaging parameters were controlled by a NIKON NIS-Elements AR software equipped with N-STORM module. STORM image acquisition was done by a 300 mW laser (VFL-P-300-647, MPB Communications, Montreal, Canada), activation was triggered with a Melles Griot 56RCS/S2780 diode laser. Dendrites and axon terminals belonging to the biocytin-filled interneurons were identified by live 488 nm illumination, then confocal z-stacks (512 × 512 × 15 voxels, 80 × 80 × 150 nm voxel size) were obtained with 488 and 647 nm illumination from randomly selected ROIs of the subcellular compartments. For super-resolution imaging of NECAB1- or NECAB2-immunostaining, the directSTORM approach was used (Heilemann et al. 2008), and the images were captured during 5000 cycles with 30 ms exposition time with a STORM filter cube. Oblique illumination was obtained using a total internal reflexion fluorescence (TIRF) illuminator. The 3D STORM image acquisition was obtained with a cylindrical lens (Huang et al. 2008). Imaging stability was provided by using a perfect focus system (PFS).
Confocal z-stacks were deconvolved with the Huygens Professional 4.2.1 software (SVI, Netherlands) using Classic Maximum Likelihood Estimation algorithm and a theoretical point spread function (PSF) with 100 iterations. Image analysis and ROI selection were conducted on the MIP of the central three images of the confocal stack. STORM coordinates were obtained from STORM images with NIS-Elements AR software N-STORM module. The software uses the 3D-DAOSTORM algorithm for peak detection (Holden et al. 2011; Babcock et al. 2012).
Correlated confocal and STORM super-resolution image analysis was carried out by using the VividSTORM software (Barna et al. 2016). First, STORM coordinates were manually aligned with the confocal image of the NECAB1 or NECAB2 channel, then the ROIs were delineated in an unbiased manner with a Morphological Active Contour Without Edges Algorithm (Marquez-Neila et al. 2014). After a ROI filter was applied to the coordinates, STORM densities were calculated based on the number of localization points (NLP) within the ROI and the size of the ROI. STORM NLP was normalized based on immunostaining density per STORM image to correct for STORM imaging variability. A custom script written in R was used to generate the Ripley’s L functions. The Lest function of the spatstat library (Baddeley and Turner 2005) was used with isotropic border correction and maximal radius of 1000. The previously selected ROIs of NECAB1-dendrites/NECAB1-boutons/NECAB2-dendrites/NECAB2-boutons were placed at distances exceeding their maximal radius, then the Lest function was applied on them.
Statistical Analysis and Figure Preparation
Statistical analysis was performed with the STATISTICA 13.4 software (TIBCO Data Science, Palo Alto, CA). Sample sizes were estimated based on previous experience and are similar to those generally applied in the field. To determine the appropriate statistical method, data were tested for normality using Kolmogorov–Smirnov test, and differences between animals within a subcellular compartment as group was established by using Kruskal–Wallis test. Differences between the groups were determined using Mann–Whitney U-test. Data met the necessary criteria for all analysis used. Figure preparation was done with the Photoshop CS5 (Adobe Systems, San Jose, CA) program. Confocal images of multiple samples presented in the same figure were modified identically in every step to maintain original differences.
Results
In Silico Single-Cell RNA-seq Analysis Pinpoints Necab1 and Necab2 as Candidate Genes in CB1/CCK-Positive Interneurons
The recent advent of various single-cell RNA-sequencing technologies exposed unprecedented details about the transcriptomic profiles of individual GABAergic interneurons in cortical circuits (Zeisel et al. 2015, 2018; Fuzik et al. 2016; Habib et al. 2016; Tasic et al. 2016; Paul et al. 2017; Harris et al. 2018; Hodge et al. 2019). While these studies primarily focused on cataloging the cellular taxonomy of the hippocampus and the cerebral cortex, emerging expression data also provide an opportunity for hypothesis-driven data mining to identify target genes in specific cell types by using publicly available databases. In order to detect candidate calcium-binding proteins that may shape specific Ca2+-signaling dynamics and serve as neurochemical markers of CB1/CCK-positive interneurons, we first exploited the original datasets provided by the Karolinska Institute that were obtained from cells in the CA1 subfield of the hippocampus and in the somatosensory cortex of mice (Zeisel et al. 2015). We filtered the datasets including only those GABAergic cells that expressed high levels of Cnr1 mRNA (for details see Materials and Methods), the gene encoding the CB1 cannabinoid receptor, a well-established marker of these interneurons. Importantly, Cnr1 expression and CB1 receptor proteins were previously found to be absent in other major interneuron classes such as the parvalbumin-positive cells in cortical microcircuits (Katona et al. 1999; Marsicano and Lutz 1999; Tsou et al. 1999; Bodor et al. 2005).
As a next step, we collected all potential genes that were annotated with the term “calcium-binding” in the GO knowledgebase (Ashburner et al. 2000; Carbon et al. 2009, 2017). This search revealed 660 candidate genes whose expression levels were measured in the high Cnr1 expression-selected cell pools obtained from the cortical and hippocampal samples. To test the reliability of the in silico approach, we verified that the three members of the calmodulin calcium-binding family (Calm1, Calm2, Calm3), which are ubiquitously expressed in all eukaryotic cells could be readily detected in both single-cell-based mRNA datasets (Supplementary Fig. 1a,b).
Subsequently, we analyzed the gene expression levels of the four most common calcium-binding proteins (Calb1/calbindin; Calb2/calretinin; Pvalb/parvalbumin; Scgn/secretagogin). These EF-hand calcium-binding proteins display cell-type-specific expression in the brain and have Ca2+-buffering functions (Alpár et al. 2012; Schmidt 2012; Schwaller 2014, 2020). In agreement with prior anatomical studies (Marsicano and Lutz 1999; Bodor et al. 2005), Calb1 expression was noticed in a subpopulation of high Cnr1 expression-selected cell pools in the hippocampus and in a few cells in the somatosensory cortex (Fig. 1a,b). In contrast, Calb2 expression was rarely observed in the CA1 sample, but was occasionally found in cells derived from the somatosensory cortex (Fig. 1a,b), as described earlier (Marsicano and Lutz 1999). Neither Pvalb nor Scgn expression reached considerable mRNA levels in the high Cnr1 expression-selected cell pools (Fig. 1a,b). These measurements corroborated that the in silico data mining approach is able to replicate previous positive and negative anatomical findings and highlighted that none of the well-studied EF-hand calcium-binding proteins are ubiquitously expressed in cortical CB1/CCK-interneurons.
Figure 2.
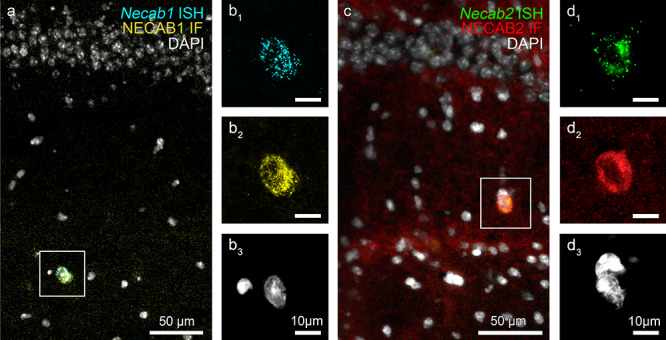
Colocalization of Necab1/2 RNAscope ISH signals and NECAB1/2 immunofluorescence staining (IF) pattern in hippocampal interneurons. (a–d) Combined ISH and IF visualizes Necab1/2 mRNA and NECAB1/2 protein distributions, respectively, and indicate the specificity of riboprobes and antibodies. Nuclei are stained with DAPI (white). (a) Low magnification confocal image shows a Necab1 mRNA-expressing (cyan) and NECAB1 protein-containing interneuron (yellow) in the stratum radiatum of the CA1 subfield of the hippocampus. (b1–b3) The same interneuron from the boxed area in (a) is depicted at higher magnification. (c) Necab2 mRNA (green) and NECAB2 protein (red) are also found to colocalize in a large stratum radiatum interneuron. (d1–d3) High magnification confocal image demonstrates high Necab2/NECAB2 levels within the same interneuron from the boxed area presented in (c).
Figure 1.

Single-cell RNA-Seq profile of representative calcium-binding proteins reveals high Necab1 and Necab2 expression in CB1-receptor-expressing GABAergic interneurons. (a, b) In silico analysis of selected calcium-binding protein encoding mRNA expression profiles was performed on data derived from a publicly available single-cell RNAseq database (Zeisel et al. 2015). The samples were obtained from the mouse hippocampus (a) and the somatosensory cortex (b). Cells in the database were selected for their GABAergic phenotype and high Cnr1 expression to focus the analysis on CB1/CCK-positive interneurons. The mRNAs of characteristic EF-hand calcium-binding proteins (calbindin—Calb1, calretinin—Calb2, parvalbumin—Pvalb and secretagogin—Scgn) are present in low levels in most of these interneurons, and only a few of them exhibit elevated Calb1 levels. In contrast, the genes encoding the N-terminal EF-hand calcium-binding protein 1 and 2 (Necab1 and Necab2, respectively) are consistently expressed at high levels in all investigated hippocampal and cortical interneurons (n = 61 cells in the hippocampus, n = 84 cells in the somatosensory cortex).
Further manual analysis of the expression datasets revealed two interesting candidate genes, “Necab1” and “Necab2” that were highly and consistently expressed in high “Cnr1” expression-selected cells in both the somatosensory cortex and the hippocampus (Fig. 1a,b). In contrast, a third related gene Necab3 had only very few mRNA copies in these interneurons (Fig. 1a,b). Necab1 and Necab2 encode N-terminal EF-hand Calcium Binding Protein 1 and 2 (NECAB1 and NECAB2), respectively (Bernier et al. 2001; Sugita et al. 2002). NECAB proteins belong to the EF-hand calcium-binding protein family (Kawasaki and Kretsinger 2017), and comprise an EF-hand domain with a single calcium-binding site at the N-terminal, a central NECAB homology region and a putative antibiotic biosynthesis monooxygenase domain at the C-terminal (Sugita et al. 2002; Wu et al. 2007). Although their specific neuronal function is unknown, both affect cytosolic Ca2+-buffering capacity in neuronal preparations (Sugita et al. 2002; Schöndorf et al. 2014). Because both proteins are highly conserved between mouse and human (NECAB1 97%; NECAB2 85% based on UniProt alignment), we wondered if their expression pattern in CB1/CCK-positive interneurons is also preserved in humans. Indeed, a search in the single-cell RNA-seq dataset obtained from neuronal nuclei in postmortem human cortical samples by the Allen Institute (Hodge et al. 2019) confirmed that both NECABs are highly expressed in a population of those GABAergic interneurons that originate in the caudal ganglionic eminence (CGE) and have also high expression levels of the human CNR1 and CCK genes. In contrast, NECAB1 and NECAB2 expression were very limited or below detection threshold in the other major interneuron class that originates in the medial ganglionic eminence (MGE) and includes the parvalbumin-positive interneuron types (see for details: http://celltypes.brain-map.org/rnaseq/human/cortex). These data together suggest that NECAB1 and NECAB2 are two consensus calcium-binding proteins in CB1/CCK-positive interneurons in mammals.
In order to provide an independent line of evidence that elevated Necab1 and Necab2 gene expression levels are characterizing features of CB1/CCK-positive interneurons, we next calculated the Spearman’s rank correlation coefficient of conventional interneuron marker genes and the Necab genes in the total pool of hippocampal GABAergic interneurons (n = 126) found in the database (Zeisel et al. 2015). Importantly, Cnr1 (CB1 receptor) and Cck (cholecystokinin) gene expression levels reliably predicted Necab1 and Necab2 levels in individual interneurons (Supplementary Fig. 2a). Moreover, the single-cell mRNA levels of other well-known neurochemical markers that mark major subpopulations of CB1/CCK-positive interneurons, such as Slc17a8 (vesicular glutamate transporter 3, vGluT3), Sncg (gamma-synuclein), Cxcl14 (C-X-C motif chemokine 14) and Nr2f2 (COUP transcription factor 2, COUP-TFII) also showed significant positive correlation with Necab1 and Necab2 levels (Supplementary Fig. 2a) (Somogyi et al. 2004; Fuentealba et al. 2010; Lasztóczi et al. 2011; Tasic et al. 2016; Harris et al. 2018; Pelkey et al. 2020). In striking contrast, strong negative correlation was noted between Necab1/Necab2 and Pvalb (parvalbumin) or Sst (somatostatin) mRNA levels (Supplementary Fig. 2a). Because these latter two marker genes define the other major subclasses of MGE-derived GABAergic interneurons (Tasic et al. 2016; Harris et al. 2018), these findings obtained at the single-cell level further underline that Necab1 and Necab2 expression distinguishes the CGE-derived CB1/CCK-positive interneurons.
Since single-cell mRNA levels of functionally related proteins often covary, we also searched the dataset to detect candidate genes whose physiological function may be associated with NECAB1/NECAB2-mediated Ca2+-buffering. This analysis revealed several novel genes with unknown function in CB1/CCK-positive interneurons (Supplementary Figs 2b and 3). Perhaps the functionally most interesting two genes that exhibited strong correlations with Necab1 and Necab2 both encode calcium-sensing proteins that are known to regulate vesicular exocytosis such as Cadps2 (Calcium Dependent Secretion Activator 2) and Syt6 (synaptotagmin 6). These observations raise the possibility that NECAB proteins may have presynaptic function and provide further hints that a unique molecular apparatus controls Ca2+-dependent neurotransmitter release in CB1/CCK-positive interneurons.
RNAscope Multiplex Fluorescent In Situ Hybridization and Immunostaining Demonstrate that NECAB1 and NECAB2 are Present in All CB1/CCK-Positive Interneurons
Although the reproducibility of single-cell RNA-seq approaches has been substantially improved, false positive and false negative hits may both appear in the detection of differentially expressed genes due to inherent technical limitations such as contamination during cell harvesting from tissue preparations or high detection threshold for genes expressed at low levels (Vieth et al. 2019; Wang et al. 2019). For example, Necab1 was recently found to be a candidate marker of D1 dopamine receptor-expressing GABAergic medium spiny projection neurons in the striatum, but later was reported to be enriched in D2 dopamine receptor-expressing GABAergic medium spiny projection neurons by using the different single-cell RNA-seq approaches Drop-seq and Nuc-seq, respectively (Saunders et al. 2018; Märtin et al. 2019). In addition, mRNA transcription in a single cell does not always accurately predict protein translation (Sharma et al. 2015; Liu et al. 2016). Therefore, we next set out to experimentally test the hypothesis generated by our in silico analysis of the single-cell RNA-seq data that the two NECAB calcium-binding proteins are indeed characterizing CB1/CCK-positive interneurons at both the mRNA and protein levels.
To visualize Necab1 and Necab2 mRNA distribution, we used multichannel RNAscope fluorescent ISH, a highly specific and sensitive technique to detect even low copies of mRNA molecules in fixed tissues (Wang et al. 2012). To determine the localization of NECAB1 and NECAB2 proteins, we performed free-floating immunostaining by using antibodies raised against different epitopes of the two NECAB proteins. The specificity of the NECAB1 and NECAB2 antibodies have been validated in the dorsal spinal horn by using antigen adsorption tests and NECAB2-knockout mice (Zhang et al. 2014, 2018). However, to further validate the ISH and immunostaining experiments in the absence of NECAB1 and NECAB2 knockout mice in our laboratory, we combined the RNAscope protocol with immunostaining that allows the simultaneous detection of mRNA molecules and proteins in brain sections. We argued that it is highly unlikely that the two different sets of probes and experimental approaches would cause identical background patterns.
Notably, RNAscope ISH and immunostaining both visualized scattered interneuron cell bodies in the hippocampus (Fig. 2). All NECAB1-immunopositive interneuron cell bodies did also contain Necab1 mRNA signals in the stratum radiatum of the CA1 subfield (n = 61/61 cells from 3 mice). Similarly, every NECAB2-immunostained soma was also positive for Necab2 expression (n = 82/82 cells from 3 mice). The abundance of GAD67, a primarily presynaptic synthesizing enzyme of GABA reached the detection threshold of immunofluorescence in the vast majority of NECAB1- and NECAB2-immunopositive cell bodies (55 out 69 cells and 31 out of 38 cells in case of NECAB1 and NECAB2, respectively, n = 3 mice) corroborating that these cells are GABAergic interneurons (Supplementary Fig. 4).
Figure 5.
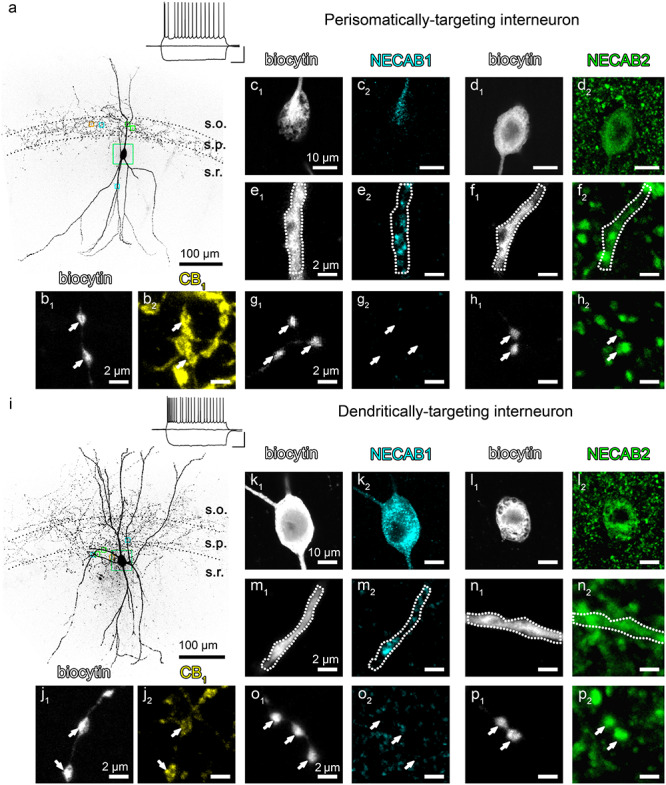
Subcellular distribution of NECAB1 and NECAB2 in identified perisomatically targeting and dendritically targeting CB1-receptor-expressing GABAergic interneurons. (a) MIP of a representative perisomatically targeting multipolar neuron in CA1 stratum radiatum (s.r.). The axonal arbor is restricted to stratum pyramidale (s.p.), whereas the dendrites are extended to stratum oriens (s.o.) and stratum radiatum. Boxed areas depict the different subcellular compartments that are shown at high magnification in b–h with matching colors. The neuron was filled with biocytin during patch-clamp recording. Insets show example voltage traces in response to depolarizing and hyperpolarizing current steps of −200, 0, and +150 pA from resting membrane potential recorded in whole-cell current-clamp configuration (scale: 40 mV, 200 ms). Note the regular-spiking, accommodating firing pattern, a characteristic feature of CB1/CCK-positive GABAergic interneurons. (b1–b2) Indeed, biocytin-filled axon terminals (b1) belonging to the same interneuron carry high density of CB1 receptors (yellow, b2). (c1–d2) The cell body of this interneuron was cut in half during resectioning (c1, d1) that makes the demonstration of the presence of both NECAB1 (cyan) and NECAB2 (green) within the soma possible (c2, d2). (e1–f2) Dendrites of the biocytin-filled cell also contain both NECAB1 (e2) and NECAB2 (f2). (g1–h2) In contrast, confocal imaging reveals intense NECAB2-immunostaining (h2) in axon terminals, whereas NECAB1-immunostaining remained under detection threshold in boutons of the same interneuron (g2). (i–j2) MIP of a confocal z-stack presents a regular-spiking dendritically targeting interneuron with an extensively distributed axonal arbor that contain CB1 receptors (j2). The subcellular distribution of the NECAB calcium-binding proteins within this cell mirrors their localization in the perisomatically targeting interneuron presented in (a). While the cell body and the dendrites contain both NECABs (k1–n2), only NECAB2-immunostaining is observed in the axon terminals (p2).
The potential crosstalk between the two riboprobes or antibodies could be excluded as well, because these tools also labeled specific, nonoverlapping subsets of excitatory cells. Besides the putative GABAergic interneurons, Necab1 mRNA and NECAB1 protein were found in layer 2 and layer 5a pyramidal neurons in the neocortex, whereas Necab2 mRNA and NECAB2 protein were observed in CA2 and CA3a/b pyramidal neurons in the dorsal hippocampus (Fig. 3).
Figure 3.

Prominent Necab1 and Necab2 mRNA expression in high Cnr1-expressing hippocampal, cortical, and amygdalar interneurons. (a–d) Representative confocal microscopy images of triple fluorescent ISH shows the expression patterns of genes encoding the CB1 cannabinoid receptor (Cnr1, yellow), NECAB1 (Necab1, cyan), and NECAB2 (Necab2, green) in the mouse hippocampus (a1–b3), somatosensory cortex (c1–c3), and BLA complex (d1–d3). Cell nuclei are stained with DAPI (white) in all images. (b1–b3) High magnification of a triple-positive hippocampal interneuron located in the CA1 stratum oriens is shown from the boxed region in (a1–a3). Dashed line in (d1–d3) outlines the BLA complex. (e–g) Quantitative analysis of mRNA levels in 1337 individual cells segregates neurons into two major populations throughout the hippocampus (HC), somatosensory cortex (SS), and BLA complex. Cells exhibiting strong (S) Cnr1 mRNA expression are predominantly represent GABAergic interneurons, whereas neurons with weak (W) Cnr1 mRNA levels belong to principal cells. The three columns of data points represent individual cells from n = 3 mice. Note that both Necab1 and Necab2 are consistently highly expressed in strong Cnr1-positive cells in all three regions. Interestingly, weak Cnr1-positive cells that are putative mossy cells in the hilus of the DG also express moderate levels of both Necabs. Specific pyramidal cell populations express Necab1 in the somatosensory cortex and in the BLA complex, whereas Necab2 has high levels in CA2 and CA3a pyramidal neurons.
CB1/CCK-positive interneurons belong to a GABAergic cell class that originate from the CGE and disperse via multiple rostro-caudal migratory streams to populate the isocortex, hippocampal formation, and BLA complex (Nery et al. 2002; Touzot et al. 2016). High CB1 level is a consistent feature of CB1/CCK-positive interneurons in all three telencephalic areas (Katona et al. 1999, 2001; Marsicano and Lutz 1999; Tsou et al. 1999; McDonald and Mascagni 2001; Bodor et al. 2005). On the other hand, CB1 is also present in glutamatergic excitatory cells albeit at an order of magnitude lower levels (Marsicano and Lutz 1999; Steindel et al. 2013). Analysis of the single-cell RNA-seq dataset verified this striking quantitative difference between the two major cell types (Supplementary Fig. 5).
To experimentally determine if Necab1 and Necab2 are expressed in CB1/CCK-positive interneurons, we applied 3-channel (Cnr1, Necab1, Necab2) RNAscope and used the quantitative nature of the RNAscope signals. Individual cells were categorized into “strong CB1-expressing” and “weak CB1-expressing” group based on the bimodal distribution of the Cnr1 RNAscope signal intensity (for enrichment value cutoffs, see Materials and Methods). In the CA1 subfield of the hippocampus, we found that 92% and 100% of the “strong CB1-expressing” interneurons also express high levels of Necab1 and Necab2, respectively (n = 194 cells from 3 mice; Fig. 3a,b,e,f,g). Similarly, all “strong CB1-expressing” interneurons in the CA3 region were also Necab1- and Necab2-positive (n = 93 cells from 3 mice; Fig. 3a,b,e,f,g). In the hilus of the dentate gyrus (DG), 97% of the “strong CB1-expressing” cells expressed Necab1, whereas all cells contained Necab2 (n = 105 cells from 3 mice; Fig. 3a,b,e,f,g). “Weak CB1-expressing” pyramidal cells had few Necab signal in the CA1 (n = 141 cells from 3 mice; Fig. 3a,e,f,g). In contrast, Necab2, but not Necab1 was found to be highly expressed in a selected subset of pyramidal neurons in the CA2/CA3 region (n = 123 cells from 3 mice; Fig. 3a,e,f,g). Interestingly, Necab1 and Necab2 were found in 80% and 97%, respectively, of “weak CB1-expressing” cells in the hilus (n = 74 cells from 3 mice; Fig. 3a,e,f,g) that may represent hilar mossy cells (Katona et al. 2006; Monory et al. 2006).
To investigate whether high levels of Necab1 and Necab2 are conserved molecular features of CB1/CCK-positive interneurons in light of their shared CGE origin, we carried out similar 3-channel RNAscope signal quantification in the somatosensory cortex and in the BLA (Fig. 3c–g). We found that 97% and 100% of the “strong CB1-expressing” interneurons contain high levels of Necab1 and Necab2, respectively, in the somatosensory cortex (n = 156 cells from 3 mice). We observed a similar situation in the BLA, where all “strong CB1-expressing” cells had high Necab1 and Necab2 levels (n = 189 cells from 3 mice). The majority of putative “weak CB1-expressing” principal cells in the somatosensory cortex contained moderate levels of Necab1 and Necab2 RNAscope signals (n = 143 cells from 3 mice). In contrast, Necab1 had surprisingly high levels in presumed pyramidal neurons belonging to the “weak CB1-expressing” group (n = 119 cells from 3 mice), whereas Necab2 expression level was substantially lower in the same sample of cells in the BLA complex.
We also addressed the issue whether high levels of Necab1 and Necab2 are restricted exclusively to CB1/CCK-positive interneurons. This analysis was carried out in the hippocampus, because intermingling of some indistinguishable high Necab-expressing pyramidal neurons and GABAergic interneurons would have increased false negative rate within layer 5 of the somatosensory cortex and in the BLA. We found that very few Necab1-and Necab2-positive interneurons lacked high levels of Cnr1 RNAscope signal in both the CA1 (n = 3 and 25 out of 338 and 360 cells, respectively, from 3 mice) and CA3 subfields (n = 6 and 12 out of 222 and 228 cells, respectively, from 3 mice). Taken together, these RNAscope ISH experiments provide direct experimental evidence that the Necab1 and Necab2 genes encoding two EF-hand calcium-binding proteins are commonly expressed in CB1/CCK-positive interneurons in cortical microcircuits.
To determine whether NECAB1 and NECAB2 proteins are also present in CB1/CCK-positive interneurons, we performed combined immunostaining for CB1 receptors and either NECAB1 or NECAB2 and then measured colocalization ratios by dual-channel confocal microscopy (Fig. 4). NECAB1-immunostaining resulted in strong labeling of the somatodendritic compartment of multipolar cells in all examined brain regions (Fig. 4a,b,e,f,i,j), but putative principal cell bodies have also been noticed, especially in layer 5a of the somatosensory cortex and in the BLA (Fig. 4e,i). In case of NECAB2-immunostaining, the scattered distribution of putative interneuron cell bodies was complemented with an intense axonal arborization pattern throughout all three brain areas (Fig. 4c,d,g,h,k,l). CB1-immunostaining revealed the well-described dense meshwork of axons and large axon terminals, whereas interneuron cell bodies were also visualized by punctate, granular staining (Fig. 4b,d,f,h,j,l). The colocalization analysis showed that all CB1-immunopositive cell bodies are also immunostained for NECAB1 (n = 221 cells in the CA1 subfield; n = 237 cells in the CA3 subfield; n = 154 cells in the DG; n = 153 cells in the somatosensory cortex; and n = 151 cells in the BLA from 3 mice); and for NECAB2 (n = 97 cells in the CA1 subfield; n = 50 cells in the CA3 subfield; n = 96 cells in the DG; n = 132 cells in the somatosensory cortex; and n = 114 cells in the BLA from 3 mice).
Figure 4.

NECAB1 and NECAB2 calcium-binding proteins are distributed in CB1-receptor-expressing GABAergic interneurons. (a–l) Representative confocal microscopy images of double immunostaining of CB1 receptors (yellow) and either NECAB1 (cyan) or NECAB2 (green). Cell nuclei are stained with DAPI (white). Interneurons colocalizing CB1/NECAB1 or CB1/NECAB2 stand out already at low magnification in the CA1 subregion of the hippocampus CA1 region (a, c), in the somatosensory cortex (e, g) and in the BLA complex (i, k). (b1–2, d1–2, f1–2, h1–2, j1–2, l1–2) High magnification shows the double-immunostained cell bodies from the respective boxed areas present in a, c, e, g, i, k. Note that both CB1 receptor- and NECAB2-immunostaining visualize a dense meshwork of axons in all three regions, whereas NECAB1 is primarily located in somata and dendrites.
In addition, we have also performed triple immunostaining for CB1, CCK, and either of the two NECAB calcium-binding proteins (Supplementary Fig. 6). Because CCK, as a neuropeptide is predominantly accumulated in the axon terminals, the somatic levels of CCK often remain below the detection threshold of immunolabeling. Nevertheless, qualitative observations showed that those hippocampal interneurons that had visible amount of CCK- and CB1 receptor-immunolabeling in their cell bodies had strong NECAB1- and NECAB2-immunostaining as well (Supplementary Fig. 6). Collectively, these anatomical experiments demonstrate that both NECAB1 and NECAB2 are ubiquitous calcium-binding proteins in CB1/CCK-positive interneurons throughout the cerebral cortex, the hippocampal formation, and the BLA complex.
Finally, we aimed to determine whether the subset of high Necab-expressing cells that lack Cnr1 expression may belong to another interneuron type. Parvalbumin is the most well-established interneuron marker and it is present in several types such as basket cells, chandelier/axo-axonic cells, bistratified cells, and oriens–lacunosum moleculare (O-LM) interneurons in the CA1 region of the hippocampus (Klausberger and Somogyi 2008). Double immunostaining for NECAB1 and parvalbumin revealed that a subpopulation of NECAB1-positive interneurons also contains parvalbumin (n = 66 out of 330 cells from 3 mice). These cells consist of 38% of all parvalbumin-containing interneurons in the strata pyramidale and oriens (Supplementary Fig. 7a13–a) and may represent chandelier/axo-axonic interneurons (see Discussion for details). In contrast, parvalbumin level did not reach detection threshold in 213 out of 214 NECAB2-immunopositive interneurons (3 mice, Supplementary Fig. 7b13–b).
Different Subcellular Distribution of NECAB1 and NECAB2 in CB1/CCK-Positive Interneurons
The previous findings pose the interesting question of why a single interneuron may need two phylogenetically closely related calcium-binding proteins? In light of the different kinetic properties of presynaptic and somatodendritic Ca2+-transients in regular-spiking CB1/CCK-positive interneurons in the CA1 area (Kisfali et al. 2013), we tested the hypothesis that the two NECAB proteins bear distinct subcellular compartmentalization and thereby regulate different Ca2+-mediated physiological processes. We first targeted multipolar, regular-spiking interneurons located in the stratum radiatum of the CA1 subfield of the hippocampus in acute brain slices by using whole-cell patch-clamp electrophysiology. After the identification of a regular-spiking interneuron, the cell was filled with biocytin to reconstruct its neuronal morphology. We studied two morphological types of CB1/CCK-positive interneurons that are known to exhibit some distinct molecular, anatomical, and electrophysiological properties (Lee et al. 2010, 2015; Dudok et al. 2015). The so-called perisomatically targeting interneurons (aka basket cells) innervate the cell body and proximal dendrites of postsynaptic pyramidal neurons (Fig. 5a), whereas the dendritically targeting (aka Schaffer collateral-associated) interneurons (Fig. 5i) form synapses on more distal pyramidal neuron dendrites (Vida et al. 1998; Cope et al. 2002). Every electrophysiologically recorded regular-spiking interneuron (n = 6 perisomatically targeting cells and n = 6 dendritically targeting cells) displayed high CB1 levels in its axon terminals (Fig. 5b,j).
In case of the NECAB1-immunostaining, we found that this calcium-binding protein is present throughout interneuron somata and dendrites (Fig. 5c,e,k,m). In contrast, NECAB1 levels remained under the detection threshold of confocal microscopy in the boutons of both perisomatically targeting and dendritically targeting interneurons (Fig. 5g,o). On the other hand, NECAB2-immunostaining was highly concentrated in the axon terminals (Fig. 5h,p), and was also found, albeit at lower levels, in the cell bodies and dendrites of both morphological types of CB1/CCK-positive interneurons (Fig. 5d,f,l,n).
Besides the qualitative difference in the subcellular localization of the two NECAB proteins, we also aimed to quantify the density of these calcium-binding proteins in both the somatodendritic and axonal compartments to gain better understanding of their nanoscale distribution. Conventional Ca2+-buffers of interneurons such as calretinin and parvalbumin have been shown to control Ca2+-signals in the nanodomain vicinity of voltage-gated Ca2+-channels that have important implications for presynaptic neurotransmitter release properties (Christel et al. 2012; Eggermann and Jonas 2012). Therefore, we next used super-resolution imaging as a powerful tool to measure the subcellular distribution of NECAB1 and NECAB2 in biocytin-filled perisomatically targeting cells. In contrast to confocal microscopy, the superior detection sensitivity of STORM imaging, as a type of single-molecule localization microscopy, was able to capture low levels of NECAB1 in interneuron axon terminals (Fig. 6a). However, NECAB1 density was still significantly higher in interneuron dendrites (Fig. 6c,e; Mann–Whitney U-test, P = 0.0095; 43 axonal and 28 dendritic ROIs from n = 6/5 cells and n = 6/5 mice, respectively). In striking contrast, NECAB2 protein was substantially more abundant in interneuron boutons (Fig. 6b,f) compared with interneuron dendrites (Fig. 6d,f; Mann–Whitney U-test, P < 0.0001; 36 axonal and 34 dendritic ROIs from n = 6/6 cells and n = 6/6 mice). Accordingly, quantification of the bouton/dendrite density ratio also revealed a considerable difference between the subcellular distribution of NECAB1 and NECAB2 (Fig. 6g; Mann–Whitney U-test, P = 0.008; n = 5/6 cells and n = 5/6 mice for NECAB1 and NECAB2, respectively) further supporting a hypothesized functional division of labor between these calcium-binding proteins.
Figure 6.

Correlated confocal and STORM super-resolution imaging reveals subcellular differences in the density of NECAB1 and NECAB2 calcium-binding proteins. (a–d) The distinct subcellular domains of identified perisomatically targeting interneurons were visualized by biocytin-labeling and confocal imaging (a1, b1, c1, d1). NECAB1- and NECAB2-immunostaining were imaged by STORM super-resolution microscopy within the very same subcellular profiles (a2, b2, c2, d2). To determine the nanoscale density of NECAB1 and NECAB2, the subcellular ROIs were delineated with the Active Contour algorithm (Marquez-Neila et al. 2014) that enabled filtering of those STORM coordinates that belong to the respective bouton or dendrite segment. (e) Based on the analysis of 43 axon terminals and 28 dendritic profiles, NECAB1 density (NLP per 1 μm2 area) is higher in the dendrites compared with boutons (n = 5 and 6 animals, respectively, Mann–Whitney U-test). (f) In contrast, NECAB2 density is substantially larger in axon terminals than in dendrites (n = 6 and 6 animals, 36 and 34 ROIs, respectively, Mann–Whitney U-test). (g) Accordingly, the ratio of the nanoscale density within the axonal and dendritic compartments is strikingly different between NECAB1 and NECAB2 with a predominant presynaptic accumulation of NECAB2 (n = 5 and 6 animals, Mann–Whitney U-test). Data are presented in e–g as median (black lines) and 25–75% interquartile range (cyan and green rectangles). (h) Ripley’s L-function of the nanoscale distribution of STORM localization points representing NECAB1 protein shows that NECAB1 has a nonuniform distribution and it is more clustered in axon terminals (blue) than in dendrites (cyan) (n = 6 and 5 animals, n = 51 and 40 ROIs, respectively). (i) Ripley’s L-function visualization demonstrates that NECAB2 nanoscale localization pattern is comparable with a uniform distribution in axon terminals (dark green), but it is more clustered in dendrites (light green) (n = 6 and 6 animals, n = 31 and 37 ROIs, respectively). Black dashed line in h and i shows the function for Poisson distribution (random).
Calcium-binding proteins involved in Ca2+-buffering can be mobile or immobilized and dynamic changes in the ratio of these two states underlie important physiological processes (Schwaller 2020). Therefore, we also investigated whether the NECAB calcium-binding proteins show a rather homogeneous distribution in axon terminals, cell bodies, and dendrites indicating a predominant function as mobile buffers; or alternatively, they are more concentrated within specific nanodomains in association with functional compartments such as presynaptic active zones, postsynaptic densities, or intracellular organelles like mitochondria. By exploiting the strength of STORM microscopy for nanoscale molecular imaging, we measured the clustering tendencies of the STORM localization points with Ripley’s L function (Fig. 6h,i). Apparent concentration hotspots distributed along the surface of the subcellular profiles that would indicate an exclusively plasma membrane-associated function were not observed (Fig. 6a–d). Nevertheless, Ripley’s L function detected deviations from spatial homogeneity in case of NECAB1 suggesting its clustered nanoscale distribution in both axon terminals and dendrites (Fig. 6h). Interestingly, while the nanoscale localization pattern of NECAB2 was only slightly different from random distribution in axon terminals, it tended to be more clustered in dendrites. Taken together, the subcellular compartment-specific nanoscale density and clustering differences between NECAB1 and NECAB2 indicate that these calcium-binding proteins fulfill multiple functionally different roles in the regulation of Ca2+-signaling dynamics in CB1/CCK-positive GABAergic interneurons.
Discussion
The tight spatial and temporal regulation of Ca2+-signaling is pivotal in most neuronal physiological processes, whereas dysregulation of Ca2+-dynamics is often associated with brain disorders (Schwaller 2020). Accordingly, the immense molecular assortment of the “Ca2+-signaling toolkit” including the several hundred EF-hand Ca2+-binding proteins perfectly matches the cellular heterogeneity and the functional diversity of neurons throughout the brain (Girard et al. 2015). Our present findings obtained by in silico data mining in single-cell RNA-seq databases, ISH, immunostaining, and correlated confocal/super-resolution microscopy indicate the followings: (1) hippocampal CB1/CCK-positive GABAergic interneurons express high levels of N-terminal EF-hand calcium-binding protein 1 and 2; (2) the cellular expression pattern of NECAB1 and NECAB2 is a characteristic and conserved feature of developmentally and functionally related GABAergic cell populations in the somatosensory cortex and the BLA complex; (3) NECAB1 and NECAB2 exhibit different subcellular distribution in CB1/CCK-positive GABAergic interneurons. Together, these findings add to the growing body of evidence that separate molecular players were evolved to fine-tune neuronal calcium signaling at the cellular and subcellular levels and may subserve functional division of labor required for distinct Ca2+-dynamics in specific neuronal elements of cortical circuits.
Interneuron-Type-Specific Anatomical Distribution of NECAB1 and NECAB2 Proteins
The cell-type-specific expression of representative EF-hand Ca2+-binding proteins such as parvalbumin, calbindin, and calretinin in cortical GABAergic interneuron types has been established more than three decades ago (Celio 1986; Baimbridge et al. 1992). The anatomical distribution of these Ca2+-buffers turned out to associate well with the postsynaptic target profile of interneurons either forming symmetrical synapses on different subcellular domains of pyramidal cells or specifying to innervate other interneurons (DeFelipe 1997; Kawaguchi and Kubota 1997; Freund and Buzsáki 1998). Early anatomical reports revealed that parvalbumin is predominantly restricted to basket and axo-axonic cells that target the perisomatic surface of principal cells in cortical and hippocampal microcircuits (Kosaka et al. 1987; Katsumaru et al. 1988; DeFelipe et al. 1989; Hendry et al. 1989). In addition, calbindin-containing interneurons were found to synapse primarily on dendritic shafts or project to the medial septum (Tóth and Freund 1992; Gulyás and Freund 1996; DeFelipe 1997), whereas a peculiar interneuron type that specifically innervates other interneurons was visualized by calretinin-immunostaining (Gulyás et al. 1996). Although later studies uncovered interneuron types that coexpress some of these Ca2+-binding proteins such as the parvalbumin- and calbindin-positive multipolar bursting cells in layer 2/3 of the cerebral cortex (Blatow et al. 2003), there is a general view that each GABAergic interneuron type expresses a characteristic and functionally relevant repertoire of Ca2+-buffers.
In light of the vast heterogeneity of cortical GABAergic cell types (Klausberger and Somogyi 2008; Tremblay et al. 2016; Pelkey et al. 2017), an important objective of our study was to ascertain if additional EF-hand Ca2+-binding proteins exist that control Ca2+-signaling in an interneuron-type-specific manner. Interestingly, prior anatomical studies have identified hippocampal and cortical interneuron types that innervate the cell bodies of pyramidal neurons and express the neuropeptide cholecystokinin, but lack parvalbumin (Greenwood et al. 1981; Harris et al. 1985; Nunzi et al. 1985; Freund et al. 1986; Kosaka et al. 1987). It is now well-established that these cells represent a highly heterogeneous group of GABAergic interneurons that provide complete coverage of different subcellular domains of principal cells by GABAergic inputs as described in the hippocampus and the neocortex (Freund et al. 1986; Klausberger et al. 2005; Lasztóczi et al. 2011), and extensively innervate the entire surface of pyramidal cells in the BLA complex (Rovira-Esteban et al. 2017). These cortical, hippocampal, and amygdalar interneurons share a common origin in the CGE (Nery et al. 2002). Together with CCK, their additional highly expressed and conserved molecular marker is the CB1 cannabinoid receptor (Katona et al. 1999, 2001; Marsicano and Lutz 1999; Bodor et al. 2005). A subpopulation of CB1/CCK-positive interneurons containing calbindin or occasionally calretinin were noted (Gulyás et al. 1991; Kubota and Kawaguchi 1997; Mascagni and McDonald 2003; Bodor et al. 2005; Rovira-Esteban et al. 2017) in complete agreement with the in silico expression data obtained in the present study. However, none of the three representative EF-hand Ca2+-binding proteins exhibit consistently high expression in CB1/CCK-positive interneurons.
The data mining approach showcases the usefulness of publicly available single-cell RNA-seq databases for hypothesis-driven anatomical studies and was instrumental to identify the two EF-hand Ca2+-binding proteins NECAB1 and NECAB2 as representative genes in CB1/CCK-positive interneurons. By using the most sensitive RNAscope and confocal imaging approaches, we verified an almost complete colocalization of Necabs and NECABs both at the mRNA and protein levels, respectively. The striking overlap indicates the uniform anatomical distribution of both NECABs in almost all CB1/CCK-positive interneurons. The lack of apparent colocalization in some cells found infrequently may result from methodical issues such as the limited detection threshold of immunostaining or the use of a single optical section for microscopic analysis. In addition, we provided direct evidence for the presence of NECABs in all investigated regular-spiking hippocampal CB1/CCK-positive interneurons at the level of identified perisomatically targeting and dendritically targeting interneurons by using confocal and super-resolution imaging. The anatomical distribution pattern of these interneurons is also in general agreement with previous ISH studies that showed scattered distribution of Necab1- and Necab2-expressing cells in different layers of the hippocampus (Sugita et al. 2002; Zimmermann et al. 2013). While these studies reported inconsistent findings regarding colocalization with calbindin, the presence of NECABs in the small subpopulation of calbindin-expressing CB1/CCK-positive interneurons described above could resolve this paradox (Gulyás et al. 1991). Notably, our in silico data also revealed a complete lack of parvalbumin, the occasional presence of calbindin and consistently high levels of both NECABs in every high CB1-expressing GABAergic interneuron.
Another important observation of the present study is that the high expression levels of both NECAB1 and NECAB2 in CB1/CCK-positive interneurons are conserved features in all three investigated telencephalic brain regions. The preserved anatomical distribution is also supported by a recent report describing the medial septal innervation of a few cells in the subiculum and parasubiculum that colocalize NECAB1 and CCK, but lack parvalbumin (Unal et al. 2015). It is imperative to emphasize that the CB1/CCK-positive population represents a significant, often underappreciated proportion of cortical GABAergic interneurons that matches the ratio of parvalbumin-positive interneurons among all GABAergic cells. Intriguingly, the percentage of CB1/CCK versus parvalbumin-positive interneurons varies in different microcircuits from 32% versus 16% in the dorsal CA1 to 8% versus 40% in the primary visual cortex, respectively (Whissell et al. 2015). Therefore, it was surprising that no typifying, highly expressed EF-hand Ca2+-binding proteins have been identified in such a major interneuron population to date. Our in silico and experimental findings that NECAB1 and NECAB2 are predominantly expressed by the CB1/CCK-positive interneurons fill this long-standing gap and contribute to the vast literature that different types of cortical, hippocampal, and amygdalar GABAergic interneurons express separate sets of Ca2+-binding proteins.
Interneuron-Type-Specific Physiological Significance of NECAB1 and NECAB2 Proteins
Perhaps the best example for the cell-type-specific importance of Ca2+-buffering is described in the cerebellum. As shown by using global knockout and granule-cell-restricted rescue mouse models, the cytosolic Ca2+-buffering capacity of calretinin in cerebellar granule cells controls intrinsic neuronal excitability and firing pattern, thereby fine-tuning the frequency of cerebellar network oscillations and motor coordination behavior (Schiffmann et al. 1999; Gall et al. 2003; Cheron et al. 2004; Bearzatto et al. 2006). It is very interesting to consider why NECAB1 and NECAB2 were evolved as regulators of Ca2+-signaling in CB1/CCK interneurons. We observed a ubiquitous expression pattern in CB1/CCK interneurons throughout the cerebral cortex, the hippocampal formation, and the BLA complex suggesting that the physiological significance of NECAB1/2-mediated control of Ca2+-signaling should be considered in the context of the computational functions of these interneurons in circuit activity. However, the specific circuit and behavioral roles of CB1/CCK-positive interneurons have remained rather elusive. The incomplete and inaccurate cell-type-specific expression of genetic regulatory tools in CB1/CCK-positive interneurons renders in vivo experimental manipulation of their physiological and behavioral functions difficult (Rovira-Esteban et al. 2019). Importantly, coexpression of both NECAB Ca2+-binding proteins is restricted to the CB1/CCK-positive interneurons among cortical and hippocampal GABAergic cells indicating the potential usefulness of their genes for cell-type-specific labeling and interrogating of CB1/CCK-positive interneurons for future investigations. Intersectional genetic manipulation strategies will be required because we have also found that both NECABs are present in some selected, but nonoverlapping cortical and hippocampal pyramidal neuron types. The triple-recombinase-responsive approach (Plummer et al. 2015) including a GABAergic neuron-restricted promoter could be considered especially in the BLA, due to the widespread Necab expression in principal cells. In addition, an intersectional approach using the Pvalb and Necab1 genes could potentially be exploited to target chandelier (axo-axonic) cells. Although we observed that most NECAB1-positive interneurons lack parvalbumin as reported earlier (Sugita et al. 2002; Zimmermann et al. 2013), we also found that NECAB1, but not NECAB2 is present in a smaller subset of parvalbumin-positive interneurons. Chandelier cells are distinguished from parvalbumin-positive basket cells based on the absence of Satb1 transcription factor expression (Viney et al. 2013). Although further experimental evidence is required to establish whether the NECAB1/parvalbumin-immunopositive cells indeed represent chandelier cells, it is suggestive that the new Allen Institute single-cell RNA-seq dataset based on ~1.2 million cortical cells (Yao et al. 2020) contains a unique population of parvalbumin-positive interneurons that lack Satb1, and express Necab1, but not Necab2.
Although NECABs have been cloned almost 20 years ago (Bernier et al. 2001; Sugita et al. 2002), our knowledge about their cell physiological functions is still very limited. By illuminating the subcellular and cellular contexts in which NECAB-mediated Ca2+-buffering may have physiological significance, our present anatomical identification of the interneuron population and the subcellular domains that contain high levels of the NECAB Ca2+-binding proteins will also help to orient future studies that aim to uncover the cell physiological roles of NECABs by using loss-of-function approaches. In line with our observations in telencephalic brain regions, NECAB proteins also showed a cell-type-restricted distribution pattern that did not overlap with the other conventional calcium-binding proteins in the spinal cord and in the dorsal root ganglia (Zhang et al. 2014, 2016, 2018). The largely nonoverlapping distribution of individual Ca2+-binding proteins raise the interesting question of why CB1/CCK-positive interneurons utilize two related, but different Ca2+-binding proteins? One possibility could be the functional necessity of heterodimer formation between the two NECABs. On the other hand, our observations suggested a segregated distribution of NECAB1 and NECAB2 in different principal cell types. In addition, NECAB1 and NECAB2 are also present in different neuronal populations in the spinal cord implying their distinct physiological functions (Zhang et al. 2016). Moreover, the different subcellular distribution uncovered in the present study by STORM super-resolution imaging suggests a distinct contribution of NECAB1 and NECAB2 to somatodendritic and presynaptic Ca2+-dynamics in CB1/CCK-positive interneurons. As an important limitation of antibody-based immunostaining approaches, one must emphasize that the quantitative differences may partly arise from the altered immunogenicity of the two NECABs in the different subcellular environments in fixed tissue preparations. However, direct measurement of Ca2+-transients by two-photon laser microscopy in live CB1/CCK-positive interneurons provided compelling evidence for striking differences in dendritic and boutonal Ca2+-dynamics, such as monoexponential and biexponential decay of Ca2+-transients, respectively (Kisfali et al. 2013). Thus, it will be interesting to determine in future studies by using loss-of-function models such as viral-mediated targeted knockdown strategies of how NECAB1 and NECAB2 contribute to different Ca2+-kinetics in a subcellular compartment-specific manner.
The differential nanoscale distribution of NECAB proteins indicate that NECAB1 and NECAB2 are equipped with specific targeting and protein interaction motifs. Two previous studies have reported that NECAB2 specifically binds to A2A adenosine receptors in the striatum (Canela et al. 2007), and interacts with mGlu5 glutamate receptor in hippocampal pyramidal cells (Canela et al. 2009). On the other hand, our STORM microscopy findings did not indicate a specific plasma membrane accumulation or synaptic clustering of neither Ca2+-binding proteins in dendrites. Instead, our nanoscale distribution analysis in biocytin-filled interneurons imply a predominantly intracellular localization, which is more in line with the electron micrographs depicting immunogold particles representing NECAB2 distribution (Canela et al. 2007, 2009) leaving the question open about the specific cell physiological functions of NECABs in interneuron dendrites. Considering the dense accumulation of NECAB2 that we observed in interneuron axon terminals, an interesting future direction of research may investigate how this Ca2+-binding protein may associate with presynaptic calcium-sensing proteins and how NECAB2-mediated Ca2+-buffering regulates neurotransmitter release. Both parvalbumin and calretinin are known to control Ca2+-transients in the nanoscale domain surrounding voltage-gated Ca2+-channels (Christel et al. 2012; Eggermann and Jonas 2012), even via the direct interaction with Ca2+-channel subunits (Christel et al. 2012). Binding of NECAB1 to the presynaptic calcium sensor synaptotagmin 1 has been reported, although its significance under more physiological conditions remains to be established (Sugita et al. 2002). On the other hand, our in silico correlation analysis identified Syt6 encoding synaptotagmin 6, another calcium-sensing synaptic vesicle protein that exhibits strong positive correlation with Necab2, Cnr1, and Cck expression levels. Interestingly, two Patch-Seq-based single-cell RNA-seq studies have also measured strong expression of Syt6 in CB1/CCK-positive interneurons (Földy et al. 2016; Fuzik et al. 2016). It is also important to note that parvalbumin-containing perisomatic axon terminals carry synaptotagmin 2 (Sommeijer and Levelt 2012), and exploit different voltage-gated Ca2+-channels than CB1/CCK-positive interneurons (Poncer et al. 1997; Wilson et al. 2001; Szabó, Lenkey, et al. 2014a). These observations together suggest that a specific set of Ca2+-channels, Ca2+-sensors and Ca2+-buffers controls Ca2+-dependent vesicle release and underlies the distinctive neurotransmitter release properties of CB1/CCK-positive interneurons (Hefft and Jonas 2005; Daw et al. 2009; Ali and Todorova 2010).
Interneuron-Type-Specific Pathophysiological Implications of NECAB1 and NECAB2 Proteins
Presynaptic CB1 receptor-mediated control of the unusually long-lasting inhibitory inputs of principal cells distinguishes CB1/CCK-positive interneurons from parvalbumin-containing basket cells and contributes to their circuit-specific computational functions in neuronal ensemble formation (Freund and Katona 2007; Armstrong and Soltesz 2012; Bartos and Elgueta 2012). Novel experience alters endocannabinoid signaling and facilitates GABAergic inhibition in an activity-dependent manner in selected populations of principal cells that encode corresponding information traces (Hartzell et al. 2018; Sun et al. 2020). By setting the timing of activity of sparse neuronal ensembles, CB1/CCK-positive interneurons play an important role in establishing the proper balance between the discrimination and the generalization of memory traces (Sun et al. 2020). Intriguingly, impaired weighing between discrimination and generalization in perception and in other cognitively more complex processes such as social behavior culminates in over-selectivity and hypersociability that are core phenotypic features in autism spectrum disorders (Mottron et al. 2006; Brown and Bebko 2012; Church et al. 2015). Therefore, it is very important to highlight that de novo genetic lesions of NECAB2 are associated with idiopathic autism spectrum disorder (Sakai et al. 2011), whereas missense single nucleotide variants of NECAB1 are linked with developmental language disorders, a typical comorbidity in autism (Kornilov et al. 2016). Intriguingly, we also found in our in silico transcriptomic analysis of CB1/CCK-positive interneurons that Necabs expression levels show strong positive correlations with other autism-associated genes. For example, Cadps2 (Calcium-Dependent Secretion Activator 2), is a gene whose protein product controls neurotransmitter release and its genetic variants and splicing errors are highly implicated in autism spectrum disorders (Cisternas et al. 2003; Sadakata et al. 2007; Bonora et al. 2014). Moreover, Cxcl14 (C-X-C motif chemokine 14), a classifying gene for the largest population of CB1/CCK interneurons in both the hippocampus and isocortex (Harris et al. 2018; Yao et al. 2020) that encodes a chemokine regulating GABA release (Banisadr et al. 2011) is also among those genes whose expression is most affected in the dorsolateral prefrontal cortex of children with autism (Stoner et al. 2014).
In conclusion, our in silico and experimental anatomical findings unraveling NECAB1 and NECAB2 as prevalent calcium-binding proteins in CB1/CCK-positive interneurons together with the above genetic data and behavioral observations highlight the importance of Ca2+-signaling regulation in CB1/CCK-positive interneurons. We propose that a better understanding of the physiological functions of the two NECAB proteins and CB1/CCK-positive interneurons in general will also provide important insights into the aberrant circuit mechanism in autism spectrum disorders.
Notes
The authors are grateful to Dr E. Horváth, B. Pintér, E. Tischler for laboratory support and to Dr S. Prokop and M. Zöldi for their comments on the manuscript. The help of Drs L. Barna, C. Pongor, P. Vági, the Nikon Microscopy Center at the Institute of Experimental Medicine, Nikon Europe B.V., Nikon Austria GmbH and Auro-Science Consulting is acknowledged for kindly providing microscopy support. The authors are indebted to Dr Masahiko Watanabe, to the CURE Gastroenteric Biology Center, to K. Lengyel and Dr B. Hangya; to Drs N. Hájos, G. Nyíri, and P. Papp for providing antibodies against the CB1 cannabinoid receptor, CCK, PV, and GAD67 respectively. Conflict of Interest: The authors declare no conflict of interest.
Funding
New National Excellence Program of the Ministry of Human Capacities (ÚNKP-18-3); National Brain Research Program (2017-1.2.1-NKP-2017-00002); National Research, Development and Innovation Office, Hungary (Frontier Program 129961, KH124972); National Institutes of Health (R01NS099457, R01DA044925). I.K. also holds the Naus Family Chair in Addiction Sciences in the Department of Psychological and Brain Sciences at Indiana University Bloomington.
Supplementary Material
Contributor Information
Vivien Miczán, Momentum Laboratory of Molecular Neurobiology, Institute of Experimental Medicine, Budapest 1083, Hungary; Roska Tamás Doctoral School of Sciences and Technology, Faculty of Information Technology and Bionics, Pázmány Péter Catholic University, Budapest 1083, Hungary.
Krisztina Kelemen, Momentum Laboratory of Molecular Neurobiology, Institute of Experimental Medicine, Budapest 1083, Hungary; Department of Physiology, Faculty of Medicine, George Emil Palade University of Medicine, Pharmacy, Science and Technology of Târgu Mureș, Târgu Mureș 540142, Romania.
Judit R Glavinics, Momentum Laboratory of Molecular Neurobiology, Institute of Experimental Medicine, Budapest 1083, Hungary.
Zsófia I László, Momentum Laboratory of Molecular Neurobiology, Institute of Experimental Medicine, Budapest 1083, Hungary; Szentágothai János Doctoral School of Neuroscience, Semmelweis University, Budapest 1083, Hungary.
Benjámin Barti, Momentum Laboratory of Molecular Neurobiology, Institute of Experimental Medicine, Budapest 1083, Hungary; Szentágothai János Doctoral School of Neuroscience, Semmelweis University, Budapest 1083, Hungary.
Kata Kenesei, Momentum Laboratory of Molecular Neurobiology, Institute of Experimental Medicine, Budapest 1083, Hungary.
Máté Kisfali, Momentum Laboratory of Molecular Neurobiology, Institute of Experimental Medicine, Budapest 1083, Hungary.
István Katona, Momentum Laboratory of Molecular Neurobiology, Institute of Experimental Medicine, Budapest 1083, Hungary; Department of Psychological and Brain Sciences, Indiana University, Bloomington, IN 47405, USA.
References
- Ali AB, Todorova M. 2010. Asynchronous release of GABA via tonic cannabinoid receptor activation at identified interneuron synapses in rat CA1. Eur J Neurosci. 31:1196–1207. [DOI] [PubMed] [Google Scholar]
- Alpár A, Attems J, Mulder J, Hökfelt T, Harkany T. 2012. The renaissance of Ca2+-binding proteins in the nervous system: Secretagogin takes center stage. Cell Signal. 24:378–387. [DOI] [PMC free article] [PubMed] [Google Scholar]
- Aponte Y, Bischofberger J, Jonas P. 2008. Efficient Ca2+ buffering in fast-spiking basket cells of rat hippocampus. J Physiol. 586:2061–2075. [DOI] [PMC free article] [PubMed] [Google Scholar]
- Armstrong C, Soltesz I. 2012. Basket cell dichotomy in microcircuit function. J Physiol. 590:683–694. [DOI] [PMC free article] [PubMed] [Google Scholar]
- Ashburner M, Ball CA, Blake JA, Botstein D, Butler H, Cherry JM, Davis AP, Dolinski K, Dwight SS, Eppig JT et al. 2000. Gene ontology: tool for the unification of biology. Nat Genet. 25:25–29. [DOI] [PMC free article] [PubMed] [Google Scholar]
- Babcock H, Sigal YM, Zhuang X. 2012. A high-density 3D localization algorithm for stochastic optical reconstruction microscopy. Opt Nanoscopy. 1:1–10. [DOI] [PMC free article] [PubMed] [Google Scholar]
- Baddeley A, Turner R. 2005. Spatstat: an R package for analyzing spatial point patterns. J Stat Softw. 12:1–42. [Google Scholar]
- Baimbridge KG, Celio MR, Rogers JH. 1992. Calcium-binding proteins in the nervous system. Trends Neurosci. 15:303–308. [DOI] [PubMed] [Google Scholar]
- Banisadr G, Bhattacharyya BJ, Belmadani A, Izen SC, Ren D, Tran PB, Miller RJ. 2011. The chemokine BRAK/CXCL14 regulates synaptic transmission in the adult mouse dentate gyrus stem cell niche. J Neurochem. 119:1173–1182. [DOI] [PMC free article] [PubMed] [Google Scholar]
- Barna L, Dudok B, Miczán V, Horváth A, László ZI, Katona I. 2016. Correlated confocal and super-resolution imaging by VividSTORM. Nat Protoc. 11:163–183. [DOI] [PubMed] [Google Scholar]
- Bartos M, Elgueta C. 2012. Functional characteristics of parvalbumin- and cholecystokinin-expressing basket cells. J Physiol. 590:669–681. [DOI] [PMC free article] [PubMed] [Google Scholar]
- Bartos M, Vida I, Jonas P. 2007. Synaptic mechanisms of synchronized gamma oscillations in inhibitory interneuron networks. Nat Rev Neurosci. 8:45–56. [DOI] [PubMed] [Google Scholar]
- Bearzatto B, Servais L, Roussel C, Gall D, Baba-Aïssa F, Schurmans S, Kerchove d’Exaerde A, Cheron G, Schiffmann SN. 2006. Targeted calretinin expression in granule cells of calretininnull mice restores normal cerebellar functions. FASEB J. 20:380–382. [DOI] [PubMed] [Google Scholar]
- Bernier G, Vukovich W, Neidhardt L, Herrmann BG, Gruss P. 2001. Isolation and characterization of a downstream target of Pax6 in the mammalian retinal primordium. Development. 128:3987–3994. [DOI] [PubMed] [Google Scholar]
- Berridge MJ, Lipp P, Bootman MD. 2000. The versatility and universality of calcium signalling. Nat Rev Mol Cell Biol. 1:11–21. [DOI] [PubMed] [Google Scholar]
- Blatow M, Rozov A, Katona I, Hormuzdi SG, Meyer AH, Whittington MA, Caputi A, Monyer H. 2003. A novel network of multipolar bursting interneurons generates theta frequency oscillations in neocortex. Neuron. 38:805–817. [DOI] [PubMed] [Google Scholar]
- Bodor ÁL, Katona I, Nyíri G, Mackie K, Ledent C, Hájos N, Freund TF. 2005. Endocannabinoid signaling in rat somatosensory cortex: laminar differences and involvement of specific interneuron types. J Neurosci. 25:6845–6856. [DOI] [PMC free article] [PubMed] [Google Scholar]
- Bonora E, Graziano C, Minopoli F, Bacchelli E, Magini P, Diquigiovanni C, Lomartire S, Bianco F, Vargiolu M, Parchi P et al. 2014. Maternally inherited genetic variants of CADPS2 are present in autism spectrum disorders and intellectual disability patients. EMBO Mol Med. 6:795–809. [DOI] [PMC free article] [PubMed] [Google Scholar]
- Brown SM, Bebko JM. 2012. Generalization, overselectivity, and discrimination in the autism phenotype: a review. Res Autism Spectr Disord. 6:733–740. [Google Scholar]
- Canela L, Fernández-Dueñas V, Albergaria C, Watanabe M, Lluís C, Mallol J, Canela EI, Franco R, Luján R, Ciruela F. 2009. The association of metabotropic glutamate receptor type 5 with the neuronal Ca2+-binding protein 2 modulates receptor function. J Neurochem. 111:555–567. [DOI] [PubMed] [Google Scholar]
- Canela L, Luján R, Lluís C, Burgueño J, Mallol J, Canela EI, Franco R, Ciruela F. 2007. The neuronal Ca2+-binding protein 2 (NECAB2) interacts with the adenosine A2A receptor and modulates the cell surface expression and function of the receptor. Mol Cell Neurosci. 36:1–12. [DOI] [PubMed] [Google Scholar]
- Carbon S, Dietze H, Lewis SE, Mungall CJ, Munoz-Torres MC, Basu S, Chisholm RL, Dodson RJ, Fey P, Thomas PD et al. 2017. Expansion of the gene ontology knowledgebase and resources: the gene ontology consortium. Nucleic Acids Res. 45:D331–D338. [DOI] [PMC free article] [PubMed] [Google Scholar]
- Carbon S, Ireland A, Mungall CJ, Shu S, Marshall B, Lewis S, Lomax J, Mungall C, Hitz B, Balakrishnan R et al. 2009. AmiGO: online access to ontology and annotation data. Bioinformatics. 25:288–289. [DOI] [PMC free article] [PubMed] [Google Scholar]
- Cardin JA, Carlén M, Meletis K, Knoblich U, Zhang F, Deisseroth K, Tsai LH, Moore CI. 2009. Driving fast-spiking cells induces gamma rhythm and controls sensory responses. Nature. 459:663–667. [DOI] [PMC free article] [PubMed] [Google Scholar]
- Celio MR 1986. Parvalbumin in most γ-aminobutyric acid-containing neurons of the rat cerebral cortex. Science. 231:995–997. [DOI] [PubMed] [Google Scholar]
- Cheron G, Gall D, Servais L, Dan B, Maex R, Schiffmann SN. 2004. Inactivation of calcium-binding protein genes induces 160 Hz oscillations in the cerebellar cortex of alert mice. J Neurosci. 24:434–441. [DOI] [PMC free article] [PubMed] [Google Scholar]
- Christel CJ, Schaer R, Wang S, Henzi T, Kreiner L, Grabs D, Schwaller B, Lee A. 2012. Calretinin regulates Ca2+-dependent inactivation and facilitation of Cav2.1 Ca2+ channels through a direct interaction with the α12.1 subunit. J Biol Chem. 287:39766–39775. [DOI] [PMC free article] [PubMed] [Google Scholar]
- Chung DW, Fish KN, Lewis DA. 2016. Pathological basis for deficient excitatory drive to cortical parvalbumin interneurons in schizophrenia. Am J Psychiatry. 173:1131–1139. [DOI] [PMC free article] [PubMed] [Google Scholar]
- Church BA, Rice CL, Dovgopoly A, Lopata CJ, Thomeer ML, Nelson A, Mercado E. 2015. Learning, plasticity, and atypical generalization in children with autism. Psychon Bull Rev. 22:1342–1348. [DOI] [PubMed] [Google Scholar]
- Cisternas FA, Vincent JB, Scherer SW, Ray PN. 2003. Cloning and characterization of human CADPS and CADPS2, new members of the Ca2+-dependent activator for secretion protein family. Genomics. 81:279–291. [DOI] [PubMed] [Google Scholar]
- Cope DW, Maccaferri G, Márton LF, Roberts JDB, Cobden PM, Somogyi P. 2002. Cholecystokinin-immunopositive basket and Schaffer collateral-associated interneurones target different domains of pyramidal cells in the CA1 area of the rat hippocampus. Neuroscience. 109:63–80. [DOI] [PubMed] [Google Scholar]
- Daw MI, Tricoire L, Erdélyi F, Szabó G, McBain CJ. 2009. Asynchronous transmitter release from cholecystokinin-containing inhibitory interneurons is widespread and target-cell independent. J Neurosci. 29:11112–11122. [DOI] [PMC free article] [PubMed] [Google Scholar]
- DeFelipe J 1997. Types of neurons, synaptic connections and chemical characteristics of cells immunoreactive for calbindin-D28K, parvalbumin and calretinin in the neocortex. J Chem Neuroanat. 14:1–19. [DOI] [PubMed] [Google Scholar]
- DeFelipe J, Hendry SHC, Jones EG. 1989. Visualization of chandelier cell axons by parvalbumin immunoreactivity in monkey cerebral cortex. Proc Natl Acad Sci USA. 86:2093–2097. [DOI] [PMC free article] [PubMed] [Google Scholar]
- Dudok B, Barna L, Ledri M, Szabó SI, Szabadits E, Pintér B, Woodhams SG, Henstridge CM, Balla GY, Nyilas R et al. 2015. Cell-specific STORM super-resolution imaging reveals nanoscale organization of cannabinoid signaling. Nat Neurosci. 18:75–86. [DOI] [PMC free article] [PubMed] [Google Scholar]
- Eggermann E, Jonas P. 2012. How the “slow” Ca2+ buffer parvalbumin affects transmitter release in nanodomain-coupling regimes. Nat Neurosci. 15:20–22. [DOI] [PMC free article] [PubMed] [Google Scholar]
- Földy C, Darmanis S, Aoto J, Malenka RC, Quake SR, Südhof TC. 2016. Single-cell RNAseq reveals cell adhesion molecule profiles in electrophysiologically defined neurons. Proc Natl Acad Sci USA. 113:E5222–E5231. [DOI] [PMC free article] [PubMed] [Google Scholar]
- Freund TF, Buzsáki G. 1998. Interneurons of the hippocampus. Hippocampus. 6:347–470. [DOI] [PubMed] [Google Scholar]
- Freund TF, Katona I. 2007. Perisomatic inhibition. Neuron. 56:33–42. [DOI] [PubMed] [Google Scholar]
- Freund TF, Maglóczky Z, Soltész I, Somogyi P. 1986. Synaptic connections, axonal and dendritic patterns of neurons immunoreactive for cholecystokinin in the visual cortex of the cat. Neuroscience. 19:1133–1159. [DOI] [PubMed] [Google Scholar]
- Fuentealba P, Klausberger T, Karayannis T, Suen WY, Huck J, Tomioka R, Rockland K, Capogna M, Studer M, Morales M et al. 2010. Expression of COUP-TFII nuclear receptor in restricted gabaergic neuronal populations in the adult rat hippocampus. J Neurosci. 30:1595–1609. [DOI] [PMC free article] [PubMed] [Google Scholar]
- Fukudome Y, Ohno-Shosaku T, Matsui M, Omori Y, Fukaya M, Tsubokawa H, Taketo MM, Watanabe M, Manabe T, Kano M. 2004. Two distinct classes of muscarinic action on hippocampal inhibitory synapses: M2-mediated direct suppression and M1/M 3-mediated indirect suppression through endocannabinoid signalling. Eur J Neurosci. 19:2682–2692. [DOI] [PubMed] [Google Scholar]
- Fuzik J, Zeisel A, Mate Z, Calvigioni D, Yanagawa Y, Szabo G, Linnarsson S, Harkany T. 2016. Integration of electrophysiological recordings with single-cell RNA-seq data identifies neuronal subtypes. Nat Biotechnol. 34:175–183. [DOI] [PMC free article] [PubMed] [Google Scholar]
- Gall D, Roussel C, Susa I, D’Angelo E, Rossi P, Bearzatto B, Galas MC, Blum D, Schurmans S, Schiffmann SN. 2003. Altered neuronal excitability in cerebellar granule cells of mice lacking calretinin. J Neurosci. 23:9320–9327. [DOI] [PMC free article] [PubMed] [Google Scholar]
- Girard F, Venail J, Schwaller B, Celio MR. 2015. The EF-hand Ca2+-binding protein super-family: a genome-wide analysis of gene expression patterns in the adult mouse brain. Neuroscience. 294:116–155. [DOI] [PubMed] [Google Scholar]
- Goldberg JH, Tamas G, Aronov D, Yuste R. 2003. Calcium microdomains in aspiny dendrites. Neuron. 40:807–821. [DOI] [PubMed] [Google Scholar]
- Greenwood RS, Godar SE, Reaves TA, Hayward JN. 1981. Cholecystokinin in hippocampal pathways. J Comp Neurol. 203:335–350. [DOI] [PubMed] [Google Scholar]
- Gulyás AI, Freund TF. 1996. Pyramidal cell dendrites are the primary targets of calbindin D28k-immunoreactive interneurons in the hippocampus. Hippocampus. 6:525–534. [DOI] [PubMed] [Google Scholar]
- Gulyás AI, Hájos N, Freund TF. 1996. Interneurons containing calretinin are specialized to control other interneurons in the rat hippocampus. J Neurosci. 16:3397–3411. [DOI] [PMC free article] [PubMed] [Google Scholar]
- Gulyás AI, Megías M, Emri Z, Freund TF. 1999. Total number and ratio of excitatory and inhibitory synapses converging onto single interneurons of different types in the CA1 area of the rat hippocampus. J Neurosci. 19:10082–10097. [DOI] [PMC free article] [PubMed] [Google Scholar]
- Gulyás AI, Szabó GG, Ulbert I, Holderith N, Monyer H, Erdélyi F, Szabó G, Freund TF, Hájos N. 2010. Parvalbumin-containing fast-spiking basket cells generate the field potential oscillations induced by cholinergic receptor activation in the hippocampus. J Neurosci. 30:15134–15145. [DOI] [PMC free article] [PubMed] [Google Scholar]
- Gulyás AI, Tóth K, Dános P, Freund TF. 1991. Subpopulations of GABAergic neurons containing parvalbumin, calbindin D28k, and cholecystokinin in the rat hippocampus. J Comp Neurol. 312:371–378. [DOI] [PubMed] [Google Scholar]
- Habib N, Li Y, Heidenreich M, Swiech L, Avraham-Davidi I, Trombetta JJ, Hession C, Zhang F, Regev A. 2016. Div-Seq: single-nucleus RNA-seq reveals dynamics of rare adult newborn neurons. Science. 353:925–928. [DOI] [PMC free article] [PubMed] [Google Scholar]
- Harris KD, Hochgerner H, Skene NG, Magno L, Katona L, Bengtsson Gonzales C, Somogyi P, Kessaris N, Linnarsson S, Hjerling-Leffler J. 2018. Classes and continua of hippocampal CA1 inhibitory neurons revealed by single-cell transcriptomics. PLoS Biol. 16:1–37. [DOI] [PMC free article] [PubMed] [Google Scholar]
- Harris KM, Marshall PE, Landis DMD. 1985. Ultrastructural study of cholecystokinin-immunoreactive cells and processes in area CA1 of the rat hippocampus. J Comp Neurol. 233:147–158. [DOI] [PubMed] [Google Scholar]
- Hartzell AL, Martyniuk KM, Brigidi GS, Heinz DA, Djaja NA, Payne A, Bloodgood BL. 2018. NPAS4 recruits CCK basket cell synapses and enhances cannabinoid-sensitive inhibition in the mouse hippocampus. Elife. 7:1–24. [DOI] [PMC free article] [PubMed] [Google Scholar]
- Hefft S, Jonas P. 2005. Asynchronous GABA release generates long-lasting inhibition at a hippocampal interneuron-principal neuron synapse. Nat Neurosci. 8:1319–1328. [DOI] [PubMed] [Google Scholar]
- Heilemann M, Van De Linde S, Schüttpelz M, Kasper R, Seefeldt B, Mukherjee A, Tinnefeld P, Sauer M. 2008. Subdiffraction-resolution fluorescence imaging with conventional fluorescent probes. Angew Chemie Int Ed. 47:6172–6176. [DOI] [PubMed] [Google Scholar]
- Hendry SHC, Jones EG, Emson PC, Lawson DEM, Heizmann CW, Streit P. 1989. Two classes of cortical GABA neurons defined by differential calcium binding protein immunoreactivities. Exp Brain Res. 76:467–472. [DOI] [PubMed] [Google Scholar]
- Hodge RD, Bakken TE, Miller JA, Smith KA, Barkan ER, Graybuck LT, Close JL, Long B, Johansen N, Penn O et al. 2019. Conserved cell types with divergent features in human versus mouse cortex. Nature. 573:61–68. [DOI] [PMC free article] [PubMed] [Google Scholar]
- Holden SJ, Uphoff S, Kapanidis AN. 2011. DAOSTORM: an algorithm for high-density super-resolution microscopy. Nat Methods. 8:279–280. [DOI] [PubMed] [Google Scholar]
- Huang B, Wang W, Bates M, Zhuang X. 2008. Three-dimensional super-resolution imaging by stochastic optical reconstruction microscopy. Science. 319:810–813. [DOI] [PMC free article] [PubMed] [Google Scholar]
- Katona I, Rancz EA, Acsády L, Ledent C, Mackie K, Hájos N, Freund TF. 2001. Distribution of CB1 cannabinoid receptors in the amygdala and their role in the control of GABAergic transmission. J Neurosci. 21:9506–9518. [DOI] [PMC free article] [PubMed] [Google Scholar]
- Katona I, Sperlágh B, Sík A, Käfalvi A, Vizi ES, Mackie K, Freund TF. 1999. Presynaptically located CB1 cannabinoid receptors regulate GABA release from axon terminals of specific hippocampal interneurons. J Neurosci. 19:4544–4558. [DOI] [PMC free article] [PubMed] [Google Scholar]
- Katona I, Urbán GM, Wallace M, Ledent C, Jung KM, Piomelli D, Mackie K, Freund TF. 2006. Molecular composition of the endocannabinoid system at glutamatergic synapses. J Neurosci. 26:5628–5637. [DOI] [PMC free article] [PubMed] [Google Scholar]
- Katsumaru H, Kosaka T, Heizmann CW, Hama K. 1988. Immunocytochemical study of GABAergic neurons containing the calcium-binding protein parvalbumin in the rat hippocampus. Exp Brain Res. 72:347–362. [DOI] [PubMed] [Google Scholar]
- Kawaguchi Y, Kubota Y. 1997. GABAergic cell subtypes and their synaptic connections in rat frontal cortex. Cereb Cortex. 7:476–486. [DOI] [PubMed] [Google Scholar]
- Kawasaki H, Kretsinger RH. 2017. Structural and functional diversity of EF-hand proteins: evolutionary perspectives. Protein Sci. 26:1898–1920. [DOI] [PMC free article] [PubMed] [Google Scholar]
- Kisfali M, Lorincz T, Vizi ES. 2013. Comparison of Ca2+ transients and [Ca2+]i in the dendrites and boutons of non-fast-spiking GABAergic hippocampal interneurons using two-photon laser microscopy and high- and low-affinity dyes. J Physiol. 591:5541–5553. [DOI] [PMC free article] [PubMed] [Google Scholar]
- Klausberger T, Marton LF, O’Neill J, Huck JHJ, Dalezios Y, Fuentealba P, Suen WY, Papp E, Kaneko T, Watanabe M et al. 2005. Complementary roles of cholecystokinin- and parvalbumin-expressing GABAergic neurons in hippocampal network oscillations. J Neurosci. 25:9782–9793. [DOI] [PMC free article] [PubMed] [Google Scholar]
- Klausberger T, Somogyi P. 2008. Neuronal diversity and temporal dynamics: the unity of hippocampal circuit operations. Science. 321:53–57. [DOI] [PMC free article] [PubMed] [Google Scholar]
- Kornilov SA, Rakhlin N, Koposov R, Lee M, Yrigollen C, Caglayan AO, Magnuson JS, Mane S, Chang JT, Grigorenko EL. 2016. Genome-wide association and exome sequencing study of language disorder in an isolated population. Pediatrics. 137:20152469–20152469. [DOI] [PMC free article] [PubMed] [Google Scholar]
- Kosaka T, Katsumaru H, Hama K, Wu JY, Heizmann CW. 1987. GABAergic neurons containing the Ca2+-binding protein parvalbumin in the rat hippocampus and dentate gyrus. Brain Res. 419:119–130. [DOI] [PubMed] [Google Scholar]
- Kubota Y, Kawaguchi Y. 1997. Two distinct subgroups of cholecystokinin-immunoreactive cortical interneurons. Brain Res. 752:175–183. [DOI] [PubMed] [Google Scholar]
- Kvitsiani D, Ranade S, Hangya B, Taniguchi H, Huang JZ, Kepecs A. 2013. Distinct behavioural and network correlates of two interneuron types in prefrontal cortex. Nature. 498:363–366. [DOI] [PMC free article] [PubMed] [Google Scholar]
- Lasztóczi B, Tukker JJ, Somogyi P, Klausberger T. 2011. Terminal field and firing selectivity of cholecystokinin-expressing interneurons in the hippocampal CA3 area. J Neurosci. 31:18073–18093. [DOI] [PMC free article] [PubMed] [Google Scholar]
- Lee SH, Földy C, Soltesz I. 2010. Distinct endocannabinoid control of GABA release at perisomatic and dendritic synapses in the hippocampus. J Neurosci. 30:7993–8000. [DOI] [PMC free article] [PubMed] [Google Scholar]
- Lee SH, Ledri M, Tóth B, Marchionni I, Henstridge CM, Dudok B, Kenesei K, Barna L, Szabó SI, Renkecz T et al. 2015. Multiple forms of endocannabinoid and endovanilloid signaling regulate the tonic control of GABA release. J Neurosci. 35:10039–10057. [DOI] [PMC free article] [PubMed] [Google Scholar]
- Liu Y, Beyer A, Aebersold R. 2016. On the dependency of cellular protein levels on mRNA abundance. Cell. 165:535–550. [DOI] [PubMed] [Google Scholar]
- Lőrincz T, Kisfali M, Lendvai B, Sylvester VE. 2016. Phenotype-dependent Ca2+ dynamics in single boutons of various anatomically identified GABAergic interneurons in the rat hippocampus. Eur J Neurosci. 43:536–547. [DOI] [PMC free article] [PubMed] [Google Scholar]
- Marquez-Neila P, Baumela L, Alvarez L. 2014. A morphological approach to curvature-based evolution of curves and surfaces. IEEE Trans Pattern Anal Mach Intell. 36:2–17. [DOI] [PubMed] [Google Scholar]
- Marsicano G, Lutz B. 1999. Expression of the cannabinoid receptor CB1 in distinct neuronal subpopulations in the adult mouse forebrain. Eur J Neurosci. 11:4213–4225. [DOI] [PubMed] [Google Scholar]
- Märtin A, Calvigioni D, Tzortzi O, Fuzik J, Wärnberg E, Meletis K. 2019. A spatiomolecular map of the striatum. Cell Rep. 29:4320–4333.e5. [DOI] [PubMed] [Google Scholar]
- Mascagni F, McDonald AJ. 2003. Immunohistochemical characterization of cholecystokinin containing neurons in the rat basolateral amygdala. Brain Res. 976:171–184. [DOI] [PubMed] [Google Scholar]
- McDonald AJ, Mascagni F. 2001. Localization of the CB1 type cannabinoid receptor in the rat basolateral amygdala: high concentrations in a subpopulation of cholecystokinin-containing interneurons. Neuroscience. 107:641–652. [DOI] [PubMed] [Google Scholar]
- Monory K, Massa F, Egertová M, Eder M, Blaudzun H, Westenbroek R, Kelsch W, Jacob W, Marsch R, Ekker M et al. 2006. The endocannabinoid system controls key epileptogenic circuits in the hippocampus. Neuron. 51:455–466. [DOI] [PMC free article] [PubMed] [Google Scholar]
- Mottron L, Dawson M, Soulières I, Hubert B, Burack J. 2006. Enhanced perceptual functioning in autism: an update, and eight principles of autistic perception. J Autism Dev Disord. 36:27–43. [DOI] [PubMed] [Google Scholar]
- Nery S, Fishell G, Corbin JG. 2002. The caudal ganglionic eminence is a source of distinct cortical and subcortical cell populations. Nat Neurosci. 5:1279–1287. [DOI] [PubMed] [Google Scholar]
- Nguyen R, Venkatesan S, Binko M, Bang JY, Cajanding JD, Briggs C, Sargin D, Imayoshi I, Lambe EK, Kim JC. 2020. Cholecystokinin-expressing interneurons of the medial prefrontal cortex mediate working memory retrieval. J Neurosci. 40:2314–2331. [DOI] [PMC free article] [PubMed] [Google Scholar]
- Nunzi MG, Gorio A, Milan F, Freund TF, Somogyi P, Smith AD. 1985. Cholecystokinin-immunoreactive cells form symmetrical synaptic contacts with pyramidal and nonpyramidal neurons in the hippocampus. J Comp Neurol. 237:485–505. [DOI] [PubMed] [Google Scholar]
- Paul A, Crow M, Raudales R, He M, Gillis J, Huang ZJ. 2017. Transcriptional architecture of synaptic communication delineates GABAergic neuron identity. Cell. 171:522–539.e20. [DOI] [PMC free article] [PubMed] [Google Scholar]
- Pelkey KA, Calvigioni D, Fang C, Vargish G, Ekins T, Auville K, Wester JC, Lai M, Scott CMG, Yuan X et al. 2020. Paradoxical network excitation by glutamate release from VGluT3+ GABAergic interneurons. Elife. 9:1–26. [DOI] [PMC free article] [PubMed] [Google Scholar]
- Pelkey KA, Chittajallu R, Craig MT, Tricoire L, Wester JC, McBain CJ. 2017. Hippocampal gabaergic inhibitory interneurons. Physiol Rev. 97:1619–1747. [DOI] [PMC free article] [PubMed] [Google Scholar]
- Plummer NW, Evsyukova IY, Robertson SD, de Marchena J, Tucker CJ, Jensen P. 2015. Expanding the power of recombinase-based labeling to uncover cellular diversity. Dev. 142:4385–4393. [DOI] [PMC free article] [PubMed] [Google Scholar]
- Poncer JC, McKinney RA, Gähwiler BH, Thompson SM. 1997. Either N- or P-type calcium channels mediate GABA release at distinct hippocampal inhibitory synapses. Neuron. 18:463–472. [DOI] [PubMed] [Google Scholar]
- Rovira-Esteban L, Gunduz-Cinar O, Bukalo O, Limoges A, Brockway E, Müller K, Fenno L, Kim YS, Ramakrishnan C, Andrási T et al. 2019. Excitation of diverse classes of cholecystokinin interneurons in the basal amygdala facilitates fear extinction. eNeuro. 6:1–15. [DOI] [PMC free article] [PubMed] [Google Scholar]
- Rovira-Esteban L, Péterfi Z, Vikór A, Máté Z, Szabó G, Hájos N. 2017. Morphological and physiological properties of CCK/CB1R-expressing interneurons in the basal amygdala. Brain Struct Funct. 222:3543–3565. [DOI] [PubMed] [Google Scholar]
- Rózsa B, Zelles T, Vizi ES, Lendvai B. 2004. Distance-dependent scaling of calcium transients evoked by Backpropagating spikes and synaptic activity in dendrites of hippocampal interneurons. J Neurosci. 24:661–670. [DOI] [PMC free article] [PubMed] [Google Scholar]
- Sadakata T, Washida M, Iwayama Y, Shoji S, Sato Y, Ohkura T, Katoh-Semba R, Nakajima M, Sekine Y, Tanaka M et al. 2007. Autistic-like phenotypes in Cadps2-knockout mice and aberrant CADPS2 splicing in autistic patients. J Clin Invest. 117:931–943. [DOI] [PMC free article] [PubMed] [Google Scholar]
- Sakai Y, Shaw CA, Dawson BC, Dugas DV, Al-Mohtaseb Z, Hill DE, Zoghbi HY. 2011. Protein interactome reveals converging molecular pathways among autism disorders. Sci Transl Med. 3:49. [DOI] [PMC free article] [PubMed] [Google Scholar]
- Saunders A, Macosko EZ, Wysoker A, Goldman M, Krienen FM, de Rivera H, Bien E, Baum M, Bortolin L, Wang S et al. 2018. Molecular diversity and specializations among the cells of the adult mouse brain. Cell. 174:1015–1030.e16. [DOI] [PMC free article] [PubMed] [Google Scholar]
- Schiffmann SN, Cheron G, Lohof A, D’Alcantara P, Meyer M, Parmentier M, Schurmans S. 1999. Impaired motor coordination and Purkinje cell excitability in mice lacking calretinin. Proc Natl Acad Sci USA. 96:5257–5262. [DOI] [PMC free article] [PubMed] [Google Scholar]
- Schmidt H 2012. Three functional facets of calbindin D-28k. Front Mol Neurosci. 5:1–7. [DOI] [PMC free article] [PubMed] [Google Scholar]
- Schöndorf DC, Aureli M, McAllister FE, Hindley CJ, Mayer F, Schmid B, Sardi SP, Valsecchi M, Hoffmann S, Schwarz LK et al. 2014. IPSC-derived neurons from GBA1-associated Parkinson’s disease patients show autophagic defects and impaired calcium homeostasis. Nat Commun. 5:4028. [DOI] [PubMed] [Google Scholar]
- Schwaller B 2014. Calretinin: from a “simple” Ca2+ buffer to a multifunctional protein implicated in many biological processes. Front Neuroanat. 8:1–7. [DOI] [PMC free article] [PubMed] [Google Scholar]
- Schwaller B 2020. Cytosolic Ca2+ buffers are inherently Ca2+ signal modulators. Cold Spring Harb Perspect Biol. 12:1–24. [DOI] [PMC free article] [PubMed] [Google Scholar]
- Sharma K, Schmitt S, Bergner CG, Tyanova S, Kannaiyan N, Manrique-Hoyos N, Kongi K, Cantuti L, Hanisch UK, Philips MA et al. 2015. Cell type- and brain region-resolved mouse brain proteome. Nat Neurosci. 18:1819–1831. [DOI] [PMC free article] [PubMed] [Google Scholar]
- Sohal VS, Zhang F, Yizhar O, Deisseroth K. 2009. Parvalbumin neurons and gamma rhythms enhance cortical circuit performance. Nature. 459:698–702. [DOI] [PMC free article] [PubMed] [Google Scholar]
- Sommeijer JP, Levelt CN. 2012. Synaptotagmin-2 is a reliable marker for parvalbumin positive inhibitory boutons in the mouse visual cortex. PLoS One. 7:1–12. [DOI] [PMC free article] [PubMed] [Google Scholar]
- Somogyi J, Baude A, Omori Y, Shimizu H, El Mestikawy S, Fukaya M, Shigemoto R, Watanabe M, Somogyi P. 2004. GABAergic basket cells expressing cholecystokinin contain vesicular glutamate transporter type 3 (VGLUT3) in their synaptic terminals in hippocampus and isocortex of the rat. Eur J Neurosci. 19:552–569. [DOI] [PubMed] [Google Scholar]
- Steindel F, Lerner R, Häring M, Ruehle S, Marsicano G, Lutz B, Monory K. 2013. Neuron-type specific cannabinoid-mediated G protein signalling in mouse hippocampus. J Neurochem. 124:795–807. [DOI] [PubMed] [Google Scholar]
- Stoner R, Chow ML, Boyle MP, Sunkin SM, Mouton PR, Roy S, Wynshaw-Boris A, Colamarino SA, Lein ES, Courchesne E. 2014. Patches of disorganization in the neocortex of children with autism. N Engl J Med. 370:1209–1219. [DOI] [PMC free article] [PubMed] [Google Scholar]
- Sugita S, Ho A, Südhof TC. 2002. NECABs: a family of neuronal Ca2+-binding proteins with an unusual domain structure and a restricted expression pattern. Neuroscience. 112:51–63. [DOI] [PubMed] [Google Scholar]
- Sun X, Bernstein MJ, Meng M, Rao S, Sørensen AT, Yao L, Zhang X, Anikeeva PO, Lin Y. 2020. Functionally distinct neuronal ensembles within the memory engram. Cell. 181:410–423.e17. [DOI] [PMC free article] [PubMed] [Google Scholar]
- Szabó GG, Lenkey N, Holderith N, Andrási T, Nusser Z, Hájos N. 2014a. Presynaptic calcium channel inhibition underlies CB1 cannabinoid receptor-mediated suppression of GABA release. J Neurosci. 34:7958–7963. [DOI] [PMC free article] [PubMed] [Google Scholar]
- Szabó GG, Papp OI, Máté Z, Szabó G, Hájos N. 2014b. Anatomically heterogeneous populations of CB1 cannabinoid receptor-expressing interneurons in the CA3 region of the hippocampus show homogeneous input-output characteristics. Hippocampus. 24:1506–1523. [DOI] [PubMed] [Google Scholar]
- Takács VT, Szőnyi A, Freund TF, Nyiri G, Gulyás AI. 2015. Quantitative ultrastructural analysis of basket and axo-axonic cell terminals in the mouse hippocampus. Brain Struct Funct. 220:919–940. [DOI] [PubMed] [Google Scholar]
- Tasic B, Menon V, Nguyen TN, Kim TK, Jarsky T, Yao Z, Levi B, Gray LT, Sorensen SA, Dolbeare T et al. 2016. Adult mouse cortical cell taxonomy revealed by single cell transcriptomics. Nat Neurosci. 19:335–346. [DOI] [PMC free article] [PubMed] [Google Scholar]
- Tóth K, Erőss L, Vajda J, Halász P, Freund TF, Maglóczky Z. 2010. Loss and reorganization of calretinin-containing interneurons in the epileptic human hippocampus. Brain. 133:2763–2777. [DOI] [PMC free article] [PubMed] [Google Scholar]
- Tóth K, Freund TF. 1992. Calbindin D28k-containing nonpyramidal cells in the rat hippocampus: their immunoreactivity for GABA and projection to the medial septum. Neuroscience. 49:793–805. [DOI] [PubMed] [Google Scholar]
- Touzot A, Ruiz-Reig N, Vitalis T, Studer M. 2016. Molecular control of two novel migratory paths for CGE-derived interneurons in the developing mouse brain. Dev. 143:1753–1765. [DOI] [PubMed] [Google Scholar]
- Tremblay R, Lee S, Rudy B. 2016. GABAergic interneurons in the neocortex: from cellular properties to circuits. Neuron. 91:260–292. [DOI] [PMC free article] [PubMed] [Google Scholar]
- Tsou K, Mackie K, Sañudo-Peña MC, Walker JM. 1999. Cannabinoid CB1 receptors are localized primarily on cholecystokinin-containing GABAergic interneurons in the rat hippocampal formation. Neuroscience. 93:969–975. [DOI] [PubMed] [Google Scholar]
- Unal G, Joshi A, Viney TJ, Kis V, Somogyi P. 2015. Synaptic targets of medial septal projections in the hippocampus and extrahippocampal cortices of the mouse. J Neurosci. 35:15812–15826. [DOI] [PMC free article] [PubMed] [Google Scholar]
- Vida I, Halasy K, Szinyei C, Somogyi P, Buhl EH. 1998. Unitary IPSPs evoked by interneurons at the stratum radiatum-stratum lacunosum-moleculare border in the CA1 area of the rat hippocampus in vitro. J Physiol. 506:755–773. [DOI] [PMC free article] [PubMed] [Google Scholar]
- Vieth B, Parekh S, Ziegenhain C, Enard W, Hellmann I. 2019. A systematic evaluation of single cell RNA-seq analysis pipelines. Nat Commun. 10:1–11. [DOI] [PMC free article] [PubMed] [Google Scholar]
- Viney TJ, Lasztoczi B, Katona L, Crump MG, Tukker JJ, Klausberger T, Somogyi P. 2013. Network state-dependent inhibition of identified hippocampal CA3 axo-axonic cells in vivo. Nat Neurosci. 16:1802–1811. [DOI] [PMC free article] [PubMed] [Google Scholar]
- Wang F, Flanagan J, Su N, Wang LC, Bui S, Nielson A, Wu X, Vo HT, Ma XJ, Luo Y. 2012. RNAscope: a novel in situ RNA analysis platform for formalin-fixed, paraffin-embedded tissues. J Mol Diagnostics. 14:22–29. [DOI] [PMC free article] [PubMed] [Google Scholar]
- Wang T, Li B, Nelson CE, Nabavi S. 2019. Comparative analysis of differential gene expression analysis tools for single-cell RNA sequencing data. BMC Bioinformatics. 20:1–16. [DOI] [PMC free article] [PubMed] [Google Scholar]
- Whissell PD, Cajanding JD, Fogel N, Kim JC. 2015. Comparative density of CCK- and PV-GABA cells within the cortex and hippocampus. Front Neuroanat. 9:1–16. [DOI] [PMC free article] [PubMed] [Google Scholar]
- Wilson RI, Kunos G, Nicoll RA. 2001. Presynaptic specificity of endocannabinoid signaling in the hippocampus. Neuron. 31:453–462. [DOI] [PubMed] [Google Scholar]
- Wittner L, Eross L, Szabó Z, Tóth S, Czirják S, Halász P, Freund TF, Maglóczky Z. 2002. Synaptic reorganization of calbindin-positive neurons in the human hippocampal CA1 region in temporal lobe epilepsy. Neuroscience. 115:961–978. [DOI] [PubMed] [Google Scholar]
- Wittner L, Maglóczky Z, Borhegyi Z, Halász P, Tóth S, Eross L, Szabó Z, Freund TF. 2001. Preservation of perisomatic inhibitory input of granule cells in the epileptic human dentate gyrus. Neuroscience. 108:587–600. [DOI] [PubMed] [Google Scholar]
- Wu H, Li D, Shan Y, Wan B, Hexige S, Guo J, Wu C, Yu L. 2007. EFCBP1/NECAB1, a brain-specifically expressed gene with highest abundance in temporal lobe, encodes a protein containing EF-hand and antibiotic biosynthesis monooxygenase domains. DNA Seq. 18:73–79. [DOI] [PubMed] [Google Scholar]
- Yao Z, Nguyen TN, van Velthoven CTJ, Goldy J, Sedeno-Cortes AE, Baftizadeh F, Bertagnolli D, Casper T, Crichton K, Ding S-L et al. 2020. A taxonomy of transcriptomic cell types across the isocortex and hippocampal formation. bioRxiv. 2020.03.30.015214. [DOI] [PMC free article] [PubMed] [Google Scholar]
- Zeisel A, Hochgerner H, Lönnerberg P, Johnsson A, Memic F, van der Zwan J, Häring M, Braun E, Borm LE, La Manno G et al. 2018. Molecular architecture of the mouse nervous system. Cell. 174:999–1014.e22. [DOI] [PMC free article] [PubMed] [Google Scholar]
- Zeisel A, Moz-Manchado AB, Codeluppi S, Lönnerberg P, La MG, Juréus A, Marques S, Munguba H, He L, Betsholtz C et al. 2015. Cell types in the mouse cortex and hippocampus revealed by single-cell RNA-seq. Science. 347:1138–1142. [DOI] [PubMed] [Google Scholar]
- Zhang M-D, Barde S, Szodorai E, Josephson A, Mitsios N, Watanabe M, Attems J, Lubec G, Kovács GG, Uhlén M et al. 2016. Comparative anatomical distribution of neuronal calcium-binding protein (NECAB)-1 and -2 in rodent and human spinal cord. Brain Struct Funct. 221:3803–3823. [DOI] [PubMed] [Google Scholar]
- Zhang MD, Su J, Adori C, Cinquina V, Malenczyk K, Girach F, Peng C, Ernfors P, Löw P, Borgius L et al. 2018. Ca2+-binding protein NECAB2 facilitates inflammatory pain hypersensitivity. J Clin Invest. 128:3757–3768. [DOI] [PMC free article] [PubMed] [Google Scholar]
- Zhang MD, Tortoriello G, Hsueh B, Tomer R, Ye L, Mitsios N, Borgius L, Grant G, Kiehn O, Watanabe M et al. 2014. Neuronal calcium-binding proteins 1/2 localize to dorsal root ganglia and excitatory spinal neurons and are regulated by nerve injury. Proc Natl Acad Sci USA. 111:1149–1158. [DOI] [PMC free article] [PubMed] [Google Scholar]
- Zimmermann B, Girard F, Mészàr Z, Celio MR. 2013. Expression of the calcium binding proteins Necab-1, -2 and -3 in the adult mouse hippocampus and dentate gyrus. Brain Res. 1528:1–7. [DOI] [PubMed] [Google Scholar]
Associated Data
This section collects any data citations, data availability statements, or supplementary materials included in this article.