

Abstract
Tremor is a core feature of Parkinson’s disease and the most easily recognized Parkinsonian sign. Nonetheless, its pathophysiology remains poorly understood. Here, we show that multispectral spiking activity in the posterior-dorso-lateral oscillatory (motor) region of the subthalamic nucleus distinguishes resting tremor from the other Parkinsonian motor signs and strongly correlates with its severity. We evaluated microelectrode-spiking activity from the subthalamic dorsolateral oscillatory region of 70 Parkinson’s disease patients who underwent deep brain stimulation surgery (114 subthalamic nuclei, 166 electrode trajectories). We then investigated the relationship between patients’ clinical Unified Parkinson’s Disease Rating Scale score and their peak theta (4–7 Hz) and beta (13–30 Hz) powers. We found a positive correlation between resting tremor and theta activity (r = 0.41, P < 0.01) and a non-significant negative correlation with beta activity (r = −0.2, P = 0.5). Hypothesizing that the two neuronal frequencies mask each other’s relationship with resting tremor, we created a non-linear model of their proportional spectral powers and investigated its relationship with resting tremor. As hypothesized, patients’ proportional scores correlated better than either theta or beta alone (r = 0.54, P < 0.001). However, theta and beta oscillations were frequently temporally correlated (38/70 patients manifested significant positive temporal correlations and 1/70 exhibited significant negative correlation between the two frequency bands). When comparing theta and beta temporal relationship (r θ β) to patients’ resting tremor scores, we found a significant negative correlation between the two (r = −0.38, P < 0.01). Patients manifesting a positive correlation between the two bands (i.e. theta and beta were likely to appear simultaneously) were found to have lower resting tremor scores than those with near-zero correlation values (i.e. theta and beta were likely to appear separately). We therefore created a new model incorporating patients’ proportional theta–beta power and r θ βscores to obtain an improved neural correlate of resting tremor (r = 0.62, P < 0.001). We then used the Akaike and Bayesian information criteria for model selection and found the multispectral model, incorporating theta–beta proportional power and their correlation, to be the best fitting model, with 0.96 and 0.89 probabilities, respectively. Here we found that as theta increases, beta decreases and the two appear separately—resting tremor is worsened. Our results therefore show that theta and beta convey information about resting tremor in opposite ways. Furthermore, the finding that theta and beta coactivity is negatively correlated with resting tremor suggests that theta–beta non-linear scale may be a valuable biomarker for Parkinson’s resting tremor in future adaptive deep brain stimulation techniques.
Keywords: beta oscillations, Parkinson’s disease, subthalamic nucleus, theta oscillations, tremor
We found Parkinson’s disease resting tremor to be strongly correlated with subthalamic theta–beta activity scale. Furthermore, theta–beta coactivity was found to be negatively correlated with this symptom. Thus, our results show that resting tremor worsens as subthalamic theta activity increases and beta decreases.
Graphical Abstract
Graphical Abstract.

Introduction
Four major groups of signs characterize the motor deficits observed in Parkinson’s disease: loss/slowness of automatic movement (akinesia/bradykinesia), muscle stiffness (rigidity), tremor and postural instability with gait deficits. Nonetheless, the disease’s clinical phenotype is quite heterogeneous, with different signs more or less prominent or even absent in individual patients (Von Coelln and Shulman, 2016). To better understand this heterogeneity, studies have explored the interrelationships between signs and have identified two subtypes of patients: tremor-dominant and postural instability with gait deficits, also dominated by bradykinesia and rigidity (Marras and Lang, 2013; Thenganatt and Jankovic, 2014).
Over the years, accumulating evidence suggests that tremor signs are independent of the other Parkinsonian motor signs (Stochl et al., 2008; Helmich et al., 2012). In addition, extensive clinical data indicate that the different subtypes have different clinical courses. Not only do tremor-dominant patients show slower disease progression and less cognitive decline, but their neuropathology seems to be different than that of the postural instability with gait deficits group (Eggers et al., 2011). Furthermore, the tremor response to dopamine therapy is more erratic than the response of patients with akinetic-rigid signs (Sotelo, 1997). Less consistently, some single-photon emission computed tomography studies have described higher striatal dopamine uptake in tremor-dominant patients (Spiegel et al., 2007), whereas others have reported no significant difference between the tremor-dominant and postural instability with gait deficits subtypes (Lee et al., 2019). Recent research indicates that Parkinson’s motor subtypes are not fixed and that patients’ subtype may change with disease progression and treatment (Luo et al., 2019). Nonetheless, patients’ resting tremor (ResT) signs seem to be independent of the non-tremor signs regardless of subtype.
Parkinsonian signs have been found to correlate with specific neural oscillatory activity, specifically in the cortex and basal ganglia (Kühn et al., 2006; Chen et al., 2010; Contarino et al., 2012; Little et al., 2012; Beudel et al., 2017; Hirschmann et al., 2017). The subthalamic nucleus (STN), which is one of the major input nuclei to the basal ganglia (Deffains et al., 2016), is believed to be at the core of Parkinson’s pathophysiology (Deffains et al., 2016, 2018). Its posterior-dorso-lateral region is characterized by increased oscillatory activity, especially in the theta and beta bands (Kühn et al., 2005; Weinberger et al., 2006; Trottenberg et al., 2007; Zaidel et al., 2009, 2010; Contarino et al., 2012). Anatomic and neurophysiological data suggest that the STN posterior-dorso-lateral region subserves sensory-motor functions (Monakow et al., 1978; Nambu et al., 1996; Rodriguez-Oroz et al., 2001; Romanelli et al., 2005; Zaidel et al., 2010; Haynes and Haber, 2013) and its oscillatory activity has been found to correlate with various Parkinson’s disease signs. While tremor signs have been found to correlate with theta activity (Steigerwald et al., 2008; Contarino et al., 2012; Hirschmann et al., 2017), akinesia/bradykinesia and rigidity have been found to correlate with beta activity (Kühn et al., 2006, 2009; Weinberger et al., 2006; Ray et al., 2008).
Finally, for the past 25 years, deep brain stimulation (DBS) has been a therapeutic boon to patients with advanced Parkinson’s disease. Stimulating at the precise location of STN theta/beta increased oscillatory activities seems to provide optimal therapeutic relief of patients’ motor signs (Thobois et al., 2006; Maks et al., 2009; Zaidel et al., 2010). Although the precise mechanisms remain to be elucidated, the finding that DBS reduces oscillatory activity (in targeted nuclei and networks) is believed to be a major mechanism driving the therapy (Tinkhauser et al., 2017).
Understanding the underlying mechanisms of these signs is therefore imperative for a better understanding of the pathophysiology of the disease as well as to tailor therapeutic neuromodulatory paradigms. To date, despite sign independency and different neural correlates, no attempt has been made to investigate the relationship and interplay of multispectral STN oscillations with specific Parkinson’s disease motor signs, especially with the tremor phenomenon. For all these reasons, we decided to analyse the neuronal correlates of Parkinsonian ResT in the dorsolateral region of the STN.
Materials and methods
Patients
We collected data from 70 Parkinson’s disease patients (27 females and 43 males) undergoing STN DBS surgery in our centre, which we used for the analysis and comparison of theta and beta activities and their relationship with ResT. Sixty-eight patients underwent a bilateral surgery and two patients underwent a unilateral surgery. To ensure quality and sufficient data for analysis, only trajectories crossing the STN for at least 4 mm and having dorsolateral oscillatory region >2 mm were included. Out of the 68 patients who underwent a bilateral surgery, 44 qualified for further analysis in both targeted hemispheres and 24 qualified for further analysis in one (11 presented with only one STN dorsolateral region that qualified in length, and 13 underwent staged surgeries, one for each side, their second surgery was beyond the time frame of this study). Thus, our neuronal database is composed of 114 STN and 166 STN electrode trajectories.
Patients were preoperatively assessed by a movement disorder expert during the off state, using the Unified Parkinson’s Disease Rating Scale (UPDRS) score. Only patients with complete UPDRS scoring profiles were included. Using patients’ scores, we created a signs correlation matrix and were able to define four aggregative sub-scores reflecting ResT, rigidity, akinesia/bradykinesia and axial signs (Table 1). All aggregative sub-scores were expressed as the fraction of the patient’s UPDRS sub-score out of the maximal sub-score possible (maximum of 20 for both rigidity and ResT, 44 for akinesia/bradykinesia and 16 for axial; e.g. a patient with a ResT score of 12 would have a per cent-tremor score of ). Thus, patients’ aggregative clinical scores were all normalized between 0 and 1.
Table 1.
Grouping of Parkinson's disease motor symptoms
| Akinesia/Bradykinesia | Rigidity | Resting tremor | Axial |
|---|---|---|---|
|
|
|
|
| Maximal score of 44 | Maximal score of 20 | Maximal score of 20 | Maximal score of 16 |
PD Motor Symptoms Aggregative Scores. Symptoms were grouped into four groups of motor symptoms. Total score of all included symptoms is 100, action tremor symptoms were omitted.
Patients underwent psychological, neurological, anaesthesia and surgical assessment and met all the standard criteria for STN DBS surgery (Lang and Widner, 2002; Machado et al., 2006). All patients signed a written informed consent for the surgery that involved microelectrode recordings. Use of the data was approved by the institutional review board of Hadassah University Hospital, Jerusalem, Israel in accordance with the Helsinki declaration (reference code: 0168-10-HMO).
Data acquisition and inclusion criteria
The STN target coordinates were calculated by direct targeting with either 1.5 or 3 Tesla T2 MRI. On the day of the operation, a CRW stereotactic frame was attached to the patient and a high-resolution CT was performed. The T1, T2 MRI sequences were fused with the CT images (Framelink 4, 5 or Cranial, Medtronic, Minneapolis, USA) and the frame-based target coordinates and trajectory angles were calculated. For both the left and right hemispheres, a recording trajectory using one or two parallel microelectrodes (separated by 2 mm antero-posteriorly in the parasagittal plane) was made starting at 10 mm above the calculated target (lower third of the dorso-anterior-lateral to ventro-posterior-medial span of the STN). Usually, the hemisphere contra-lateral to the hemi-body with more severe clinical signs was first explored.
The electrophysiological data were acquired using two systems: MicroGuide (prior to 2014, n = 52 patients, method described previously by Zaidel et al., 2009) and Neuro Omega (from 2014 onward, n = 18 patients, Alpha Omega, Nazareth, Israel). In the Neuro Omega system, raw and spike signals were amplified by 20, and sampled at 44 kHz by a 16-bit A/D converter (using ± 1.25 V input range; i.e. ∼ 2-μV amplitude resolution). The raw signal was bandpass filtered from 0.075 to 10 000 Hz, using a hardware 2 and 3 pole Butterworth filter, respectively. The spiking signal (see exemplary trace in Fig. 1A) was further bandpass filtered from 300 to 9000 Hz, using a software 4-pole Butterworth filter. STN border and subdomains localization was determined intra-operatively by an expert neurophysiologist who inspected the microelectrode recorded traces. This was further confirmed by an automated computer-based Hidden Markov Model (HMM) analysis (Moran et al., 2006; Zaidel et al., 2009; Valsky et al., 2017), which was used to define the borders of both the STN and its dorsolateral region for the purpose of this research. Patients’ level of alertness was continuously assessed and if drowsy, the patient was addressed and woken up through conversation by a member of the surgical team. Anti-Parkinsonian medications were discontinued at least 12 h prior to surgery.
Figure 1.

Exemplary recording segment and spectral analysis of a single patient. (A) Recording segment expressing elevated theta (oscillatory) spiking activity. (B) The same segment rectified (showing 2 s for clarity). (C) Power spectrum density (PSD) of the rectified segment. (D) The same PSD represented using the z-score. (E) Average PSD of the patient’s STN DLOR spiking recordings (n = 12 segments, with mean recording length of 10.35 s, total recording time 124.2 s), blue and red circles represent the patient’s peak theta and beta power, respectively.
Macro-stimulation was tested at the ventral border of the oscillatory domain of the STN. If the two microelectrodes crossed >4 mm STN, the trajectory with the largest STN length and oscillatory domain was the first to be tested. If the therapeutic window was not adequate, macro-stimulation was performed with the other microelectrode and at different depths. The final location of the permanent implanted lead was based on the results of MERs, and the results of macro-stimulation. The permanent lead was implanted such that the ventral edge of the desired contact (second contact from below; e.g. contact #1 in Medtronic 3789 lead) was positioned at the location of the stimulation testing; i.e. usually at the lower border of the STN dorsolateral region (Zaidel et al., 2010). Postoperative CT imaging was fused with the preoperative MRI to confirm that the electrode location was within the image-defined STN.
Recordings from the STN had to satisfy inclusion criteria detailed below. Since we were interested in spiking activity at the population level, we assessed the oscillatory characteristics of multi-unit spiking activity (band-passed between 300 and 6000 Hz) using its power spectral density. Analysis of the multi-unit activity instead of the online or offline isolated single-spike analysis reduced the operating room recording time (no need for optimization of the microelectrode positioning) but still provided us with valuable information on background activity and spiking activity at the population level.
Operating room recordings are often unstable (due to brain tissue movement in relation to the electrode tip, neuronal injuries, etc.); therefore, all recording traces were subjected to a two-stage signal stability screening test. First, to ensure data credibility and appropriate frequency resolution, all segments shorter than 4 s were excluded. Second, qualifying data traces were analysed for recording stability. Each data trace was segmented into consecutive 50 ms long bins and their root mean square value calculated. A section of the trace was considered stable if all corresponding segment values lay within 3 SDs of the median. The longest stable section of the data trace was then selected for further analysis, and the rest of the trace was discarded. These selected stable sections had to be longer than 4 s in length. This type of stability analysis rejects infrequent events such as glitches (spurious electronic signals caused by brief, unwanted surges of electric power) or cell injury but does not reject >1 Hz oscillatory activity (Zaidel et al., 2010).
Spectral analysis
To assess the low-frequency modulations of the high-frequency spiking discharge, we employed the full-wave rectification method (Journee, 1983; Myers et al., 2003; Moran et al., 2008); i.e. analysis of the absolute value of the band-passed filtered analogue signal (Fig. 1A and B). This was followed by subtraction of the mean to remove the DC component, which was created by the signal rectification, i.e.. Using the rectified signal, which follows the envelope of multi-unit activity, we were able to detect periodic oscillations with frequencies below the range of the operating room band-pass filter (250–6000 Hz) built into the MicroGuide system. The data acquired from the 18 patients undergoing surgery using the newer Neuro Omega system (with a broader built-in band-pass filter) were filtered offline in the same manner (250–6000 Hz) to represent the same type of activity as the MicroGuide system. Since the local field potential frequency domain was filtered out, our resulting power spectrum density only represents spiking activity (Supplementary Fig. 1).
Oscillatory characteristics were assessed using the power spectrum density of the full-wave rectified signal. Each trace’s power spectral density was calculated using the Welch method, with a 2 s Hanning window, 50% overlap and 0.5 Hz resolution (Fig. 1C). Artificial changes in the recorded voltage and its calculated power may arise due to minor inconsistencies of impedance across different electrodes and patients. Furthermore, as the electrode progresses through the tissue, the total power of the recorded signal may vary. In order to control for these confounding effects and enable comparability across different patients, we normalized the data by the z-score method (Fig. 1D). Since dividing by the SD of the entire signal may cause an undesired interaction between theta and beta powers, each power spectrum density segment was normalized by its tail’s (31–100 Hz) SD value (Supplementary Figs 2 and 3). Finally, averaging over all patients’ electrode trajectories (that met the inclusion criteria, mean recording time of 519 s/patient), patients’ mean power spectral density was calculated. Patients’ peak theta and beta activities were defined as the strongest power in each frequency range (Fig. 1E).
Theta–beta temporal correlation
To assess the temporal relationship between the two bands, patients’ STN recordings were divided into non-overlapping 2-s-long segments. All patients had at least 100 recording seconds, resulting in at least 50 recording segments. Each segment was evaluated for its power spectral density using a windowed fast Fourier transform, with a 2 s Hanning window and 0.5 Hz resolution. Power spectral densities were then z-scored as detailed above. Each segment’s power spectral density peak theta and beta powers were determined and the correlation between the two vectors containing the band powers was evaluated.
Statistical analysis
For correlation analyses, the correlation coefficient is represented by the letter ‘r’. The corresponding probability value, P, is the probability of getting ‘r’ as large as the observed value by random chance when the true correlation is zero and was computed by transforming the correlation to create a t-statistic. When there were multiple comparisons, the Bonferroni correction was used (i.e. the obtained P-value was multiplied by the number of comparisons) before significance testing (P < 0.05) and is presented as such. For the calculation of correlation averages, correlation values were z-transformed, then the average and SD were calculated and reversed back using the inverse z-transform. To compare different linear models, we used two information criteria for model selection, the Akaike information criterion and the Bayesian information criterion. We then calculated each model’s weight. Model weight can be interpreted as the probability that it is the best model, given the data and the set of candidate models (Burnham and Anderson, 2002) to find the best-fitting model.
Data availability
Data analysis was carried out using custom MATLAB software, (MATLAB V8.4, Mathworks, Natick, MA). Code can be found on our lab’s web site http://basalganglia.huji.ac.il.
Results
Parkinson’s resting tremor is an independent motor sign
To study the relationship between Parkinson’s disease motor signs, we created a correlation matrix of patients’ UPDRS motor scores. Two seemingly separate groups of signs appeared to emerge from the correlation matrix: tremor and non-tremor (Fig. 2A and Supplementary Fig. 4). The tremor UPDRS score is composed of two types of tremor: ResT and action tremor (ActT). Analysis of the relationship between tremor and non-tremor subcategories showed that ActT correlation values with the non-tremor sign are significantly higher than those of ResT (Fig. 2B), setting ActT apart from the ResT group.
Figure 2.
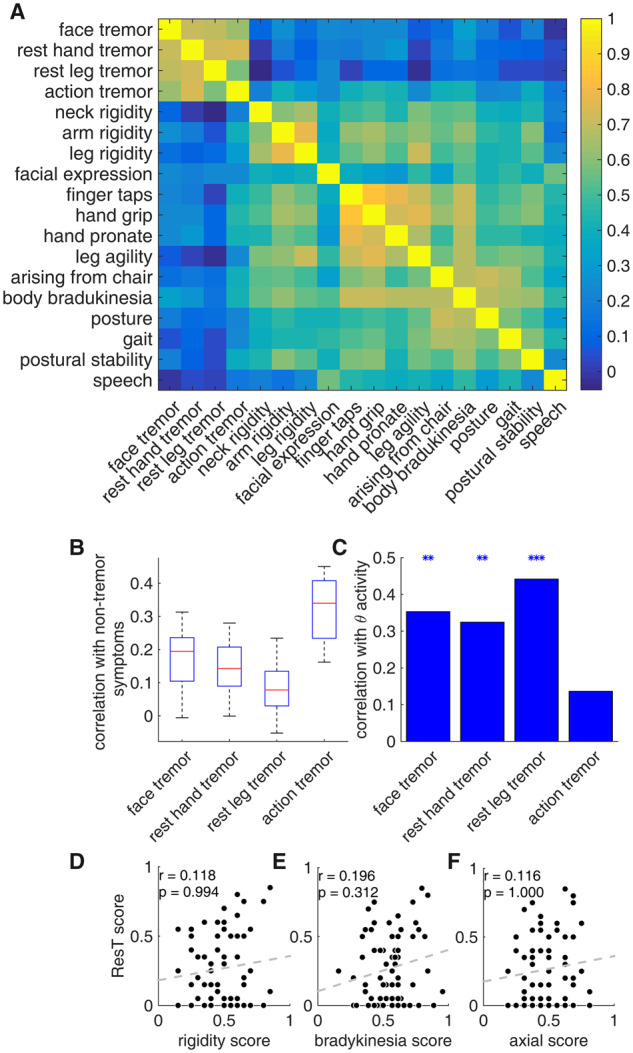
Parkinson’s resting tremor is independent of the non-tremor motor signs. (A) Sign correlation matrix, representing Pearson’s correlation coefficient [colour scale (blue to yellow) from zero to one; although r values range from minus to plus one, no negative values were found]. (B) Boxplot representing the correlation values of tremor subcategories with non-tremor subcategories (14 correlation values in each group). Red lines represent the median, blue box represents the first and third quartiles, and maximum and minimum values are indicated by the edges. (C) Correlation values of the tremor subcategories with theta spiking activity. Asterisks represent significant results (*P < 0.05, **P < 0.01, ***P < 0.001). (D) Scatterplot of patients’ resting tremor score versus rigidity score (patients’ scores were calculated as the individual score in a certain category divided by the maximal score possible in that category). (E) Scatter plot of patients’ resting tremor score versus bradykinesia score. (F) Scatterplot of patients’ resting tremor score versus axial score. Correlation values and their corresponding P-values are represented by r and P, respectively, n = 70 patients.
The differentiation between AcT and ResT was further strengthened by the subcategories’ relationship with neural activity. A comparison of patients’ theta activity with their preoperative UPDRS off scores revealed a significant correlation between each ResT subcategory and patients’ averaged theta activity (Fig. 2C). On the other hand, ActT was not significantly correlated with this activity (r = 0.12, P > 0.05, P-values were Bonferroni corrected due to five comparisons of theta activity with tremor subcategories and ResT). We therefore categorized ResT as a separate group, excluding ActT (Table 1). This group was found to have no significant correlation with any of the other aggregative group scores (Fig. 2D–F).
We further investigated the relationship between ResT and non-tremor groups of signs using Fisher’s exact test of independence. For that purpose, we divided the patients into two groups, as a function of their signs’ severity (i.e. akinesia/bradykinesia, rigidity, ResT and axial). Patients with individual scores above the population mean (the same results were obtained using the population median) were considered as having high values and those with values below the population mean were considered as having low values (Supplementary Table 1). A Fisher’s exact test of independence between ResT and other sign groups did not reject the null hypothesis (H0: the two variables are independent) for any of the group pairs (all P-values were greater than 0.05). While our inability to reject the null hypothesis does not prove that they are independent, it does provide support for the hypothesis that ResT is an independent Parkinson’s disease sign.
Theta and beta oscillations have opposing relationships with resting tremor signs
After identifying ResT as an independent sign, we then examined its neural correlates. For that purpose, we recorded STN spiking activity of 70 Parkinson’s disease patients undergoing DBS surgery (total of 114 STNs, and 166 STN electrode trajectories) and calculated their peak theta and beta oscillation powers. A comparison of patients’ peak theta power with their aggregative ResT scores indicated that the two were significantly correlated ( = 0.41, , Fig. 3A). This finding is in line with previous reports (Hutchison et al., 1997; Amtage et al., 2008). On the other hand, a comparison of beta activity with ResT, while not yielding a significant correlation, () was suggestive of a tendency towards a negative relationship (Fig. 3B, P-values were Bonferroni corrected due to five comparisons of ResT with the neural data: theta, beta, , and ).
Figure 3.

Theta and beta oscillations have opposing relationships with resting tremor signs. (A) Scatterplot of patients’ mean theta oscillations power versus their rest tremor score. (B) Scatterplot of patients’ mean beta oscillations power versus their rest tremor score. (C) Scatterplot of patients’ theta–beta proportional power () versus their resting tremor score. Correlation values and their corresponding P-values (Bonferroni corrected, presented P-values = calculated P-value multiplied by five) are represented by r and P, respectively. Arrows indicate the location of the exemplary patient (Fig. 1) on the graphs.
The seemingly opposing relationship between STN spiking theta and beta activities with ResT led us to investigate their interplay. For if the two are strongly positively or negatively correlated, little added information can be attained from their combined activity. However, if the two activities have no or minimal correlation, their combined activity should carry significantly more information than either alone, thus potentially be a better neural correlate for ResT.
To test this hypothesis, we constructed a score aimed to scale theta–beta combined activities:
| (1) |
This non-linear score scales their activities between −1 and 1; patients with strong beta and weak theta activity will be closer to −1, whereas patients with similar activity powers will be around 0 and patients with stronger theta than beta activity will be closer to 1.
Comparing with patients’ UPDRS scores, we were able to better predict their ResT scores, and found a higher correlation value than theta activity alone , P < 0.001, P-value Bonferroni corrected (multiplied by five), Fig. 3C]. Furthermore, there was no correlation between the multispectral model and any of the other signs, making it specific to ResT signs (Supplementary Fig. 5). Taken together, these results strengthen the hypothesis that STN spiking theta and beta activities convey information about ResT in opposite, but not redundant, ways.
Theta–beta co-activation reduces resting tremor signs
To better understand theta–beta combined activities and their relationship with ResT, we explored their interaction in the time domain. To do so, we divided patient recordings into 2-s-long segments and calculated their power spectral densities. Each segment peak theta and beta powers were found and their linear correlation (across all 2-s-long segments of each patient), , was evaluated (see examples in Fig. 4A–C). thus provides a measure for theta–beta co-activation in a single patient. Our patients tended to have weak positive correlation values between their STN theta and beta activities (). While most patients were found to have significant positive correlations (n = 38), one patient exhibited a significant negative correlation, and 31 had no significant correlation between their theta and beta activities.
Figure 4.

Theta–beta temporal correlation is negatively correlated with resting tremor signs. (A–C) Scatterplots of theta versus beta powers calculated for all non-overlapping 2-s recording segments from three different patients (each circle represents the peak theta and peak beta powers calculated from a single 2-s long segment). (A) A patient with a positive relationship between theta and beta, (B) a patient with no significant correlation between theta and beta and (C) a patient with a negative relationship between theta and beta. (D) Scatterplot of theta and beta correlation value () versus patients’ resting tremor scores. Arrows indicate the location of the exemplary patients on the graph.
Since theta–beta combined activities score was strongly correlated with ResT, we investigated whether their co-activation (would influence these signs. We found a significant negative correlation between theta–beta correlation () and ResT P-value Bonferroni corrected (multiplied by five), Fig. 4D]. In other words, patients who tended to experience theta and beta simultaneously (i.e. theta and beta were correlated) were likely to have lower ResT scores than those who experienced them separately (i.e. theta and beta were not correlated). This result strengthens the hypothesis that the two oscillation bands convey information of ResT in opposite ways, possibly cancelling each other out.
Theta and beta proportional power and co-activation level best models resting tremor signs
Up to now, we were able to isolate two fundamental parameters that correlate with Parkinson’s ResT: (i) theta–beta combined activities, represented by their proportional powers and (ii) theta–beta temporal relationship, represented by their temporal correlation. Searching for an even better model for the prediction of ResT, we constructed a model incorporating the two parameters ().
These two parameters may be interconnected, such that one robustly influences the other. To test for this eventuality, we explored the relationship between patients’ peak neural power (i.e. theta and beta powers) and their values. We found no significant correlation between and the power values—differentiating the two neural parameters (Supplementary Fig. 6). This differentiation allowed us to explore their combined relationship with ResT. For if the two are independent, their joint information on ResT should be greater than their separate parts—producing a better predictive model.
We therefore incorporated theta–beta correlation, , into theta–beta combined activities score, . Incorporating to is especially attractive since both parameters share the same value range between −1 and 1.
| (2) |
This model was found to achieve higher correlation values with ResT than either theta or theta–beta combined activity models P-value Bonferroni corrected (multiplied by five), Fig. 5].
Figure 5.

Theta and beta proportional power and temporal co-activation best predict resting tremor severity. (A) Scatterplot of patients’ unified model () versus their ResT score. (B) Comparing correlation values of the different predictors (theta power, , and ) with ResT score. Asterisks represent significant differences (P < 0.05, P < 0.01).
Since it is possible to increase the prediction likelihood by adding parameters, which may lead to overfitting, we used the linear regression technique for comparison of the different models. Due to design (i.e. the inability to separate theta and beta), we used an alternative scale that is almost identical to (, Supplementary Fig. 7), . The logarithmic scale, just like , scales the two activities around zero and allows separation of the two parameters.
| (3) |
We therefore constructed five different predictive models for ResT ( is an intersection parameter added to improve model fit; all ‘b’ coefficients can be positive or negative): and compared them using two information criteria for model selection, the Akaike and Bayesian information criteria, to find the best-fitting model (Table 2). These information criteria introduce a penalty term for the number of parameters in the model (Bayesian penalty term is larger than Akaike). Calculating the Akaike, and the rounded Bayesian model weights (Burnham and Anderson, 2002), we found the fifth model (using theta–beta combined activities and their correlation) to be the best model with 0.96 and 0.89 probabilities, respectively (Table 2).
Table 2.
Results of AIC and BIC analysis for five competing models
| Model | ||||||||
|---|---|---|---|---|---|---|---|---|
| 1 | 4.96 | −5.93 | 16.46 | 2.55e−4 | −1.43 | 11.97 | 0.002 | |
| 1 | −0.16 | 4.32 | 26.71 | 1.52e−6 | 8.81 | 22.21 | 1.34e−5 | |
| 1 | 3.98 | −3.96 | 18.43 | 9.57e−5 | 0.54 | 13.94 | 8.4e−4 | |
| 2 | 10.94 | −15.87 | 6.52 | 0.037 | −9.13 | 4.27 | 0.1 | |
| 3 | 15.2 | −22.39 | 0.0 | 0.96 | −13.4 | 0.0 | 0.89 |
# = number of estimated parameters for model i; natural logarithm of the maximum likelihood for model i;; the rounded Akaike weights; ; the rounded BIC model weights (or ‘Schwarz weights’).
Since Parkinson’s disease is an asymmetric disease, we tested these five predictive models using neural data from the contralateral side to the affected limb. We compared neural activity from the left side of the STN to right-sided ResT in 62 patients who had available data, and the right side of the STN to left-sided ResT in 52 patients with available data (Supplementary Fig. 8). This sided analysis provided similar results to those presented throughout this paper.
Discussion
Parkinson’s disease is manifested in a variety of motor and non-motor signs and symptoms. It is increasingly evident that its heterogeneous manifestation results in a variety of clinical and pathological phenotypes. Due to this heterogeneity, many attempts to divide Parkinson’s disease patients into groups have been made (Marras and Lang, 2013; Thenganatt and Jankovic, 2014). Data-driven approaches using cluster analysis have identified two motor subtypes, tremor-dominant and postural instability with gait deficits, also dominated by bradykinesia and rigidity (Thenganatt and Jankovic, 2014). This dichotomy of motor signs is further strengthened by the demonstration that tremor signs are independent of the other Parkinsonian signs (Stochl et al., 2008). Unfortunately, the pathogenic and pathophysiological mechanisms underlying this heterogeneity remain unclear. Here, we were able to frame a subset of Parkinson’s disease motor signs, ResT, and identify a unique and highly predictive neural correlate. These results provide further support for the dichotomy between tremor and non-tremor signs and suggest a possible separate neural mechanism.
Parkinson’s resting tremor is independent of the non-tremor motor signs
Over the years, data have suggested that Parkinson’s disease ResT is independent of its non-tremor signs (Stochl et al., 2008; Helmich et al., 2012). Here we used the UPDRS motor score to study signs relationship using the 70 patients in our dataset. The UPDRS motor score consists of 18 subcategories (excluding left and right differences) that are traditionally categorized into four groups of signs: bradykinesia/akinesia, rigidity, tremor and postural instability with gait deficits. These groups of signs are the manifestation of Parkinson’s disease motor pathology and may therefore provide clues to the relationship between pathological mechanisms. Each pair of signs may have a positive, a negative or no relationship. A positive relationship may result from (i) shared neural mechanism/s, (ii) separate mechanisms that are positively correlated or (iii) a cascade of neural mechanisms (A→B). A negative relationship could simply result from the above-mentioned mirror image.
While both positively and negatively correlated signs could hint at a joint underlying mechanism, or a relationship between them, independent signs are likely to have independent mechanisms. Here, we found ResT signs to be strongly correlated with each other while having no correlation with the non-tremor signs. Furthermore, we were not able to reject the hypothesis that ResT is independent of the other signs using Fisher’s exact test of independence. These results, together with previous work (Stochl et al., 2008; Helmich et al., 2012), suggest that Parkinson’s disease ResT is independent of the other Parkinsonian motor-signs and is probably manifested by a neural mechanism independent of the non-tremor signs.
ActT on the other hand, while having a positive correlation with ResT, was found to be significantly correlated with non-tremor signs as well. This finding suggests that ActT, unlike ResT, is not independent of the non-tremor signs. ActT’s dual-positive relationship with both ResT and akinetic-rigid signs may suggest pathological complexity. ActT could therefore be the result of a separate neural mechanism positively correlated with both ResT and bradykinesia-rigidity signs, or a manifestation of several shared mechanisms of both these signs (Dirkx et al., 2018; Hassan, 2018; Helmich, 2018).
Theta and beta oscillations have opposing relationships with resting tremor signs
Theta and beta activities are the two main oscillatory bands found in the STN posterior-dorso-lateral region. These two bands have been studied extensively and have generally been found to have opposing relationships with motor activity. Whereas beta oscillatory activity is reduced during movement and correlated with lack of movement (e.g. akinesia), theta was found to be elevated during movement and tremor (Steigerwald et al., 2008; Contarino et al., 2012; Shine et al., 2014; Hirschmann et al., 2017; Chen et al., 2019).
In line with previous reports, when exploring the relationship between neural spiking activity and motor signs we found a significant positive correlation between STN theta and ResT. On the other hand, ActT was found to have no correlation with theta activity. ActT’s positive correlation with the non-tremor group of signs and lack of correlation with STNs spiking theta activity further differentiates it from the ResT group and lends weight to the hypothesis that ActT is governed by a separate neural mechanism.
Unlike theta, there was no significant correlation between beta activity and ResT. Nonetheless, consistent with previous research (Hirschmann et al., 2016, 2017; Qasim et al., 2016), there seemed to be a negative trend between the two. We hypothesized that beta may have a negative effect on ResT which is masked by theta’s more dominant relationship. To test this hypothesis, we created a scale of theta–beta combined activities, . Indeed, the relationship between and ResT was much stronger than theta’s relationship alone (). This result further supports our hypothesis and supports the notion of the two bands opposite relationships with ResT.
Theta–beta co-activation reduces resting tremor signs
We showed that STN spiking theta and beta activities have opposite relationships with ResT and that their combined activity is highly predictive of it. Nonetheless, the effect of theta and beta temporal interactions on these signs remains unclear. Moran et al. (2008) showed that while neurons firing at theta frequency are observed to oscillate more episodically and less coherently with their background activity, beta oscillating neurons oscillate coherently with their background activity for longer periods. If the two oscillating activities arise from two separate neuronal populations, this would suggest that the two populations are driven by different local functional neuronal organizations. For this purpose, we examined patients’ theta–beta correlation and explored its interaction with ResT.
We found that theta–beta temporal relationship varied across patients, expressing positive, negative or zero correlation between the two bands. While most patients exhibited positive correlation between the two, patients’ variation and generally weak correlation values support the hypothesis that the two bands are generated by separate neural mechanisms. For if theta and beta were generated by the same neural mechanism, or by opposing mechanisms, one would expect to see positively or negatively strong correlation values across the entire dataset.
We therefore compared these temporal interactions with patients’ ResT scores and found a significant negative correlation between these parameters (). Patients with low ResT scores tended to have stronger correlation values between theta and beta activities than those with high ResT scores. In other words, patients who experienced theta and beta simultaneously were more likely to have low ResT scores than those who experienced them separately.
One of the main characteristics of Parkinson’s ResT is its reduction during movement of the upper limbs. One might therefore expect to see an accompanying reduction in theta activity. However, theta has been found to be elevated during movement (Shine et al., 2014; Chen et al., 2019), whereas beta reduced during movement and elevated during steady contractions (Sanes and Donoghue, 1993; Baker et al., 1997; Kilner et al., 1998; Riddle and Baker, 2006; Baker, 2007; Klostermann et al., 2007; Chakarov et al., 2009). Furthermore, Parkinson’s disease patients experiencing freezing of gait are found to manifest increased theta–beta synchrony and elevation of both activities (Shine et al., 2014; Chen et al., 2019). These findings suggest that during goal-directed movement, theta increases and beta decreases, but as the movement stops, beta increases.
In addition to these results, when exploring tremor, we found strong correlation between theta–beta combined activities and patients’ ResT scores (patients with higher theta than beta power tended to have higher ResT scores than patients with higher beta than theta power). Furthermore, we found a negative correlation between patients’ temporal theta–beta correlation and their ResT scores. These findings, similar to the findings during movement, suggest that theta increases and beta decreases during ResT, but as the tremor stops, beta increases.
The results reported by Moran et al. (2008), together with ours may suggest that these two activities are generated by separate neuronal groups. Whereas a cause and effect relationship cannot be inferred by our results, we suggest that theta acts as a general ‘go’ signal, whereas beta acts as a ‘stop’ signal. Thus, during goal-directed movement, the increase in theta and decrease in beta does not create tremor, but when stationary, the hyperkinetic oscillatory state creates tremor. If so, it is possible that this reflects the system’s attempt to resolve the imbalance created by one of the oscillating neuronal groups by modulating the other.
Theta and beta proportional power and temporal co-activation best predict resting tremor severity
Whereas beta was found to be uncorrelated with ResT, its non-linear subtraction from theta improved correlation values. Furthermore, patients’ theta–beta correlation was negatively correlated with their ResT score. Patients who experienced theta and beta separately were more likely to have higher ResT scores and vice versa. These results are complementary, suggesting that STN spiking theta and beta activities are inherently opposite in their relationship with ResT.
To construct an improved model incorporating the two parameters (), we tested whether theta–beta correlation was affected by either theta or beta powers. We found no significant correlation between theta–beta correlation values and their individual powers (Supplementary Fig. 6). This result paved the way for the construction of a model consisting of the two parameters: theta–beta combined activities and theta–beta correlation. This model was found to be a significantly better predictor of ResT, achieving significantly higher correlation values than either theta or theta–beta combined activities as predictors (Fig. 5).
To better compare the different models and correct for the added parameters, we used a linear regression tool for model assessment. Comparing the five predictive models, we found that the model consisting of all three parameters (theta, beta and theta–beta correlation) best predicts ResT than all other tested models, using both the Akaike and the Bayesian information criteria with 0.96 and 0.89 probabilities, respectively (Table 2).
The selected model provides a scale for patients’ theta–beta combined activities and their temporal interplay. Showing that high theta and low, temporally dissociated, beta activities are strongly correlated with ResT. Even though our model is strictly correlative, taking together this and previous works, we hypothesize that STN spiking theta activity drives ResT whereas beta acts to stop it. Thus, when the ‘brake’ (beta) is lifted—tremor worsens. These results shed new light on Parkinson’s disease ResT pathophysiology and could hopefully be used in the future as a sign-specific biomarker.
Clinical importance and conclusions
Here we showed that multispectral STN spiking oscillatory activity is highly correlative with and specific to Parkinson’s ResT. Our results lend weight to the hypothesis that theta and beta play opposite roles in ResT electrophysiology and that their combined activity better predicts ResT than either alone. We further found that their temporal correlation is a good indicator of these signs. The more the two oscillations were out of sync (i.e. each appearing by itself), the more likely the patient had high ResT. Finally, we constructed a non-linear multispectral representation of these neural activities to create an improved biomarker for ResT.
While a cause and effect relationship has yet to be established, recent research has found supporting evidence for the hypothesis that local field potential beta activity is the effector causing some of the Parkinsonian signs (Tinkhauser et al., 2017; Velisar et al., 2019). If such cause and effect relationship exists for the neural correlates of tremor as well, they could be harnessed for better treatment options.
Delivering continuous, high-frequency electrical stimulation to either the STN or globus pallidus interna DBS ameliorates Parkinson’s disease motor signs. The underlying mechanism of this therapy is still debated. Either way, DBS is observed to reduce oscillatory activity in target loci and the amelioration of synchronous oscillations is believed to be a major mechanism underlying the success of this technique (Tinkhauser et al., 2017; Velisar et al., 2019). Although highly effective, conventional DBS ignores fluctuations in patients’ condition and is power hungry, shortening pacemaker longevity. It has been suggested that adaptive DBS might resolve these problems by using feedback about the state of relevant neural circuits to control stimulation parameters (Rosin et al., 2011; Rosa et al., 2015; Tinkhauser et al., 2017). To this end, adaptive DBS trials have sought to detect changes in local field potential beta activity, primarily correlated with bradykinesia and rigidity signs. Velisar et al. (2019) found that the resting state beta band power is similar in bradykinesia and tremor dominant cases, making it a good candidate for adaptive DBS for both group types. Attempting to keep beta power within a desired window, they used a dual-threshold algorithm changing stimulation voltage inversely to the measured beta power. While achieving outstanding results for both groups, in one case the progressive decrease in beta band power was associated with the reappearance of ResT, as predicted by the current study. We therefore hope that in the future, the multispectral model presented here would be tested along with other models, for adaptive DBS, tailored for specific Parkinson’s disease signs.
Supplementary material
Supplementary material is available at Brain Communications online.
Funding
This study was supported by a grant of the Rostrees foundation (to H.B.).
Competing interests
The authors report no competing interests.
Supplementary Material
Glossary
- ActT =
action tremor
- DBS =
deep brain stimulation
- ResT =
resting tremor
- STN =
subthalamic nucleus
- UPDRS =
Unified Parkinson’s Disease Rating Scale
Contributor Information
Nir Asch, Department of Medical Neurobiology, The Hebrew University of Jerusalem, Israel.
Yehuda Herschman, Functional Neurosurgery Unit, Department of Neurosurgery, Hadassah-Hebrew University Medical Center, Jerusalem, Israel; Department of Neurosurgery, Rutgers University, New Jersey.
Rotem Maoz, Department of Medical Neurobiology, The Hebrew University of Jerusalem, Israel; Edmond and Lily Safra Center for Brain Sciences (ELSC), The Hebrew University of Jerusalem, Israel.
Carmel R Auerbach-Asch, Edmond and Lily Safra Center for Brain Sciences (ELSC), The Hebrew University of Jerusalem, Israel.
Dan Valsky, Department of Medical Neurobiology, The Hebrew University of Jerusalem, Israel; Edmond and Lily Safra Center for Brain Sciences (ELSC), The Hebrew University of Jerusalem, Israel.
Muneer Abu-Snineh, Department of Neurology, Hadassah Medical Center, Jerusalem, Israel.
David Arkadir, Department of Neurology, Hadassah Medical Center, Jerusalem, Israel.
Eduard Linetsky, Department of Neurology, Hadassah Medical Center, Jerusalem, Israel.
Renana Eitan, Research and Training Unit, Jerusalem Mental Health Center, Kfar Shaul Eitanim Hospital, Jerusalem, Israel.
Odeya Marmor, Department of Medical Neurobiology, The Hebrew University of Jerusalem, Israel.
Hagai Bergman, Department of Medical Neurobiology, The Hebrew University of Jerusalem, Israel; Functional Neurosurgery Unit, Department of Neurosurgery, Hadassah-Hebrew University Medical Center, Jerusalem, Israel; Edmond and Lily Safra Center for Brain Sciences (ELSC), The Hebrew University of Jerusalem, Israel.
Zvi Israel, Functional Neurosurgery Unit, Department of Neurosurgery, Hadassah-Hebrew University Medical Center, Jerusalem, Israel.
See Foffani et al. (https://doi.org/10.1093/braincomms/fcaa128) for a scientific commentary on this article.
References
- Amtage F, Henschel K, Schelter B, Vesper J, Timmer J, Lücking CH, et al. Tremor-correlated neuronal activity in the subthalamic nucleus of Parkinsonian patients. Neurosci Lett 2008; 442: 195–9. [DOI] [PubMed] [Google Scholar]
- Baker SN. Oscillatory interactions between sensorimotor cortex and the periphery. Curr Opin Neurobiol 2007; 17: 649–55. [DOI] [PMC free article] [PubMed] [Google Scholar]
- Baker SN, Olivier E, Lemon RN. Coherent oscillations in monkey motor cortex and hand muscle EMG show task-dependent modulation. J Physiol 1997; 501: 225–41. [DOI] [PMC free article] [PubMed] [Google Scholar]
- Beudel M, Oswal A, Jha A, Foltynie T, Zrinzo L, Hariz M, et al. Oscillatory beta power correlates with akinesia-rigidity in the Parkinsonian subthalamic nucleus. Mov Disord 2017; 32: 174–5. [DOI] [PubMed] [Google Scholar]
- Burnham K, Anderson D. Model selection and multimodel inference. 2nd edn New York, NY: Springer-Verlag New York Inc.; 2002. [Google Scholar]
- Chakarov V, Naranjo JR, Schulte-Mönting J, Omlor W, Huethe F, Kristeva R. Beta-range EEG-EMG coherence with isometric compensation for increasing modulated low-level forces. J Neurophysiol 2009; 102: 1115–20. [DOI] [PubMed] [Google Scholar]
- Chen CC, Hsu YT, Chan HL, Chiou SM, Tu PH, Lee ST, et al. Complexity of subthalamic 13-35Hz oscillatory activity directly correlates with clinical impairment in patients with Parkinson’s disease. Exp Neurol 2010; 224: 234–40. [DOI] [PubMed] [Google Scholar]
- Chen C-C, Yeh C-H, Chan H-L, Chang Y-J, Tu P-H, Yeh C-H, et al. Subthalamic nucleus oscillations correlate with vulnerability to freezing of gait in patients with Parkinson’s disease. Neurobiol Dis 2019; 132: 104605. [DOI] [PMC free article] [PubMed] [Google Scholar]
- Contarino MF, Bour LJ, Bot M, Van Den Munckhof P, Speelman JD, Schuurman PR, et al. Tremor-specific neuronal oscillation pattern in dorsal subthalamic nucleus of Parkinsonian patients. Brain Stimul 2012; 5: 305–14. [DOI] [PubMed] [Google Scholar]
- Deffains M, Iskhakova L, Katabi S, Haber SN, Israel Z, Bergman H. Subthalamic, not striatal, activity correlates with basal ganglia downstream activity in normal and parkinsonian monkeys. Elife 2016; 5: 1–38. [DOI] [PMC free article] [PubMed] [Google Scholar]
- Deffains M, Iskhakova L, Katabi S, Israel Z, Bergman H. Longer beta oscillatory episodes reliably identify pathological subthalamic activity in Parkinsonism. Mov Disord 2018; 00: 1–10. Please provide the missing volume number for Refs. [Deffains et al. 2018; Tinkhauser et al. 2017 and Luo et al. 2019]. [DOI] [PubMed] [Google Scholar]
- Dirkx MF, Zach H, Bloem BR, Hallett M, Helmich RC. The nature of postural tremor in Parkinson disease. Neurology 2018; 90: e1095–102. [DOI] [PMC free article] [PubMed] [Google Scholar]
- Eggers C, Kahraman D, Fink GR, Schmidt M, Timmermann L. Akinetic-rigid and tremor-dominant Parkinson’s disease patients show different patterns of FP-CIT Single photon emission computed tomography. Mov Disord 2011; 26: 416–23. [DOI] [PubMed] [Google Scholar]
- Fahn S. Description of Parkinson’s disease as a clinical syndrome. Ann New York Acad Sci 2006; 991: 1–14. [DOI] [PubMed] [Google Scholar]
- Hassan A. No handshake agreement on postural tremor subtypes in Parkinson disease? Neurology 2018; 90: 581–2. [DOI] [PubMed] [Google Scholar]
- Haynes WIA, Haber SN. The organization of prefrontal-subthalamic inputs in primates provides an anatomical substrate for both functional specificity and integration: implications for basal ganglia models and deep brain stimulation. J Neurosci 2013; 33: 4804–14. [DOI] [PMC free article] [PubMed] [Google Scholar]
- Helmich RC. The cerebral basis of Parkinsonian tremor: a network perspective. Mov Disord 2018; 33: 219–31. [DOI] [PubMed] [Google Scholar]
- Helmich RC, Hallett M, Deuschl G, Toni I, Bloem BR. Cerebral causes and consequences of parkinsonian resting tremor: A tale of two circuits? Brain 2012; 135: 3206–26. [DOI] [PMC free article] [PubMed] [Google Scholar]
- Hirschmann J, Butz M, Hartmann CJ, Hoogenboom N, Özkurt TE, Vesper J, et al. Parkinsonian rest tremor is associated with modulations of subthalamic high-frequency oscillations. Mov Disord 2016; 31: 1551–9. [DOI] [PubMed] [Google Scholar]
- Hirschmann J, Schoffelen JM, Schnitzler A, van Gerven M. Parkinsonian rest tremor can be detected accurately based on neuronal oscillations recorded from the subthalamic nucleus. Clin Neurophysiol 2017; 128: 2029–36. [DOI] [PubMed] [Google Scholar]
- Hutchison WD, Lozano AM, Tasker RR, Lang AE, Dostrovsky JO. Identification and characterization of neurons with tremor-frequency activity in human globus pallidus. Exp Brain Res 1997; 113: 557–63. [DOI] [PubMed] [Google Scholar]
- Journee HL. Demodulation of amplitude modulated noise: a mathematical evaluation of a demodulator for pathological tremor EMG’s. IEEE Trans Biomed Eng 1983; 30: 304–8. [PubMed] [Google Scholar]
- Kilner J, Baker S, Salenius S, Hari R, Lemon R. 15-30 Hz coherence between rectified EMGs from human hand muscles has task-dependent modulation. J Physiol London 1998; 509: 175. [DOI] [PMC free article] [PubMed] [Google Scholar]
- Klostermann F, Nikulin VV, Kühn AA, Marzinzik F, Wahl M, Pogosyan A, et al. Task-related differential dynamics of EEG alpha- and beta-band synchronization in cortico-basal motor structures. Eur J Neurosci 2007; 25: 1604–15. [DOI] [PubMed] [Google Scholar]
- Kühn AA, Kupsch A, Schneider GH, Brown P. Reduction in subthalamic 8-35 Hz oscillatory activity correlates with clinical improvement in Parkinson’s disease. Eur J Neurosci 2006; 23: 1956–1960. [DOI] [PubMed] [Google Scholar]
- Kühn AA, Trottenberg T, Kivi A, Kupsch A, Schneider G-H, Brown P. The relationship between local field potential and neuronal discharge in the subthalamic nucleus of patients with Parkinson’s disease. Exp Neurol 2005; 194: 212–20. [DOI] [PubMed] [Google Scholar]
- Kühn AA, Tsui A, Aziz T, Ray N, Brücke C, Kupsch A, et al. Pathological synchronisation in the subthalamic nucleus of patients with Parkinson’s disease relates to both bradykinesia and rigidity. Exp Neurol 2009; 215: 380–7. [DOI] [PubMed] [Google Scholar]
- Lang AE, Widner H. Deep brain stimulation for Parkinson’s disease: patient selection and evaluation. Mov Disord 2002; 17: 94–101. [DOI] [PubMed] [Google Scholar]
- Lee JW, Song YS, Kim H, Ku BD, Lee WW. Alteration of tremor dominant and postural instability gait difficulty subtypes during the progression of Parkinson’s disease: analysis of the PPMI cohort. Front Neurol 2019; 10: 1–8. [DOI] [PMC free article] [PubMed] [Google Scholar]
- Little S, Pogosyan A, Kuhn AA, Brown P. Beta band stability over time correlates with Parkinsonian rigidity and bradykinesia. Exp Neurol 2012; 236: 383–8. [DOI] [PMC free article] [PubMed] [Google Scholar]
- Luo L, Andrews H, Alcalay RN, Poyraz FC, Boehme AK, Goldman JG, et al. Motor phenotype classification in moderate to advanced PD in BioFIND study. Park Relat Disord 2019; 2–7. [DOI] [PMC free article] [PubMed] [Google Scholar]
- Machado A Rezai A R Kopell B H Gross R E Sharan A D Benabid A-L. Deep brain stimulation for Parkinson's disease: Surgical technique and perioperative management. Mov Disord 2006; 21: S247–58. doi: 10.1002/mds.20959. [DOI] [PubMed] [Google Scholar]
- Maks CB, Butson CR, Walter BL, Vitek JL, Mcintyre CC. Deep brain stimulation activation volumes and their association with neurophysiological mapping and therapeutic outcomes. J Neurol Neurosurg Psychiatry 2009; 80: 659–66. [DOI] [PMC free article] [PubMed] [Google Scholar]
- Marras C, Lang A. Parkinson’s disease subtypes: lost in translation? J Neurol Neurosurg Psychiatry 2013; 84: 409–15. [DOI] [PubMed] [Google Scholar]
- Monakow KH, Akert K, Kiinzle H. Projections of the precentral motor cortex and other cortical areas of the frontal lobe to the subthalamic nucleus in the monkey. Brain 1978; 403: 395–403. [DOI] [PubMed] [Google Scholar]
- Moran A, Bar-Gad I, Bergman H, Israel Z. Real-time refinement of subthalamic nucleus targeting using Bayesian decision-making on the root mean square measure. Mov Disord 2006; 21: 1425–31. [DOI] [PubMed] [Google Scholar]
- Moran A, Bergman H, Israel Z, Bar-Gad I. Subthalamic nucleus functional organization revealed by Parkinsonian neuronal oscillations and synchrony. Brain 2008; 131: 3395–409. [DOI] [PubMed] [Google Scholar]
- Myers LJ, Lowery M, O’Malley M, Vaughan CL, Heneghan C, St Clair Gibson A, et al. Rectification and non-linear pre-processing of EMG signals for cortico-muscular analysis. J Neurosci Methods 2003; 124: 157–65. [DOI] [PubMed] [Google Scholar]
- Nambu A, Takada M, Inase M, Tokuno H. Dual somatotopical representations in the primate subthalamic nucleus: evidence for ordered but reversed body-map transformations from the primary motor cortex and the supplementary motor area. J Neurosci 1996; 16: 2671–83. [DOI] [PMC free article] [PubMed] [Google Scholar]
- Qasim SE, de Hemptinne C, Swann NC, Miocinovic S, Ostrem JL, Starr PA. Electrocorticography reveals beta desynchronization in the basal ganglia-cortical loop during rest tremor in Parkinson’s disease. Neurobiol Dis 2016; 86: 177–86. [DOI] [PMC free article] [PubMed] [Google Scholar]
- Ray NJ, Jenkinson N, Wang S, Holland P, Brittain JS, Joint C, et al. Local field potential beta activity in the subthalamic nucleus of patients with Parkinson’s disease is associated with improvements in bradykinesia after dopamine and deep brain stimulation. Exp Neurol 2008; 213: 108–13. [DOI] [PubMed] [Google Scholar]
- Riddle CN, Baker SN. Digit displacement, not object compliance, underlies task dependent modulations in human corticomuscular coherence. Neuroimage 2006; 33: 618–27. [DOI] [PubMed] [Google Scholar]
- Rodriguez-Oroz MC, Rodriguez M, Guridi J, Mewes K, Chockkman V, Vitek J, et al. The subthalamic nucleus in Parkinson’s disease: somatotopic organization and physiological characteristics. 2001; 124: 1777–90. [DOI] [PubMed] [Google Scholar]
- Romanelli P, Esposito V, Schaal DW, Heit G. Somatotopy in the basal ganglia: experimental and clinical evidence for segregated sensorimotor channels. Brain Res Rev 2005; 48: 112–28. [DOI] [PubMed] [Google Scholar]
- Rosa M, Arlotti M, Ardolino G, Cogiamanian F, Marceglia S, Di Fonzo A, et al. Adaptive deep brain stimulation in a freely moving Parkinsonian patient. Mov Disord 2015; 30: 1003–5. [DOI] [PMC free article] [PubMed] [Google Scholar]
- Rosin B, Slovik M, Mitelman R, Rivlin-Etzion M, Haber SN, Israel Z, et al. Closed-loop deep brain stimulation is superior in ameliorating parkinsonism. Neuron 2011; 72: 370–84. [DOI] [PubMed] [Google Scholar]
- Sanes JN, Donoghue JP. Oscillations in local field potentials of the primate motor cortex during voluntary movement. Proc Natl Acad Sci U S A 1993; 90: 4470–4. [DOI] [PMC free article] [PubMed] [Google Scholar]
- Shine JM, Handojoseno AMA, Nguyen TN, Tran Y, Naismith SL, Nguyen H, et al. Abnormal patterns of theta frequency oscillations during the temporal evolution of freezing of gait in Parkinson’s disease. Clin Neurophysiol 2014; 125: 569–76. [DOI] [PubMed] [Google Scholar]
- Sotelo J. Book review neurological disorders: course and treatment Edited by Thomas Brandt, Louis R. Caplan, Johannes Dichgans, H. Christoph Diener, and Christopher Kennard. 1150 pp., illustrated. San Diego, Calif., Academic Press, 1996. $139.95. 0-12-125830-0. N Engl J Med 1997; 336: 813–4. [Google Scholar]
- Spiegel J, Hellwig D, Samnick S, Jost W, Möllers MO, Fassbender K, et al. Striatal FP-CIT uptake differs in the subtypes of early Parkinson’s disease. J Neural Transm 2007; 114: 331–5. [DOI] [PubMed] [Google Scholar]
- Steigerwald F, Potter M, Herzog J, Pinsker M, Kopper F, Mehdorn H, et al. Neuronal activity of the human subthalamic nucleus in the Parkinsonian and nonparkinsonian state. J Neurophysiol 2008; 100: 2515–24. [DOI] [PubMed] [Google Scholar]
- Stochl J, Boomsma A, Ruzicka E, Brozova H, Blahus P. On the structure of motor symptoms of Parkinson’s disease. Mov Disord 2008; 23: 1307–12. [DOI] [PubMed] [Google Scholar]
- Thenganatt MA, Jankovic J. Parkinson disease subtypes. JAMA Neurol 2014; 71: 499–504. [DOI] [PubMed] [Google Scholar]
- Thobois S, Magnin M, Guenot M, Xie J, Salvetti A, Mertens P, et al. Original communication subthalamic nucleus stimulation in Parkinson’s disease anatomical and electrophysiological localization. J Neurol 2006; 253: 1347–55. [DOI] [PubMed] [Google Scholar]
- Tinkhauser G, Pogosyan A, Little S, Beudel M, Herz DM, Tan H, et al. The modulatory effect of adaptive deep brain stimulation on beta bursts in Parkinson’s disease. Brain 2017; 140: 1053–67. [DOI] [PMC free article] [PubMed] [Google Scholar]
- Tinkhauser G, Pogosyan A, Tan H, Herz DM, Ku AA, Brown P. OUP accepted manuscript. FEMS Microbiol Ecol 2017; 1–14. [Google Scholar]
- Trottenberg T, Kupsch A, Schneider G, Brown P, Kühn AA. Frequency-dependent distribution of local field potential activity within the subthalamic nucleus in Parkinson’s disease. Exp Neurol 2007; 205: 287–91. [DOI] [PubMed] [Google Scholar]
- Valsky D, Marmor-Levin O, Deffains M, Eitan R, Blackwell KT, Bergman H, et al. Stop! border ahead: automatic detection of subthalamic exit during deep brain stimulation surgery. Mov Disord 2017; 32: 70–79. [DOI] [PMC free article] [PubMed] [Google Scholar]
- Velisar A, Syrkin-Nikolau J, Blumenfeld Z, Trager MH, Afzal MF, Prabhakar V, et al. Dual threshold neural closed loop deep brain stimulation in Parkinson disease patients. Brain Stimul 2019; 12: 868–76. [DOI] [PubMed] [Google Scholar]
- Von Coelln R, Shulman LM. Clinical subtypes and genetic heterogeneity: of lumping and splitting in Parkinson disease. Curr Opin Neurol 2016; 29: 727–34. [DOI] [PubMed] [Google Scholar]
- Weinberger M, Mahant N, Hutchison WD, Lozano AM, Moro E, Hodaie M, et al. Beta oscillatory activity in the subthalamic nucleus and its relation to dopaminergic response in Parkinson’s disease. J Neurophysiol 2006; 96: 3248–56. [DOI] [PubMed] [Google Scholar]
- Zaidel A, Arkadir D, Israel Z, Bergman H. Akineto-rigid vs. tremor syndromes in Parkinsonism. Curr Opin Neurol 2009; 22: 387–393. [DOI] [PubMed] [Google Scholar]
- Zaidel A, Spivak A, Grieb B, Bergman H, Israel Z. Subthalamic span of β oscillations predicts deep brain stimulation efficacy for patients with Parkinson’s disease. Brain 2010; 133: 2007–21. [DOI] [PubMed] [Google Scholar]
- Zaidel A, Spivak A, Shpigelman L, Bergman H, Israel Z. Delimiting subterritories of the human subthalamic nucleus by means of microelectrode recordings and a hidden Markov model. Mov Disord 2009; 24: 1785–93. [DOI] [PubMed] [Google Scholar]
Associated Data
This section collects any data citations, data availability statements, or supplementary materials included in this article.
Supplementary Materials
Data Availability Statement
Data analysis was carried out using custom MATLAB software, (MATLAB V8.4, Mathworks, Natick, MA). Code can be found on our lab’s web site http://basalganglia.huji.ac.il.