Abstract
Base editing by nucleotide deaminases linked to programmable DNA-binding proteins represents a promising approach to permanently remedy blood disorders, although its application in engrafting hematopoietic stem cells (HSCs) remains unexplored. Here we purified A3A (N57Q)-BE3 protein for ribonucleoprotein (RNP) electroporation of human peripheral blood (PB) mobilized CD34+ hematopoietic stem and progenitor cells (HSPCs). We observed frequent on-target cytosine base edits at the BCL11A +58 erythroid enhancer with few indels. Fetal hemoglobin (HbF) induction in erythroid progeny after base editing or nuclease editing was similar. A single therapeutic base edit of the BCL11A enhancer prevented sickling and ameliorated globin chain imbalance in erythroid progeny from sickle cell disease (SCD) and β-thalassemia patient derived HSPCs respectively. Moreover efficient multiplex editing could be achieved with combined disruption of the BCL11A erythroid enhancer and correction of the HBB -28A>G promoter mutation. Finally base edits could be produced in multilineage-repopulating self-renewing human HSCs with high frequency as assayed in primary and secondary recipient animals resulting in potent HbF induction in vivo. Together these results demonstrate, to our knowledge for the first time, the potential of RNP base editing of human HSPCs as a feasible alternative to nuclease editing for HSC-targeted therapeutic genome modification.
Main text
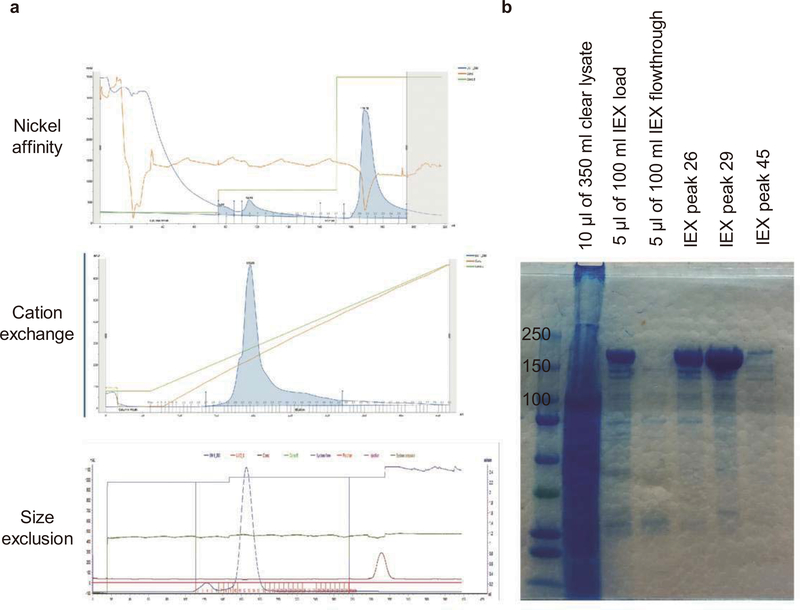
Delivery to HSCs of programmable endonucleases such as Cas9:sgRNA RNP complexes can lead to highly efficient genome editing, especially by non-homologous end joining (NHEJ) repair, that could plausibly contribute to cure of blood disorders1–7. For example, biallelic indels within a GATA1 binding motif at the +58 BCL11A erythroid enhancer yield efficient motif disruption, selective reduction of BCL11A expression in erythroid cells, preserved HSC function, and potent HbF induction in SCD and β-thalassemia erythroid progeny8. In contrast, base editing leverages programmable single base pair conversion9–12. The feasibility of base editing in HSCs to enable durable therapeutic modification of blood cells remains uncertain. The A3A (N57Q)-BE3 base editor targets cytosine within the TCR (R=A/G) motif context by replacing rat APOBEC1 (rAPO1) in the third generation base editor (BE3) with an engineered human APOBEC3A (A3A) domain13. The N57Q mutation reduces bystander mutations of cytosines beyond the TCR motif context within the base editing window. We recovered this base editor protein with high purity and yield (Extended Data Fig. 1).
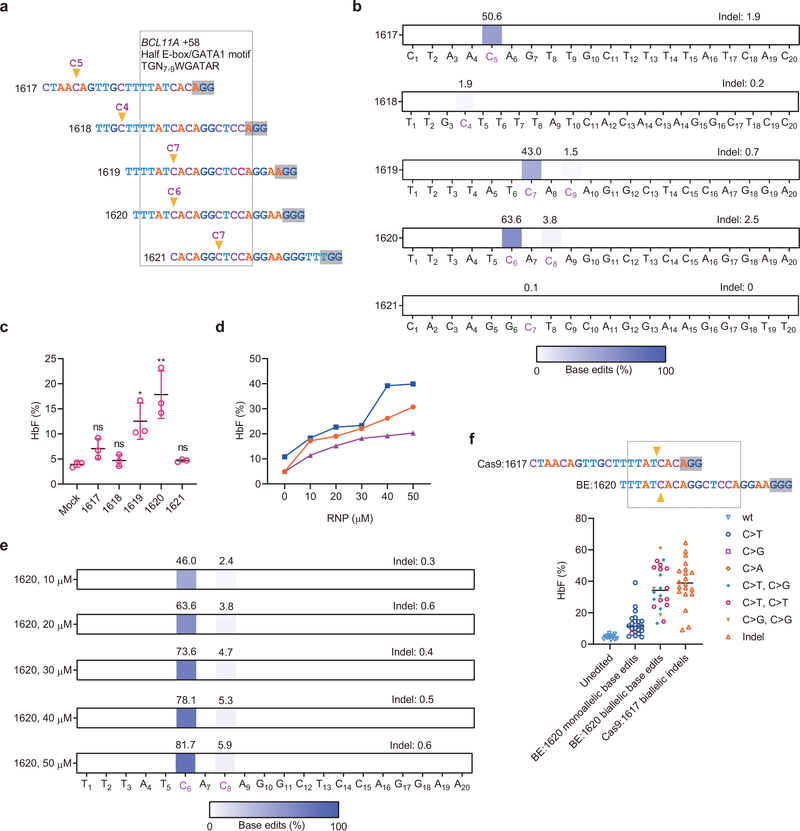
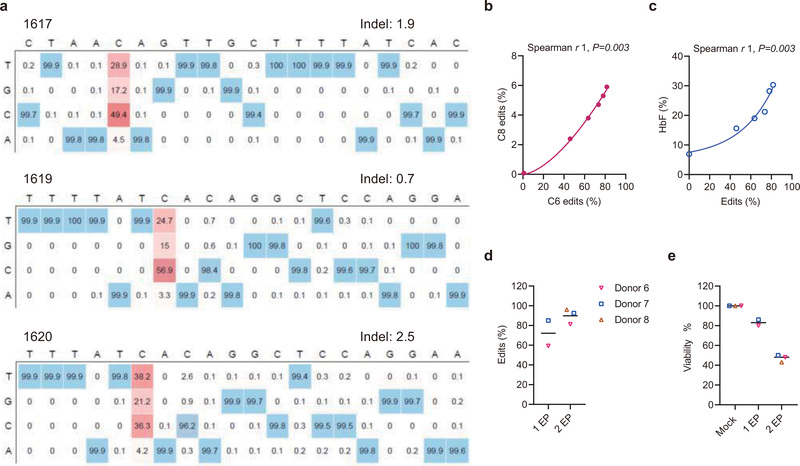
We electroporated A3A (N57Q)-BE3 base editor with five chemically modified synthetic sgRNAs as RNP complexes targeting the +58 BCL11A erythroid enhancer in human CD34+ HSPCs, including three sgRNAs with a cytosine within protospacer positions 5–9 overlapping a core TGN7–9WGATAR half E-box/GATA binding motif (Fig. 1a)8,14–16. Editing with sgRNA-1620 directly converted C at protospacer position 6 to T, G, and A at frequencies of 38.2%, 21.2%, and 4.2% respectively (Extended Data Fig. 2a). Shifted by one base pair in protospacer sequence sgRNA-1619 produced modestly lower base edit frequency (43.0% at C7 compared to 63.6% at C6 for sgRNA-1620, Fig. 1b and Extended Data Fig. 2a). While sgRNA-1617 yielded 50.6% base edits at C5, this site was not within the half E-box/GATA binding motif (Fig. 1a and Extended Data Fig. 2a). Consistent with the highest mutation frequencies at the GATA1 binding sequence, sgRNA-1620 editing resulted in the highest HbF level in erythroid progeny (Fig. 1b and 1c). We electroporated human CD34+ HSPCs with sgRNA-1620 complexed with A3A (N57Q)-BE3 base editor at concentrations ranging from 10–50 μM. Base editing was dose-dependent, with 50 μM RNP producing 81.7% base edits at position C6. There was a strong correlation between the robust base edit frequency at C6 and the lower level base edit frequency at C8, although C8 base edits outside the WGATAR motif may be of limited functional significance (Extended Data Fig. 2b, Spearman r 1, p<0.01). We observed strong correlation (Spearman r 1, p<0.05) between base edit frequency at C6 and HbF level (Fig. 1d, 1e, Extended Data Fig. 2c). We subjected HSPCs to single cell clonal erythroid liquid culture following base editing to compare genotype to globin expression. For comparison we also performed highly efficient nuclease editing using 3xNLS-SpCas9:sgRNA-1617 RNP8. The sgRNA-1620 base editing site and sgRNA-1617 indel site lead to modifications at the same GATA1 motif within their respective editing windows (Fig. 1f). Although monoallelic base editing was insufficient for robust HbF induction, biallelic base editing by either C>T or C>G resulted in similar HbF induction as biallelic indels (Fig. 1f). These results suggest that substitution of a single nucleotide within the core BCL11A +58 enhancer GATA1 motif is sufficient for robust HbF induction.
Fig. 1 |. Base editing the +58 BCL11A erythroid enhancer in human CD34+ HSPCs.
a, Five sgRNAs targeting the core +58 BCL11A erythroid enhancer TGN7–9WGATAR half E-box/GATA binding motif (shown in box) with predominant base editing position indicated by arrowhead and PAM shaded. b, Base editing by A3A (N57Q)-BE3 (20 μM) complexed with five sgRNAs at 20 μM each in human CD34+ HSPCs from three independent healthy donors by deep sequence analysis. Cytosines with measurable base editing labeled in purple. Heatmap displays base edit frequency. c, HbF levels by HPLC analysis following in vitro erythroid maturation of HSPCs from three healthy donors edited by each of the five indicated sgRNAs complexed with A3A (N57Q)-BE3 as RNP (20 μM). Data are plotted as mean±s.d. and analyzed using unpaired two-tailed Student’s t-test, ns for nonsignificant, * P=0.015 HbF levels following 1619 base editing compared with mock, n=3 individual donors, * P=0.007 HbF levels following 1620 base editing compared with mock, n=3 individual donors. d, HbF levels of erythroid progeny following dose response of RNP electroporation of HSPCs. Each color represents an individual healthy donor. e, Dose-dependent C base editing by A3A (N57Q)-BE3:sgRNA-1620 RNP electroporation of HSPCs. Base edits quantified by deep sequence analysis. f, Targeting same core +58 BCL11A erythroid enhancer TGN7–9WGATAR half E-box/GATA binding motif (shown in box) by A3A (N57Q)-BE3:sgRNA-1620 and 3xNLS-SpCas9:sgRNA-1617 with predominant base editing or cleavage position respectively indicated by arrowhead and PAM shaded. HbF levels by HPLC and genotype by Sanger sequencing from erythroid colonies derived from single HSPCs sorted 24 h after RNP electroporation. Data are plotted as grand median, n=14 unedited colonies, n=22 BE:1620 monoallelic base edited colonies, n=22 BE:1620 biallelic base edited colonies, n=20 Cas9:1617 biallelic edited colonies.
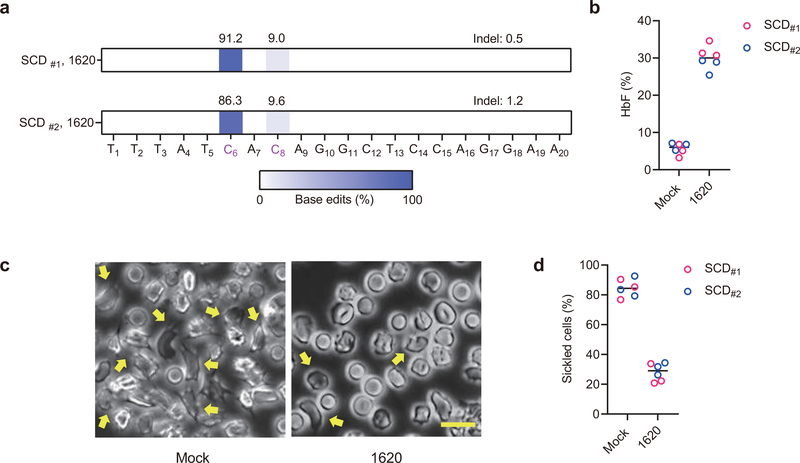
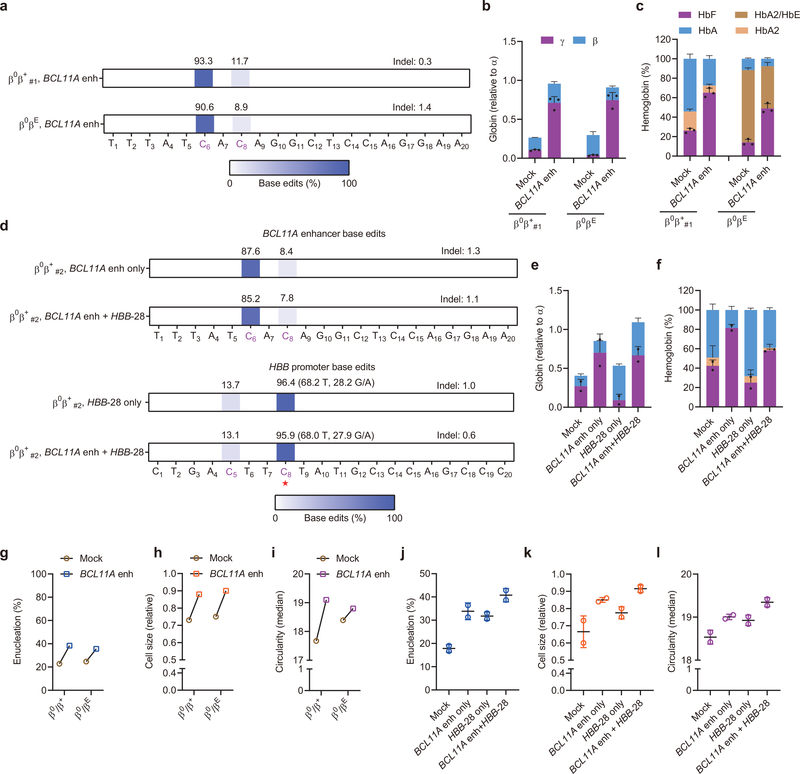
To further examine the potential benefit of base editing with regard to disease pathobiology, we evaluated therapeutic HbF induction by A3A (N57Q)-BE3 RNP editing of primary HSPCs from SCD and β-thalassemia patients. In healthy donor HSPCs, we found that base editing frequency increased from median 70.3% with one cycle of electroporation to 92.5% with two cycles of electroporation separated by 24 hours, although the HSPC viability was reduced from mean 83% to 47% (Extended Data Fig. 2d and 2e). Using plerixafor-mobilized peripheral blood CD34+ HSPCs from two SCD donors, we observed 91.2% and 86.3% editing at C6 within the targeting window with two cycles of electroporation (Fig. 2a). The bulk base edited erythroid progeny demonstrated 32.2% and 27.9% HbF as compared to baseline 5.0% and 6.4% (P<0.0001; Fig. 2b). While unedited enucleated erythroid cells showed robust sickling by sodium metabisulfite (MBS) treatment, we observed substantially fewer sickled cells following base editing (P<0.001; Fig. 2c and 2d). In addition, we edited non-mobilized peripheral blood CD34+ HSPCs from two β-thalassemia patients (one each with β0β+ and β0βE genotype). Base edit frequencies at the target BCL11A enhancer cytosine following A3A (N57Q)-BE3 RNP:sgRNA-1620 electroporation were 93.3% and 90.6% (Fig. 3a). In each donor, base edited erythroid cells showed potent γ-globin and HbF induction (Fig. 3b and 3c). Following base editing, we observed higher enucleation efficiency, larger size and more circular shape of enucleated erythroid cells from β-thalassemia donors, consistent with improved erythropoiesis (Fig. 3g–i).
Fig. 2 |. Therapeutic base editing in SCD patient CD34+ HSPCs.
a, Base editing in two plerixafor-mobilized SCD CD34+ HSPC donors by A3A (N57Q)-BE3:sgRNA-1620. Two cycles of HSPC electroporation with 40 μM RNP were performed, separated by 24 hours. Base edits were measured by deep sequence analysis. b, HbF induction by HPLC analysis of edited erythroid progeny. Data are plotted as grand median. n=3 technical replicates from each SCD patient. c, Phase-contrast microscope representative image of Hoechst 33342 negative sorted enucleated erythroid progeny 30 minutes after sodium metabisulfite (MBS) treatment from unedited and A3A (N57Q)-BE3:sgRNA-1620 base edited SCD #2 CD34+ HSPCs. Yellow arrows indicate sickle forms. Scale bar 10 μm. Three technical replicates were performed. d, Quantification of sickle forms from unedited and base edited enucleated erythroid cells at 30 minutes following MBS treatment. Data are plotted as grand median. n=3 technical replicates from each SCD patient.
Fig. 3 |. Therapeutic and multiplex base editing in β-thalassemia patient CD34+ HSPCs.
a, Base editing in β-thalassemia donors β0β+ #1 and β0βE CD34+ HSPCs by A3A (N57Q)-BE3:sgRNA-1620. Two cycles of HSPC electroporation with 40 μM RNP were performed, separated by 24 hours. Base edits were measured by deep sequence analysis. b, β-like globin expression by RT-qPCR normalized by α-globin, measured from edited erythroid progeny. Data are plotted as mean±s.d. n=3 replicates from independent differentiation cultures. c, Hemoglobin levels by HPLC analysis. Data are plotted as mean±s.d. n=3 replicates from independent differentiation cultures. d, Base editing by A3A(N57Q)-BE3 at BCL11A +58 enhancer with sgRNA-1620 (top two rows) and HBB promoter by sgRNA-HBB-28 (bottom two rows) following single or multiplex editing in β-thalassemia donor β0β+#2 with HBB-28A>G β+ mutation. At the HBB-28A>G mutation position (noted with red asterisk, on opposite strand to spacer), alleles are divided into corrective C>T edits and alternative C>G/A edits. Because the donor is heterozygous at position C8, ~50% of alleles are T in unedited cells. e, β-like globin expression by RT-qPCR normalized by α-globin. Data are plotted as mean±s.d. n=2 replicates from independent electroporation. f, Hemoglobin levels by HPLC analysis. Data are plotted as mean±s.d. n=2 replicates from independent electroporations. g, j, Enucleation of in vitro differentiated erythroid cells from BCL11A enhancer only or multiplex editing experiments respectively. Data are plotted as mean±s.d. n=2 replicates from independent electroporations. h, k, Cell size by relative forward scatter intensity of enucleated erythroid cells, normalized to healthy donor, from BCL11A enhancer only or multiplex editing experiments respectively. Data are plotted as mean±s.d. n=2 replicates from independent electroporations. i, l, Circularity of enucleated erythroid cells by imaging flow cytometry, from BCL11A enhancer only or multiplex editing experiments respectively. Data are plotted as mean±s.d. n=2 replicates from independent electroporations.
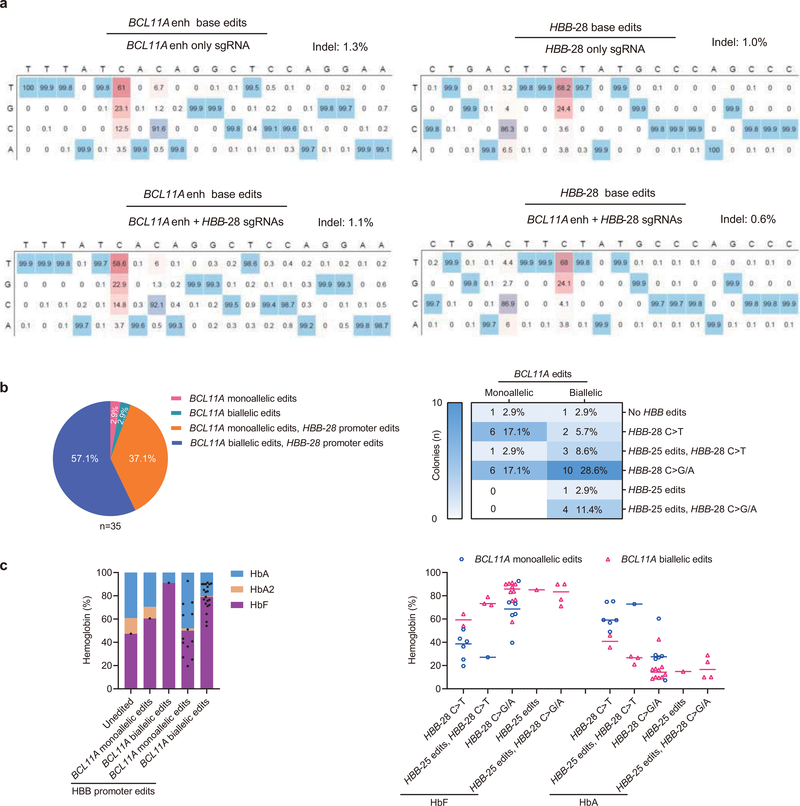
Previously we observed that in committed erythroid precursors A3A (N57Q)-BE3:sgRNA-HBB-28 RNP electroporation could selectively repair the common Chinese β-thalassemia promoter mutation HBB −28 A>G (T>C on complementary strand) while minimizing unwanted bystander cytosine modifications13,17–19. We evaluated A3A (N57Q)-BE3:sgRNA-HBB-28 RNP base editing by electroporation of HSPCs from a β-thalassemia patient compound heterozygous for the HBB −28 A>G β+ mutation and a null β0 allele (β0β+#2). Despite 18.2% corrective C>T editing at C8 (68.2% T includes non-mutant T allele), we observed 28.2% non-corrective C>G/A edits at C8, 3.6% unedited C8 alleles, and 13.7% disruptive C5 base edits (Fig. 3d and Extended Data Fig. 3a). We speculated that multiplex base editing with A3A (N57Q)-BE3 targeting both the HBB −28 A>G mutation and BCL11A enhancer +58 GATA motif could produce positive interactive effects. In β-thalassemia, either γ-globin induction or β-globin repair could be therapeutic, since the total level of β- and γ-globin determines the degree of α-globin chain excess. We observed that multiplex editing led to similar base edits at each target site as compared with single editing (Fig. 3d, Extended Data Fig. 3a). Multiplex editing resulted in higher β-globin expression than sgRNA-1620 editing alone and higher γ-globin expression than sgRNA-HBB-28 editing alone (Fig. 3e–3f). Multiplex edited erythroid cells showed increased enucleation frequency, cell size and circularity (Fig. 3j–l). Colony analysis demonstrated that HBB-28 C>T editing restored β-globin expression in BCL11A enhancer monoallelic edited colonies while biallelic BCL11A enhancer editing produced robust HbF induction in colonies in which HBB-28 editing failed to correct the thalassemia mutation (Extended Data Fig. 3c). 27/35 (77.1%) of colonies had biallelic edits at BCL11A enhancer and/or corrective C>T editing at the HBB promoter (Extended Data Fig. 3b). These results indicate that RNP base editing can produce efficient therapeutically relevant multiplex edits in primary human HSPCs.
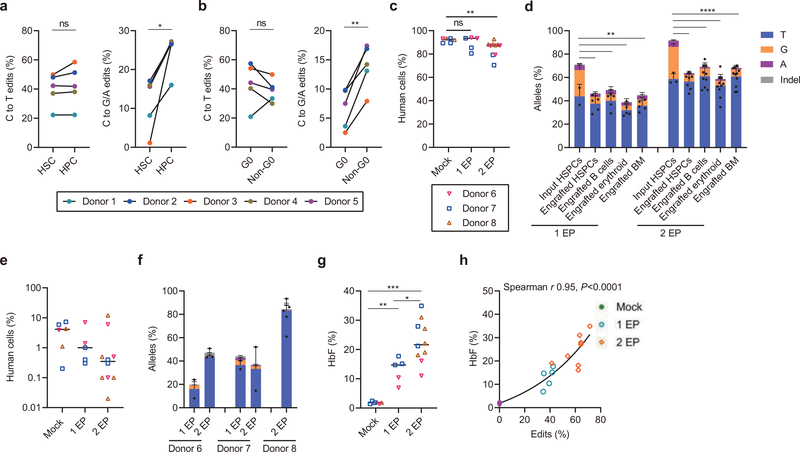
The types and frequencies of nuclease-mediated gene edits in engrafting HSCs often differ as compared to those in bulk HSPCs2,8,20. To investigate base editing in HSCs, we sorted an HSC-enriched CD34+ CD38− CD90+ CD45RA− population and a committed hematopoietic progenitor cell (HPC) enriched CD34+ CD38+ population two hours following A3A (N57Q)-BE3:1620 RNP electroporation of HSPCs from five healthy donors. Overall base editing frequencies in HSC enriched cells were lower than in HPCs (P<0.05; Extended Data Fig. 4a). Most of this reduction was due to lower C>G/A frequencies in HSC enriched cells as compared to HPCs (P<0.05; Fig. 4a, right). In contrast, C>T frequencies were similar between HSC and HPC populations (Fig. 4a, left). Since HSCs tend to be quiescent relative to HPCs, we sorted G0, G1, S and G2/M phase HSPCs to evaluate potential cell cycle dependence of base editing. We found that C>G/A frequencies were reduced in G0 phase HPSCs compared with non-G0 phase HSPCs (P<0.01; Fig. 4b and Extended Data Fig. 4b). These results suggest that base editing of quiescent HSCs may be more challenging than proliferative HPCs.
Fig. 4 |. Efficient C>T base editing in HSCs.
a-b, CD34+ HSPCs were electroporated with A3A (N57Q)-BE3:sgRNA-1620 RNP (40 μM) 24 hours after thawing cryopreserved cells. After an additional two hours cells were sorted by FACS. After 4 days of culture, base edits were evaluated by amplicon deep sequencing. a, Frequencies of C>T base editing (left) and C>G/A base editing (right) at sgRNA-1620 C6 position in sorted immunophenotypically enriched HSC (CD34+ CD38- CD90+ CD45RA-) or HPC (CD34+ CD38+) populations. Data are analyzed using paired two-tailed Student’s t-test, ns for nonsignificant, * P=0.015 C>G/A base edits in HSC compared with HPC, n=5 independent healthy donors. b, Frequencies of C>T base editing (left) and C>G/A base editing (right) at sgRNA-1620 C6 position in Pyronin Y and Hoechst stained and sorted G0 and non-G0 including G1, S and G2/M phase CD34+ HSPCs. Data are analyzed using paired two-tailed Student’s t-test, ns for nonsignificant, * P=0.0025 C>G/A base edits in G0 compared with non-G0, n=5 independent healthy donors. c, Following A3A(N57Q)-BE3:sgRNA-1620 RNP (40 μM) base editing with one or two cycles of electroporation, 800,000 live HSPCs, counted immediately prior to infusion, were infused to NBSGW mice. Human bone marrow chimerism 16 weeks following base edited HSPC infusion. Data are plotted as grand median and analyzed using Kolmogorov-Smirnov test, ns for nonsignificant. ** P=0.0017 comparing human chimerism of mock with 2 EP, n=6 mice from mock, n=5 mice from 1 EP, n=10 mice from 2 EP. d, Base editing at C6 position in engrafting HSPCs, B cells, erythroid cells and unfractionated bone marrow after 16 weeks as compared with input HSPCs following 1 or 2 cycles of electroporation (1 EP, 2 EP). Each dot indicates one mouse recipient. Data are plotted as mean±s.d. and analyzed using unpaired two-tailed Student’s t-test, ** P<0.01, C>G/A base edits in engrafting cells vs. input cells following one cycle of electroporation, P=0.0034 engrafted HSPCs vs. input HSPCs, P= 0.0041 engrafted B cells vs. input HSPCs, P=0.0019 engrafted erythroid cells vs. input HSPCs, P= 0.0015 engrafted BM vs. input HSPCs, n=2 independent healthy donors from input HSPCs, n=5 primary recipients. **** P<0.0001 compared C>G/A base edits in engrafting cells with input cells following two cycles of electroporation, n=3 independent healthy donors from input HSPCs, n=7 primary recipients for engrafted HSPCs, n=10 primary recipients for engrafted B cells and erythroid, n=11 primary recipients for engrafted BM. e, Human bone marrow chimerism 16 weeks after secondary transplantation. Donor 6 and donor 7 with 1 cycle EP and 2 cycles EP, and donor 8 with 2 cycles EP are shown. Data are plotted as grand median, n=6 secondary recipients from mock, n=5 secondary recipients from 1 EP, n=10 secondary recipients from 2 EP. f, Base editing by deep sequence analysis at C6 position in bone marrow 16 weeks after secondary transplantation. Data are plotted as median with range, n=2 secondary recipients from donor 6 with 1 EP, n=3 secondary recipients from donor 6 with 2 EP, n=2 secondary recipients from donor 7 with 1 EP, n=2 secondary recipients from donor 7 with 2 EP, n=5 secondary recipients from donor 8 with 2 EP. g, HbF induction by HPLC in engrafted bone marrow human erythroid cells. Data are plotted as grand median and analyzed using Kolmogorov-Smirnov test, **P=0.004, *** P=0.0002 HbF level in engrafted erythroid cells with 1 EP or 2 EP as compared to mock. *P=0.019 HbF level in engrafted erythroid cells with 2 EP as compared to 1 EP, n=6 primary recipients from mock, n=5 primary recipients from 1 EP, n=10 primary recipients from 2 EP. h, Correlation of base edit frequency and HbF level in engrafted erythroid cells. Data are analyzed using two-tailed nonparametric Spearman correlation. The Spearman correlation coefficient (r) is shown, P<0.0001. n=6 primary recipients from mock, n=5 primary recipients from 1 EP, n=10 primary recipients from 2 EP.
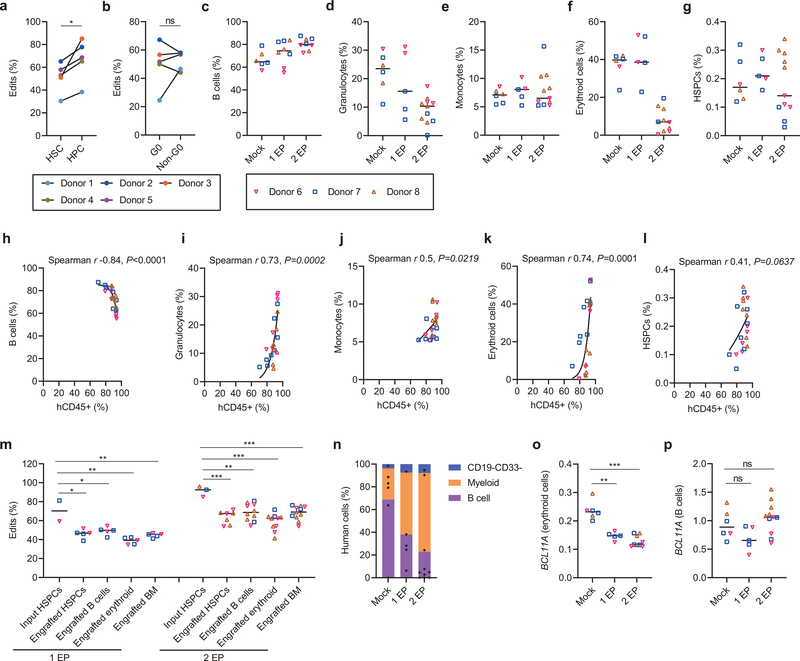
To evaluate the functional potential of base edited HSCs, we infused an equal number of viable unedited or edited CD34+ HSPCs from three healthy donors following one or two cycles of RNP electroporation into NBSGW mice, which support multilineage human hematopoietic engraftment in the absence of conditioning therapy21. After 16 weeks we measured human hematopoietic engraftment from isolated bone marrow. There was similar human chimerism with one cycle of RNP electroporation and only modest reduction with two cycles of RNP electroporation compared to non-electroporated HPSCs (median 92.7% for mock, 93.5% for 1 EP cells, and 87.5% for 2 EP cells, p<0.01 for mock vs. 2 EP, Fig. 4c). Infusion of equal numbers of viable HSPCs appeared to largely overcome the impact of reduced viability associated with two cycles of electroporation (Extended Data Fig. 2e) on engraftment potential.
The overall base editing frequency in engrafted BM following one cycle of RNP electroporation was 45.5% as compared to 70.3% in the input HSPCs. The overall base editing frequency in engrafted BM following two cycles of RNP electroporation was 69.1% compared with 92.5% in input HSPCs (Fig. 4d, Extended Data Fig. 4m). Most of the reduction in base editing frequency in engrafting cells resulted from loss of C>G/A base edits. C>G/A edits comprised 26.5% and 32.1% of alleles in input HSPCs following one and two cycles of RNP electroporation but only 10.4% and 6.1% of alleles in engrafted BM (P<0.01 and P<0.0001; Fig. 4d). In contrast, the C>T base edited allele frequencies were similar comparing the input to engrafted cells, with 43.8% input and 35.1% engrafted with one cycle of RNP electroporation and 56.4% input and 63.4% engrafted with two cycles of RNP electroporation. Together with the ex vivo studies, these results suggest that engrafting quiescent HSCs as compared to non-engrafting proliferative progenitors favor C>T base edits.
The hallmark features of HSCs are the capacity for multilineage hematopoietic repopulation and self-renewal. Lymphoid, myeloid, erythroid and HSPC lineage repopulation was evaluated by flow cytometry of engrafted bone marrow (Extended Data Fig. 5a–i). We observed multilineage engraftment in all recipients. Mice with greater human chimerism demonstrated a greater fraction of granulocyte and erythroid contribution with reciprocal reduction in B-lymphocyte contribution (Spearman r 0.73, 0.74, −0.84 and p <0.001, <0.001, <0.0001 respectively, Extended Data Figure 4c–4l, Extended Data Figure 5). We found similar base editing allele frequency in each hematopoietic lineage (39.3–49.8% for 1 EP and 62.3–68.7% for 2 EP, Extended Data Fig. 4m).
Secondary transplantation revealed multilineage human hematopoietic engraftment in each secondary recipient consistent with HSC activity (Fig. 4e, Extended Data Fig 4n). We observed median 34.4% (8.3–47%) base edits in secondary BM recipients with one cycle of RNP electroporation and 58.5% (16.2–94.3%) base edits in secondary BM recipients with two cycles of RNP electroporation (Fig. 4f). These data suggest the feasibility to produce base edits in long-term HSCs.
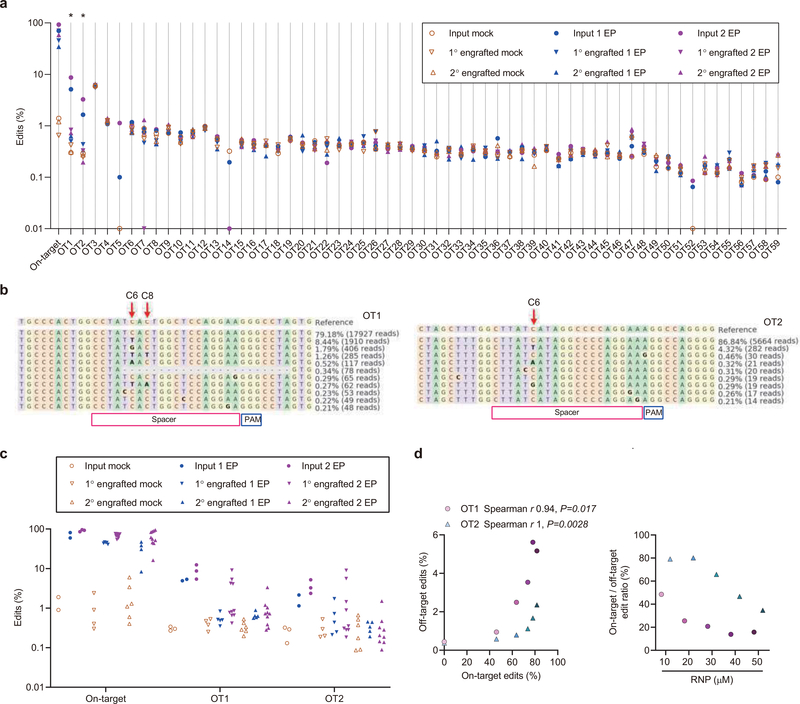
We performed in silico analysis to identify potential guide RNA-dependent off-target base editing sites and then directly evaluated each of these sites by targeted amplicon deep sequencing. We identified 59 potential genomic off-target sites with 3 or fewer mismatches relative to the on-target site. We performed amplicon deep sequencing for each of these sites in genomic DNA samples isolated from cells with efficient on-target editing and from negative control cells that were not edited. At 57 of these sites we could not detect evidence of off-target base editing in edited cells compared with negative control cells (Extended Data Fig 6a). At two sites, hg38 chr4:4338932–4338954 (OT1) and chr3:197489118–197489140 (OT2), we detected a difference between control and edited samples with editing efficiencies of 7.4% and 2.8% (p<0.05, Extended Data Fig 6a, b). Neither of these sites overlaps coding, regulatory, or conserved sequence elements. We found these off-target base edits were present in input samples and engrafted samples at similar frequency, consistent with no selective functional impact of off-target editing on HSC engraftment (Extended Data Fig 6c). We performed an RNP dose-response experiment to evaluate the relationship between on-target and off-target base editing. On-target:off-target base editing ratios could be maximized by reducing exposure to base editor RNP (Extended Data Fig 6d). Together these results suggest only minimal guide RNA-dependent DNA off-target potential of RNP base editing.
Since NBSGW mice support erythroid repopulation with strong HbF repression, this is a stringent system to evaluate HbF induction potential8,22. After base editing, we found that BCL11A expression was decreased in engrafting erythroid cells while maintained in B-lymphoid cells, as expected for erythroid-specific enhancer disruption (Extended Data Fig. 4o–4p). Median HbF levels were 1.8% in engrafting erythroid cells from unedited HSPCs, 14.7% after one cycle of RNP electroporation, and 21.7% after two cycles of RNP electroporation (Fig. 4g). There was a strong correlation between base edit frequency and HbF level of engrafting erythroid cells (Spearman r 0.95, p<0.0001, Fig. 4h), supporting the therapeutic potential of this single base edit.
Discussion
Programmable endonuclease-mediated genome editing of hematopoietic cells is under active clinical investigation for a number of hematologic, malignant, and infectious indications, including BCL11A enhancer editing for β-hemoglobinopathies, although each of the completed23,24 and ongoing (NCT 03653247, 03432364, 03745287, 03655678, 02500849, 03399448) trials leverages NHEJ-mediated genetic disruption. The therapeutic application of homology-dependent recombination may be especially challenging given requirement for co-delivery of donor DNA sequences, intrinsic resistance of quiescent stem cells, and competing repair by NHEJ. In contrast, base editing offers the potential for precise single base substitution with high product purity while bypassing requirement for double-strand breaks (DSBs) or extrachromosomal template12,25.
Here we purified A3A (N57Q)-BE3 RNP for use in HSPCs. We found that higher concentrations of base editor as compared to Cas9 RNPs were required to achieve on-target editing8. Furthermore, multiple cycles of electroporation could increase on-target base editing but decreased HSPC viability and engraftment potential. These results suggest that enhanced HSC delivery or base editor efficiency could further improve the therapeutic promise of base editing. Nonetheless we observed efficient base edits in HSPCs. We found that a single base edit at core sequences of the +58 BCL11A erythroid enhancer produced similar HbF induction as Cas9 nuclease mediated indels, resulted in therapeutically relevant HbF induction in erythroid cells derived from β-thalassemia and SCD patient HSPCs, and generated durable base edits in multilineage-repopulating self-renewing HSCs. An unexpected observation was that HSCs favored C>T as compared to C>G/A base edits, suggesting intrinsic preferences for DNA damage repair in HSCs, analogous to has been observed for DSB repair20.
One general concern for genome editing is off-target genotoxicity. In this study, we detected two sites of guide RNA-dependent DNA off-target editing, each without predicted functional importance or selective impact on HSC engraftment. Reduced RNP exposure increased the ratio of on-target to off-target editing, suggesting that if need be, conventional means of mitigating guide RNA-specific off-target potential, such as minimizing exposure and reducing excess interaction energy of RNPs, could help to limit off-target risk. Other off-targets of base editing may include guide RNA-independent effects26,27, such as RNA and DNA editing. The base editor we used has an attenuated cytosine deaminase domain A3A (N57Q)13. Similarly attenuated A3A-BE3 editors have been shown to substantially reduce RNA off-targets28. Prior to clinical implementation of therapeutic base editing, we suggest that more comprehensive off-target analysis would be indicated, including empiric evaluation of guide RNA-dependent off-target DNA editing potential and guide RNA-independent RNA and DNA editing.
In summary, these studies demonstrate that highly efficient, specific, and disease ameliorating base editing in human HSCs is feasible with RNP delivery and may encourage therapeutic application of base editing for a range of disorders in which corrected or augmented hematopoiesis could be beneficial.
Methods
Cell culture
Human CD34+ HSPCs from mobilized peripheral blood of deidentified healthy donors were obtained from Fred Hutchinson Cancer Research Center, Seattle, Washington. Sickle cell disease patient CD34+ HSPCs were isolated from plerixafor mobilized peripheral blood (IRB P00023325, FDA IND 131740) and β-thalassemia patient CD34+ HSPCs (Supplementary Table 1) were isolated from unmobilized peripheral blood following Boston Children’s Hospital institutional review board approval and patient informed consent. CD34+ HSPCs were enriched using the Miltenyi CD34 Microbead kit (Miltenyi Biotec). CD34+ HSPCs were thawed and cultured into X-VIVO 15 (Lonza, 04–418Q) supplemented with 100 ng ml−1 human SCF, 100 ng ml−1 human thrombopoietin (TPO) and 100 ng ml−1 recombinant human Flt3-ligand (Flt3-L). HSPCs were electroporated with A3A (N57Q)-BE3 RNP 24 h after thawing. For in vitro erythroid differentiation experiments, 24 h after electroporation, HSPCs were transferred into erythroid differentiation medium (EDM) consisting of IMDM supplemented with 330 μg ml−1 holo-human transferrin, 10 μg ml−1 recombinant human insulin, 2 IU ml−1 heparin, 5% human solvent detergent pooled plasma AB, 3 IU ml− erythropoietin, 1% L-glutamine, and 1% penicillin/streptomycin. During days 0–7 of culture, EDM was further supplemented with 10−6 M hydrocortisone (Sigma), 100 ng ml−1 human SCF, and 5 ng ml−1 human IL-3 (R&D) as EDM-1. During days 7–11 of culture, EDM was supplemented with 100 ng ml−1 human SCF only as EDM-2. During days 11–18 of culture, EDM had no additional supplements as EDM-3. HbF induction was assessed on day 18 of erythroid culture.
Protein expression and purification
For protein expression, RIPL-BL21 (DE3) competent cells transformed with A3A (N57Q)-BE3 plasmid were grown in TB media at 37°C and switched to 15°C. Cells were induced by 1 mM isopropyl ß-d-1-thiogalactopyranoside (IPTG) for 16–20 hours. Cell paste was collected and lysed in PBS buffer containing 500 mM NaCl and 10% glycerol using microfluidizer. The lysate was centrifuged at 18,000 g for 40 mins. Proteins were purified using nickel affinity, cation exchange, and Superdex 200 size exclusion columns sequentially. The purified protein was concentrated in 30 mM HEPES buffer of pH 7.4 containing 150 mM NaCl and 10% glycerol. Protein samples and fractions were separated using SDS-PAGE and stained using GelCode Blue Stain Reagent (Fisher).
RNP electroporation
Electroporation was performed using Lonza 4D Nucleofector (V4XP-3032 for 20 μl Nucleocuvette Strips or V4XP-3024 for 100 μl Nucleocuvettes) as the manufacturer’s instructions. The modified synthetic sgRNA (2’-O-methyl 3’ phosphorothioate modifications in the first and last 3 nucleotides) was from Synthego. sgRNA concentration is calculated using the full-length product reporting method, which is 3-fold lower than the OD reporting method. CD34+ HSPCs were thawed 24 h before electroporation. For 20 μl Nucleocuvette Strips, the RNP complex was prepared by mixing A3A (N57Q)-BE3 protein (800 pmol) and sgRNA (800 pmol, full-length product reporting method) and incubating for 15 min at room temperature immediately before electroporation. 50K HSPCs resuspended in 20 μl P3 solution were mixed with RNP and transferred to a cuvette for electroporation with program EO-100. For 100 μl cuvette electroporation, the RNP complex was made by mixing 4000 pmol A3A (N57Q)-BE3 protein and 4000 pmol sgRNA. 5M HSPCs were resuspended in 100 μl P3 solution for RNP electroporation as described above. For one cycle of electroporation, the electroporated cells were resuspended with X-VIVO medium with cytokines and changed into EDM 24 h later for in vitro differentiation. For two cycles of electroporation, the electroporated cells were maintained in X-VIVO medium with cytokines, a second electroporation was performed 24 h after the first, and the cells were cultured in X-VIVO medium with cytokines for 24 h after the final electroporation. Then cells were used for transplant or transferred to EDM for in vitro differentiation. For all mouse transplantation experiments, cells were maintained in X-VIVO 15 with cytokines prior to infusion.
Measurement of base editing
Edit frequencies were measured with cells cultured in EDM 5 days after electroporation. Briefly, genomic DNA was extracted using the Qiagen Blood and Tissue kit. BCL11A enhancer DHS +58 core and HBB promoter −28 region were amplified with KOD Hot Start DNA Polymerase and corresponding primers using the following cycling conditions: 95 degrees for 3 min; 35 cycles of 95 degrees for 20 s, 60 degrees for 10 s, and 70 degrees for 10 s; 70 degrees for 5 min (Supplementary Table 2). Resulting PCR products were subjected to Sanger sequencing or Illumina deep sequencing. For Sanger sequencing, traces were imported to EditR software29 for base editing measurement. For deep sequencing, BCL11A enhancer loci or HBB promoter loci were amplified with corresponding primers firstly. After another round of PCR with primers containing sample-specific barcodes and adaptor, amplicons were sequenced for 2×150 paired-end reads with MiSeq Sequencing System (Illumina). Frequencies of editing outcomes were quantified using CRISPResso2 software30 (v2.0.31 CRISPRessoBatch --quantification_window_center −10 --quantification_window_size 10 --base_editor_target C –base_editor_result T –base_editor_output TRUE ) and collapsed based on mutations in the quantification window. Indels overlapping the spacer sequence were counted as indels and C>N substitutions at spacer positions 1–10 were counted as base edits for total edit quantification. For base edit heatmaps, indels were excluded prior to calculation of nucleotide substitution frequency.
Guide RNA-dependent off-target site analysis
Using the CasOFFinder tool31, 59 potential off-target sites with 3 or fewer genomic mismatches and no bulges were identified. rhAmpSeq assays covering the 59 off-target sites were designed and synthesized by IDT (Supplementary 3). Off-target sites were amplified with rhAmpSeq Library Mix 1 (rhAmpSeq Library Kit, IDT) and rhAmpSeq forward and reverse assay primer pools. 50 ng of gDNA was used per reaction using the following cycling conditions: 95 °C for 10 min; 14 cycles of 95 °C for 15 s, 61°C for 8 min; and 99.5 °C for 15 min. PCR product was diluted to 1:20 and performed indexing PCR by adding rhAmpSeq index primers and Library Mix 2 using the following cycling conditions: 95 °C for 3 min; 24 cycles of 95 °C for 15 s, 60°C for 30s, 72 °C for 30 s; and 72 °C for 1 min. Primers for the on-target region and four off-targets which failed in rhAmpSeq pooled PCR amplification were designed with BatchPrimer3 and amplified with Q5 High-Fidelity DNA polymerase using the following cycling conditions: targeted PCR 1: 98 °C for 30 s, 30 cycles of 98 °C for 15 s, 65 °C for 25 s, 72 °C for 25 s; 72 °C for 2 min. Indexing PCR 2: 98 °C for 30 s, 10 cycles of 98 °C for 15 s, 65 °C for 25 s, 72 °C for 25 s; 72 °C for 2 min. Amplicons were sequenced in the MiniSeq Sequencing System, and sequencing adapters were trimmed using Trimmomatic v.0.36 (PE CROP:150 MINLEN:10). Paired-end reads were pooled by sample and aligned to both provided off-target regions and the hg38 genome build in CRISPResso (v.2.0.31 CRISPRessoPooled --quantification_window_center −10 --quantification_window_size 10 --base_editor_target C –base_editor_result T –base_editor_output TRUE –min_reads_to_use_region 10). For on-target amplicons sequenced by MiniSeq, read 1 had low quality scores due to G homopolymer so only read 2 was analyzed. One-tailed Student’s t-tests (alpha = 0.05) were used to compare mean editing frequencies between edited and unedited samples for each target site. Potential off-target sites with editing frequency difference between control and edited samples of at least 0.1% and with p<0.05 were considered as confirmed off-target sites. Measured edits >0.1% were visually inspected to evaluate for potential sequencing or alignment artifacts. Off-target sites OT1 and OT2 were compared to ATAC-seq peaks32 and with conservation scores using the UCSC PhastCons track based on multiple alignments of 45 vertebrate genomes to the human genome33. These sites did not overlap coding sequences or chromatin accessible peaks and showed very low conservation scores (OT1 0.06, OT2 0.001).
RT-qPCR quantification of globin and BCL11A expression
RNA isolation with RNeasy columns (Qiagen, 74106) and reverse transcription with iScript cDNA synthesis kit (Bio-Rad, 170–8890), RT–qPCR with iQ SYBR Green Supermix (Bio-Rad, 170–8880) was used to determine globin expression with primers amplifying HBG1/2, HBB or HBA1/2 cDNA8. BCL11A mRNA expression was determined by primers amplifying BCL11A or CAT as internal control (Supplementary Table 2). We used CAT as a reference transcript since it is both highly expressed and stable throughout erythroid maturation. All gene expression data represent the mean of at least three technical replicates.
Hemoglobin HPLC
Hemolysates were prepared from either: 1) erythroid cells after 18 days of erythroid differentiation for in vitro differentiation experiments, or 2) from human erythroid cells directly purified from xenotransplanted mouse bone marrow by CD235a microbead (130–050-501, Miltenyi Biotec) for engraftment experiments. Hemolysate reagent (5125, Helena Laboratories) was used and samples analyzed with D-10 Hemoglobin Analyzer (Bio-Rad). HbA2 and HbE cannot be distinguished by this method.
Clonal culture of CD34+ HSPCs
Edited CD34+ HSPCs were sorted into 180 μl EDM-1 in 96-well round bottom plates (Nunc) at one cell per well using FACSAria II. The cells were changed into EDM-2 media 7 days later in 24-well plates (Nunc). After additional 4 days of culture, the cells were changed into 300–500 μl EDM-3 for further differentiation. After additional 7 days of culture, half of the cells were harvested for genotyping analysis and half for a single hemoglobin HPLC measurement per colony.
In vitro sickling and microscopy analysis
In vitro differentiated erythroid cells were stained with 2 μg ml−1 of the cell-permeable DNA dye Hoechst 33342 (Life Technologies) and the enucleated cells which are negative for Hoechst 33342 were FACS sorted and subjected to in vitro sickling assay. Sickling was induced by adding 500 μl freshly prepared 1.5% sodium metabisulfite (MBS) solution prepared in PBS into enucleated cells resuspended with 500 μl EDM-3 in 24-well plate, followed by incubation at room temperature. Live cell images were acquired using a Nikon Eclipse Ti inverted microscope. Image acquisition was performed at room temperature and air in 24-well plate. Sickled cells were quantified as number of sickle-form cells divided by total cells, counting at least 200 cells. Data were analyzed by paired two-tailed Student’s t-test.
Human CD34+ HSPC transplant and flow cytometry analysis
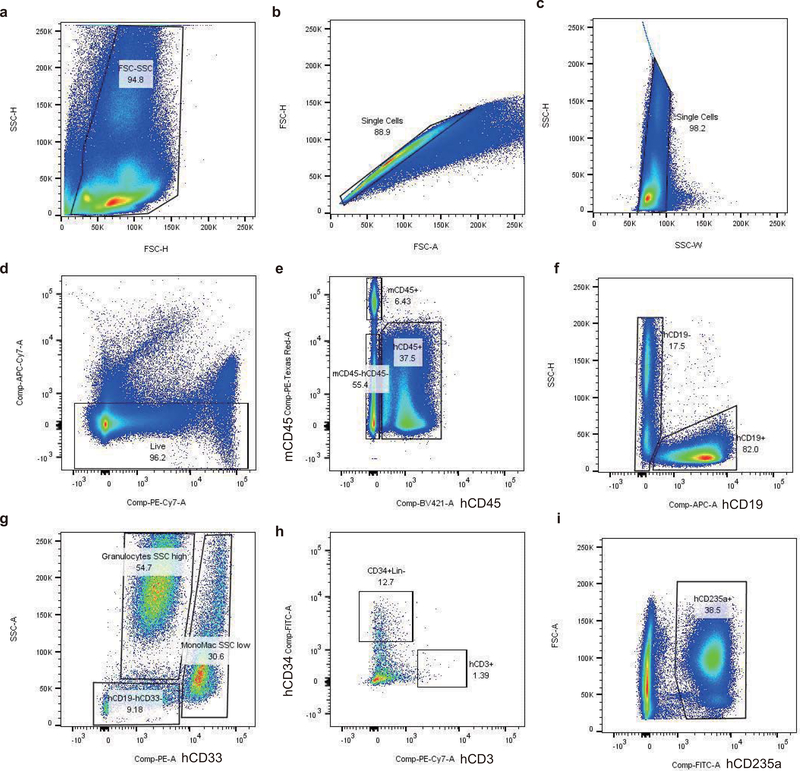
All animal experiments were approved by the Boston Children’s Hospital Institutional Animal Care and Use Committee. NOD.Cg-KitW−41J Tyr + Prkdcscid Il2rgtm1Wjl (NBSGW) mice were obtained from Jackson Laboratory (Stock 026622). Non-irradiated NBSGW female mice (4–5 weeks of age) were infused by retro-orbital injection with 0.8M CD34+ HSPCs (live cells counted immediately prior to infusion, resuspended in 200 μl DPBS) derived from healthy donors. Bone marrow was isolated for human xenograft analysis 16 weeks post engraftment. Secondary transplants were conducted using retro-orbital injection of bone marrow cells from the primary recipients. For flow cytometry analysis of bone marrow, BM cells were first incubated with Human TruStain FcX (422302, BioLegend) and TruStain fcX ((anti-mouse CD16/32, 101320, BioLegend) blocking antibodies for 10 min, followed by the incubation with V450 Mouse Anti-Human CD45 Clone HI30 (560367, BD Biosciences), PE-eFluor 610 mCD45 Monoclonal Antibody (30-F11) (61–0451-82, Thermo Fisher), FITC anti-human CD235a Antibody (349104, BioLegend), PE anti-human CD33 Antibody (366608, BioLegend), APC anti-human CD19 Antibody (302212, BioLegend), FITC anti-human CD34 Antibody (343504, BioLegend), PE/Cy7 anti-human CD3 Antibody (300420, BioLegend) and Fixable Viability Dye eFluor 780 for live/dead staining (65–0865-14, Thermo Fisher). Percentage human engraftment was calculated as hCD45+ cells/(hCD45+ cells + mCD45+ cells) × 100. B cells (CD19+) was gated on the hCD45+ population. Granulocytes and monocytes were gated on the hCD45+hCD19−. Human erythroid cells (CD235a+) were gated on mCD45−hCD45− population. Human HSPCs (CD34+Lin-) were gated on hCD45+hCD19-hCD33- population. For the staining with immunophenotype markers of HSCs, CD34+ HSPCs were incubated with Pacific Blue anti-human CD34 Antibody (343512, Biolegend), PE/Cy5 anti-human CD38 (303508, Biolegend), APC anti-human CD90 (328114, Biolegend), APC-H7 Mouse Anti-Human CD45RA (560674, BD Bioscience). Cell cycle phase in live CD34+ HSPCs was detected by flow cytometry as described previously8. Cells were resuspended in pre-warmed HSPC medium. First, we added Hoechst 33342 to a final concentration of 10 μg/ml and incubated at 37 degrees for 15 min. Then we added Pyronin Y directly to cells at a final concentration of 3 μg/ml and incubated at 37 degrees for 15 min. After washing with PBS, we performed flow cytometric analysis or cell sorting. Cell sorting was performed on a FACSAria II machine (BD Biosciences). Fraction of B cells, granulocytes, monocytes and HSPCs calculated as percentage of hCD45+ cells. Fraction of erythroid cells calculated as percentage of hCD45- mCD45- cells.
Flow cytometry for enucleation and cell size analysis
For the enucleation analysis, cells were stained with 2 μg ml−1 of the cell-permeable DNA dye Hoechst 33342 (Life Technologies) for 10 minutes at 37 degrees. The Hoechst 33342 negative cells were further gated for cell size analysis with Forward Scatter (FSC) A parameter. Median value of forward scatter intensity normalized by data from healthy donors collected at the same time was used to characterize the cell size.
Imaging flow cytometry analysis
In vitro differentiated erythroid cells stained with Hoechst 33342 were resuspended with 150 μl DPBS for analysis with Imagestream X Mark II (Merck Millipore). Well-focused Hoechst negative single cells were gated for circularity analysis with IDEAS software. Cells with circularity score above 15 were further gated to exclude cell debris and aggregates. No fewer than 2000 gated cells were analyzed to obtain a median circularity score.
Reporting Summary.
Further information on research design is available in the Nature Research Reporting Summary linked to this article.
Extended Data
Extended Data Figure 1 |. Purification of A3A (N57Q)-BE3 protein.
a, Purification strategy and profiles. A3A (N57Q)-BE3 protein was purified using nickel affinity, mono S cation exchange, and size exclusion columns. Desired fractions from 100% imidazole elution (nickel column tube 20–24), salt gradient elution (tube 25–35), and size exclusion (tube 11–15) were collected respectively. b, Protein purity validation. Protein purity was determined using SDS-PAGE and gel staining. Total clear protein lysate and ion exchange (IEX) samples and fractions were loaded on SDS-PAGE gel and stained with GelCode Blue to check the purity. After immobilized metal affinity chromatography and IEX, the protein purity was estimated to be more than 99%. The protein purification was performed once.
Extended Data Fig. 2 |. Base editing the +58 BCL11A erythroid enhancer in human healthy donor CD34+ HSPCs.
a, Heatmaps show the base edit frequencies following A3A (N57Q)-BE3:sgRNA-1617, sgRNA-1619 and sgRNA-1620 editing by deep sequence analysis. b, Correlation of C6 and C8 base edit frequencies following dose-response A3A (N57Q)-BE3:sgRNA-1620 editing. Data are analyzed using two-tailed nonparametric Spearman correlation. The Spearman correlation coefficient (r) is shown, P=0.003, n=3 independent donors. c, Correlation of base edit frequencies and HbF levels following dose-response A3A (N57Q)-BE3:sgRNA-1620 editing. Data are analyzed using two-tailed nonparametric Spearman correlation. The Spearman correlation coefficient (r) is shown, P=0.003, n=3 independent donors. d, Overall base editing frequencies at sgRNA-1620 C6 position in input CD34+ HSPCs following 1 cycle of electroporation (1 EP) and 2 cycles of electroporation (2 EP) by performing the second cycle of electroporation 24 h after first. Data are plotted as grand median, n=2 healthy donors for 1 EP, n=3 healthy donors for 2 EP. e, Viability of CD34+ HSPCs immediately prior to transplantation with 1 or 2 cycles of electroporation (EP) relative to mock. Each dot indicates an independent healthy donor. Data are plotted as grand median, n=3 for mock, n=2 healthy donors for 1 EP, n=3 healthy donors for 2 EP.
Extended Data Fig. 3 |. Therapeutic and multiplex base editing in β-thalassemia patient CD34+ HSPCs.
a, Heatmaps show the base edit frequencies of BCL11A enhancer (left two panels) and HBB promoter (right two panels) following single and multiplex editing. b, Left, Distribution of erythroid colonies by editing of BCL11A enhancer and HBB promoter following A3A (N57Q)-BE3:sgRNA-1620 + sgRNA-HBB-28 multiplex base editing. Right, The number and fraction of colonies based on alleles at BCL11A enhancer and HBB promoter. c, Hemoglobin measured by HPLC for A3A (N57Q)-BE3:sgRNA-1620 + sgRNA-HBB-28 multiplex base editing by number of edited loci (left) or by combination of alleles (right) in edited erythroid colonies.
Extended Data Fig. 4 |. Efficient base editing following HSPC xenotransplantation.
a, Overall frequencies of C base edits at sgRNA-1620 C6 position in sorted immunophenotypically enriched HSC or HPC populations by deep sequence analysis. n=5 independent donors and analyzed using paired two-tailed Student’s t-test, * P=0.03 compared with HPC. b, Overall frequencies of C base edits at sgRNA-1620 C6 position in Pyronin Y and Hoechst stained and sorted G0 and non-G0 including G1, S and G2/M phase CD34+ HSPCs. ns P>0.05 G0 compared with non-G0, n=5 independent donors and analyzed using paired two-tailed Student’s t-test. c-g, Percentage of engrafted human B cells (c), granulocytes (d), monocytes (e), erythroid cells (f) and HSPCs (g) from mouse BM 16 weeks after primary transplantation. Data are plotted as grand median, n=6 primary recipients from mock, n=5 primary recipients from 1EP, n=11 primary recipients from 2 EP. h-l, Correlation of overall human chimerism to individual lineages after primary transplantation. Data are analyzed using two-tailed nonparametric Spearman correlation. The Spearman correlation coefficients (r) and P values are shown. n=6 primary recipients from mock, n=5 primary recipients from 1EP, n=11 primary recipients from 2 EP. m, Overall frequencies of C base edits in input CD34+ HSPCs and engrafted HSPCs, B cells, erythroid and BM by deep sequence analysis. Data are plotted as grand median and analyzed using unpaired two-tailed Student’s t-test. * P=0.016 engrafted HSPCs compared with input HSPCs, * P=0.02 engrafted B cells compared with input HSPCs, ** P=0.004 engrafted erythroid compared with input HSPCs, ** P=0.008 engrafted BM compared with input HSPCs following one cycle of electroporation. *** P=0.0003 engrafted HSPCs compared with input HSPCs, ** P=0.002 engrafted B cells compared with input HSPCs, *** P=0.0001 engrafted erythroid compared with input HSPCs, *** P=0.0003 engrafted BM compared with input HSPCs following two cycles of electroporation. n=2 independent healthy donors HSPCs with 1 EP, n=5 primary recipients with 1 EP. n=3 independent healthy donors HSPCs with 2 EP, n=7 primary mice for engrafted HSPCs, n=10 primary mice for engrafted B cells and erythroid, n=11 primary mice for engrafted BM. n, Percentage of engrafted human B cells, myeloid cells and CD19- CD33- cells 16 weeks after secondary transplantation from donors 6, 7 and 8. o-p, BCL11A expression by RT-qPCR in engrafted bone marrow human erythroid cells (o) and B cells (p) with 1 EP or 2 EP as compared to mock. Data are plotted as grand median and analyzed using Kolmogorov-Smirnov test, ns for nonsignificant, **P=0.004, *** P=0.0002, n=6 primary recipients from mock, n=5 primary recipients from 1 EP, n=9 primary recipients from 2 EP engrafted erythroid, n=11 primary recipients from 2 EP engrafted B cells.
Extended Data Fig. 5 |. Representative xenografted bone marrow flow cytometry analysis.
a-d, Live cells from engrafted mouse BM. e, Human cells gated from hCD45+ population, mouse cells gated from mCD45+ population. f, B cells gated from hCD45+CD19+ population. g, Granulocytes gated from hCD45+CD19-CD33dim with SSC high population. Monocytes gated from hCD45+CD19-CD33+ with SSC low population. h, CD34+Lin- (HSPCs) gated from hCD45+CD19-CD33-CD34+ population. T cells gated from hCD45+CD19-CD33-CD3+ population. i, Erythroid cells gated from hCD45-mCD45-hCD235a+ population. 21 primary recipients and 21 secondary recipients analyzed by flow cytometry.
Extended Data Fig. 6 |. Guide RNA-dependent off-target potential of HSPC base editing.
a, Using the CasOFFinder tool, 59 potential genomic off-target sites with 3 or fewer mismatches to the on-target BCL11A enhancer sequence were identified. Each site was evaluated by amplicon deep sequencing. The samples include input HSPCs from donors 6, 7, and 8 with 1 or 2 cycles of RNP electroporation (1 EP or 2 EP) and corresponding engrafted bone marrow samples after primary transplantation (1° engrafted) and secondary transplantation (2° engrafted). Each dot represents the median edit frequency for the condition (with 2–11 samples per condition). Each input sample is from an independent donor. Each engraftment sample is from an independent mouse. * indicates off-target sites with difference in edit frequency between mock and edited samples of at least 0.1% and P<0.05. b, Allele frequency tables of OT1 and OT2 illustrate the condition with the highest off-targets edits, input HSPCs with 2 cycles of electroporation (2 EP) from donor 8. Base editing position indicated by arrow. c, On-target and off-target edits of OT1 and OT2 in individual samples from input HSPCs and engrafted bone marrow from primary and secondary recipients. d, Left, correlation of dose-dependent 1620 on-target edits and OT1 or OT2 off-target edits at RNP concentrations of 0, 10, 20, 30, 40, 50 μM with concentration proportional to fill color opacity. Data are analyzed using two-tailed nonparametric Spearman correlation. The Spearman correlation coefficients (r) and P values are shown. n=1 healthy donor with 5 RNP concentration. Right, on-target to off-target edit ratios of OT1 or OT2 at RNP concentrations of 10–50 μM.
Supplementary Material
Acknowledgements
We appreciate useful discussions with David Liu, Mitch Weiss, Shengdar Tsai, Christian Brendel and Michael Peters. We thank Ronald Mathieu and BCH flow cytometry staff for technical assistance, Zachary Herbert and DFCI molecular biology core for deep sequencing assistance, and Carlo Brugnara, Erica Esrick, David Williams, and BCH clinical staff for assistance with β-thalassemia and SCD patient samples. We are grateful to patients for their participation. L.P. was supported by NHGRI (grant no. R00HG008399), S.A.W. by NIAID (R01AI117839) and NIGMS (R01GM115911), J.K.J. by the NIGMS (R35 GM118158), NHGRI (RM1 HG009490), the St. Jude Children’s Research Hospital Collaborative Research Consortium, and the Desmond and Ann Heathwood MGH Research Scholar Award, and D.E.B. by NHLBI (P01HL053749), St. Jude Children’s Research Hospital Collaborative Research Consortium, and Burroughs Wellcome Fund.
Footnotes
Competing Interests Statement
The authors declare competing financial interests: details are available in the online version of the paper. J.K.J. has financial interests in Beam Therapeutics, Editas Medicine, Excelsior Genomics, Pairwise Plants, Poseida Therapeutics, Transposagen Biopharmaceuticals, and Verve Therapeutics (f/k/a Endcadia). JKJ’s interests were reviewed and are managed by Massachusetts General Hospital and Partners HealthCare in accordance with their conflict of interest policies. J.K.J. is a member of the Board of Directors of the American Society of Gene and Cell Therapy. J.M.G. and J.K.J. are co-inventors on a patent application describing the A3A (N57Q) BE3 variant used in this study. J.K.J. is also a co-inventor on various patents and patent applications that describe gene editing, base editing, and epigenetic editing technologies. J.Z., Y.W., and D.E.B. are co-inventors on various patents related to therapeutic gene editing technologies.
Data Availability
All requests for raw and analyzed data and materials are promptly reviewed by Boston Children’s Hospital to verify if the request is subject to any intellectual property or confidentiality obligations. Any data and materials that can be shared will be released via a Material Transfer Agreement. All raw and analyzed sequencing data can be found at the NCBI Sequence Read Archive (accession number: PRJNA604208).
References
- 1.Holt N et al. Human hematopoietic stem/progenitor cells modified by zinc-finger nucleases targeted to CCR5 control HIV-1 in vivo. Nat. Biotechnol. 28, 839–847 (2010). [DOI] [PMC free article] [PubMed] [Google Scholar]
- 2.Genovese P et al. Targeted genome editing in human repopulating haematopoietic stem cells. Nature 510, 235–40 (2014). [DOI] [PMC free article] [PubMed] [Google Scholar]
- 3.Hoban MD et al. Correction of the sickle-cell disease mutation in human hematopoietic stem/progenitor cells. Blood 125, 2597–604 (2015). [DOI] [PMC free article] [PubMed] [Google Scholar]
- 4.Dever DP et al. CRISPR/Cas9 β-globin gene targeting in human haematopoietic stem cells. Nature 539, 384–389 (2016). [DOI] [PMC free article] [PubMed] [Google Scholar]
- 5.Dewitt MA et al. Selection-free genome editing of the sickle mutation in human adult hematopoietic stem/progenitor cells. Sci. Transl. Med. 8, 1–9 (2016). [DOI] [PMC free article] [PubMed] [Google Scholar]
- 6.Gundry MC et al. Highly Efficient Genome Editing of Murine and Human Hematopoietic Progenitor Cells by CRISPR/Cas9. Cell Rep 17, 1453–1461 (2016). [DOI] [PMC free article] [PubMed] [Google Scholar]
- 7.Ravin S. S. De et al. CRISPR-Cas9 gene repair of hematopoietic stem cells from patients with X-linked chronic granulomatous disease. Sci. Transl. Med. 9, 1–10 (2017). [DOI] [PubMed] [Google Scholar]
- 8.Wu Y et al. Highly efficient therapeutic gene editing of human hematopoietic stem cells. Nature Medicine 25, 776–783 (2019). [DOI] [PMC free article] [PubMed] [Google Scholar]
- 9.Komor AC, Kim YB, Packer MS, Zuris JA & Liu DR Programmable editing of a target base in genomic DNA without double-stranded DNA cleavage. Nature 533, 420–424 (2016). [DOI] [PMC free article] [PubMed] [Google Scholar]
- 10.Nishida K et al. Targeted nucleotide editing using hybrid prokaryotic and vertebrate adaptive immune systems. Science 353, (2016). [DOI] [PubMed] [Google Scholar]
- 11.Gaudelli NM et al. Programmable base editing of A • T to G • C in genomic DNA without DNA cleavage. Nat. Publ. Gr. 551, 464–471 (2017). [DOI] [PMC free article] [PubMed] [Google Scholar]
- 12.Seo H & Kim JS Towards therapeutic base editing. Nat. Med. 24, 1493–1495 (2018). [DOI] [PubMed] [Google Scholar]
- 13.Gehrke JM et al. An apobec3a-cas9 base editor with minimized bystander and off-target activities. Nat. Biotechnol. 36, 977 (2018). [DOI] [PMC free article] [PubMed] [Google Scholar]
- 14.Bauer DE et al. An Erythroid Enhancer of BCL11A Subject to Genetic Variation Determines Fetal Hemoglobin Level. Science 342, 253–257 (2013).24115442 [Google Scholar]
- 15.Canver MC et al. BCL11A enhancer dissection by Cas9-mediated in situ saturating mutagenesis. Nature 527, 192–197 (2015). [DOI] [PMC free article] [PubMed] [Google Scholar]
- 16.Vierstra J et al. Functional footprinting of regulatory DNA. Nat. Methods 12, 927–930 (2015). [DOI] [PMC free article] [PubMed] [Google Scholar]
- 17.Eng B et al. Three new β-globin gene promoter mutations identified through newborn screening. Hemoglobin 31, 129–134 (2007). [DOI] [PubMed] [Google Scholar]
- 18.Li Z et al. A novel promoter mutation (HBB: c.−75G>T) was identified as a cause of β+-thalassemia. Hemoglobin 39, 115–120 (2015). [DOI] [PubMed] [Google Scholar]
- 19.Ponczs M, Ballantine M, Solowiejczyk D, Bar I & Schwartz E Beta-Thalassemia in a Kurdish Jew. J. Biol. Chem. 257, 5994–5996 (1982). [PubMed] [Google Scholar]
- 20.Mohrin M et al. Hematopoietic stem cell quiescence promotes error-prone DNA repair and mutagenesis. Cell Stem Cell 7, 174–185 (2010). [DOI] [PMC free article] [PubMed] [Google Scholar]
- 21.McIntosh BE et al. Nonirradiated NOD,B6.SCID Il2rgamma−/− kitW41/W41 (NBSGW) mice support multilineage engraftment of human hematopoietic cells. Stem Cell Reports 4, 171–180 (2015). [DOI] [PMC free article] [PubMed] [Google Scholar]
- 22.Fiorini C et al. Developmentally-faithful and effective human erythropoiesis in immunodeficient and Kit mutant mice. 1–7 (2017). doi: 10.1002/ajh.24805 [DOI] [PMC free article] [PubMed] [Google Scholar]
- 23.Tebas P et al. Gene Editing of CCR5 in Autologous CD4 T Cells of Persons Infected with HIV. N. Engl. J. Med. 370, 901–910 (2014). [DOI] [PMC free article] [PubMed] [Google Scholar]
- 24.Qasim W et al. Molecular remission of infant B-ALL after infusion of universal TALEN gene-edited CAR T cells. Sci Transl Med 9, (2017). [DOI] [PubMed] [Google Scholar]
- 25.Rees HA & Liu DR Base editing: precision chemistry on the genome and transcriptome of living cells. Nat. Rev. Genet. 19, 770–788 (2018). [DOI] [PMC free article] [PubMed] [Google Scholar]
- 26.Grünewald J et al. Transcriptome-wide off-target RNA editing induced by CRISPR-guided DNA base editors. Nature 569, 433–437 (2019). [DOI] [PMC free article] [PubMed] [Google Scholar]
- 27.Zuo E et al. Cytosine base editor generates substantial off-target single-nucleotide variants in mouse embryos. Science 126, eaav9973 (2019). [DOI] [PMC free article] [PubMed] [Google Scholar]
- 28.Grünewald J et al. CRISPR DNA base editors with reduced RNA off-target and self-editing activities. Nat. Biotechnol. 37, 1041–1048 (2019). [DOI] [PMC free article] [PubMed] [Google Scholar]
- 29.Kluesner MG et al. EditR: A Method to Quantify Base Editing from Sanger Sequencing. Cris. J. 1, 239–250 (2018). [DOI] [PMC free article] [PubMed] [Google Scholar]
- 30.Clement K et al. CRISPResso2 provides accurate and rapid genome editing sequence analysis. Nat. Biotechnol. 37, 224–226 (2019). [DOI] [PMC free article] [PubMed] [Google Scholar]
- 31.Bae S, Park J & Kim JS Cas-OFFinder: A fast and versatile algorithm that searches for potential off-target sites of Cas9 RNA-guided endonucleases. Bioinformatics 30, 1473–1475 (2014). [DOI] [PMC free article] [PubMed] [Google Scholar]
- 32.Corces MR et al. Lineage-specific and single-cell chromatin accessibility charts human hematopoiesis and leukemia evolution. Nat. Genet. 48, 1193–1203 (2016). [DOI] [PMC free article] [PubMed] [Google Scholar]
- 33.Siepel A et al. Evolutionarily conserved elements in vertebrate, insect, worm, and yeast genomes. Genome Res. 15, 1034–1050 (2005). [DOI] [PMC free article] [PubMed] [Google Scholar]
Associated Data
This section collects any data citations, data availability statements, or supplementary materials included in this article.
Supplementary Materials
Data Availability Statement
All requests for raw and analyzed data and materials are promptly reviewed by Boston Children’s Hospital to verify if the request is subject to any intellectual property or confidentiality obligations. Any data and materials that can be shared will be released via a Material Transfer Agreement. All raw and analyzed sequencing data can be found at the NCBI Sequence Read Archive (accession number: PRJNA604208).


