

Abstract
Background:
Prior literature has shown that ethnic affirmation, one aspect of ethnic identity, is positively associated with mental health. However, the associations between ethnic affirmation and mental health may vary depending how much importance individuals place on their ethnic group membership (ie, centrality).
Methods:
Using path analysis, the current study examined the relations between ethnic affirmation and indices of mental health problems (ie, anxiety and depressive symptoms), and tested whether the process was moderated by ethnic centrality among 3,659 college students representing 3 ethnic groups (41% Latino/a, 35% Asian American, and 24% African American) who participated in a large, multisite university study.
Results and Conclusions:
Results suggested that the associations between ethnic affirmation and mental health were stronger for Latino/a and Asian American students who reported higher levels of ethnic centrality. For African Americans, higher levels of ethnic affirmation predicted better mental health, but this association did not vary as a function of ethnic centrality.
Keywords: ethnic affirmation, ethnic centrality, ethnic identity, mental health
Mental health is important for college students’ academic achievement and adjustment.1 Research suggests that depression and anxiety are the most prevalent mental health problems reported among college students.2 In fact, rates of depression and suicide have doubled over the last 10 years3 and universities have reported increases in students seeking support for anxiety symptoms.4 Ethnic minority college students, in particular, are an important population to examine with respect to mental health, as the last decade saw increases in college attendance among ethnic minority individuals, with Latinos/as and Asian Americans showing the fastest growing rates of enrollment.5 Thus, it is important to investigate factors that may promote better mental health among ethnically diverse students.
The current study focuses on ethnic identity (an aspect of a person’s overall identity) because it is a prominent developmental task for ethnic minority individuals, and theory suggests that a strong ethnic identity can promote mental health.6–10 Specifically, ethnic identity affirmation (ie, feeling positively about one’s ethnic group) is a facet of ethnic identity that may be linked to better mental health and psychosocial adjustment.11,12 Furthermore, ethnic affirmation may interact with other facets of ethnic identity, such as ethnic centrality (eg, the importance an individual places on his or her ethnic group membership13) to inform adjustment, such that the promotive value of ethnic affirmation may not be present if ethnicity is not central to one’s identity. Some limited research has examined the interplay between aspects of ethnic identity as they relate to mental health. However, more research is needed to better understand the specific function of ethnic identity for mental health outcomes. As such, the current study examined the associations between college students’ ethnic identity affirmation and indicators of mental health problems (ie, anxious and depressive symptoms), and tested ethnic centrality as a moderator of these associations among college students from 3 ethnic minority groups (ie, African Americans, Asian Americans, and Latinos/as).
The Role of Ethnic Identity Among Ethnic Minority Groups
In general, studies show that an overall sense of ethnic identity promotes healthy development.10,14 Scholars have asserted that ethnic identity is multifaceted15,16 and that individual components of ethnic identity must be examined to gain a clearer understanding of the individual value of ethnic identity for personal health and adjustment.16,17 Ethnic identity includes exploration of one’s ethnicity (ie, search), resolution of one’s ethnic identity (ie, commitment), and ethnic affirmation (ie, positive feelings associated with being a member of an ethnic group).17 Although there has been considerable research on ethnic identity among African Americans,18,19 Latinos,20,21 and Asian Americans,22–24 much of this work has examined composite indices of ethnic identity. Scholars have proposed that affirmation (ie, the affective component) is a particularly critical aspect of ethnic identity for ethnic minority group members10,16 who may experience social devaluation, a significant source of stress that is known to negatively impact mental health.25
Ethnic affirmation appears to favor adaptive functioning among many racial and ethnic groups. For example, studies with African American youth show that high ethnic affirmation predicts lower drug and alcohol use,26,27 less risky sexual behavior,28 and fewer depressive symptoms.29 Only one study indicated a positive relation between ethnic affirmation and cigarette use among African Americans.30 In examining African Americans’ healthy development, ethnic affirmation is consistently related to higher self-esteem and better academic achievement.12,31 Studies on Latino populations have yielded mixed findings regarding the role of ethnic affirmation in development, with some studies reporting that ethnic affirmation predicts lower rates of delinquency,32 and higher self-esteem,12 but one study showing that ethnic affirmation is positively associated with deviant behaviors.30 Although work with Asian Americans is more limited, studies have found that higher levels of ethnic affirmation are associated with less delinquency,33 higher self-esteem,12,34 and fewer depressive symptoms.34,35
Therefore, as noted above, theory and empirical work suggest that ethnic affirmation is an important aspect of ethnic identity for ethnic minorities10,16; however, individuals within an ethnic group are not homogenous. For example, not only may individuals within ethnic groups vary in their attachment to the ethnic group, individuals may vary in the level of importance they place on their ethnic group membership, also referred to as centrality.36 Therefore, ethnic affirmation may not serve the same protective function for individuals whose ethnicity is not a central part of their sense of self. Accordingly, this study examined how ethnic centrality may modify the association between ethnic affirmation and college students’ mental health.
Centrality as a Moderator of Ethnic Affirmation and Mental Health
Identity theories generally support the importance of centrality by asserting that individuals place varying levels of importance on different aspects of their identity (eg, race, gender, religion).37,38 Sellers and colleagues note that the extent to which a person feels that race or ethnicity is central to his or her sense of self is a key influence on how ethnic identity may relate to an individual’s mental health.36 Thus, within a specific ethnic group, ethnicity may be important for some individuals’ self-concept, and, in turn, affirmation will be positively related to mental health. When ethnicity is not central, however, affirmation may not promote adjustment.
There is limited research on the interplay or interactions between different components of ethnic identity on mental health, but a few studies have shown that ethnic centrality does interact with aspects of ethnicity to inform behavioral outcomes.13,39 Some studies have found that higher ethnic centrality increases perceptions of bias and perceived discrimination.39,40 Similarly, Yip et al found that ethnic centrality exacerbated the effects of perceived discrimination on Asian Americans’ mental health.23 Rowley et al found that ethnic centrality moderated the relations between ethnic affirmation and self-esteem among African American adolescents, such that affirmation was promotive of self-esteem but only for those high on ethnic centrality.41 Thus, we hypothesized that centrality would enhance the positive associations between ethnic affirmation and mental health.
Current Study
The associations between ethnic affirmation and 2 indicators of mental health problems (anxiety symptoms and depressive symptoms) were examined among African Americans, Asian Americans, and Latinos/as. Higher ethnic affirmation was expected to predict lower anxiety symptoms and depressive symptoms. Ethnic centrality was expected to moderate the association between affirmation and mental health problems, with the association being stronger among those with high centrality.
METHODS
Sample and Procedure
The sample consisted of 3,659 university students (72% female), surveyed as part of a larger, multisite study designed to assess issues of culture, identity, and general college student behaviors.42,43 Participants included 41% Latino/a, 35% Asian American, and 24% African American students, who were 20.29 years of age, on average (SD = 3.40 years).
Data were collected via an online survey from students attending 1 of 30 participating universities in the United States, representing large, medium, and small public and private universities during fall 2008 to spring 2009. Of the students who started the questionnaire, 73% completed the entire survey. The online survey took 90 minutes, on average, to complete. Students were told that participation was voluntary, and each participating university’s institutional review board approved all recruitment and data collection procedures. Schwartz and colleagues have documented the full study design and procedure.42,43
Measures
The 6-item ethnic affirmation subscale from the Ethnic Identity Scale was used to assess ethnic identity affirmation. Participants rated each item (eg, “My feelings about my ethnicity are mostly negative”—reverse scored) on a scale ranging from 1 = does not describe me at all to 4 = describes me very well. Cronbach’s alphas ranged from .83 to .91 across the 3 groups.
Consistent with prior work,23 a single item “How important is your race or ethnic background to your identity?” was used to measure ethnic centrality. Responses ranged from 1 = not important to my sense of who I am to 5 = extremely important to my sense of who I am.
Anxiety symptoms were assessed using an 18-item measure that included 7 items from the Beck Anxiety Inventory44 and 11 items that were based on the Diagnostic and Statistical Manual of Mental Disorders, Fourth Edition45 criteria for Generalized Anxiety Disorder (eg, difficulty sleeping, excessive worrying, being in a bad mood, having “butterflies” in one’s stomach) and were more relevant to a normative sample of college participants (eg, not clinically diagnosed). Items referring to extreme or clinically elevated symptoms of anxiety (ie, wobbliness in legs, fainting, feelings of choking, fear of dying) were not included. Items in the current study (eg, “This week, I have found myself worrying about the worst possible things that can happen to me”) were scored on a scale of 1 = strongly disagree to 5 = strongly agree. Cronbach’s alphas were .95 across all 3 groups.
The Center for Epidemiologic Studies Depression Scale46 was used to measure depressive symptoms. Items (eg, “I have felt down and unhappy this week”) were scored on a scale of 1 = strongly disagree to 5 = strongly agree. Cronbach’s alphas ranged from .86 to .87 across the 3 groups.
Analytic Approach
Hypotheses were tested via multiple group path analysis in Mplus 6.147 (see Figure 1). Models with a root mean square error of approximation (RMSEA) of .06 or below and a standardized root mean square residual (SRMR) of .08 or below were considered to provide a good fit to the data,48 and models that did not exceed an RMSEA of .08 and SRMR of .10 were considered to provide an acceptable fit to the data.49
FIGURE 1.
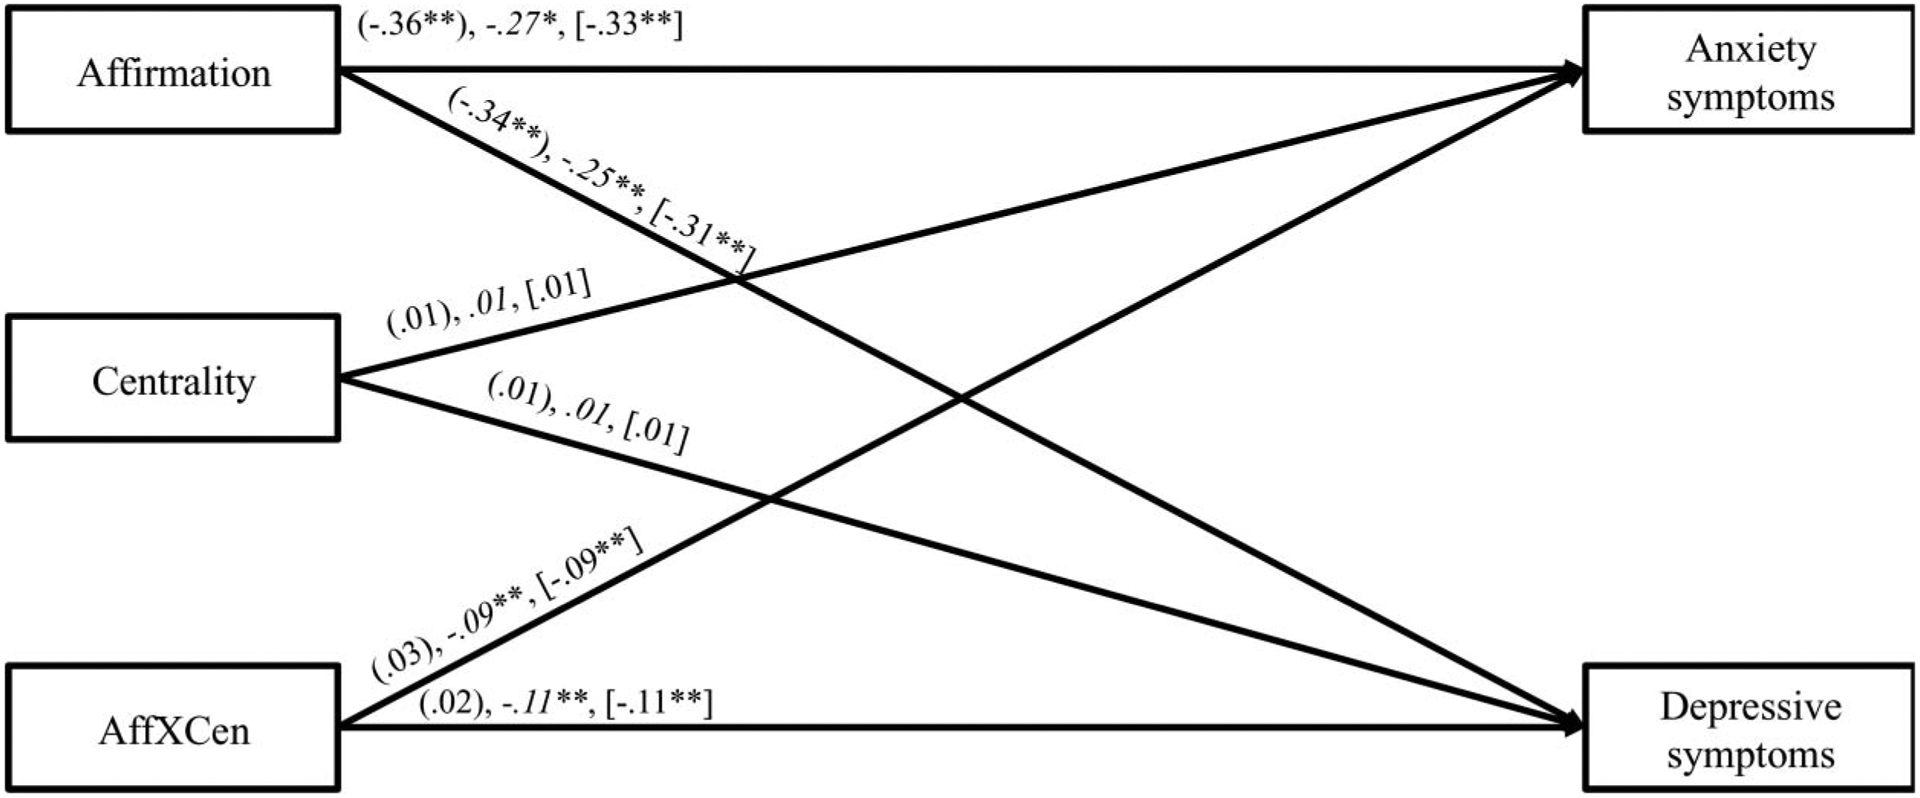
Standardized estimates for the final model predicting anxiety symptoms and depressive symptoms. Path estimates for African Americans are presented in parentheses, Asian Americans are presented in italics, and Latinos/as are presented in brackets. Paths from centrality to anxiety symptoms and depressive symptoms were constrained to be equal across all 3 ethnic groups. Paths from anxiety symptoms were constrained to be equal for Asian Americans and Latinos/as. Paths from the interaction to depressive symptoms were constrained to be equal for Asian Americans and Latinos/as. AffXCen = Interaction term for Affirmation × Centrality. *p < .05; **p < .01.
Our test of the hypothesized model involved a number of steps: (a) an initial model was tested that allowed all estimated paths to vary across the 3 groups (ie, fully free model); (b) a second model tested for invariance across ethnic groups in the estimated paths by constraining the paths to be equal across the 3 groups; and (c) the fully free model was compared with the fully constrained (ie, invariant) model using the chi square difference test to determine if there were significant differences between the 3 groups, and follow-up tests (if needed) were conducted to determine paths that needed to be freely estimated across groups. We used the Δχ2 test to compare the fit of nested models. If the Δχ2 test was significant, RMSEA and SRMR values were examined as additional indicators of model fit. After arriving at a final model, significant interactions were probed and graphed following guidelines by Aiken and West.50
Continuous measures were grand mean centered prior to the creation of the interaction term. Missing data were handled using full information maximum likelihood.51 The model allowed endogenous variables to covary, and age and gender were included as auxiliary variables to better estimate missing data and to increase statistical power.52,53
RESULTS
Descriptive Statistics
Descriptive statistics are presented in Tables 1 and 2. Findings from the multigroup path analysis indicated that the unconstrained model demonstrated a good fit to the data, χ2(12) = 15.21, nonsignificant (ns), RMSEA = .02, SRMR = .01 (Model 1). Fit indices for the fully constrained model also indicated good model fit, χ2(24) = 39.42, ns, RMSEA = .02, SRMR = .03 (Model 2). The significant chi-square difference when comparing these 2 models suggested that the models were significantly different from one another (Δχ2[12] = 24.21, p < .05). Furthermore, the slightly better SRMR of the fully free model (Model 1) indicated this was a better model, suggesting some paths varied across the 3 ethnic groups. Therefore, subsequent models were tested to identify which paths varied across groups. A third model, one that constrained path estimates from centrality to the outcomes to be equal across groups and allowed affirmation and the interaction to vary, was compared with Model 1. The fit indices of the third model (χ2[16] = 15.79, ns, RMSEA = .00, SRMR = .01; Model 3) were comparable to Model 1. The nonsignificant chi-square difference suggested that these 2 models fit the data equally well (Δχ2[6] = 0.58, ns). Therefore, Model 3 was adopted because it was more parsimonious. A fourth model, one that constrained the paths from affirmation to the outcomes and the paths from centrality to the outcomes to be equal across groups and allowed the path from the interaction to the outcomes to vary, was compared with Model 3. The significant chi-square different test indicated that the 2 models were significantly different from one another (Δχ2[4] = 12.95, p < .05). The fit indices of the fourth model (χ2[20] = 28.74, ns, RMSEA = .02, SRMR = .02; Model 4) were slightly worse than the fit indices of Model 3. Thus, Model 3, which constrained the path from centrality to the outcomes to be equal across the groups but allowed the paths from affirmation to the outcomes and from the interaction to the outcomes to vary, was selected as the best-fitting model (χ2[16] = 15.79, ns, RMSEA = .00, SRMR = .01; Model 3).
TABLE 1.
Means and Standard Deviations by Self-identified Racial Group
| African American | Asian American | Latino/a | |||||
|---|---|---|---|---|---|---|---|
| Variable | M | SD | M | SD | M | SD | η2 |
| Centrality | 3.80a | 1.19 | 3.47b | 1.13 | 3.50b | 1.20 | .01 |
| Ethnic affirmation | 3.65a | 0.54 | 3.57b | 0.61 | 3.73c | 0.50 | .01 |
| Anxiety symptoms | 2.32 | 0.93 | 2.36 | 0.92 | 2.32 | 0.91 | < .00 |
| Depressive symptoms | 2.58 | 0.73 | 2.62a | 0.74 | 2.53b | 0.77 | < .00 |
Note. Letters denote significant mean level differences at p < .05. Superscripts that differ from one another within the same row represent significant mean differences between groups. Sample n values for African Americans ranged from 655 to 709. Sample n values for Asian Americans ranged from 1,057 to 1,119. Sample n values for Latinos/as ranged from 1,167 to 1,247.
TABLE 2.
Interscale Correlations of Variables Included in Model Testing
| Variable | 1 | 2 | 3 | 4 | 5 | 6 |
|---|---|---|---|---|---|---|
| 1. Affirmation | — | |||||
| 2. Centrality | .26** | — | ||||
| 3. Depressive symptoms | −.24** | −.05* | — | |||
| 4. Anxiety symptoms | −.27** | −.06** | .84** | — | ||
| 5. Gendera | −.15** | −.08** | .00 | −.02 | — | |
| 6. Age | −.03 | −.01 | −.06** | −.04* | −.02 | — |
Female = 0; Male = 1.
p < .01;
p < .05.
The results of Model 3 suggested that the direct effect (constrained to be equal across all 3 ethnic groups) of centrality on anxiety and depressive symptoms was not significant. The interaction between ethnic affirmation and centrality was significant for Latinos/as and Asian Americans but not significant for African Americans. A subsequent model (Model 5) tested if the interaction differed for Asian Americans and Latinos/as by constraining the interaction to be equal for these 2 groups; then, the fit of Model 5 was compared with Model 3. The fit indices of fifth model (χ2[18] = 16.45, ns, RMSEA = .00, SRMR .02; Model 5) were comparable to Model 3. The nonsignificant chi-square difference suggested that these 2 models fit the data equally well (Δχ2[2] = 0.66, ns). Therefore, Model 5, which constrained the path to be equal across Latinos/as and Asians, was adopted as the final model because it was more parsimonious.
Results suggested that ethnic affirmation interacted with centrality to predict anxiety and depressive symptoms among Asian Americans and Latinos/as (Figure 1). Follow-up analyses in which the simple slopes for the interaction term were graphed suggested that ethnic affirmation was negatively related to anxiety and depressive symptoms, and the association was significantly stronger for those who reported relatively higher ethnic centrality compared with those who reported relatively lower ethnic centrality (Figure 2). Anxiety and depressive symptoms were the highest among those who reported the highest levels of centrality and the lowest levels of ethnic affirmation. African Americans differed from the other 2 groups in that the associations between affirmation and mental health were not moderated by centrality. Among African Americans, high affirmation was associated with less anxiety (β = −.36, p < .05) and fewer depressive symptoms (β = −.34, p < .05).
FIGURE 2.
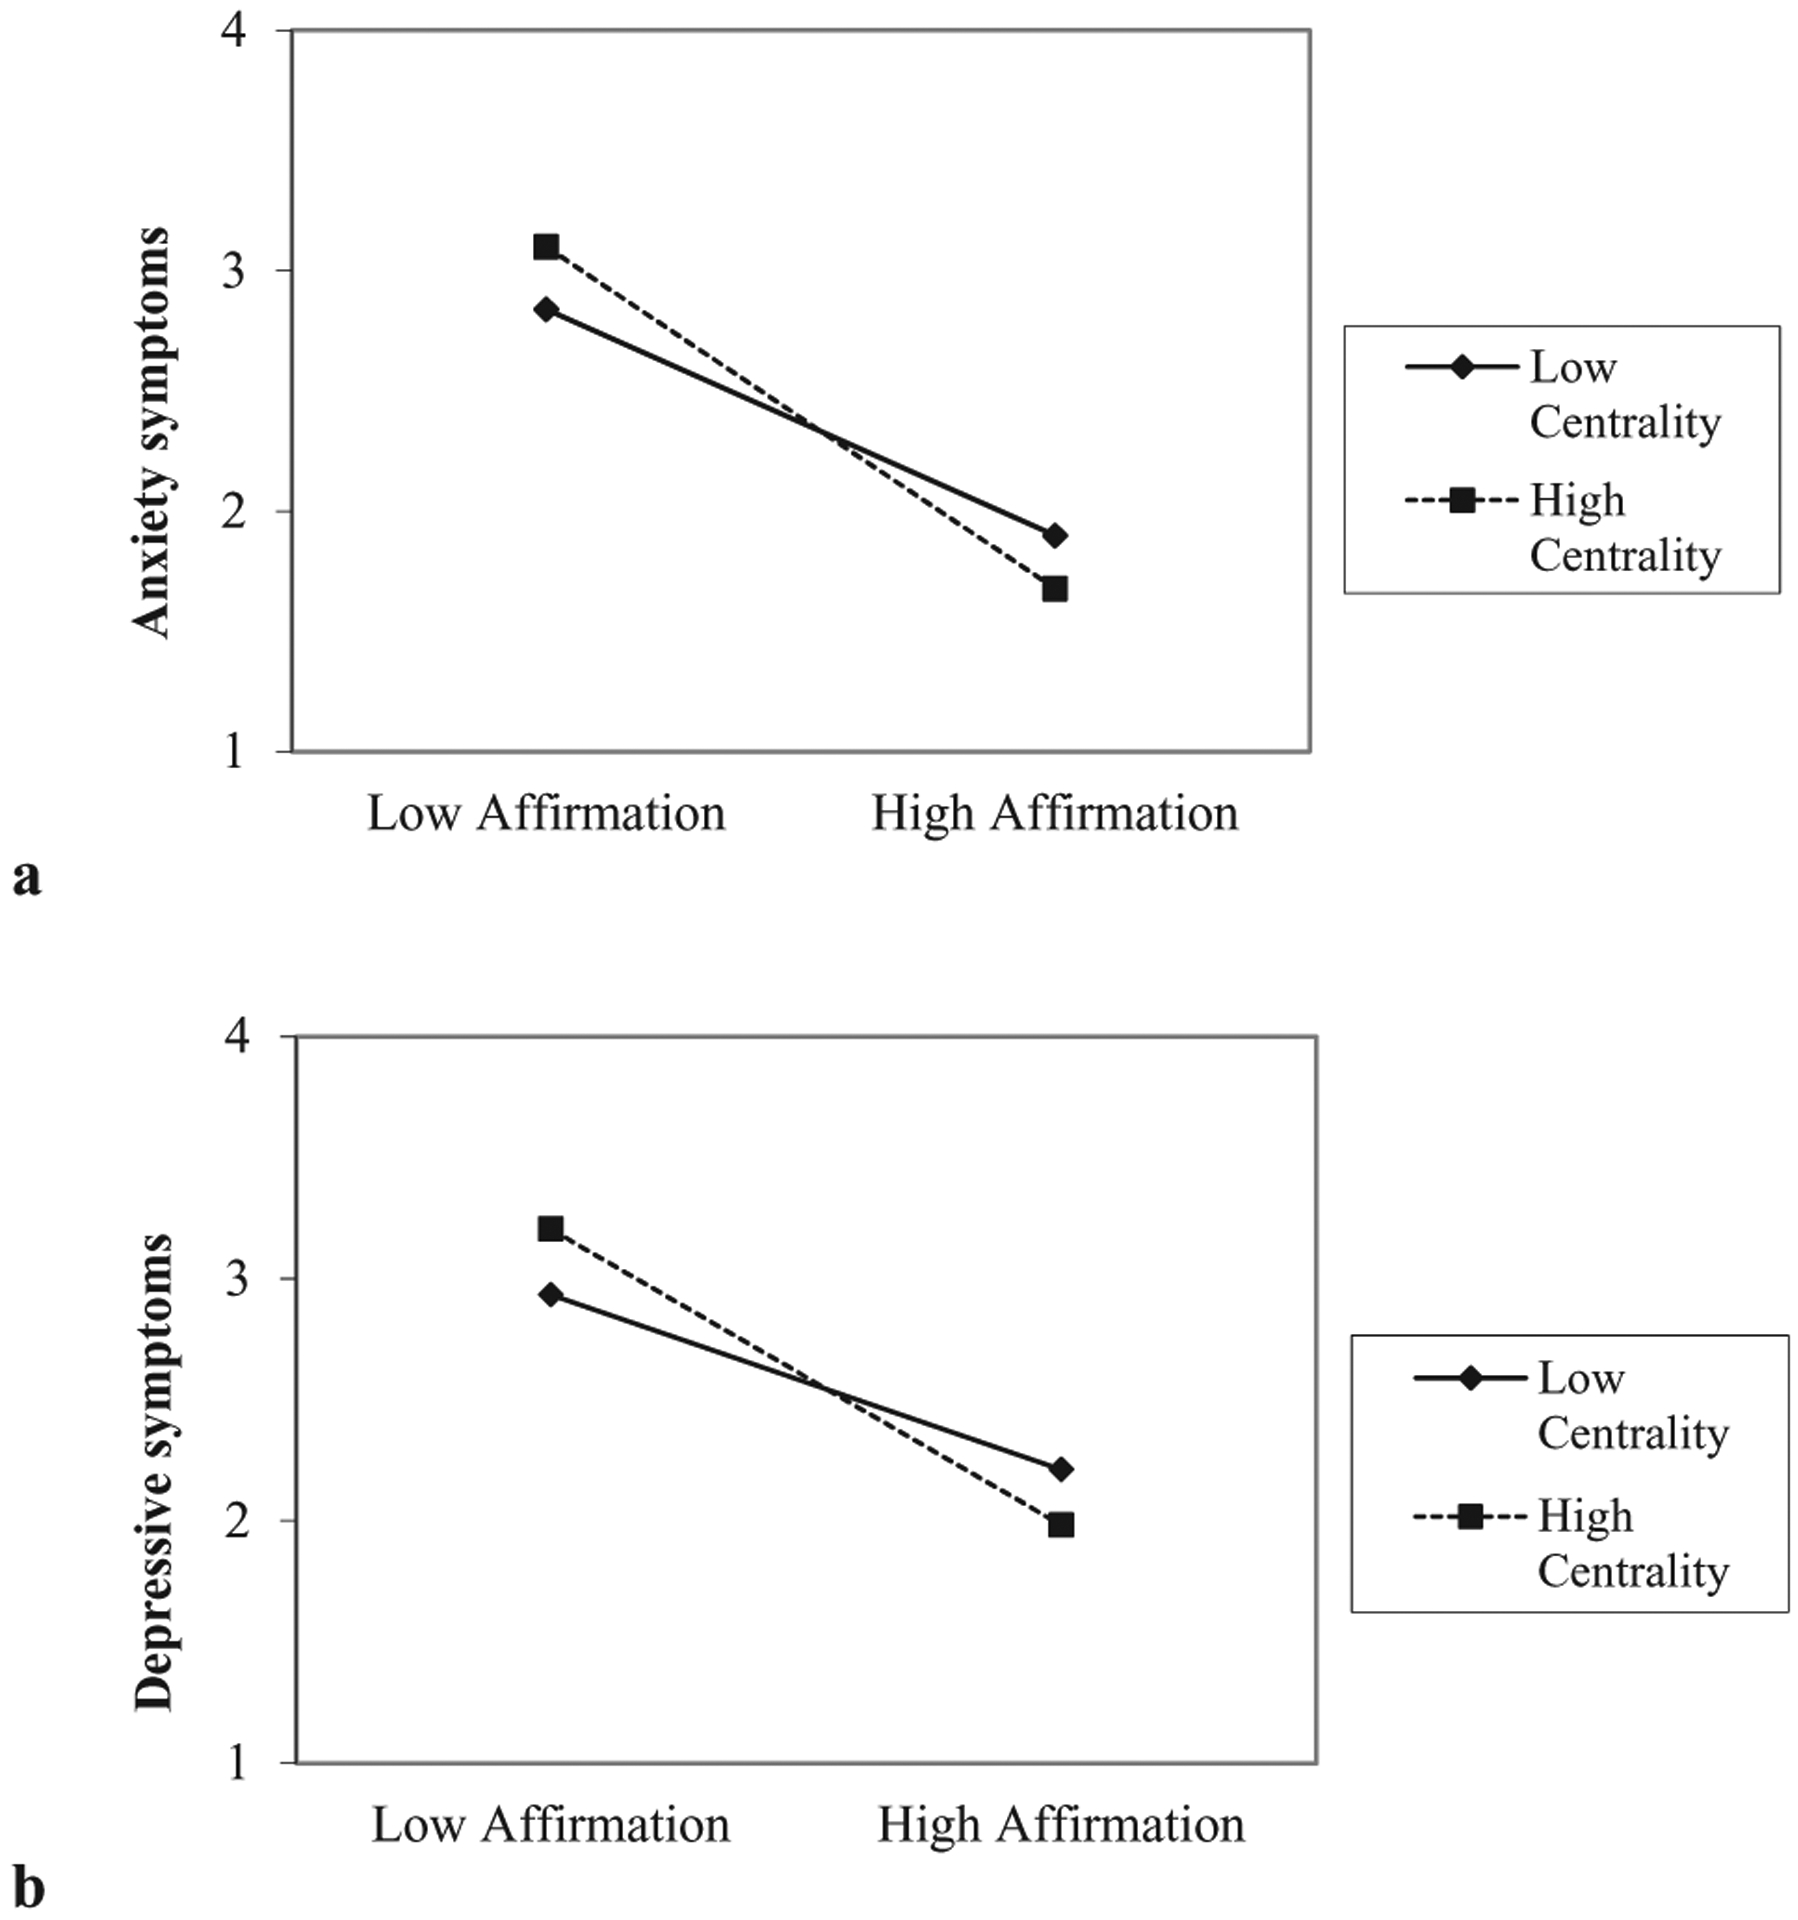
Ethnic centrality moderating the relation between ethnic identity affirmation and Latino/a and Asian American students’ mental health: (a) anxiety symptoms and (b) depressive symptoms.
COMMENT
The purpose of the current study was to examine relations between ethnic affirmation and indicators of mental health (assessed as fewer mental health problems) among African Americans, Latinos/as, and Asian Americans, and to test whether these associations were moderated by ethnic centrality. Consistent with theory and prior work,10–12,16 results of the current study supported that ethnic affirmation may serve a promotive function for ethnic minority individuals’ mental health. Specifically, higher levels of ethnic affirmation were predictive of less anxiety and fewer depressive symptoms among African American, Latino/a, and Asian American young adults. This finding suggests that feeling positively about one’s ethnic group membership promotes mental health. Thus, the findings have the potential to inform intervention and prevention studies tailored towards ethnic minority groups by highlighting one cultural factor (ie, ethnic affirmation) that is promotive of better mental health in 3 ethnic populations that experience disproportionate mental health disparities.54,55 For example, prevention and intervention programs may want to include curriculum that fosters ethnic affirmation if their program is designed to reduce mental health problems among ethnic minority youth. In addition, university support services should consider incorporating workshops or information that facilitate ethnic affirmation (or pride) among ethnic minority college students.
The Role of Ethnic Centrality
Although some studies have examined the moderating role of ethnic centrality on the relations between ethnic affirmation and self-esteem among African Americans,41 little research has examined these associations among Latinos/as and Asian Americans. Among Latino/a and Asian American young adults in this study, we found that higher ethnic affirmation was associated with better mental health, and this association was enhanced by ethnic centrality; the association was strongest among those for whom ethnicity was a central part of their identity.
Among African American young adults, centrality did not moderate this association. It is possible that we did not find moderation for African Americans because of the high mean for this construct among African Americans in the current study (see Table 1). The limited variability in ethnic centrality for African Americans may have limited our ability to detect a moderation effect. This finding was somewhat inconsistent with work by Rowley et al who found that centrality moderated the association between ethnic affirmation and self-esteem among African American college students.41 It will be important for future studies to understand why centrality may enhance the promotive benefits of ethnic affirmation for individuals’ self-esteem, but not for their symptomatology. Finally, it should be noted that a majority of African Americans in the current study were often a numerical minority on their campus. Whereas the percentages of Asian American and Latino/a students ranged from 1 to 40 and from 1 to 60, the percentage of African American students ranged from 1 to 15. This may have played a role given that racial-ethnic composition of the social context can make ethnic identity more salient for individuals.13 Given the findings of the current study, we suggest that when serving ethnic minority students, university support services should also consider within person variability, meaning that ethnicity may not be a central aspect of every student’s identity.
Limitations, Directions for Future Research, and Conclusion
This study extends the literature on ethnic identity, but it is not without limitations. One limitation to note is the cross-sectional nature of the study, which limits the ability to make inferences about causality. Although theory suggests that ethnic identity promotes mental health,16 it is also possible that poor mental health hinders ethnic identity formation. Future studies employing a longitudinal design are necessary to test these assumptions and more fully understand the role of ethnic identity affirmation in promoting mental health.
In addition, although consistent with prior work,23 our measure of centrality was limited to a single item. It is possible that there are many dimensions to centrality that were not captured with a single item. In addition, ethnic centrality was measured as an omnibus assessment of ethnic and racial importance. However, some work suggests that components of ethnic identity can be both stable and situational.13,56 Thus, future research may consider how the promotive value of ethnic affirmation may shift given varying social situations (eg, racial demographics), as well as individuals’ orientation toward mainstream culture (ie, acculturation).
In conclusion, the current findings underscore the need to consider ethnic centrality when understanding the potential influence of ethnic affirmation. Furthermore, by employing a multiple group comparison, we also demonstrated that there is within- and between-group variability and it may be important to tailor programs according to the distinct needs of students from different cultural groups.
ACKNOWLEDGMENTS
The authors wish to acknowledge collaborators from the Multi-site University Study of Identity and Culture (MUSIC) for their assistance with research design and data collection.
REFERENCES
- 1.Kitzrow MA. The mental health needs of today’s college students: challenges and recommendations. NASPA J. 2003; 41:165–179. [Google Scholar]
- 2.Eisenberg D, Gollust SE, Golberstein E, Hefner JL. Prevalence and correlates of depression, anxiety, and suicidality among university students. Am J Orthopsychiatry. 2007;77:534–542. doi: 10.1037/0002-9432.77.4.534. [DOI] [PubMed] [Google Scholar]
- 3.Kisch J, Leino EV, Silverman MM. Aspects of suicidal behavior, depression, and treatment in college students: results from the spring 2000 national college health assessment survey. Suicide Life Threat Behav. 2005;35:3–13. doi: 10.1521/suli.35.1.3.59263. [DOI] [PubMed] [Google Scholar]
- 4.US Department of Education, National Center for Education Statistics. The Condition of Education 2005. Washington, DC: US Department of Education; 2005. NCES 2005–094. [Google Scholar]
- 5.Aud S, Fox M, Kewal-Ramani A. Status and Trends in the Education of Racial and Ethnic Groups. Washington, DC: US Government Printing Office; 2010. NCES 2010–015. [Google Scholar]
- 6.Cote JE. Identity formation and self-development in adolescence In: Lerner RM, Steinberg L, eds. Handbook of Adolescent Psychology: Individual Bases on Adolescent Development. Hoboken, NJ: Wiley; 2009:266–304. [Google Scholar]
- 7.Lee RM. Do ethnic identity and other-group orientation protect against discrimination for Asian Americans? J Couns Psychol. 2003;50:133–141. [Google Scholar]
- 8.Romero AJ, Roberts RE. The impact of multiple dimensions of ethnic identity on discrimination and adolescents’ self-esteem. J Appl Soc Psychol. 2003;33:2288–2305. [Google Scholar]
- 9.Spencer MB. Phenomenology and ecological systems theory: development of diverse groups In: Damon W, Lerner RM, eds. Child and Adolescent Development: An Advanced Course. New York, NY: Wiley Publishers; 2008:696–740. [Google Scholar]
- 10.Umaña-Taylor AJ. Ethnic identity In: Schwartz SJ, Luyckx K, Vignoles VL, eds. Handbook of Identity Theory and Research. New York, NY: Springer; 2011:791–809. [Google Scholar]
- 11.Hughes D, Witherspoon D, Rivas-Drake D, West-Bey N. Received ethnic-racial socialization messages and youths’ academic and behavioral outcomes: examining the mediating role of ethnic identity and self-esteem. Cultur Divers Ethnic Minor Psychol. 2009;15:112–124. doi: 10.1037/a0015509. [DOI] [PubMed] [Google Scholar]
- 12.Umaña-Taylor AJ, Shin N. An examination of ethnic identity and self-esteem with diverse populations: exploring variation by ethnicity and geography. Cultur Divers Ethnic Minor Psychol. 2007;13:178–186. doi: 10.1037/1099-9809.13.2.178. [DOI] [PubMed] [Google Scholar]
- 13.Yip T Sources of situational variation in ethnic identity and psychological well-being: a palm pilot study of Chinese American students. Pers Soc Psychol Bull. 2005;31:1603–1616. doi: 10.1177/0146167205277094. [DOI] [PubMed] [Google Scholar]
- 14.Smith TB, Silva L. Ethnic identity and personal well-being of people of color: a meta-analysis. J Couns Psychol. 2011;58: 42–60. [DOI] [PubMed] [Google Scholar]
- 15.Ashmore RD, Deaux K, McLaughlin-Volpe T. An organizing framework for collective identity: articulation and significance of multidimensionality. Psychol Bull. 2004;130:80–114. doi: 10.1037/0033-2909.130.1.80. [DOI] [PubMed] [Google Scholar]
- 16.Phinney JS, Ong AD. Conceptualization and measurement of ethnic identity: current status and future direction. J Couns Psychol. 2007;54:271–281. [Google Scholar]
- 17.Umaña-Taylor AJ, Yazedjian A, Bámaca-Gómez M. Developing the ethnic identity scale using Erikson and social identity perspectives. Identity Int J Theory Res. 2004;4:9–38. [Google Scholar]
- 18.Dotterer AM, McHale SM, Crouter AC. The development and correlates of academic interests from childhood through adolescence. J Educ Psychol. 2009;101:509–519. doi: 10.1037/a0013987. [DOI] [PMC free article] [PubMed] [Google Scholar]
- 19.Simons RL, Murry V, McLoyd V, Lin KH, Cutrona C, Conger RD. Discrimination, crime, ethnic identity, and parenting as correlates of depressive symptoms among African American children: a multilevel analysis. Dev Psychopathol. 2002;14: 371–393. [DOI] [PubMed] [Google Scholar]
- 20.Umaña-Taylor AJ, Diversi M, Fine MA. Ethnic identity and self-esteem of Latino adolescents: distinctions among the Latino populations. J Adolesc Res. 2002;17:303–327. [Google Scholar]
- 21.Umaña-Taylor AJ, Gonzales-Backen MA, Guimond AB. Latino adolescents’ ethnic identity: is there a developmental progression and does growth in ethnic identity predict growth in self-esteem? Child Dev. 2009;80:391–405. doi: 10.1111/j.1467-8624.2009.01267.x. [DOI] [PubMed] [Google Scholar]
- 22.Lee RM, Yoo HC. Structure and measurement of ethnic identity for Asian Americans. J Couns Psychol. 2004;51:263–269. [Google Scholar]
- 23.Yip T, Gee GC, Takeuchi DT. Racial discrimination and psychological distress: the impact of ethnic identity and age among immigrant and united states-born Asian adults. Dev Psychol. 2008;44:787–800. doi: 10.1037/0012-1649.44.3.787. [DOI] [PMC free article] [PubMed] [Google Scholar]
- 24.Yoo HC, Lee RM. Ethnic identity and approach-type coping as moderators of the racial discrimination/well-being relation in Asian Americans. J Couns Psychol. 2005;52:497–506. [Google Scholar]
- 25.Franklin-Jackson D, Carter RT. The relationship between race-related stress, racial identity, and mental health for black Americans. J Black Psychol. 2007;33:5–26. [Google Scholar]
- 26.Brook JS, Pahl K. The protective role of ethnic and racial identity and aspects of an Africentric orientation against drug use among African American young adults. J Genet Psychol. 2005;166:329–345. doi: 10.3200/GNTP.166.3.329-345. [DOI] [PMC free article] [PubMed] [Google Scholar]
- 27.Nasim A, Belgrave FZ, Jagers RJ, Wilson KD, Owens K. The moderating effects of culture on peer deviance and alcohol use among high-risk African-American adolescents. J Drug Educ. 2007;37:335–363. [DOI] [PubMed] [Google Scholar]
- 28.Wills TA, Murry VM, Brody GH, et al. Ethnic pride and self-control related to protective and risk factors: test of the theoretical model for the strong African American families program. Health Psychol. 2007;26:50–59. doi: 10.1037/0278-6133.26.1.50. [DOI] [PubMed] [Google Scholar]
- 29.Gaylord-Harden NK, Ragsdale BL, Mandara J, Richards M, Petersen AC. Perceived support and internalizing symptoms in African American adolescents: self-esteem and ethnic identity as mediators. J Youth Adolesc. 2007;36:77–88. [Google Scholar]
- 30.Marsiglia FF, Kulis S, Hecht ML, Sills S. Ethnicity and ethnic identity as predictors of drug norms and drug use among preadolescents in the US southwest. Subst Use Misuse. 2004;39:1061–1094. [DOI] [PMC free article] [PubMed] [Google Scholar]
- 31.Resnicow K, Soler RE, Braithwaite RL, Selassie MB, Smith M. Development of a racial and ethnic identity scale for African American adolescents: the survey of black life. J Black Psychol. 1999;25:171–188. [Google Scholar]
- 32.French SE, Kim TE, Pillado O. Ethnic identity, social group membership, and youth violence In: Guerra NG, Smith EP, eds. Preventing Youth Violence in a Multicultural Society. Washington, DC: American Psychological Association; 2006:47–73. [Google Scholar]
- 33.Austin AA. Alcohol, tobacco, other drug use, and violent behavior among native Hawaiians: ethnic pride and resilience. Subst Use Misuse. 2004;39:721–746. [DOI] [PubMed] [Google Scholar]
- 34.Lee RM. Resilience against discrimination: ethnic identity and other-group orientation as protective factors for Korean Americans. J Couns Psychol. 2005;52:36–44. [Google Scholar]
- 35.Mahalingam R, Balan S, Haritatos J. Engendering immigrant psychology: an intersectionality perspective. Sex Roles. 2008;59:326–336. [Google Scholar]
- 36.Sellers RM, Smith MA, Shelton JN, Rowley SA, Chavous TM. Multidimensional model of racial identity: a reconceptualization of African American racial identity. Pers Soc Psychol Rev. 1998;2:18–39. doi: 10.1207/s15327957pspr0201_2. [DOI] [PubMed] [Google Scholar]
- 37.Banaji MR, Prentice DA. The self in social contexts. Annu Rev Psychol. 1994;45:297–332. [Google Scholar]
- 38.Kelly GA. The Psychology of Personal Contexts. New York, NY: Norton; 1955. [Google Scholar]
- 39.Sellers RM, Caldwell CH, Schmeelk-Cone K, Zimmerman MA. The role of racial identity and racial discrimination in the mental health of African American young adults. J Health Soc Behav. 2003;44:302–317. [PubMed] [Google Scholar]
- 40.Wong CA, Eccles JS, Sameroff A. The influence of ethnic discrimination and ethnic identification on African American adolescents’ school and socioemotional adjustment. J Pers. 2003;71:1197–1232. [DOI] [PubMed] [Google Scholar]
- 41.Rowley SJ, Sellers RM, Chavous TM, Smith MA. The relationship between racial identity and self-esteem in African American college and high school students. J Pers Soc Psychol. 1998;74:715–724. [DOI] [PubMed] [Google Scholar]
- 42.Schwartz SJ, Weisskirch RS, Zamboanga BL, et al. Dimensions of acculturation: associations with health risk behaviors among college students from immigrant families. J Couns Psychol. 2011;58:27–41. doi: 10.1037/a0021356. [DOI] [PMC free article] [PubMed] [Google Scholar]
- 43.Weisskirch RS, Zamboanga BL, Ravert RD, et al. The composition of the Multi-site University Study of Identity and Culture (MUSIC): a collaborative approach to research and mentorship. Cultur Divers Ethnic Minor Psychol. In press. [DOI] [PubMed] [Google Scholar]
- 44.Beck AT, Epstein N, Brown G, Steer RA. An inventory for measuring clinical anxiety: psychometric properties. J Consult Clin Psychol. 1994;56:893–897. [DOI] [PubMed] [Google Scholar]
- 45.American Psychiatric Association. Diagnostic and Statistical Manual of Mental Disorders, Fourth Edition (DSM-IV). Washington, DC: American Psychiatric Association; 1994. [Google Scholar]
- 46.Radloff L The CES-D scale: a self-report depression scale for research in the general population. Appl Psychol Meas. 1977;1:385–401. [Google Scholar]
- 47.Muthén LK, Muthén BO. Mplus Users’ Guide. 6th ed Los Angeles: Muthén & Muthén; 1998–2010. [Google Scholar]
- 48.Hu L, Bentler PM. Cutoff criteria in fix indexes in covariance structure analysis: conventional criteria versus new alternatives. Struct Equ Model. 1999;6:1–55. [Google Scholar]
- 49.Vandenberg RJ, Lance CE. The next four decades. The older population in the United States: 2010 to 2050 population estimates and projections. Organ Res Methods. 2000;3:4–70. [Google Scholar]
- 50.Aiken LS, West SG. Multiple Regression: Testing and Interpreting Interactions. Newbury Park, CA: Sage Publications; 1991:212. [Google Scholar]
- 51.Arbuckle JL. AMOS Users’ Guide. Version 3.6 Chicago: Smallwaters; 1996. [Google Scholar]
- 52.Collins LM, Schafer JL, Kam C. A comparison of inclusive and restrictive strategies in modern missing data procedures. Psychol Bull. 2001;6:330–351. [PubMed] [Google Scholar]
- 53.Enders CK. Applied Missing Data Analysis. New York, NY: Guilford Press; 2010. [Google Scholar]
- 54.Alegria M, Takeuchi D, Canino G, et al. Considering context, place and culture: The National Latino and Asian American Study. Int J Methods Psychiatr Res. 2004;13:208–220. [DOI] [PMC free article] [PubMed] [Google Scholar]
- 55.Jackson JS, Torres M, Caldwell CH, et al. The national survey of American life: a study of racial, ethnic, and cultural influences on mental disorder and mental health. Int J Methods Psychiatr Res. 2004;13:196–207. [DOI] [PMC free article] [PubMed] [Google Scholar]
- 56.Shelton JN, Sellers RM. Situational stability and variability in African American racial identity. J Black Psychol. 2000;26:27–50. [Google Scholar]