Abstract
A new system for whole body exposure of small animals was developed to support investigation of the biological effects of aerosol generated by electronic cigarette (e-cig) products. A specialized computer-controlled design, with built-in sensors for real time monitoring of O2, CO2, relative humidity, and temperature within the exposure chambers and port for measuring total particulate matter (TPM) was developed, constructed and tested. The time course pattern of TPM concentration during different phases of the exposure cycle was measured. With increased puffing duration or number of exposure cycles, higher TPM exposure and plasma cotinine levels were observed with plasma cotinine levels in the range reported in light or heavy smokers. Our system: 1) accommodates a variety of commercial vaping devices; 2) offers software flexibility to adjust exposure protocols to mimic different users’ puffing patterns; 3) enables variable nicotine delivery to the animal’s systemic circulation; 4) minimizes travel time and alterations of aerosol quality or quantity by delivering aerosol directly to the exposure chamber; 5) offers local or remote operation of up to six distinct exposure chambers from a single control unit; and 6) can simultaneously test different exposure conditions or products in diverse animal groups, which reduces inter-run variability, saves time, and increases productivity. Overall, this novel, versatile, and durable exposure system facilitates high-throughput evaluation of the relative safety and potential toxicity of a variety of e-cig devices and liquids.
Keywords: electronic cigarettes, vaping, inhalation exposure, smoking, inhalation toxicology, cotinine, nicotine
1. Introduction
Electronic cigarettes (e-cig) have been promoted as nicotine (NIC) delivery devices and marketed as a safer alternative to tobacco cigarettes without their known adverse effects. Therefore, the use of e-cig is on the rise in the United States. More than 10% of adults and 20% of young aged 18–24 years have tried e-cig; approximately 25% of them report consistent use (Delnevo et al. 2016). Approximately 5% of middle school and 16% of high school students report vaping e-cig (Singh et al. 2016).
A wide range of e-cig designs has rapidly emerged in the past five years. In a typical e-cig device configuration, a user draws air through the device; an airflow sensor or a physical power button activates a battery that powers a heating coil or atomizer to produce e-cig vape which is an aerosol consisting of condensed droplets and gas phase. e-liquid contains propylene glycol, vegetable glycerol, H2O, and flavors, with or without nicotine. Both the particulate and gas phases of e-cig vape contain mixtures of chemical substances (Cheng 2014). Various e-cig designs are currently available: cigarette-like disposable and rechargeable designs; closed-system modular designs, comprised of battery units and e-liquid cartridges; open-system modular designs, wherein users add their choice of e-liquid to a refillable atomizer unit; and tank or box-mod systems, where users can customize individual components of the device and the operating conditions, as well as fill the tank with e-liquids of their choice (Brown and Cheng 2014).
The short- and long-term health effects of vaping have become a major public health concern and several studies have reported a wide range of e-cig-induced toxicity (Glantz and Bareham 2018). Abundant epidemiological studies and research (reviewed in detail by Merecz-Sadowska et al 2020) (Merecz-Sadowska et al. 2020) have linked e-cig vaping to a number of diseases including chronic obstructive pulmonary disease, neurodegenerative disease, oxidative stress and inflammation and impaired immune defense against bacterial and viral infections, as well as cardiovascular disease (Lerner et al. 2015; Sussan et al. 2015). As of September 2019, the Centers for Disease Control reported over 350 cases of e-cig-associated pulmonary illness and confirmed six deaths across 36 states (Warner and Mendez 2019).
There has been a growing interest in research to understand the toxicological potential of e-cig on small animals; yet, the results are equivocal. The reasons for such ambiguity may arise due to: 1) different e-cig devices and liquids can exert different toxicity, and most of the products on the market have not been systematically characterized in animal models; 2) lack of physiologically-relevant in vivo model systems, in which animals can be exposed to e-cig aerosol in a rigorously-controlled environment; 3) lack of a standardized laboratory puffing protocol that reflects real-life behavior of e-cig users; and 4) the wide variation of puffing topography among e-cig users, which significantly affects both the function of e-cig devices (eg, coil temperature) and the composition of their emissions (Sleiman et al. 2016; Cheng 2014; Farsalinos et al. 2013; Evans and Hoffman 2014). The selection of animal models, e-cig products and exposure protocols are important. Furthermore, the exposure system utilized for generation, characterization and delivery of e-cig aerosol is of great importance.
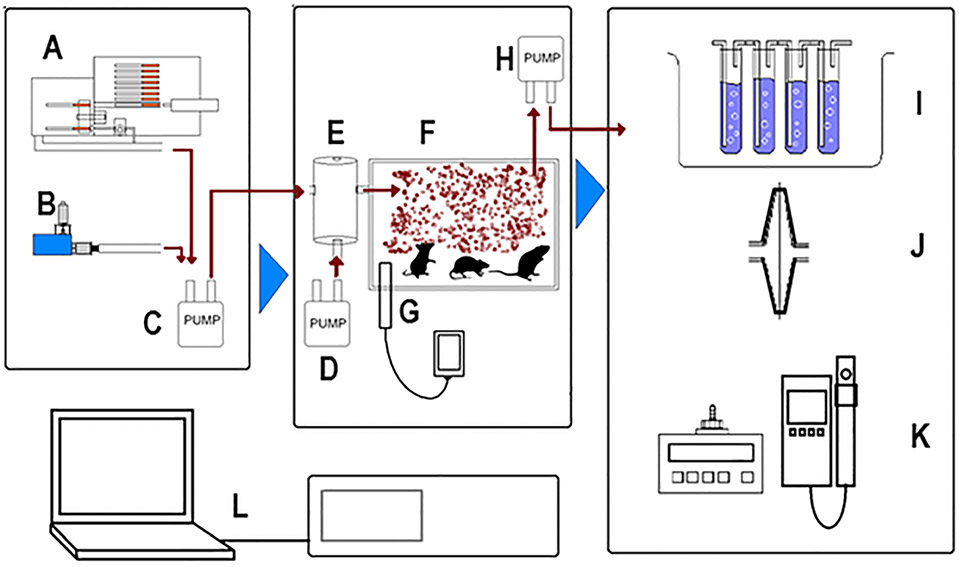
A variety of whole-body exposure systems, either lab-built or purchased from commercial sources, have been applied for product testing as described in prior publications (Wong 2007; Benam et al. 2020; Zhao, Pyrgiotakis, and Demokritou 2016; Li et al. 2014; Hilpert et al. 2019). Most of the available exposure systems share similar main functional subunits, including cigarette changing robots and/or e-cig puffing triggers, smoke/aerosol pumping systems, exposure chambers and gas monitoring peripherals (Fig. 1). Among these systems, different customized configurations have been set according to the investigators’ needs and the demands of the exposure experiments, including the number of animals to be studied, the applied exposure protocol and the required measurements (Lenz et al. 2009; Dianat et al. 2018; Zen Junior et al. 2012; Shi et al. 2019; Larcombe et al. 2017; Orzabal et al. 2019).
Figure 1: Diagram depicting common components of whole body tobacco/vape exposure systems.
A, cigarette robot (for tobacco cigarette exposure), B, e-cigarette with puff triggering solenoid, C, smoke/vape pump, D, Air Pump, E, air mixing chamber, F, whole-body exposure chamber, G, in-chamber environmental sensors, H, smoke/vape withdrawal pump, I, bubbling scrubber for particles collection, J, particulate collection filter, K, Optical particulate counter/sizer, L, PLC/Computerized Control Unit.
Although these systems are of great relevance and have been widely used in e-cig research publications for many years, many of the designs were modifications of prior systems used for tobacco cigarette smoking exposure. However, there are major differences in the physical characteristics of e-cig aerosol compared to tobacco smoke (Floyd et al. 2018; Margham et al. 2016; Sahu et al. 2013; Cheng 2014; Trtchounian, Williams, and Talbot 2010; Fernandez et al. 2015; Grana, Benowitz, and Glantz 2014) that require special attention when vaping exposure systems are designed. e-cig aerosol exhibits larger particle size, higher aerodynamic resistance and much higher tendency for condensation on contact surfaces (Sosnowski and Kramek-Romanowska 2016). While the cigarette smoke particles are solids in gas phase with a lifespan of ~1.4 hour, the e-cig aerosol particles are liquid droplets in gas phase with a much shorter life span in closed indoor spaces. Furthermore, many e-cig aerosol components, known to have adverse effects, such as butyraldhyde, nicotine nitrosamine, myosmine, chrysene, nicotine, and cotinine, have higher boiling points and lower vapor pressures and tend to condense rapidly, especially when they are in contact with colder surfaces (Lampos et al. 2019; Margham et al. 2016; Cheng 2014; Müller 1988). Compared to tobacco smoking, there is also major differences in the e-cig user puffing topographies (Farsalinos et al. 2013), with a longer puffing time, which requires flexibility in programming of e-cig devices to accommodate such important differences.
We have developed a new vaping exposure system with a special design that takes in consideration the major differences in physiochemical properties of e-cig aerosol and cigarette smoke. To address this the system provides rapid aerosol delivery directly to the exposure chamber minimizing prior contact with mechanical parts or tubing. This new system also addresses the need for an e-cig exposure system well-suited to provide controlled exposures to large numbers of animals for evaluation of a variety of e-cig devices and e-liquids over long periods of time. This new system is optimized for chronic whole body e-cig exposure in small animals such as mice and rats. The system utilizes a computer-control to achieve programmable repetitive cycles of vape and fresh room air introduction to the chambers, suited to mimic a wide variety of puffing topographies and exposure conditions. It allows an increased number and diversity of animal groups that can be exposed per session which reduces inter-run variability, saves time, and increases productivity. It further serves to minimize any alterations of aerosol quality or quantity by minimizing condensation and travel time to the exposure chambers. Internal sensor modules were developed and incorporated for real-time monitoring of O2 depletion and CO2 accumulation, humidity as well as temperature, to ensure normoxic and normothermic conditions (Ganeshan and Chawla 2017). The design approach used, with pump after the exposure chamber and filter prior to the pump, minimizes aerosol condensation in the pump and provides stable long term performance. It utilizes one controller unit and local or remote telemetric control to operate up to six different exposure chambers, allowing simultaneous testing of different conditions or products in parallel. Collectively, our system is unique in its versatility, durability, and flexibly in facilitating chronic multigroup e-cig aerosol inhalation exposures.
2. Instrumentation design and methods
2.1. Hardware
The exposure chambers (Fig. 2A; top view) are made from clear scratch- and UV resistant cast acrylic (McMaster-Carr®, Cleveland, OH). An exposure chamber was constructed by mounting an acrylic cylinder (13” inner diameter; 0.25” thickness; 2.25” height for mice or 4.5” for rats) on a base plate (acrylic 14”x14”; 5/16” thickness). A silicone seal is attached to the top edge of the cylinder to fit with the cover (acrylic 14”x14” thickness) and prevent air leak when a negative pressure is created as we describe below (under system operation and exposure protocol). A 6 l/min suction pump (Airpo D2028B with electric speed adjustment; Karlsson Robotics, Tequesta, FL, USA) is mounted on the base plate with inlet connected to the chamber using 316 stainless steel tubing (McMaster-Carr®, Cleveland, OH; 0.08” inner diameter), and a 316 stainless steel tube outlet connected to a condensation tower and a water scrubber. A sintered glass filter (Pyrex® Millipore/Sigma, USA; 40 μm) is mounted on the tube end to prevent animal hair or other debris from getting into the pump. The e-cig holder and a push solenoid are mounted on the base. The e-cig device with a firing button (E-Vic Basic Mod, Joytech Inc.) is mounted on the holder and the push solenoid arm is directed toward the firing button. The distance between the solenoid and the e-cig device is adjustable so different e-cig models or sizes can be used. The e-cig holder can be adjusted and the solenoid can be disabled when an e-cig device with an airflow sensor and with no firing bottom is used. A 316 stainless steel L-shaped tube (McMaster-Carr®, Cleveland, OH; 5” long with 0.11” inner diameter), that transfers the vape into the exposure chamber, is connected to the e-cig device mouthpiece through a rubber adapter. The other end of the L-shaped tube goes through and is tightly sealed in the chamber wall. Up to six exposure chambers can be stacked and controlled using a single controller. Each chamber contains a hard plastic septum at its center that can accommodate up to 6 plastic dividers, creating up to 6 pie-wedge shaped partitions; each partition holds 2 mice during the exposure. The septum and the dividers were printed in our laboratory using 3D ultra-printer and poly lactic acid filaments (PowerSpec®; Micro Center, OH).As shown in Figure 2B (side view), a serial connection serves to connect the cell stack to the control unit. The control unit operates the pumps and the push solenoid/e-cig firing button according to the protocol parameters provided by the user on an integrated touch-screen computer. The purged exhaust passes through a collection tower (McMaster-Carr®, Cleveland, OH acrylic cylinder; 1.5” inner diameter; 12” length) for vape collection and primary condensation followed by passage to an exhaust trap with multistage stone water bubblers/gas dispersion tubes (Millipore/Sigma, USA; 220 μm). We have used commercially available sensors that measure O2, relative humidity (RH), and temperature (MX200 sensor, CO2Meter.com®, FL, USA) and CO2 (K30 CO2 sensor, CO2Meter.com®, FL, USA), fitted them to a printed circuit board and programmed them to communicate data to a computer module that is displayed by the computer interface.
Figure 2: Schematic diagram of vaping exposure system with stacked exposure chambers.
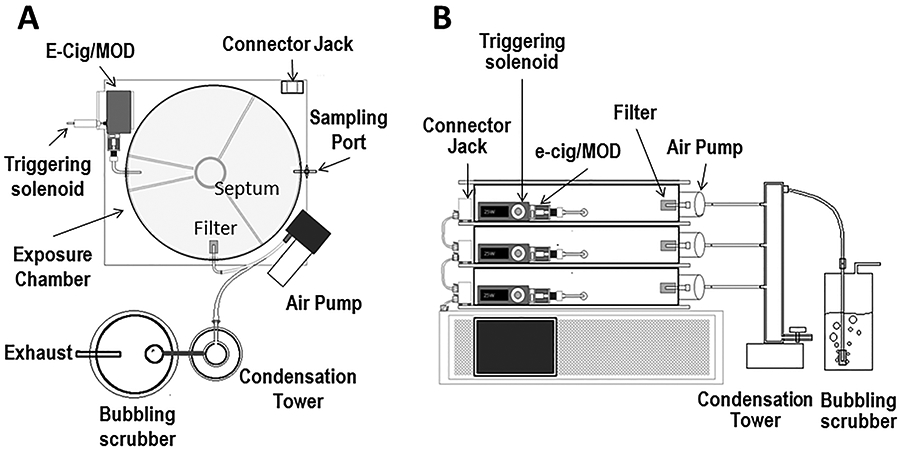
A, top view, and B, side view. Three stack cylindrical exposure cells are shown (system can control up to 6 chambers). Attached to each chamber through the baseplate an e-cig holder/trigger and an air withdrawal pump are present. Chambers are stacked on the control unit and the exhaust passes through a condensation tower followed by the water scrubber.
2.2. System Operation and Exposure Protocol
For testing the system and demonstration of its operation, we have selected an exposure protocol with an exposure cycle consisting of 3-6 s e-cig puff, 5 s air/aerosol mix, 180 s exposure time and 120 s air purge time, with a 5 s rest period between cycles.
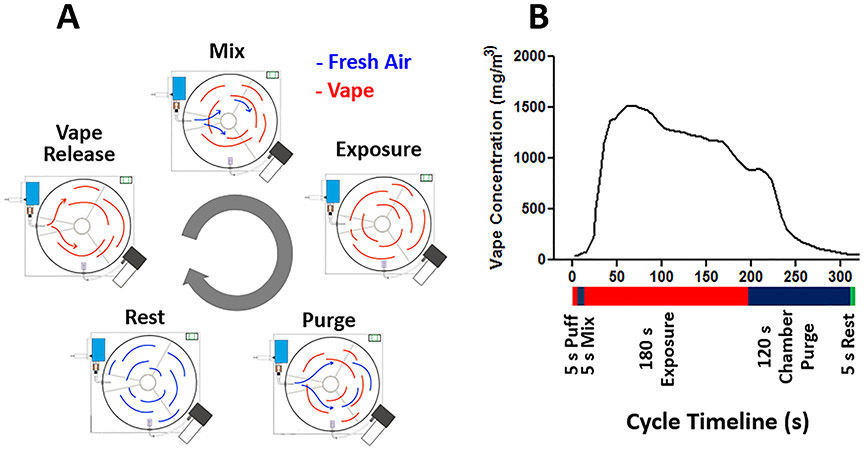
As puffing duration varies greatly by users (Mikheev et al. 2020; Perkins and Karelitz 2020; Robinson et al. 2015), our system can easily be programed by investigators to create exposure protocols that fit different experimental designs. The exposure time of 180 s was chosen to allow the animals to inhale the e-cig aerosol while still suspended in the chamber and prior to significant condensation (Fig. 3B). The 120 s purge duration was chosen to provide sufficent time for near complete exhausting of the vape by fresh air. Together, this time of 300 s was more than sufficent to allow cooling of the e-cig heating element between puffs. Figure 3 shows the sequential steps of one exposure cycle including vape release, mixing with air inside the chamber, exposure duration followed by purging the chamber with fresh air and resting the system before the next cycle. These steps are also listed with purpose defined in Table 1. Of note, the computer control of the system provides flexibility to achieve different exposure protocols and enables any of the phase durations to be changed if desired. In addition the system can be programmed for any desired flow from 0 to 6 l/min in a given phase.
Figure 3: Diagram depicting the five phases of one exposure cycle.
A, Different alterations of vape entrance (red) and fresh air entrance (blue) into the exposure chamber. Timing for different phases: vape 5 s, mix 5 s, exposure 180 s, purge 120 s, rest 5 s. E-cig device set to 25 W with 0.2 Ω heating coil. B, the corresponding vape concentration through the different phases with a 5 s e-cig puff vape release phase.
Table 1:
Purpose and goals of exposure protocol phases
| Phases | Purpose |
|---|---|
| Puffing | Vape generation |
| Mixing | Delivers air and mixes vape for a better distribution and longer suspension in the exposure chamber. |
| Exposure | Allows mice to inhale vape over 180 seconds, while the vape still suspended and its concentration still within the required average. |
| Purging | Refreshes exposure chamber environment; normalizes humidity, oxygen and temperature; removes CO2 build. |
| Rest | Time gap between exposure cycles; audible signal to inform investigator with the end of an exposure cycle. |
In the aerosol release (puff generation) step shown, the push solenoid is activated to fire the vaping device and generate aerosol for 5 s simultaneously with pump activation at a rate of 6 l/min to draw the aerosol from the e-cig device. With the e-cig located adjacent to the chamber, aerosol travels from the e-cig to the chamber through a tube (5” long, L; 0.11” inner diameter, D; 6.13 mm2 cross section, S) at a flow rate (F) of 100 cm3/sec with calculated travel time (t) of 13.1 ms. We applied the following equations: V=F/S, where V is gas velocity inside the tube and S is tube cross section; t=L/V, where L is the tube length.
The mixing step immediately follows with the solenoid switching off the e-cig coil while air continues to flow through the e-cig mouthpiece vent. This allows mixing of the aerosol inside the chamber and prevents over heating of the coil. Our initial system evaluation showed that operating the pump at a rate of 6 l/min, with the air vent in the vaping device mouthpiece held wide open, is important for creating the air vortex needed to rapidly distribute/suspend the aerosol inside the chamber. It is reported, unlike conventional cigarettes, that e-cig require higher vacuum to produce aerosol (Trtchounian, Williams, and Talbot 2010).
Next follows the exposure step that was set at 180 s, with the aerosol fully drawn into and held inside the exposure chamber as required for inhalation by the animals. During the exposure step, the pump is off with the air vent in the mouthpiece wide open to supply air. Using a particulate monitor, the aerosol concentration is measured from the chamber sampling port. It rises to a peak level and then gradually declines during this exposure phase. The duration of this step is limited by both depletion/settling of the aerosol and the need to minimize O2/CO2 depletion/accumulation and resultant physiological stress of the animals exposed. The duration of this aerosol release step, as well as the device voltage and heater resistance, determines the amount of aerosol inside the chamber.
Then the chamber purge step follows in which the pump pulls the remaining aerosol from the chamber at a flow rate of 6 l/min and replaces it with fresh ambient air through the vent in the mouthpiece of the vaping device. As measured using the particle sizing aerosol monitor, see details below, the aerosol concentration from the chamber sampling port returns to the baseline during the purging step. This is followed by a given duration rest step, after which the next cycle is repeated. The time course of particulate concentration during the different phases using typical system settings is illustrated in Figure 3b, and further described below. The particle sizing aerosol monitor measured mean particle size in the range of 190 to 420 nm throughout the exposure period. The system enables simultaneous exposures in up to 6 chambers. With identical exposure protocol settings for all chambers, identical particle concentration and size profiles were measured from each chamber.
2.3. Monitoring Modules
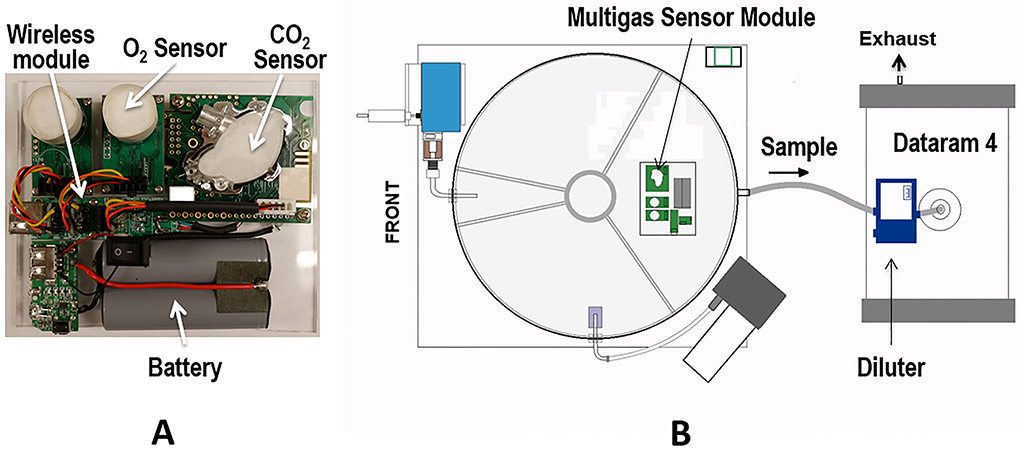
In order to measure the exposure profiles with characterization of the concentration of TPM and their size, real-time continuous sampling from the exposure chamber sampling port was performed, with particulate concentration and size monitored using a modified data real-time particle sizing aerosol monitor (DataRAM™4; Thermo Scientific). Sampling flow was ~0.5 l/min. The sampled aerosol is diluted by a 1:4 ratio with filtered fresh air so as to maintain the aerosol concentration within the instrument measurement range of ~470 mg/m3. The DataRAM adapts its pump capacity from the inlet pressure, ensuring a stable and accurate flow rate of 2 l/min which is controlled by internal flow sensors. Our diluter consists of a mixing chamber that has one outlet and two inlets. The outlet is connected to the DataRAM sampling port; one inlet is connected to the exposure chamber and the other is connected to a flow-controlled air pump. DataRAM withdraws the sample from the mixing chamber at a constant flow rate of 2 l/min; 1.5 l/min is provided by the air pump and the remaining 0.5 l/min is passively withdrawn from the exposure chamber. This passive sampling limits the contact of the aerosol with mechanical parts and surfaces, minimizes aerosol deposition, and guarantees constant airflow during without a need for any adjustment after initial system set-up. The DataRAM has a time constant response and delay of ~ 10 seconds. The 600 cc volume of the mixing chamber plus tubing volume leads to an additional ~ 18 second delay in the DataRam reading.
According to the factory recommendation and the DataRAM user manual provided by ThermoScientific, unless a “malfunction” message is displayed during the “zeroing” step, the DataRAM should be tested, cleaned and calibrated by the factory once every two years. The factory was consulted for the suitability of the DataRAM to measure e-cig aerosol concentration; a field gravimetric calibration was recommended and performed according to the manufacture recommendations as detailed in the instruction manual.
Continued sampling may result in gradual build-up of contamination on the interior surfaces of the sensing chamber components, which may increase the optical background. The DataRAM alerts the user at the completion of the “zeroing” step to clean the interior of the sensing chamber when the background increased. We follow the detailed steps, mentioned in the instruction manual, on how to clean the DataRAM. Monitoring of chamber O2/CO2/CO levels, relative humidity (RH) and temperature was achieved using a compact multi-gas module with high resolution temperature sensor (Fig. 4). This was designed to measure the concentrations of O2/CO2/CO using fluorescence quenching for O2 sensing over 0-100% range, non-dispersive infrared detection for CO2 over 0-10% range, and an electrochemical electrode sensor for CO over 0-0.5% range. The CO sensor is utilized primarily for tobacco cigarette exposure monitoring, while with e-cig vaping there is no detectable CO. The module is equipped with a standalone battery and wireless data transmission capability. Sensor caps are covered by compressed cotton mesh to allow gas diffusion while blocking particles. This unit is enclosed inside the exposure chamber, permitting real-time readings from inside the chamber, with no need to withdraw a sample.
Figure 4: Particulate monitoring and wireless gases monitoring modules.
A, photograph of wireless multigas sensor module with battery module. B, shows a schematic diagram of the multigas sensor module inside the exposure chamber and the Dataram particle analyzer system with input through a diluter as required for monitoring high particle concentrations of vape that exceed the system measuring range.
2.4. System Control Software
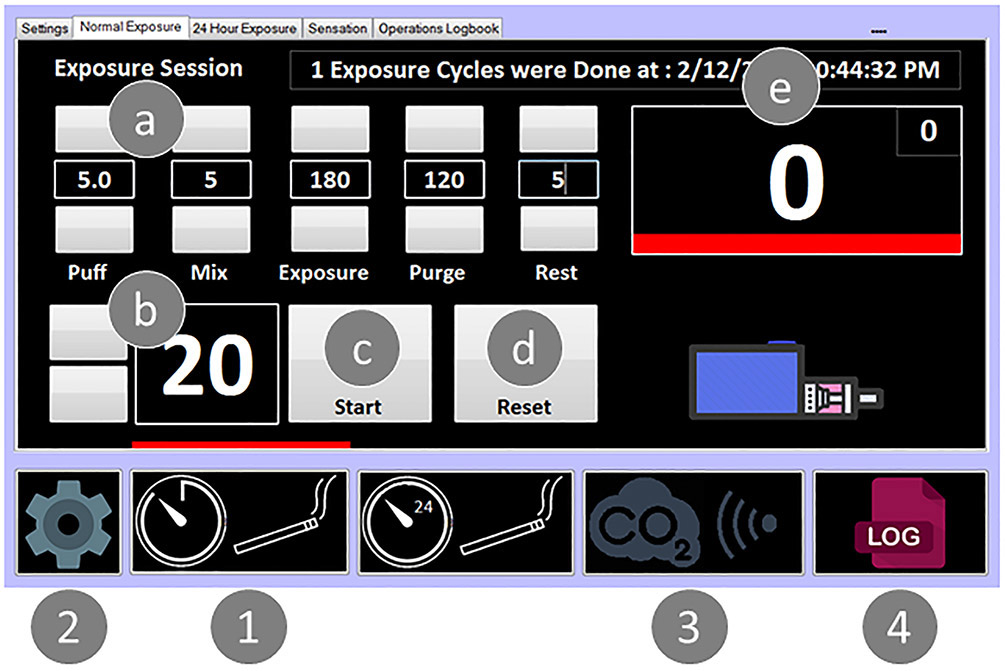
A single board computer (Lattepanda.com) was interfaced to an analog/digital control board (ADAM 6060, Advantech® Inc., USA) with 6 inputs and 6 relay outputs through the Modbus communication protocol with 32-bit software. An intuitive graphical interface with touch screen module was incorporated to facilitate system control and implementation of desired inhalation protocols and durations (Fig. 5). The interface allows the user to readily monitor the status of the exposure session with real-time access to sensor readings and events history. Microsoft visual studio 2010 that uses control libraries provided by Advantech® Inc. was used to write the software codes. The wireless communication protocol IEEE 802.11 was used to program the sensors’ module (CO2Meter.com®, FL, USA). The serial RS-232 protocol and the communication guidelines provided by ThermoFisher Scientific® were used to connect and program the Dataram.
Figure 5. Photo of the software interface for system control.
Main menu (1) offers (a) timing selectors for each step in seconds, (b) number of requested cycles/session, (c) start/pause, (d) reset button, and (e) caption box showing current cycle status. (2) Diagnostics menu page offering direct access for both pump and solenoid controls. (3) Monitoring page offers display and logging of sensor reading. (4) Logger page displaying history of all operations done using the system.
2.5. Assay of Plasma Cotinine
Plasma cotinine levels were measured using a cotinine ELISA kit (Calbiotech, El Cajon, CA). Blood samples ~0.2 ml were obtained via submandibular puncture 30 minutes after vape exposure or immediately after exposure. To obtain plasma, blood was collected in heparinized tubes and centrifuged at 1500 x g for 15 min. The supernatant plasma was collected and stored at −80 °C until assayed. Plasma (20 μL) was loaded directly onto ELISA plates and assayed according to the manufacturer’s instructions. Samples were loaded in duplicate, and absorbance was read at 450 nm alongside serial standards on a UV/VIS plate reader (Molecular Devices SpectraMax Plus 384, San Jose, CA).
3. Results and Discussion
3.1. Evaluation of TPM and cotinine plasma level with different puff durations
Four groups of male C57BL/6 mice (n= 8/group) were exposed to the vape generated using commercial e-cig box MOD (E-Vic Basic Mod, Joytech Inc.). The device, with a 5 ml-liquid tank filled with 24 mg/ml nicotine e-liquid (Apollo Vapes), was set to a power value of 25 W with a 0.2 Ω heating coil. Table 2 shows different puff durations and number of cycles for each group.
Table 2:
Exposure session settings for controlled delivery assessment.
| Group | Puff Durations |
Mix | Exposure | Purge | Rest | Number of Cycles |
|---|---|---|---|---|---|---|
| 1 | 3 s | 5 s | 180 s | 120 s | 5 s | 20 |
| 2 | 4 s | |||||
| 3 | 5 s | |||||
| 4 | 6 s |
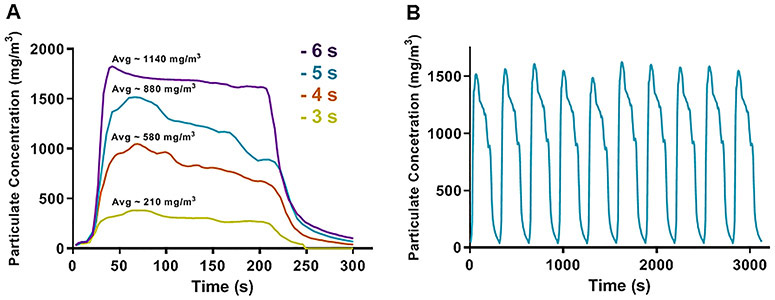
With total airflow of 6 l/min in the exposure system, the time course pattern of TPM concentration measured during the different cycle step phases is shown in Figure 3B. As expected with increasing e-cig puffing durations, similar patterns with higher TPM concentrations were observed with longer puffing times (Fig. 6A). The reproducibility with 10 cycles of exposure is shown in Figure 6B.
Figure 6. Particulate concentrations as a function of e-cig puff durations.
A, The profile from one exposure cycle is shown with 4 different puffing times of 3, 4, 5, or 6 s with 5 s mix, 180 s exposure, 120 s purge, and 5 s rest. Particulate was passed through a 1:4 ratio diluter and concentration was recorded every 3 s using a Dataram monitoring system. B, exposure profile pattern of 10 consecutive exposure cycles using 5 seconds puff time long with 5 s mix, 180 s exposure, 120 s purge, and 5 s rest between cycles.
We utilized a protocol of 20 repeat cycles with phase durations as shown in Table 2. The puff duration was varied from 3 to 6 sec. Nicotine exposure was assayed through detection of its longer-lived metabolite cotinine (Siu and Tyndale 2007; Pekonen et al. 1993). After 4 consecutive days of this daily exposure protocol, blood was drawn 30 minutes after the last exposure and plasma cotinine levels measured. As shown in Figure 7, a progressive increase in mean plasma cotinine level was seen with increased puff duration. Plasma cotinine levels measured at 30 minutes post exposure were 63 ± 2 ng/ml with 3 s puff, and rose to 75 ± 4 ng/ml with 4 s, 101 ± 5 ng/ml with 5 s, and 133 ± 15 ng/ml with 6 s. In additional experiments with blood sampled immediately at conclusion of the exposure, with 5 s puff duration plasma cotinine levels of 240 ± 7 ng/ml were detected. Thus, we observe that we can achieve plasma cotinine levels in the range reported in human smokers, where levels of 100 ng/ml are seen in light smokers to >300 ng/ml in heavy smokers (Marsot and Simon 2016; Jarvis et al. 2008). With increased puff duration or number of exposure cycles, higher exposure intensity with higher cotinine levels can be achieved, if desired.
Figure 7: Serum cotinine levels following e-cig vapor exposure.
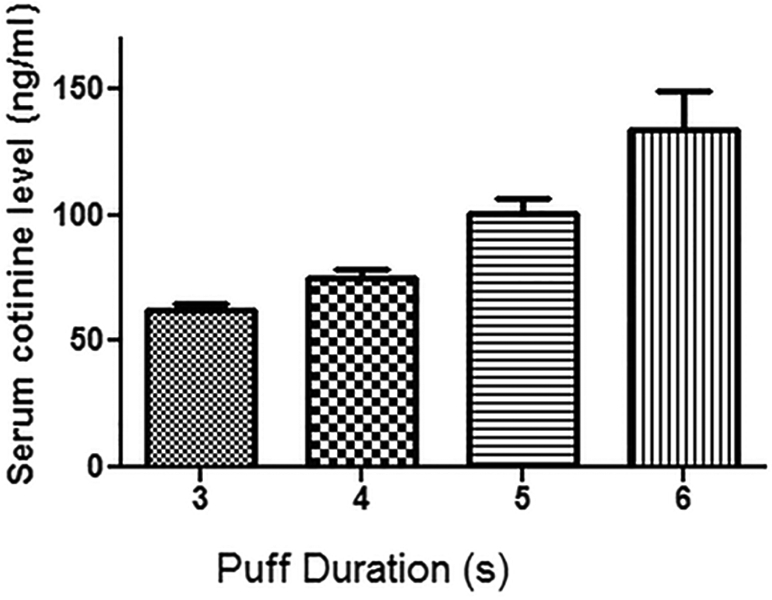
Blood was collected 30 minutes after exposure session completion. Each of the 4 groups with different puffing durations (n=7 mice/group) were exposed to 20 exposure cycles for 4 days. The exposure cycles were performed as defined in Table 2.
3.2. Measurement of e-liquid consumption
It is important for the e-cig vaping exposure system to be efficient in the use of e-cig liquid with minimized condensation and no leaks. In addition, this is helpful as different models of e-cig devices have different tank or cartridges reservoir capacities with concern that a single reservoir load will be sufficient for a given full exposure session. We tested the consumption of e-liquid over the full standard exposure conditions with different puff times. As shown in Figure 8, the mass consumption of e-cig liquid over 20 exposure cycles using standard settings and different puff times as in Table 2 resulted in 0.12 to a maximum of 0.83 grams, with the density of 1.14 gm/ml that corresponds to 0.105 - 0.728 ml. As the typical e-cig tank volume is 5 ml or more, multiple exposure sessions can be done without the need to refill the tank. The consumption was highly reproducible for a given exposure protocol with less than 2% variation from day to day.
Figure 8: E-Cig liquid consumption over 20 exposure cycles.
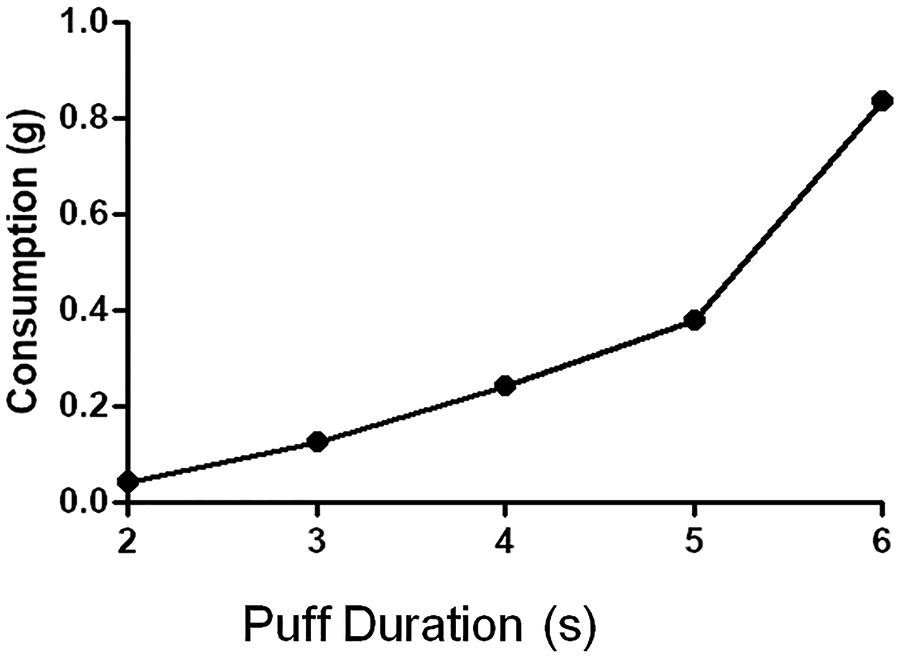
Standard settings were used with different puff durations. E-cig device settings were set to 25 W with 0.2 Ohm heating coil, and 5 ml liquid tank.
3.3. O2, CO2, relative humidity, and temperature monitoring during exposure
During e-cig exposure to groups of mice, O2 depletion and CO2 accumulation may occur within the chamber. In addition, there may also be a rise in temperature due to the warm vape entering the chamber. Therefore, we incorporated into our system provisions for sensor modules to detect these gas concentrations and temperature in real time through wireless communication. With ten ~25 gram mice placed in an exposure chamber, exposure was initiated and the levels of O2, and CO2, RH, as well as temperature were measured. With an exposure protocol consisting of 20 consecutive cycles using standard settings, as shown in Table 2, with 5-second puffs, it was observed that O2 levels exhibited small oscillations of ~ 0.7% and remained above 19.5 % (144 torr) with mean value of 19.8 % (Fig. 9). Minimum values were at the end of the exposure period, with maximum at the end of the air purge step. Similarly, small changes in CO2, with oscillations of ~ 0.5 %, were seen while CO2 remained below 0.8%, with mean level of 0.44 % during the full exposure session. The changes in CO2 were opposite those of O2, with maximum at end exposure and minimum at the end of the air purge step. During exposure, the real-time RH was monitored and remained in the range from 35 to 67%.
Figure 9: Exposure chamber O2 and CO2 gas concentrations, temperature and relative humidity during a typical 20-exposure cycle protocol.
The exposure setting used were: 5s Puff, 5s Mix, 180s exposure, 120s purge, and 5s rest. A, shows CO2 / O2 variations; CO2 level did not exceed 0.8 % on highest peak and O2 levels not lower than 19.4 %. B, Temperature was varying ~ 1.5 °C per cycle, and average temperature rose 2 °C over the full 20 cycles. Ambient temperature was 24 °C. C, Relative humidity varies approximately 10% per cycle. 8 cycles shown in each panel.
At the start of the exposure, the temperature of the chamber was measured to be ~25°C, and a small rise in mean temperature from 25 to 26.3°C was seen. With each exposure cycle, a small temperature oscillation of approximately 1.5°C was observed with maximum at end exposure and minimum at the end of the air purge step. If desired, purge duration could be increased to allow further return to basal temperature at each cycle.
3.4. System durability with long term use
Unlike other designs, our exposure system design incorporates the use of negative pressure air flow with pump located after the exposure chamber. This allows incorporation of particulate filter that minimizes vape condensation and prevents animal hair or other debris intrusion into the pump, in turn increasing the pump efficiency and system durability. With daily routine cleaning after exposure of the chamber and filter, the system was found to be highly robust with continuous daily use over 18 months, with over 1000 total exposure hours, requiring only preventive pump maintenance and cleaning with methanol every 200 hours. This long term system stability, free of system failures or need for major maintenance, greatly facilitates its use for long term chronic exposure studies. An internal trap enables portable use without the need for connection to any external pumps or need for fume hood or other venting. The system is thus suitable for animal exposures in the laboratory or animal facility without the need for facility modifications.
4. Summary and Conclusions
A specialized computer-controlled exposure system was designed, constructed and tested to improve control over the exposure of e-cig vape inhaled and nicotine delivered to the animal’s systemic circulation. This system minimizes any alterations of vape quality or quantity by minimizing condensation and travel time to the exposure chambers, resulting in efficient exposure with low consumption of e-cig liquid. Sensors were adapted and used for real-time monitoring of O2 depletion and CO2 accumulation, as well as temperature and relative humidity within the exposure chambers. These sensors enable measurement of these critical parameters during exposure to assure that related stress to the animals is prevented. The system design with pump location distal to the exposure chamber with inlet filter extends pump lifetime, enabling stable operation to support long term exposures. With one controller unit, up to six different exposure conditions or products can be simultaneously tested. Overall, this novel exposure system design will facilitate high throughput evaluation of the relative safety and potential toxicity of a variety of e-cig devices and liquids.
Acknowledgement
We thank Arkadiy Iosilevich for his expert machining work on the exposure chamber and other required mechanical parts needed for assembly of the exposure system. This work was supported by NIH/NHLBI grants R01HL135648 and R01HL131941.
References
- Benam KH, Novak R, Ferrante TC, Choe Y, and Ingber DE. 2020. Biomimetic smoking robot for in vitro inhalation exposure compatible with microfluidic organ chips. Nat Protoc 15 (2):183–206. [DOI] [PubMed] [Google Scholar]
- Brown CJ, and Cheng JM. 2014. Electronic cigarettes: product characterisation and design considerations. Tob Control 23 Suppl 2:ii4–10. [DOI] [PMC free article] [PubMed] [Google Scholar]
- Cheng T 2014. Chemical evaluation of electronic cigarettes. Tob Control 23 Suppl 2:ii11–7. [DOI] [PMC free article] [PubMed] [Google Scholar]
- Delnevo CD, Giovenco DP, Steinberg MB, Villanti AC, Pearson JL, Niaura RS, and Abrams DB. 2016. Patterns of Electronic Cigarette Use Among Adults in the United States. Nicotine Tob Res 18 (5):715–9. [DOI] [PMC free article] [PubMed] [Google Scholar]
- Dianat M, Radan M, Badavi M, Mard SA, Bayati V, and Ahmadizadeh M. 2018. Crocin attenuates cigarette smoke-induced lung injury and cardiac dysfunction by anti-oxidative effects: the role of Nrf2 antioxidant system in preventing oxidative stress. Respir Res 19 (1):58. [DOI] [PMC free article] [PubMed] [Google Scholar]
- Evans SE, and Hoffman AC. 2014. Electronic cigarettes: abuse liability, topography and subjective effects. Tobacco Control 23:23–29. [DOI] [PMC free article] [PubMed] [Google Scholar]
- Farsalinos KE, Romagna G, Tsiapras D, Kyrzopoulos S, and Voudris V. 2013. Evaluation of electronic cigarette use (vaping) topography and estimation of liquid consumption: implications for research protocol standards definition and for public health authorities' regulation. Int J Environ Res Public Health 10 (6):2500–14. [DOI] [PMC free article] [PubMed] [Google Scholar]
- Fernandez Esteve, Ballbe Montse, Sureda Xisca, Fu Marcela, Salto Esteve, and Martinez-Sanchez Jose M.. 2015. Particulate Matter from Electronic Cigarettes and Conventional Cigarettes: a Systematic Review and Observational Study. Current environmental health reports 2 (4):423–9. [DOI] [PubMed] [Google Scholar]
- Floyd EL, Queimado L, Wang J, Regens JL, and Johnson DL. 2018. Electronic cigarette power affects count concentration and particle size distribution of vaping aerosol. Plos One 13 (12). [DOI] [PMC free article] [PubMed] [Google Scholar]
- Ganeshan K, and Chawla A. 2017. Warming the mouse to model human diseases. Nat Rev Endocrinol 13 (8):458–465. [DOI] [PMC free article] [PubMed] [Google Scholar]
- Glantz Stanton A., and Bareham David W.. 2018. E-Cigarettes: Use, Effects on Smoking, Risks, and Policy Implications. Annual review of public health 39:215–235. [DOI] [PMC free article] [PubMed] [Google Scholar]
- Grana R, Benowitz N, and Glantz SA. 2014. E-Cigarettes A Scientific Review. Circulation 129 (19):1972–1986. [DOI] [PMC free article] [PubMed] [Google Scholar]
- Hilpert M, Ilievski V, Coady M, Andrade-Gutierrez M, Yan B, Chillrud SN, Navas-Acien A, and Kleiman NJ. 2019. A custom-built low-cost chamber for exposing rodents to e-cigarette aerosol: practical considerations. Inhal Toxicol 31 (11-12):399–408. [DOI] [PMC free article] [PubMed] [Google Scholar]
- Jarvis MJ, Fidler J, Mindell J, Feyerabend C, and West R. 2008. Assessing smoking status in children, adolescents and adults: cotinine cut-points revisited. Addiction 103 (9):1553–61. [DOI] [PubMed] [Google Scholar]
- Lampos S, Kostenidou E, Farsalinos K, Zagoriti Z, Ntoukas A, Dalamarinis K, Savranakis P, Lagoumintzis G, and Poulas K. 2019. Real-Time Assessment of E-Cigarettes and Conventional Cigarettes Emissions: Aerosol Size Distributions, Mass and Number Concentrations. Toxics 7 (3). [DOI] [PMC free article] [PubMed] [Google Scholar]
- Larcombe AN, Janka MA, Mullins BJ, Berry LJ, Bredin A, and Franklin PJ. 2017. The effects of electronic cigarette aerosol exposure on inflammation and lung function in mice. Am J Physiol Lung Cell Mol Physiol 313 (1):L67–L79. [DOI] [PubMed] [Google Scholar]
- Lenz AG, Karg E, Lentner B, Dittrich V, Brandenberger C, Rothen-Rutishauser B, Schulz H, Ferron GA, and Schmid O. 2009. A dose-controlled system for air-liquid interface cell exposure and application to zinc oxide nanoparticles. Part Fibre Toxicol 6:32. [DOI] [PMC free article] [PubMed] [Google Scholar]
- Lerner CA, Sundar IK, Yao HW, Gerloff J, Ossip DJ, McIntosh S, Robinson R, and Rahman I. 2015. Vapors Produced by Electronic Cigarettes and E-Juices with Flavorings Induce Toxicity, Oxidative Stress, and Inflammatory Response in Lung Epithelial Cells and in Mouse Lung. Plos One 10 (2). [DOI] [PMC free article] [PubMed] [Google Scholar]
- Li X, Nie C, Shang P, Xie F, Liu H, and Xie J. 2014. Evaluation method for the cytotoxicity of cigarette smoke by in vitro whole smoke exposure. Exp Toxicol Pathol 66 (1):27–33. [DOI] [PubMed] [Google Scholar]
- Margham J, McAdam K, Forster M, Liu C, Wright C, Mariner D, and Proctor C. 2016. Chemical Composition of Aerosol from an E-Cigarette: A Quantitative Comparison with Cigarette Smoke. Chemical Research in Toxicology 29 (10):1662–1678. [DOI] [PubMed] [Google Scholar]
- Marsot A, and Simon N. 2016. Nicotine and Cotinine Levels With Electronic Cigarette: A Review. Int J Toxicol 35 (2):179–85. [DOI] [PubMed] [Google Scholar]
- Merecz-Sadowska A, Sitarek P, Zielinska-Blizniewska H, Malinowska K, Zajdel K, Zakonnik L, and Zajdel R. 2020. A Summary of In Vitro and In Vivo Studies Evaluating the Impact of E-Cigarette Exposure on Living Organisms and the Environment. Int J Mol Sci 21 (2). [DOI] [PMC free article] [PubMed] [Google Scholar]
- Mikheev VB, Buehler SS, Brinkman MC, Granville CA, Lane TE, Ivanov A, Cross KM, and Clark PI. 2020. The Application of Commercially Available Mobile Cigarette Topography Devices for E-cigarette Vaping Behavior Measurements. Nicotine & Tobacco Research 22 (5):681–688. [DOI] [PMC free article] [PubMed] [Google Scholar]
- Müller Jürgen. 1988. Aerosol formation according to specific vapour pressure, at Berlin, Heidelberg. [Google Scholar]
- Orzabal MR, Lunde-Young ER, Ramirez JI, Howe SYF, Naik VD, Lee J, Heaps CL, Threadgill DW, and Ramadoss J. 2019. Chronic exposure to e-cig aerosols during early development causes vascular dysfunction and offspring growth deficits. Transl Res 207:70–82. [DOI] [PMC free article] [PubMed] [Google Scholar]
- Pekonen K, Karlsson C, Laakso I, and Ahtee L. 1993. Plasma Nicotine and Cotinine Concentrations in Mice after Chronic Oral Nicotine Administration and Challenge Doses. European Journal of Pharmaceutical Sciences 1 (1):13–18. [Google Scholar]
- Perkins KA, and Karelitz JL. 2020. A Procedure to Standardize Puff Topography During Evaluations of Acute Tobacco or Electronic Cigarette Exposure. Nicotine & Tobacco Research 22 (5):689–698. [DOI] [PMC free article] [PubMed] [Google Scholar]
- Robinson RJ, Hensel EC, Morabito PN, and Roundtree KA. 2015. Electronic Cigarette Topography in the Natural Environment. Plos One 10 (6). [DOI] [PMC free article] [PubMed] [Google Scholar]
- Sahu SK, Tiwari M, Bhangare RC, and Pandit GG. 2013. Particle Size Distribution of Mainstream and Exhaled Cigarette Smoke and Predictive Deposition in Human Respiratory Tract. Aerosol and Air Quality Research 13 (1):324–332. [Google Scholar]
- Shi H, Fan X, Horton A, Haller ST, Kennedy DJ, Schiefer IT, Dworkin L, Cooper CJ, and Tian J. 2019. The Effect of Electronic-Cigarette Vaping on Cardiac Function and Angiogenesis in Mice. Sci Rep 9 (1):4085. [DOI] [PMC free article] [PubMed] [Google Scholar]
- Singh T, Arrazola RA, Corey CG, Husten CG, Neff LJ, Homa DM, and King BA. 2016. Tobacco Use Among Middle and High School Students--United States, 2011-2015. MMWR Morb Mortal Wkly Rep 65 (14):361–7. [DOI] [PubMed] [Google Scholar]
- Siu EC, and Tyndale RF. 2007. Characterization and comparison of nicotine and cotinine metabolism in vitro and in vivo in DBA/2 and C57BL/6 mice. Mol Pharmacol 71 (3):826–34. [DOI] [PubMed] [Google Scholar]
- Sleiman M, Logue JM, Montesinos VN, Russell ML, Litter MI, Gundel LA, and Destaillats H. 2016. Emissions from Electronic Cigarettes: Key Parameters Affecting the Release of Harmful Chemicals. Environ Sci Technol 50 (17):9644–51. [DOI] [PubMed] [Google Scholar]
- Sussan TE, Gajghate S, Thimmulappa RK, Ma J, Kim JH, Sudini K, Consolini N, Cormier SA, Lomnicki S, Hasan F, Pekosz A, and Biswal S. 2015. Exposure to electronic cigarettes impairs pulmonary anti-bacterial and anti-viral defenses in a mouse model. PLoS One 10 (2):e0116861. [DOI] [PMC free article] [PubMed] [Google Scholar]
- Trtchounian A, Williams M, and Talbot P. 2010. Conventional and electronic cigarettes (e-cigarettes) have different smoking characteristics. Nicotine & Tobacco Research 12 (9):905–912. [DOI] [PubMed] [Google Scholar]
- Warner KE, and Mendez D. 2019. E-cigarettes: Comparing the Possible Risks of Increasing Smoking Initiation with the Potential Benefits of Increasing Smoking Cessation. Nicotine Tob Res 21 (1):41–47. [DOI] [PubMed] [Google Scholar]
- Wong BA 2007. Inhalation exposure systems: design, methods and operation. Toxicol Pathol 35 (1):3–14. [DOI] [PubMed] [Google Scholar]
- Zen Junior JH, Del Negro A, Colli Neto JA, Araujo MR, Altemani AM, and Andreollo NA. 2012. Experimental model of smoking and simulation of reflux with acid and pepsin in rats. Acta Cir Bras 27 (1):18–22. [DOI] [PubMed] [Google Scholar]
- Zhao J, Pyrgiotakis G, and Demokritou P. 2016. Development and characterization of electronic-cigarette exposure generation system (Ecig-EGS) for the physico-chemical and toxicological assessment of electronic cigarette emissions. Inhal Toxicol 28 (14):658–669. [DOI] [PMC free article] [PubMed] [Google Scholar]


