

SUMMARY
Magnesium (Mg2+) homeostasis depends on active transcellular Mg2+ reuptake from urine in distal convoluted tubules (DCTs) via the Mg2+ channel TRPM6, whose activity has been proposed to be regulated by EGF. Calcium (Ca2+) homeostasis depends on paracellular reabsorption in the thick ascending limbs of Henle (TALs). KCTD1 promotes terminal differentiation of TALs/DCTs, but how its deficiency affects urinary Mg2+ and Ca2+ reabsorption is unknown. Here, this study shows that DCT1-specific KCTD1 inactivation leads to hypomagnesemia despite normal TRPM6 levels because of reduced levels of the sodium chloride co-transporter NCC, whereas Mg2+ homeostasis does not depend on EGF. Moreover, KCTD1 deficiency impairs paracellular urinary Ca2+ and Mg2+ reabsorption in TALs because of reduced NKCC2/claudin-16/-19 and increased claudin-14 expression, leading to hypocalcemia and consequently to secondary hyperparathyroidism and progressive metabolic bone disease. Thus, KCTD1 regulates urinary reabsorption of Mg2+ and Ca2+ by inducing expression of NCC in DCTs and NKCC2/claudin-16/-19 in TALs.
Graphical Abstract
In Brief
Marneros shows that distal nephron defects from KCTD1 deficiency impair urinary transcellular Mg2+ reabsorption in distal convoluted tubules (DCTs) and paracellular Ca2+ and Mg2+ reabsorption in thick ascending limbs of Henle (TALs). Mice lacking KCTD1 develop hypomagnesemia and hypocalcemia, resulting in secondary hyperparathyroidism and consequently in progressive metabolic bone disease.
INTRODUCTION
The distal nephron of the kidney has a critical role for magnesium (Mg2+) and calcium (Ca2+) homeostasis by regulating the reabsorption of filtered Mg2+ and Ca2+ from urine. Mg2+ homeostasis depends largely on the rate of Mg2+ uptake by the intestine and by urinary Mg2+ excretion. Mechanisms of filtered Mg2+ reabsorption from urine in the kidney are, therefore, essential for tight regulation of Mg2+ serum levels and overall Mg2+ homeostasis. Most reabsorption of filtered Mg2+ in the kidney occurs via a paracellular mechanism in the proximal tubules (PTs) and the thick ascending limbs of Henle (TALs) (Mount, 2014). However, the distal convoluted tubule (DCT) is the primary site for active transcellular reabsorption of Mg2+ and accounts for ~10% of urinary Mg2+ uptake, which is mediated by the apical Mg2+ channel TRPM6 (Voets et al., 2004). This active transcellular Mg2+ uptake in the DCT is critical for the fine regulation of Mg2+ serum levels, and mutations in TRPM6 lead to familial hypomagnesemia (Schlingmann et al., 2002; Walder et al., 2002). The DCT is separated into an early segment (DCT1), which transitions from the TAL, and a later segment (DCT2), which leads to the connecting tubule (CT). DCT cells are identified by their specific expression of the thiazide-sensitive apical Na+Cl− co-transporter NCC. DCT1 cells selectively express parvalbumin (Pvalb), whereas DCT2 cells express calbindin-D28K (DCT1: NCC+Pvalb+; DCT2: NCC+Calbindin-D28K+). Both parvalbumin and calbindin-D28K are cytoplasmic Mg2+ and Ca2+ binding proteins, and >80% of Pvalb-binding sites are occupied by Mg2+ in DCT1 epithelial cells. TRPM6 is expressed in the entire DCT, albeit with higher abundance in the DCT1. The activity of TRPM6 has been proposed to be regulated by the growth factor EGF, which is expressed in the kidney mainly by TAL and DCT cells. A C3209T missense mutation in EGF, which results in a P1070L amino acid change, was identified in a single, small family with isolated autosomal recessive hypomagnesemia (LOD score of only 2.66) (Groenestege et al., 2007). This C3209T variant is present only very rarely in the general population. However, the fact that this rare EGF variant has been linked to hypomagnesemia only in a single, small family raises the question as to the functional significance of EGF for controlling Mg2+ homeostasis. Immunolabeling detects EGF in the kidney mainly at the apical membranes of TALs and DCTs (Marneros, 2020). Despite this apical localization of EGF in vivo, in vitro studies suggested that the P1070L amino acid change in EGF results in impaired basolateral sorting of pro-EGF and diminishes EGFR stimulation, which has been proposed to impair activation of the epithelial Mg2+ channel TRPM6 and lead to urinary Mg2+ wasting (Groenestege et al., 2007). Thus, whereas EGF may participate to some extent in the regulation of Mg2+ transport in DCTs, whether EGF is indeed a major magnesiotropic factor remains to be shown and the in vivo relevance of EGF for Mg2+ homeostasis requires further validation.
In contrast, a well-established cause for familial renal Mg2+ wasting is inactivating mutations in SLC12A3, encoding the gene for NCC, in patients with Gitelman syndrome, the most common form of familial hypomagnesemia (Simon et al., 1996c). NCC is found in the kidney in apical membranes of DCTs, and mutations in SLC12A3 reduce Na+ influx into the cell, which is needed to maintain basolateral Na+/K+-ATPase function, which establishes a low intracellular Na+ concentration that promotes Na+ entry apically and possibly Mg2+ exit at the basal side in DCT cells (Loffing et al., 2001). Thus, it has been proposed that loss of NCC impairs the electrolyte gradient required for transcellular Mg2+ transport in DCT cells, resulting in urinary Mg2+ wasting and hypomagnesemia in patients with Gitelman syndrome or in Slc12a3−/− mice (Schultheis et al., 1998; Simon et al., 1996c). Notably, Pvalb regulates NCC expression in DCT1s by modulating intracellular Ca2+ signaling, and Pvalb−/−mice have reduced renal NCC (Belge et al., 2007). Overall, the DCT1 is considered to be the main site for active transcellular Mg2+ transport in the kidney, is the only site of renal Pvalb expression, and is the nephron segment where TRPM6 and NCC have their highest expression (Xi et al., 2009).
The distal nephron is also a critical site for regulation of Ca2+ homeostasis. Ca2+ enters the tubular apparatus via glomerular filtration, and 98% of it is reabsorbed through either transcellular or paracellular mechanisms (Moor and Bonny, 2016). Most urinary Ca2+ is reabsorbed in the PTs (~65%) and TALs (~25%) through paracellular mechanisms, whereas only a relatively small fraction of urinary Ca2+ (~8%) is reabsorbed through transcellular mechanisms in the DCT2s and CTs (the collecting ducts [CDs] do not reabsorb Ca2+) (Blaine et al., 2015).
A critical role for the transcriptional regulator KCTD1 has now been identified for the terminal differentiation and function of TAL and DCT epithelia (Marneros, 2020). KCTD1 is a BTB-domain-containing nuclear protein, whose in vivo functions were previously not known (Ding et al., 2008, 2009; Li et al., 2014; Marneros et al., 2013). This study found that the transcription factor AP-2β is required for the formation of early-stage DCTs during nephrogenesis, whereas KCTD1 expression in the distal nephron is induced by AP-2β and is required for the proper terminal differentiation of early-stage DCTs into mature, terminally differentiated DCTs (Marneros, 2020). Inactivation of KCTD1 in nephron progenitor cells (Six2Cre+KCTD1fl/fl mice) impairs DCT and TAL function, resulting in a salt-losing tubulopathy and progressive renal failure, which is associated with diminished expression of the salt transporters NCC (in DCTs) and NKCC2 (in TALs) (Marneros, 2020). Notably, diminished activities of NCC and NKCC2 have been linked to similar clinical findings in patients with congenital salt-losing tubulopathies (Gitelman syndrome and Bartter syndrome) (Simon et al., 1996a, 1996c). The AP-2β/KCTD1 axis is further demonstrated to be not only essential for the induction but also for the maintenance of the terminal differentiation state of TALs/DCTs in adults (Marneros, 2020). Although EGF expression in TALs/DCTs is found to be dependent on KCTD1, the terminal differentiation defect of TALs/DCTs in mice lacking KCTD1 occurs largely independent of EGF because EGF−/− mice do not phenocopy the renal abnormalities seen in KCTD1−/− mice (Marneros, 2020).
Here, this study investigated whether KCTD1 deficiency impairs urinary Mg2+ and Ca2+ reabsorption in the kidney and affects overall Mg2+ and Ca2+ homeostasis. The findings show that, when KCTD1 is inactivated specifically in the DCT1 (in PvalbCre+KCTD1fl/fl mice), hypomagnesemia and urinary Mg2+ wasting occur in association with diminished NCC expression, despite normal renal TRPM6 protein levels. Surprisingly, EGF deficiency (in EGF−/− mice) does not result in hypomagnesemia, suggesting that EGF is not a major regulator of Mg2+ homeostasis. Thus, KCTD1-mediated terminal differentiation of DCT1s is required for high-level NCC expression in this nephron segment and is critical for its ability to maintain transcellular Mg2+ transport, whereas EGF is not essential for that process. Furthermore, KCTD1 deficiency in the kidney was found to lead to functional TAL defects that impair the ability of this nephron segment to reabsorb Ca2+ from urine, resulting in urinary Ca2+ wasting, which leads to hypocalcemia, secondary hyperparathyroidism, and consequently, progressive metabolic bone disease. Mechanistically, the findings link the Ca2+ transport defect to impaired expression of key regulators of paracellular Ca2+ transport in the TAL as a consequence of KCTD1 deficiency: the TAL-specific loop diuretic-sensitive Na+-K+-2Cl− co-transporter NKCC2 is critical for the ability of TALs to concentrate urine and for maintaining a lumen-positive electrical gradient that drives paracellular Ca2+ and Mg2+ reabsorption in TALs (Mount, 2014), and constitutive or induced inactivation of KCTD1 resulted in diminished NKCC2 levels in TALs. This reduction in NKCC2 was associated with an impaired ability of the kidney to reabsorb urinary Ca2+ in TALs, resulting in urinary Ca2+ wasting. Hypercalciuria was linked not only to NKCC2 loss but also to reduced expression of PTH1R and claudin-16/19 and increased expression of claudin-14, which are all important regulators of paracellular Ca2+ and Mg2+ reabsorption in TALs. Thus, KCTD1 function in the distal nephron is required for renal regulation of Mg2+ and Ca2+ homeostasis.
RESULTS
Inactivation of AP-2β or KCTD1 in DCT1s Results in Hypomagnesemia
PvalbCre+ mice allow for selective inactivation of genes in the DCT1s (Figure 1A). Inactivation of KCTD1 or AP-2β only in DCT1s (PvalbCre+KCTD1fl/fl mice and PvalbCre+TFAP2Bfl/fl mice) did not impair overall kidney function (Figures S1A and S1B). However, already young (2-month-old) PvalbCre+KCTD1fl/fl and PvalbCre+TFAP2Bfl/fl mice had significant hypomagnesemia, which was maintained with age (Figures 1B and S1B). Despite normal urine production, Mg2+ urine concentration was increased in PvalbCre+KCTD1fl/fl mice (Figures 1C and S1A). Similarly, inducible inactivation of KCTD1 in adults also resulted in hypomagnesemia (Figure 1D). In contrast, inactivation of KCTD1 in the intestines (VilCre+KCTD1fl/fl mice) or the CTs/CDs (Aqp2Cre+KCTD1fl/fl mice) did not affect serum Mg2+ levels (Figure 1D). The hypomagnesemia in both PvalbCre+KCTD1fl/fl mice and PvalbCre+TFAP2Bfl/fl mice was associated with reduced renal NCC protein levels, whereas TRPM6 protein levels were not reduced (Figure 1E). Similarly, expression of TRPM6 was not reduced in Six2Cre+KCTD1fl/fl mice (lacking KCTD1 in the entire nephron, except the CDs), which had strongly decreased Slc12a3 (NCC) transcript levels in their kidneys at 2 months of age (Figure 1F) as shown previously (Marneros, 2020). Analysis of RNA sequencing (RNA-seq) data from kidneys of P8 Six2Cre+KCTD1fl/fl mice or of mice with inducible inactivation of AP-2β in the adult showed that, among genes that have been implicated in the regulation of renal Mg2+ transport, only Slc12a3, EGF, and Pvalb were downregulated greater 1.5-fold in both mutants (Figure 1G) (Marneros, 2020). Collectively, these findings demonstrate that AP-2β/KCTD1 function in DCT1s is critical for NCC expression and for urinary Mg2+ reuptake in this nephron segment.
Figure 1. Inactivation of AP-2β or KCTD1 in DCT1s Results in Hypomagnesemia Independently of EGF.
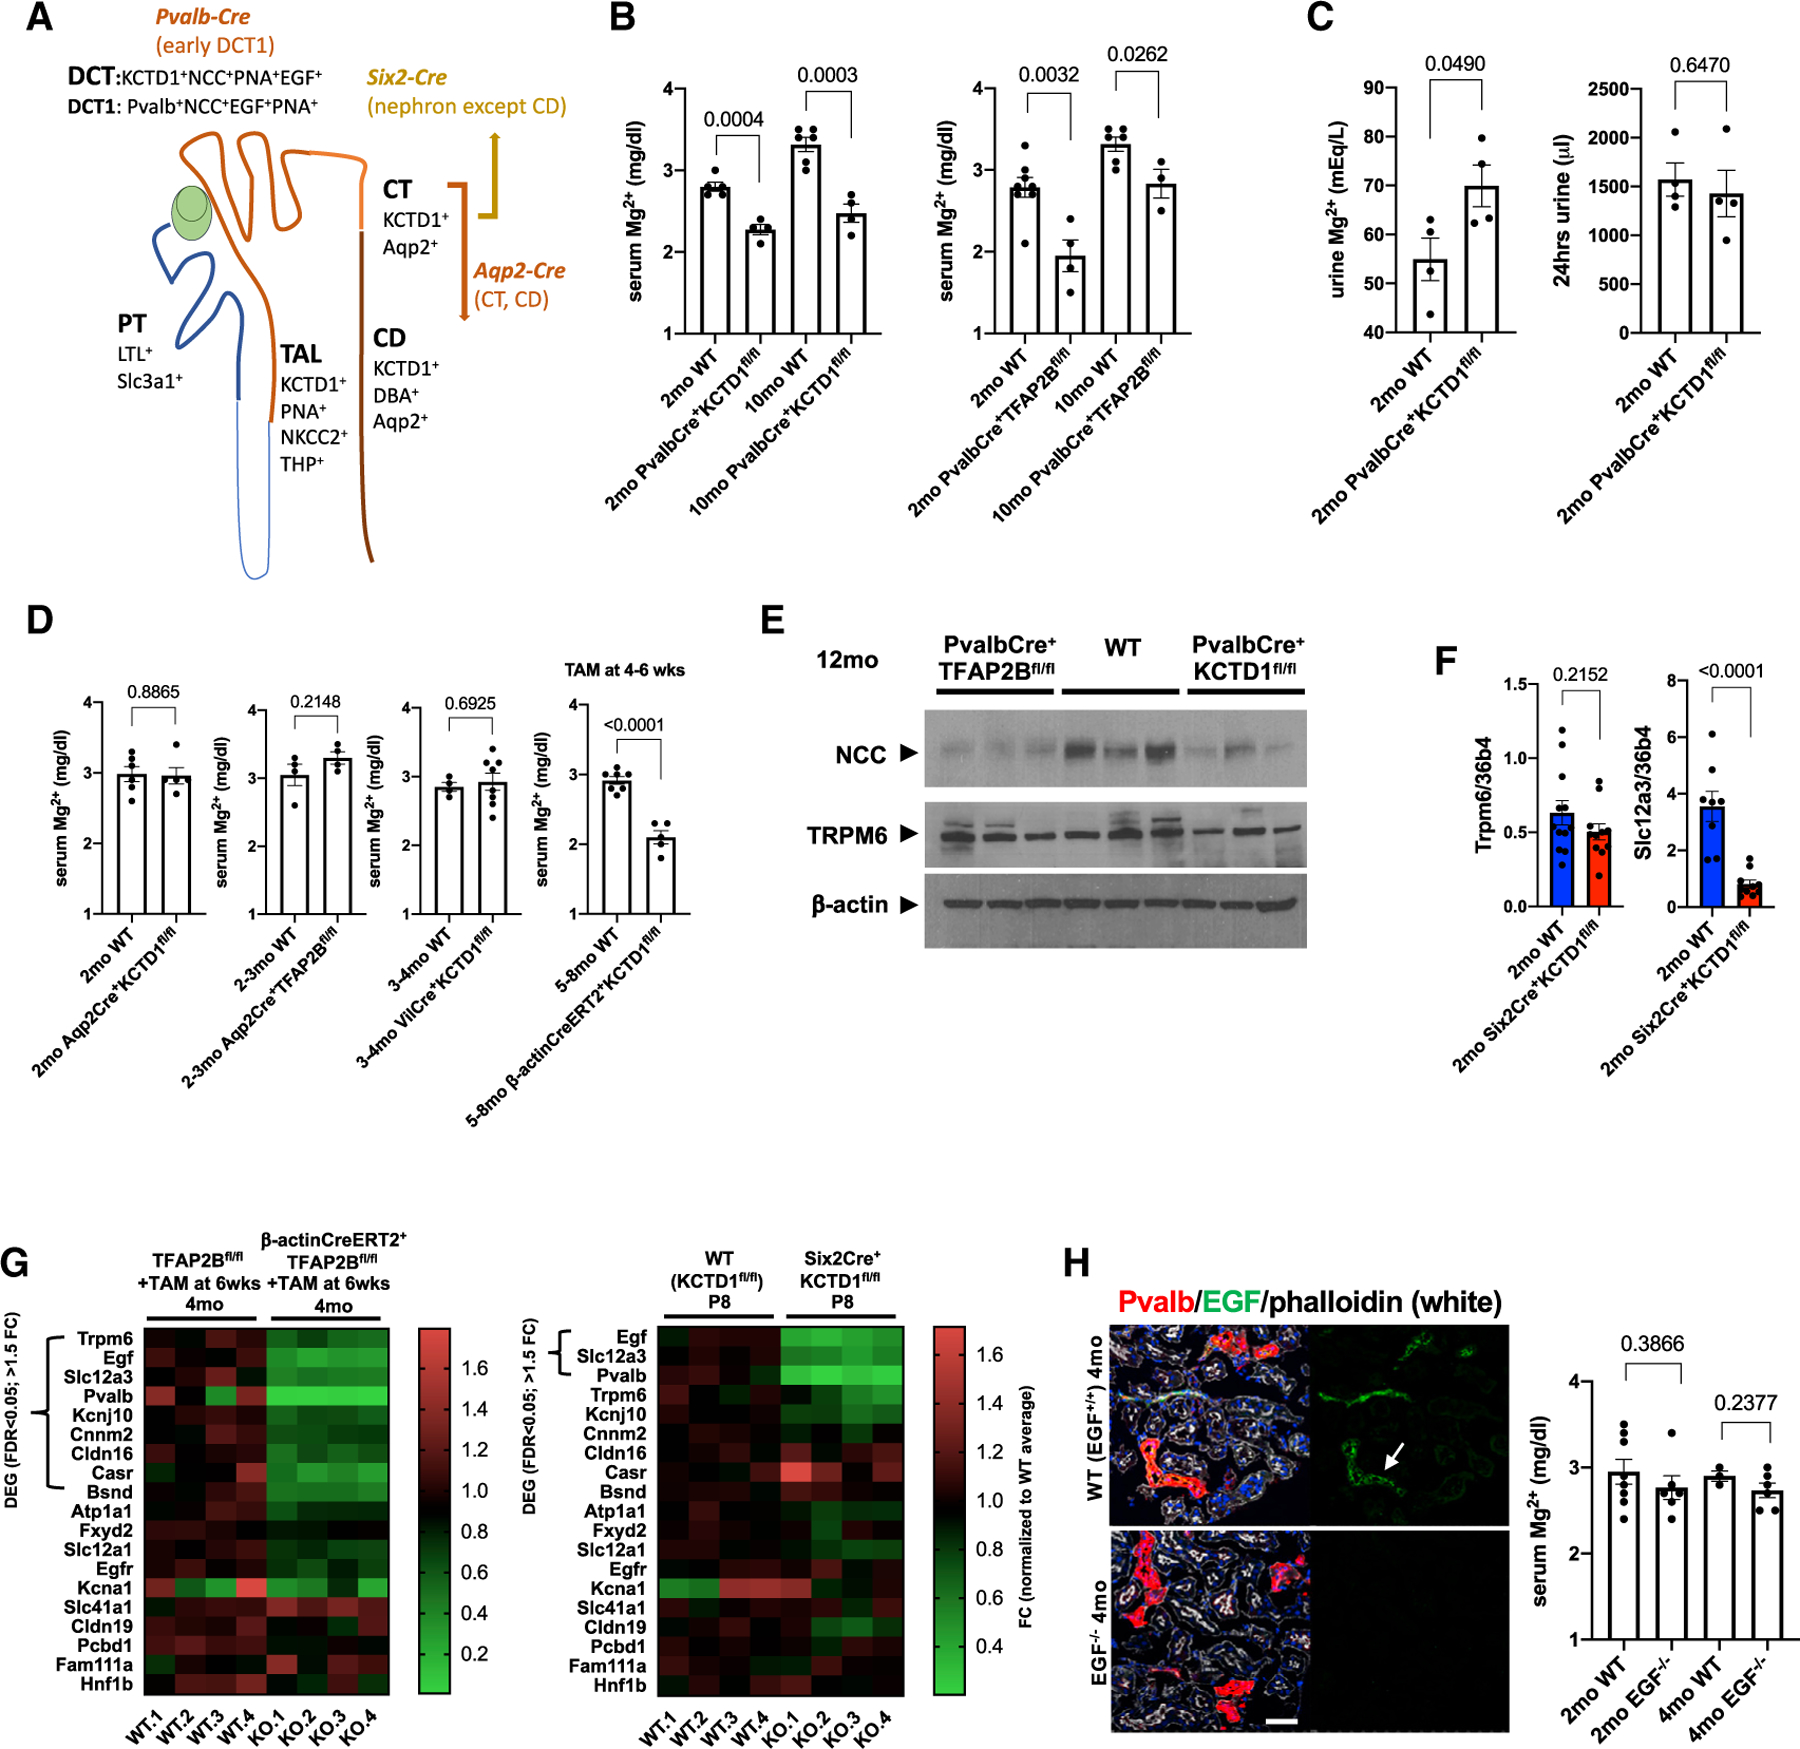
(A) Conditional gene-targeting strategy depicted in the schematic. PvalbCre leads to Cre-mediated recombination of floxed alleles specifically in the DCT1, whereas Aqp2Cre mice target CTs/CDs. Six2Cre mice target the entire nephron, except the CDs. KCTD1 is expressed in the distal nephron (TALs, DCTs, CTs, and CDs). DBA (dolichos biflorus agglutinin) lectin marks CTs/CDs, PNA (peanut agglutinin) lectin marks distal nephron epithelium (discontinuous epithelial staining in TALs, DCTs, and CTs/CDs; continuous labeling of PTs), and LTL (lotus tetragonolobus lectin) marks PTs. Slc3a1 is expressed in PTs, NKCC2 and THP in TALs, NCC in DCTs, Pvalb in DCT1s, and Aqp2 in CTs/CDs. EGF is detected in DCTs and TALs.
(B) Serum Mg2+ levels (in mg/dL) in groups of 2- or 10-month-old PvalbCre+KCTD1fl/fl or PvalbCre+TFAP2Bfl/fl mice and their Cre-negative control littermates (WT).
(C) Urine Mg2+ concentrations (in mEq/L) are increased in 2-month-old PvalbCre+KCTD1fl/fl mice when compared with their controls, despite normal 24-h urine production in the same mice.
(D) Tamoxifen-induced inactivation of KCTD1 at 4–6 weeks of age results in hypomagnesemia when assessed at 5–8 months of age (β-actinCreERT2+KCTD1fl/fl mice + TAM). Inactivation of KCTD1 in intestines (VilCre+KCTD1fl/fl mice) or of KCTD1 or AP-2β in CTs/CDs (Aqp2Cre+KCTD1fl/fl or Aqp2Cre+TFAP2Bfl/fl mice) does not affect serum Mg2+ levels.
(E) Kidneys of adult PvalbCre+KCTD1fl/fl or PvalbCre+TFAP2Bfl/fl mice show reduced protein levels of NCC but not of TRPM6; 12-month-old mice. β-actin as the loading control.
(F) Semiquantitative RT-PCR for Trpm6 and Slc12a3 in whole kidneys of 2-month-old Six2Cre+KCTD1fl/fl mice and their littermate controls.
(G) Heatmaps show expression levels of genes implicated in the regulation of Mg2+ homeostasis in the kidney. RNA-seq data from kidneys of mice with induced inactivation of AP-2β in the adult (4-month-old β-actinCreERT2+TFAP2Bfl/fl mice treated with TAM at 6 weeks of age) and their Cre controls (left) or from kidneys of P8 Six2Cre+KCTD1fl/fl mice and their Cre control littermates (Marneros, 2020). Differentially expressed genes (DEGs) (>1.5-fold change [FC] in expression; false discovery rate [FDR] < 0.05) are indicated. In both mutant groups, the DCT-expressed genes EGF, Slc12a3, and Pvalb are significantly downregulated. Scale shows FC normalized to the control group average.
(H) EGF (arrow) is detected in Pvalb+ DCT1s at the apical cell membrane (EGF in green, Pvalb in red). No EGF is detected in kidneys of EGF−/− mice. Scale bar, 50 µm. DAPI stains nuclei blue. Mg2+ serum levels are not significantly reduced in EGF−/− mice compared with their WT littermates at 2 or 4 months of age. Graphs represent data as means ± SEM. Semiquantitative RT-PCRs performed in triplicate. p values are shown (two-tailed, unpaired t test). Related to Figure S1.
Role of EGF for Urinary Mg2+ Reabsorption
EGF expression occurs in TALs and DCTs with the induction of their terminal differentiation (after P3) (Marneros, 2020). Immunolabeling shows mainly an apical membrane localization of EGF in TALs and DCTs (Figure 1H) (Marneros, 2020). Adult Six2Cre+KCTD1fl/fl or KCTD1−/− mice show a complete absence of EGF protein in their TALs and DCTs (Figure 1H) (Marneros, 2020). However, lack of EGF in DCTs due to KCTD1 deficiency is only a marker of the terminal differentiation defect and is not responsible for the functional and morphological DCT abnormalities that occur due to lack of KCTD1 because EGF−/− mice did not develop those DCT abnormalities when examined at 6 weeks of age when KCTD1−/− mice had already developed morphological DCT abnormalities (Marneros, 2020). Even at 4 months old, DCT1s had a normal morphological appearance in EGF−/− mice (Figure 1H). To test the physiological relevance of EGF for the ability of DCTs to reabsorb urinary Mg2+, it was assessed whether EGF−/− mice develop hypomagnesemia. Serum Mg2+ levels in 2- or 4-month-old EGF−/− mice were not significantly reduced (Figure 1H). This demonstrates that if EGF participates in the regulation of Mg2+ transport in DCTs, it does not have a major rate-limiting role. Thus, hypomagnesemia that occurs because of the lack of KCTD1 in DCT1s is associated with reduced levels of NCC and occurs largely independently of EGF regulation.
Lack of KCTD1 Impairs TAL/DCT Function
Consistent with single-cell RNA-seq data showing that KCTD1 is expressed in the kidney, specifically in the distal nephron epithelium (Lindström et al., 2018; Park et al., 2018; Ransick et al., 2019), strong reporter gene expression (β-galactosidase) was observed in KCTD1 reporter mice only in the distal nephron epithelium, including the TALs (NKCC2 serves as a specific marker for TALs) (Figure 2A) and DCTs, whereas no KCTD1 expression was observed in glomeruli, PTs, or stromal cells of the kidney (Figure 1A) (Marneros, 2020). Immunolabeling for the TAL markers NKCC2 or THP (Tamm-Horsfall protein) demonstrated that TALs lacking KCTD1 showed a progressive age-dependent dilatation associated with irregular and discontinuous NKCC2 labeling (Figures 2B and 2C).
Figure 2. Lack of KCTD1 Leads to Progressive TAL Defects.
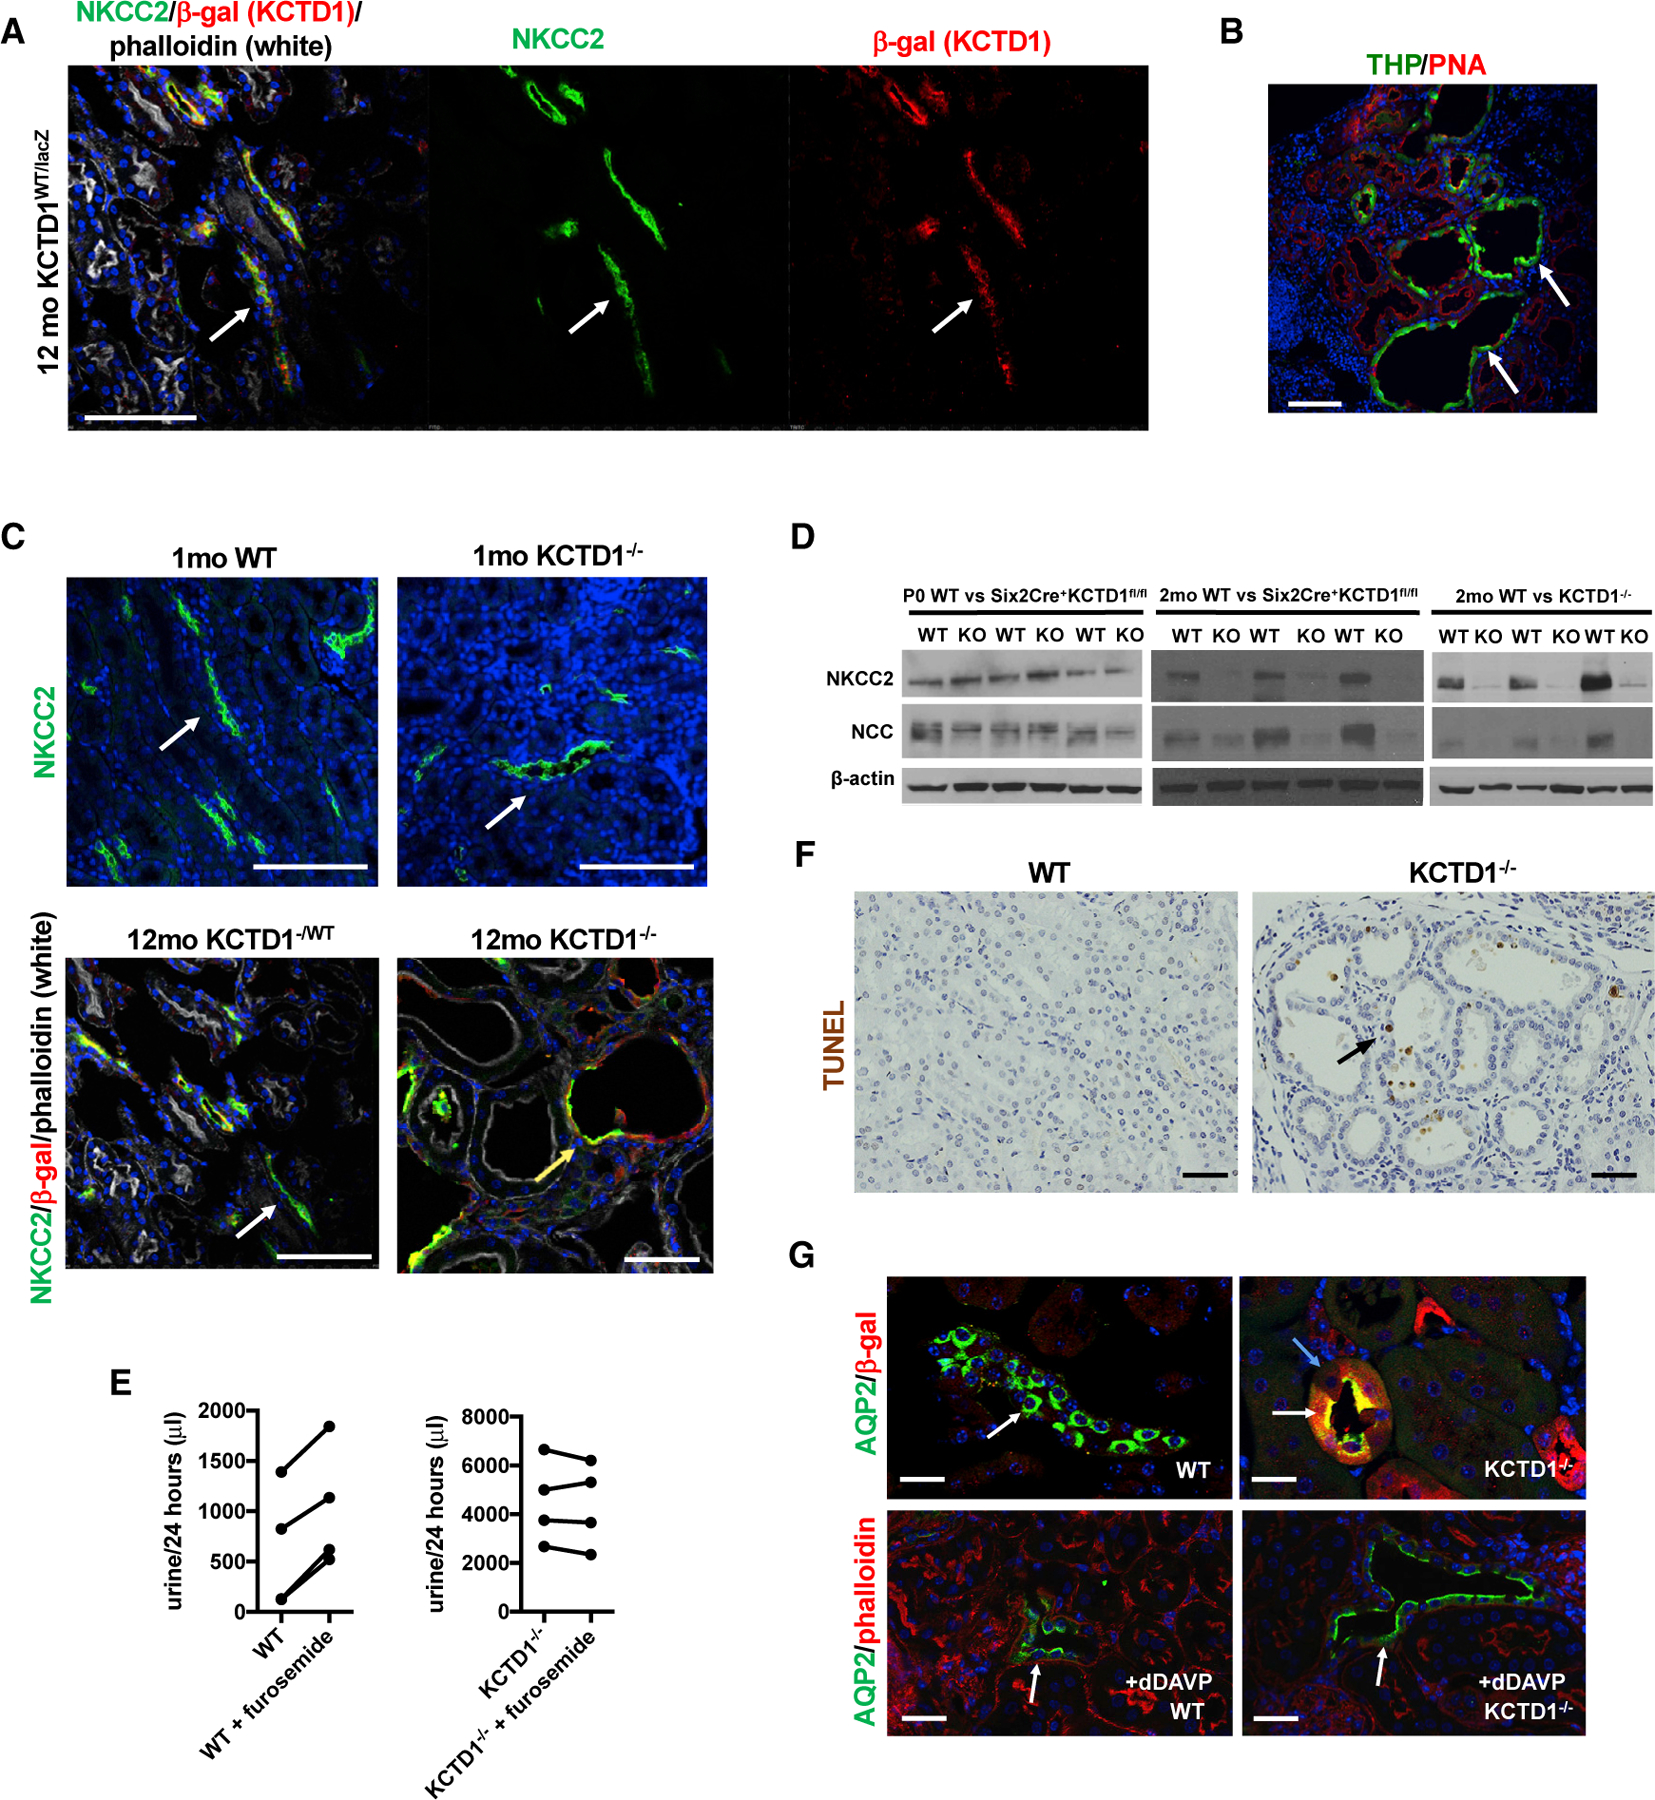
(A) KCTD1 is expressed in TALs (arrows): b-galactosidase (red) in KCTD1WT/lacZ mice is observed in NKCC2+ TALs (green); 12-month-old KCTD1WT/lacZ mouse. Scale bar, 50 µm.
(B) THP (green, arrows) marks TALs, which are dilated in aged KCTD1−/− mice (8-month-old). Scale bar, 50 µm.
(C) Top: mild dilatation of NKCC2+ TALs (green, white arrows) is observed in 1-month-old KCTD1−/− mice. Scale bars, 100 µm. Bottom: 12-month-old KCTD1−/− mice, expressing b-galactosidase (red) from the endogenous KCTD1 locus, show extensive TAL dilatations with discontinuous and irregular expression of NKCC2 (green; yellow arrow); 12-month-old KCTD1−/WT mice show normal NKCC2 labeling in normal-appearing β-gal+ TALs (white arrow). Scale bars, 50 µm.
(D) Western blot with kidney lysates for NKCC2 and NCC. Kidneys of Six2Cre+KCTD1fl/fl mice at birth (P0) show no major reduction in NKCC2 and NCC protein levels. In contrast, 2-month-old Six2Cre+KCTD1fl/fl or KCTD1−/− mice show a strong decrease in NKCC2 and NCC protein levels compared with their control littermates. β-actin as loading control.
(E) WT mice increase their 24-h urine production when treated with the NKCC2 inhibitor furosemide. Diminished levels of NKCC2 in KCTD1−/− mice correlate with a lack of a response to furosemide; 2-month-old mice (n = 4).
(F) Few apoptotic cells (TUNEL+, arrow) in dilated distal nephron tubules in 9-month-old KCTD1−/− mice are being extruded into their lumina. No apoptotic cells in 9-month-old WT littermates. Scale bar, 50 µm.
(G) AQP2 is localized at the apical luminal membrane in β-gal+-expressing CTs/CDs of KCTD1−/− mice even without administration of desmopressin (dDAVP; with similar effects like vasopressin in CTs/CDs), whereas AQP2 is localized in the cytoplasm in WT littermates without dDAVP administration and becomes only apically localized when treated with dDAVP; 4-month-old mice are shown. Scale bars, 20 µm. DAPI stains nuclei blue.
Kidneys of newborn Six2Cre+KCTD1fl/fl mice (P0) showed no major reduction in NKCC2 and NCC protein levels (Figure 2D), demonstrating that lack of KCTD1 does not prevent the formation of TALs and DCTs during nephrogenesis. However, the increase in NKCC2 and NCC levels that can normally be observed in wild-type (WT) mice with their postnatal terminal differentiation was not seen in mice lacking KCTD1 (Figure 2D). Thus, KCTD1 is required for high-level expression of NKCC2 and NCC in the adult TALs and DCTs, respectively. Treatment of WT mice with the NKCC2 inhibitor and loop diuretic furosemide leads to reduced salt reabsorption in TALs and causes increased urine production, whereas it could not further increase the already-much-increased urine output in KCTD1−/− mice (Figure 2E), consistent with a lack of NKCC2 function.
The observation of reduced and irregular NKCC2 immunolabeling in dilated TALs of adult KCTD1−/− mice suggests that the low levels of NKCC2 protein in whole-kidney lysates of these mice are likely explained by a TAL terminal-differentiation defect and not by postnatal degeneration of TAL segments. This is also supported by the lack of significant apoptosis in the distal nephron epithelia even in aged KCTD1−/− kidneys (Figure 2F). Only shedding of few apoptotic cells into the tubular lumen of distal nephron epithelia was observed but no frank apoptotic degeneration of nephron segments (Figure 2F). PTs and glomeruli, which do not express KCTD1 (β-galactosidase in KCTD1−/− mice), had a normal morphological appearance in young adult KCTD1−/− mice that only showed dilatation in distal nephron segments that normally express KCTD1 (β-galactosidase+) (Marneros, 2020). Moreover, no abnormalities were observed in the CDs of KCTD1−/− mice. This is consistent with the observation that inactivation of KCTD1 in principle cells of CTs/CDs (which are the cell types that express KCTD1 in these segments) did not result in renal abnormalities (Aqp2Cre+KCTD1fl/fl mice) (Figure S1A).
The increased urinary water loss owing to the TAL/DCT defects in mice lacking KCTD1 evoked counterregulatory mechanisms in the CTs/CDs to reduce polyuria. Normally, vasopressin is released in response to water loss, which induces membrane trafficking of the water channel AQP2 from intracytoplasmic endosomes to the luminal epithelial membranes of CTs/CDs to stimulate transepithelial water transport as a counterregulatory mechanism to prevent excessive urinary water loss. KCTD1 deficiency did not prevent that function of CDs, and AQP2 was found in mice lacking KCTD1 at the luminal membrane in the CTs/CDs, whereas it was mostly cytoplasmic in control littermates (Figure 2G). Although the luminal membrane localization of AQP2 suggests that this counterregulatory mechanism is active in the CDs of KCTD1−/− mice, it is not sufficient to prevent the polyuria that develops because of the TAL/DCT abnormalities. Collectively, these findings demonstrate that the lack of KCTD1 impairs TAL/DCT function and leads to a reduced ability of the kidney to concentrate urine.
KCTD1 Deficiency Causes Decreased Urinary Ca2+ Reabsorption That Leads to Hypocalcemia
Because TALs have important functions for both urinary Ca2+ and Mg2+ reabsorption, which are dependent on proper NKCC2 activity to maintain a lumen-positive electrical gradient that drives paracellular Ca2+ and Mg2+ reabsorption in the TAL, it was investigated whether TAL defects in mice lacking KCTD1 also impaired urinary Ca2+ reabsorption. Indeed, both KCTD1−/− and Six2Cre+KCTD1fl/fl mice developed severe progressive urinary Ca2+ loss: calcium mass in 24-h urine collections was increased already in young adult KCTD1−/− and Six2Cre+KCTD1fl/fl mice and further increased with age (Figure 3A). Inducible inactivation of KCTD1 in the adult leads to increased urinary Ca2+ loss as well (Figure 3A). Thus, diminished levels of NKCC2 from KCTD1 deficiency are associated with significant hypercalciuria, similar to that observed in mice and humans that have NKCC2 mutations (Kemter et al., 2010; Simon et al., 1996a). Urinary Ca2+ loss in KCTD1−/− and Six2Cre+KCTD1fl/fl mice was accompanied by chronic hypocalcemia with reduced levels of ionized calcium (Ca2+) serum levels (Figure 3B). In contrast, lack of KCTD1 in CTs/CDs (in Aqp2Cre+KCTD1fl/fl mice), in DCT1s (in PvalbCre+KCTD1fl/fl mice), or in the intestinal tract (in VilCre+KCTD1fl/fl mice) did not result in urinary Ca2+ loss (Figure 3A). Because (1) KCTD1 is not expressed in glomeruli and PTs and because (2) conditional inactivation of KCTD1 specifically in DCT1s, CTs, and CDs does not result in urinary Ca2+ wasting, and whereas (3) even young adult Six2Cre+KCTD1fl/fl mice that show no morphological abnormalities of the PTs or glomeruli at that age develop hypercalciuria, a primary defect in DCT2s and/or TALs of these mice is most likely responsible for the observed reabsorption defect of filtered Ca2+ in their kidney.
Figure 3. KCTD1 Deficiency Leads to Urinary Ca2+ Wasting, Hypocalcemia, and Chronic Secondary Hyperparathyroidism.
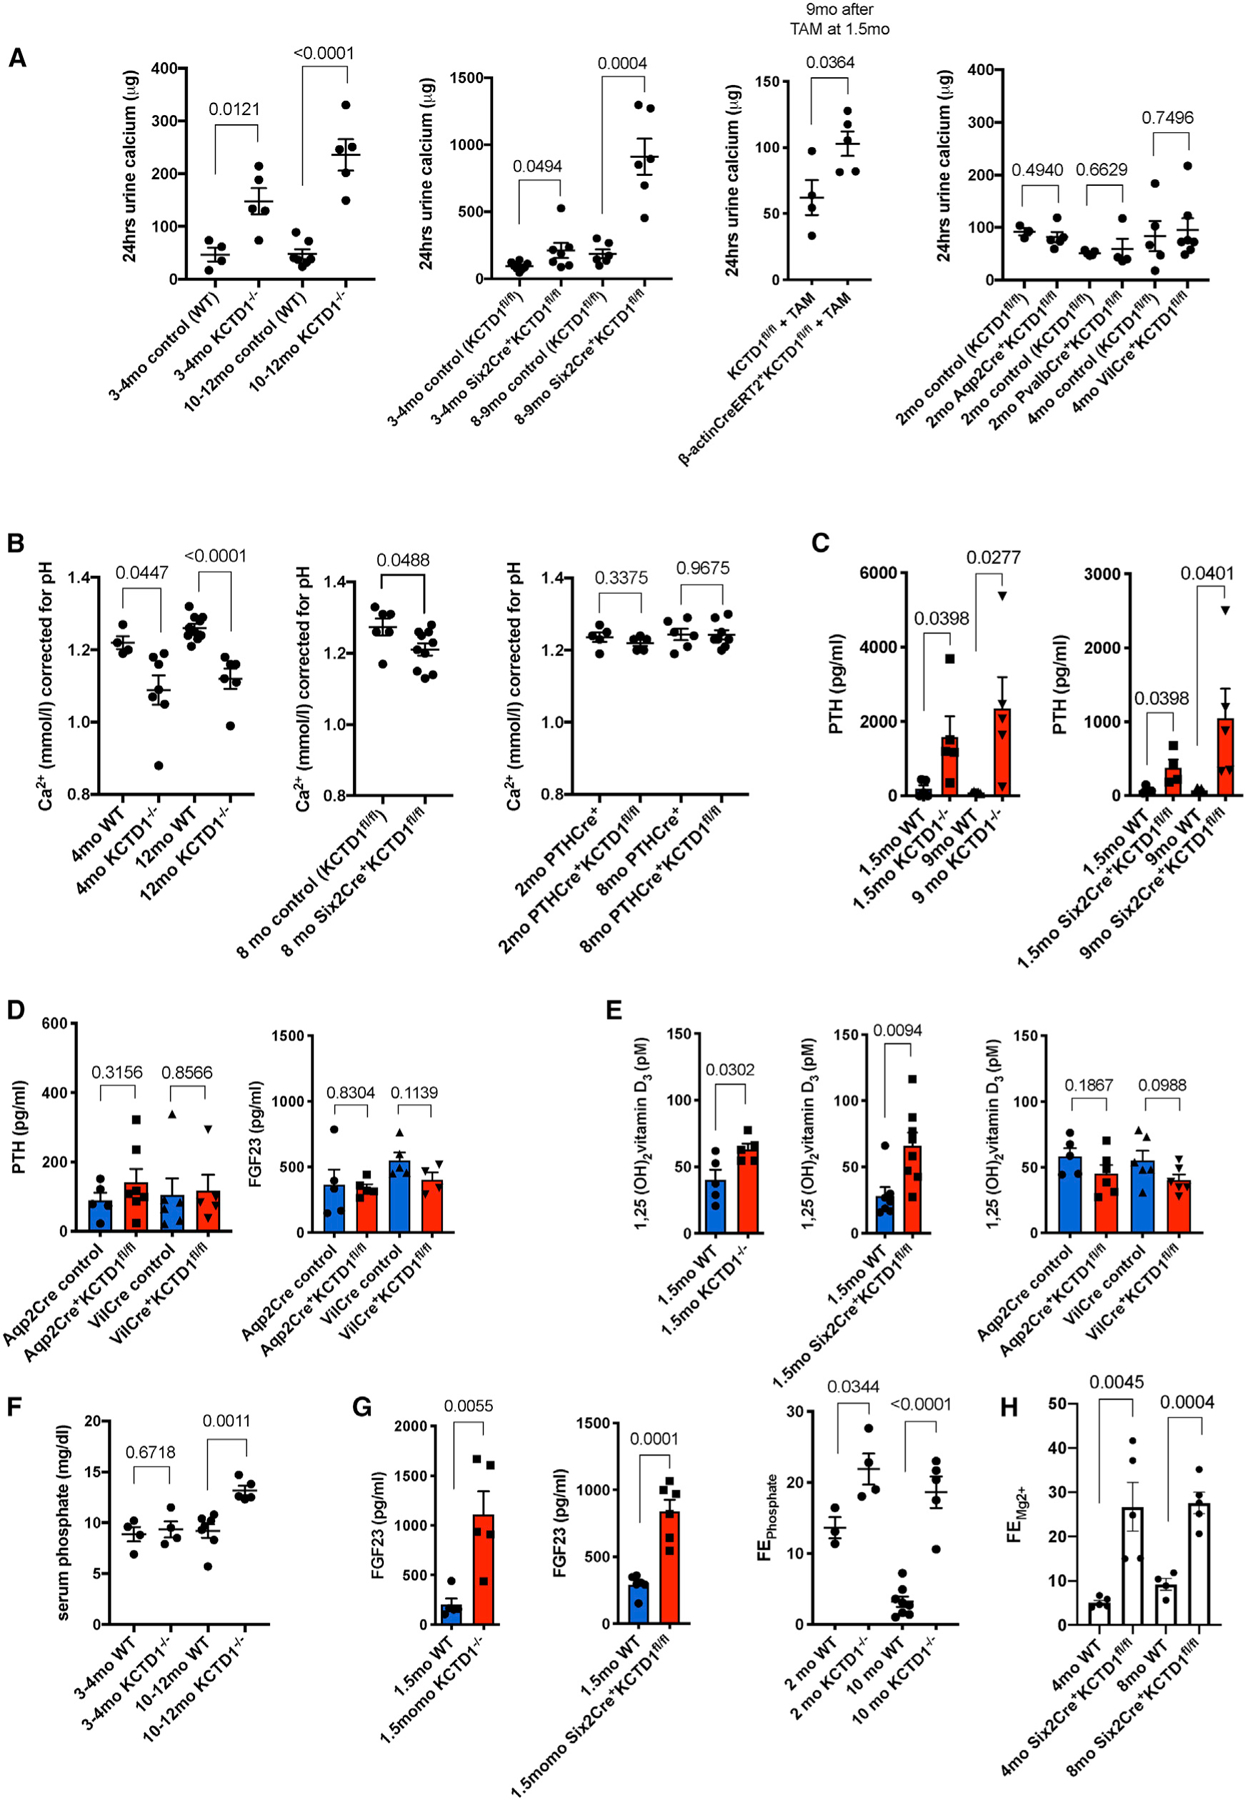
(A) 24-h urine collections demonstrate that KCTD1−/− and Six2Cre+KCTD1fl/fl mice have significantly increased urinary calcium loss compared with their littermate controls. This urinary calcium wasting increases with deterioration of kidney function with progressive age. Inducible inactivation of KCTD1 in the adult at 6-weeks of age also results in urinary calcium wasting. In contrast, lack of KCTD1 in principle cells of the CTs/CDs (Aqp2Cre+KCTD1fl/fl mice), in DCT1s (PvalbCre+KCTD1fl/fl mice), or in the intestines (VilCre+KCTD1fl/fl mice) does not affect urinary calcium reabsorption. 24-h urine calcium mass in micrograms is indicated.
(B) Free ionized serum calcium (Ca2+) corrected for pH is decreased in both 4-month-old adult and 12-month-old aged KCTD1−/− mice when compared with littermate controls. Aged Six2Cre+KCTD1fl/fl mice (8-month-old mice) also show a decrease in serum Ca2+ levels. In contrast, PTHCre+KCTD1fl/fl mice have normal serum Ca2+ levels. Ca2+ in micromoles per liter.
(C) Serum active PTH levels are already highly increased in 1.5-month-old KCTD1−/− and Six2Cre+KCTD1fl/fl mice and are further increased in 9-month-old mutants. PTH concentration in picograms per milliliter.
(D) Aqp2Cre+KCTD1fl/fl or VilCre+KCTD1fl/fl mice have normal PTH and FGF23 serum levels. 3–4-month-old mice. PTH and FGF23 concentrations in picograms per milliliter.
(E) Serum levels of 1,25(OH)2 vitamin D3 are moderately increased in 1.5-month-old KCTD1−/− and Six2Cre+KCTD1fl/fl mice compared with their littermate controls, whereas no increase is observed in 3–4-month-old Aqp2Cre+KCTD1fl/fl or VilCre+KCTD1fl/fl mice. Concentrations in picomolar.
(F) An increase in serum phosphate levels is detected only in aged (10–12-month-old) but not in young (3–4-month-old) KCTD1−/− mice. Shown in milligrams per deciliter.
(G) FGF23 serum levels (in pg/mL) are highly increased in 1.5-month-old KCTD1−/− and Six2Cre+KCTD1fl/fl mice compared with their littermates. This correlates with increased fractional excretion of phosphate (FEPhosphate) in both 2- and 10-month-old KCTD1−/− mice.
(H) Increased fractional excretion of Mg2+ (FEMg2+) in both 4- and 8-month-old Six2Cre+KCTD1fl/fl mice. Graphs represent data as means ± SEM. p values are shown (two-tailed, unpaired t test). Related to Figure S2.
KCTD1 is not only expressed in the distal nephron epithelium but also in parathyroid glands (PTGs), organs that regulate serum calcium levels via secretion of parathyroid hormone (PTH) (Figure S2A). To ensure that the observed hypocalcemia in Six2Cre+KCTD1fl/fl mice is explained by the lack of KCTD1 in the kidney and not through potential inactivation of KCTD1 in PTGs through unexpected Six2Cre+ activity in PTGs, it was confirmed that the Six2Cre+ strain targeted floxed alleles in the nephron (except the CDs) but not in PTGs by crossing Six2Cre+ mice with an EYFP-reporter strain (Figure S2B). In addition, inactivation of KCTD1 in PTGs in PTHCre+KCTD1fl/fl mice did not affect ionized Ca2+ serum levels (Figures 3B and S2C) (Kobayashi et al., 2008; Libutti et al., 2003). Thus, the sustained hypocalcemia in KCTD1−/− and Six2Cre+KCTD1fl/fl mice is explained by the lack of KCTD1 in their kidneys and not their PTGs.
Secondary Hyperparathyroidism due to Hypocalcemia in KCTD1−/− Mice
Hypocalcemia stimulates PTGs to secret PTH to counter low serum calcium levels by several mechanisms: it reduces urinary Ca2+ excretion in the kidney, it induces 1,25(OH)2 vitamin D3 production in the kidney to increase dietary calcium absorption in the gastrointestinal tract, it enhances fractional excretion of phosphate, and it targets the bone to increase efflux of calcium and phosphate (Quarles, 2008). Indeed, the sustained urinary Ca2+ loss and the hypocalcemia in mice lacking KCTD1 were associated with secondary hyperparathyroidism: KCTD1−/− mice and Six2Cre+KCTD1fl/fl mice showed a strong increase in serum PTH levels when examined at 1.5 or 9 months of age (Figure 3C). However, the secondary hyperparathyroidism in KCTD1−/− mice and Six2Cre+KCTD1fl/fl mice was not sufficient to compensate for the low serum calcium that occurred due to a substantial urinary Ca2+ loss in those mice. In contrast, PTH serum levels were normal in Aqp2Cre+KCTD1fl/fl or VilCre+KCTD1fl/fl mice that had no increased urinary Ca2+ loss (Figure 3D). The reduced serum Ca2+ levels and the increased PTH in KCTD1−/− and Six2Cre+KCTD1fl/fl mice were associated with an increase in 1,25(OH)2 vitamin D3 serum levels (Figure 3E).
High PTH serum levels are often found early in the disease course of chronic kidney disease (CKD), whereas increased phosphate serum levels are often seen in late-stage CKD (Martin and González, 2007). Resembling these observations in human CKD, increases in serum PTH occurred early in KCTD1−/− and Six2Cre+KCTD1fl/fl mice, whereas serum phosphate levels were increased only late in the disease course in aged, but not in young, KCTD1-deficient mice (Figure 3F).
The phosphaturic hormone FGF23 is increased early in the disease course in CKD and produced by bone to counter increased serum phosphate levels by stimulating fractional excretion of phosphate and inhibiting 1α-hydroxylase activity in the kidney (Quarles, 2008). Mice lacking KCTD1 also had highly increased FGF23 serum levels and increased fractional phosphate excretion already at a young age (Figure 3G). That high increase in FGF23 already in young mice lacking KCTD1 is likely also explained in part by impaired renal function with increased blood urea nitrogen (BUN), which was already observed at that age (Figure S1A). In contrast, Aqp2Cre+KCTD1fl/fl and VilCre+KCTD1fl/fl mice, which had normal urinary Ca2+ and serum PTH levels, also had normal FGF23 serum levels (Figure 3D). Notably, the hypercalciuria in mice lacking KCTD1 in the kidney was accompanied by increased fractional excretion of Mg2+ in those mice (Figure 3H).
TAL Defects in Mice Lacking KCTD1 Impair Paracellular Ca2+ and Mg2+ Reabsorption due to Diminished NKCC2 and Claudin-16/-19 and Increased Claudin-14 Expression
A significant portion of filtered Mg2+ and Ca2+ is transported back into the circulation via a paracellular pathway in the TALs. Thus, urinary Mg2+ wasting as a consequence of KCTD1 deficiency in the kidney likely occurs not only due to impaired transcellular Mg2+ transport in DCT1s but also as a consequence of reduced paracellular transport in partly dysfunctional TALs. In contrast, the observations in the various conditional mutant mice with inactivation of KCTD1 in distinct nephron segments combined with the distal nephron-specific expression pattern of KCTD1 suggest that the impaired urinary Ca2+ reabsorption in KCTD1 mutant mice occurs because of defects in DCT2s and/or TALs because inactivation of KCTD1 in DCT1s or CTs/CDs did not affect urinary Ca2+ levels. To further test whether functional defects in DCTs or TALs explain the urinary Ca2+ wasting in KCTD1 mutant mice and to gain insights into the pathomechanisms involved, it was assessed how KCTD1 deficiency affects the expression of DCT- and TAL-specific genes that have key roles in Ca2+ transport processes in these segments.
The K+ channel ROMK in the TAL ensures adequate luminal K+ levels for continuous Na+-K+-2Cl− uptake by NKCC2 and generates a lumen-positive electrical gradient that drives paracellular Ca2+ and Mg2+ reabsorption in the TAL (Mount, 2014). The Na+-K+ ATPase is critical for Na+ exit at the basolateral membrane and generates a Na+ gradient that drives apical Na+, K+, and Cl− entry into TAL cells via NKCC2. ATP1A1 (the α1 subunit of the Na+-K+ ATPase) is broadly expressed in the nephron but shows the highest expression levels in TALs/DCTs/CTs (Ransick et al., 2019). PTH/PTH1R signaling stimulates urinary Ca2+ reabsorption in the TAL indirectly by promoting NKCC2-mediated salt reabsorption and directly by suppressing the expression of claudin-14 that inhibits Ca2+ reabsorption in the TAL (Sato et al., 2017). PTH1R is also expressed in podocytes and PTs (Ransick et al., 2019). Claudins-16 and -19 are critical for the cation selectivity of TAL tight junctions and promote Ca2+ and Mg2+ paracellular reabsorption in the TAL, whereas claudin-14 has the opposite effect. The predominant expression of claudin-16 and claudin-14 in the nephron occurs in TALs (Ransick et al., 2019).
Semiquantitative RT-PCR of kidneys of 2-month-old KCTD1−/− and Six2Cre+KCTD1fl/fl mice (compared with their control littermates) showed that the increased urinary Ca2+ and Mg2+ loss in those mutant mice was associated with strongly reduced renal expression of NKCC2, ATP1A1, PTH1R, claudin-16, and claudin-19 but increased expression of claudin-14 (Figure 4A). The diminished NKCC2 transcript levels are also consistent with the observation of reduced NKCC2 protein levels in kidneys of KCTD1−/− and Six2Cre+KCTD1fl/fl mice (Figure 2D) (Marneros, 2020). The increase in expression of claudin-14 demonstrates that the observed expression changes are not due to a complete dedifferentiation of TALs and that, despite KCTD1 deficiency, TALs maintain, at least in part, the ability to increase expression of TAL genes (such as claudin-14). Similarly, expression of the distal nephron basolateral chloride channel CLCNKB was also increased in the kidneys of mice lacking KCTD1 (Figure 4B). Overall, these findings suggest that reduced paracellular reabsorption of filtered Ca2+ and Mg2+ in the TAL occurs because of reduced NKCC2/ATP1A1/PTH1R/claudin-16/19 and increased claudin-14 expression (Figure 4A).
Figure 4. Diminished Expression of NKCC2/ATP1a1/PTH1R/Claudin-16/-19 and Increased Expression of Claudin-14 Are Associated with the Urinary Ca2+ Reabsorption Defect in TALs Lacking KCTD1.
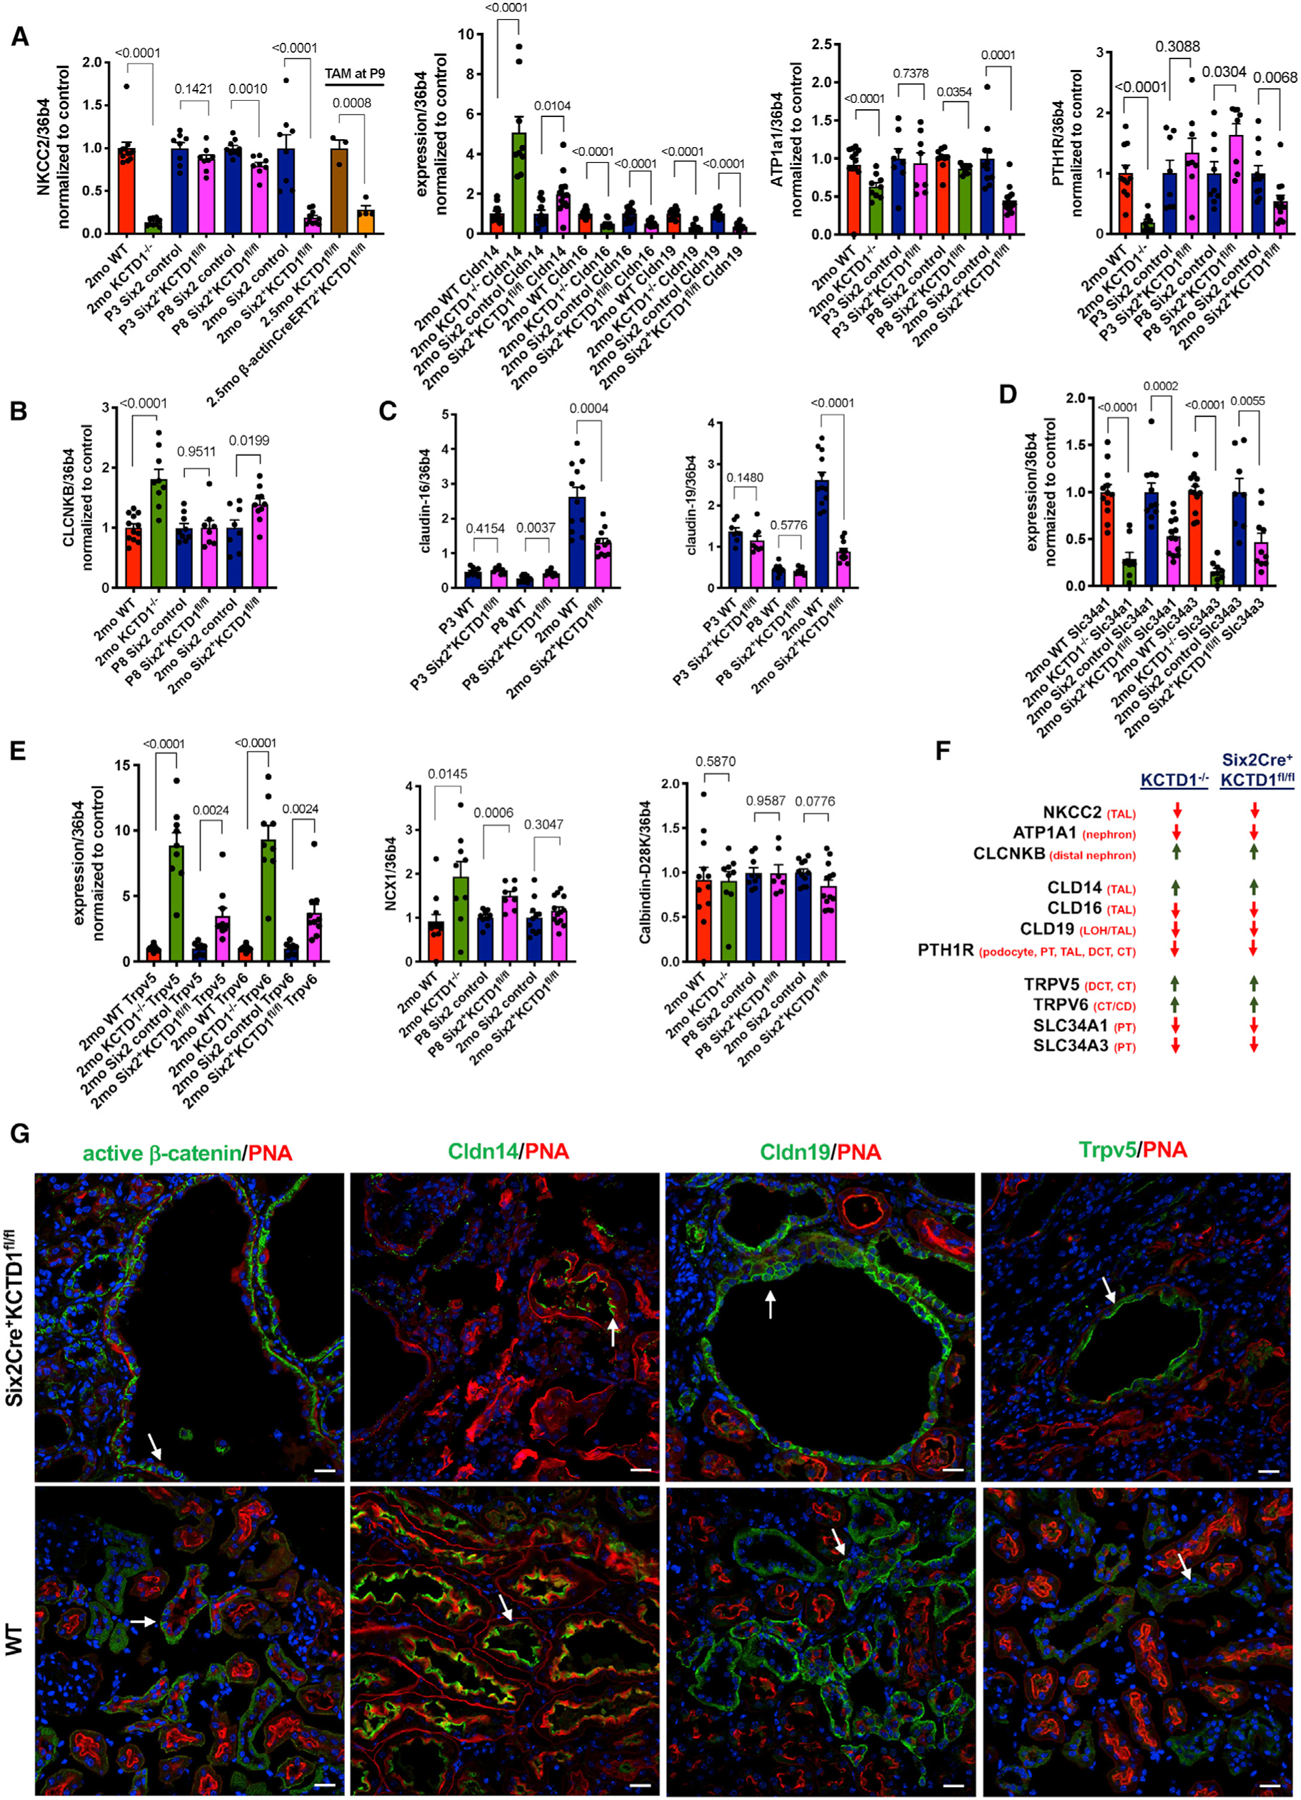
(A) Semiquantitative RT-PCR in kidneys of 2-month-old KCTD1−/− and Six2Cre+KCTD1fl/fl mice shows a significant decrease in NKCC2 (encoded by Slc12a1) transcripts compared with their littermate controls. P3 Six2Cre+KCTD1fl/fl mice show normal NKCC2 levels, and P8 Six2Cre+KCTD1fl/fl mice show a modest reduction in NKCC2 expression. Inducible inactivation of KCTD1 with TAM at P9 in b-actinCreERT2+KCTD1fl/fl mice results in strong reduction of NKCC2 expression in the kidney. Claudin-16 and claudin-19 expression is strongly reduced in kidneys of 2-month-old KCTD1−/− and Six2Cre+KCTD1fl/fl mice, whereas claudin-14 expression is increased. Expression of ATP1a1 or PTH1R is decreased in kidneys of 2-month-old KCTD1−/− and Six2Cre+KCTD1fl/fl mice but not at P3 before nephron maturation. Values normalized to their controls.
(B) The expression of CLC-NKB is increased in kidneys of 2-month-old KCTD1−/− and Six2Cre+KCTD1fl/fl mice. This is not observed before the manifestation of the distal nephron maturation defect (normal at P8). Values are normalized to their controls.
(C) Total expression levels of claudin-16 and claudin-19 in kidneys of P3, P8, and 2-month-old Six2Cre+KCTD1fl/fl mice and their littermate controls.
(D) Semiquantitative RT-PCR analysis in kidneys of 2-month-old KCTD1−/− and Six2Cre+KCTD1fl/fl mice shows a significant decrease in Slc34a1 and Slc34a3 transcripts. Values normalized to their controls.
(E) Semiquantitative RT-PCR analysis in kidneys of 2-month-old KCTD1−/− and Six2Cre+KCTD1fl/fl mice shows a significantly increased expression of the Ca2+ channels TRPV5 and TRPV6. NCX1 and calbindin-D28K expression is not reduced in kidneys lacking KCTD1. Values normalized to their controls.
(F) Summary of expression changes of key regulators of urinary Ca2+ reabsorption shows similar results when comparing kidneys of 2-month-old KCTD1−/− and Six2Cre+KCTD1fl/fl mice.
(G) Immunolabeling of kidneys from 6-month-old Six2Cre+KCTD1fl/fl mice and their WT controls for active β-catenin, claudin-14, claudin-19, and TRPV5 shows localization of these proteins in dilated distal tubules of Six2Cre+KCTD1fl/fl mice. DAPI stains nuclei blue. Scale bars, 20 µm Graphs represent data as means ± SEM. Semiquantitative RT-PCRs performed in triplicate with n > 6 samples/group. p values are shown (two-tailed, unpaired t test).
Assessing the expression of claudin-16 and -19 in Six2Cre+KCTD1fl/fl mice at different time points postnatally shows that the reduction in expression of those claudins occurs only after the time when normal nephron terminal differentiation takes place (which is mainly in the first 2 weeks after birth): low-level expression of claudin-16 and -19, with no reduction compared with WT littermates, was detected at postnatal days 3 (P3) or 8 (P8) in kidneys of Six2Cre+KCTD1fl/fl mice (during the early terminal differentiation phase), whereas 2-month-old Six2Cre+KCTD1fl/fl mice showed strongly decreased renal expression of claudin-16 and -19 (Figure 4C). These findings suggest that the diminished urinary Ca2+ and Mg2+ reabsorption in the TALs of mice lacking KCTD1 is a consequence of a progressive TAL defect.
The renal sodium phosphate co-transporters Npt2a (encoded by Slc34a1) and Npt2c (encoded by Slc34a3) in the apical brush border membrane of PTs are essential regulators of reabsorption of filtered phosphate (Blaine et al., 2015). PTH and FGF23 lead to an acute translocation of those phosphate co-transporters from the apical brush border membrane of PTs into the cytosol and thereby reduce reabsorption of filtered phosphate (Quarles, 2008). FGF23 reduces both the expression and the activity of those sodium phosphate co-transporters. Consistent with the increase in FGF23 in KCTD1−/− and Six2Cre+KCTD1fl/fl mice, expression of Slc34a1 and Slc34a3 was strongly reduced in the kidneys of these mice (Figure 4D).
Immunolabeling confirmed that dilated distal nephron tubules in adult Six2Cre+KCTD1fl/fl mice showed strong staining for active β-catenin, particularly at the basal side of the epithelial cells, and for claudin-14 apically (consistent with its tight junction localization) (Figure 4G). Dilated TALs also showed immunolabeling for claudin-19 in these mice (Figure 4G).
Increased Expression of Ca2+ Transporters of DCT2s/CTs in KCTD1-Deficient Mice
Next, changes in expression of key genes involved in the regulation of transcellular Ca2+ transport in DCT2s were assessed to determine a possible contribution of DCT defects to the overall observed hypocalcemia in mice lacking KCTD1. The DCT2s reabsorb only a relatively small fraction of the filtered Ca2+ (~8%), whereas the TALs reabsorb ~25% of filtered Ca2+ (Blaine et al., 2015). Although urinary Ca2+ reabsorption occurs in TALs via a paracellular mechanism, DCT2s and CTs reabsorb urinary Ca2+ via a transcellular mechanism: apical Ca2+ transport in these nephron segments occurs via the TRPV5 Ca2+ channel (expressed in DCT2s and CTs), then Ca2+ associates with the Ca2+ binding protein calbindin-D28K, which shuttles it to the basolateral surface, where it is extruded by the Ca2+ ATPase and the type 1 sodium calcium exchanger NCX1 (Slc8a1) (Subramanya and Ellison, 2014). TRPV5 activity has been suggested to be the rate-limiting step of reabsorption of filtered Ca2+ in DCT2s/CTs, whose expression is increased by PTH and FGF23 (Andrukhova et al., 2014; Cha et al., 2008; de Groot et al., 2009; van Abel et al., 2005).
Semiquantitative RT-PCR of whole kidneys shows that the Ca2+ transporters TRPV5 and TRPV6, which promote transcellular Ca2+ reabsorption mainly in the DCT2s/CTs, were significantly upregulated in the kidneys of KCTD1−/− and Six2Cre+KCTD1fl/fl mice, likely to counter the impaired urinary Ca2+ reabsorption in the TALs by increasing Ca2+ reabsorption in the DCT2s/CTs (Figure 4E). This increased TRPV5 expression may, to some extent, be due to the increase in PTH and FGF23 serum levels in these mice (Cha et al., 2008; de Groot et al., 2009). Moreover, calbin-din-D28K and NCX1 expression were not reduced in kidneys of KCTD1−/− and Six2Cre+KCTD1fl/fl mice (Figure 4E). Immunolabeling also confirmed increased TRPV5 in dilated tubules in kidneys of Six2Cre+KCTD1fl/fl mice when compared with their WT littermates (Figure 4G). Thus, these findings suggest that urinary Ca2+ loss in those mice is explained mainly by impaired Ca2+ reabsorption in the TALs and not the DCT2s/CTs because key genes involved in Ca2+ transport in the DCT2s/CTs were either increased or unchanged, whereas key genes involved in Ca2+ transport in the TALs were strongly diminished (Figure 4F). Notably, the observation that both KCTD1−/− and Six2Cre+KCTD1fl/fl mice showed similar relative expression changes for these regulators of Ca2+ reabsorption in the kidney demonstrates that these changes are a consequence of the lack of kidney-specific functions of KCTD1 and do not occur because of functions of KCTD1 in other organs (Figure 4F).
KCTD1 Mutants Develop Progressive Metabolic Bone Disease
Chronic secondary hyperparathyroidism can lead to high-turnover metabolic bone disease with the manifestation of osteitis fibrosa and decreased bone mineralization (Moor and Bonny, 2016). Because the sustained hypocalcemia in mice lacking KCTD1 led to chronic secondary hyperparathyroidism, it is likely that these mice would also develop progressive high-turnover metabolic bone disease. Indeed, histologic analyses of long bones (tibia and femur) revealed severe osteitis-fibrosa-like pathologies in aged KCTD1−/− and Six2Cre+KCTD1fl/fl mice but not in their control littermates (Figure 5A). Skeletal imaging by positron emission tomography-computed tomography (PET-CT) also showed delayed calvarial bone formation already in young KCTD1−/− mice (Figure 5B). The high-turnover bone disease from chronic secondary hyperparathyroidism is characterized by increased activity of osteoclasts and osteoblasts and reduced bone mineralization (Moor and Bonny, 2016). Bone histomorphometric analysis of femurs of 6-week-old, male KCTD1−/− mice that had increased PTH serum levels showed evidence for high-turnover bone disease already at that young age: those mice had increased osteoclast activity with higher eroded surface/bone surface, higher osteoclast surface/bone surface, higher osteoblast surface/bone surface, and higher osteoid/bone surface ratios (Figures 6A and 6B). Bone loss was observed as well with reduced bone volume/total volume ratio and reduced bone area (Figure 6B). These findings were also confirmed by micro-CT (µCT) analyses and by von Kossa staining of tibias and femurs in these KCTD1−/− mice, which showed reduced bone mineral density and bone loss with a significant reduction in trabecular and cortical bone (already seen at 6 weeks of age) (Figures 7A–7C). These bone findings are consistent with progressive metabolic bone disease from chronic secondary hyperparathyroidism.
Figure 5. Severe Renal Osteodystrophy-like Bone Disease in Aged KCTD1−/− and Six2Cre+KCTD1fl/fl Mice.
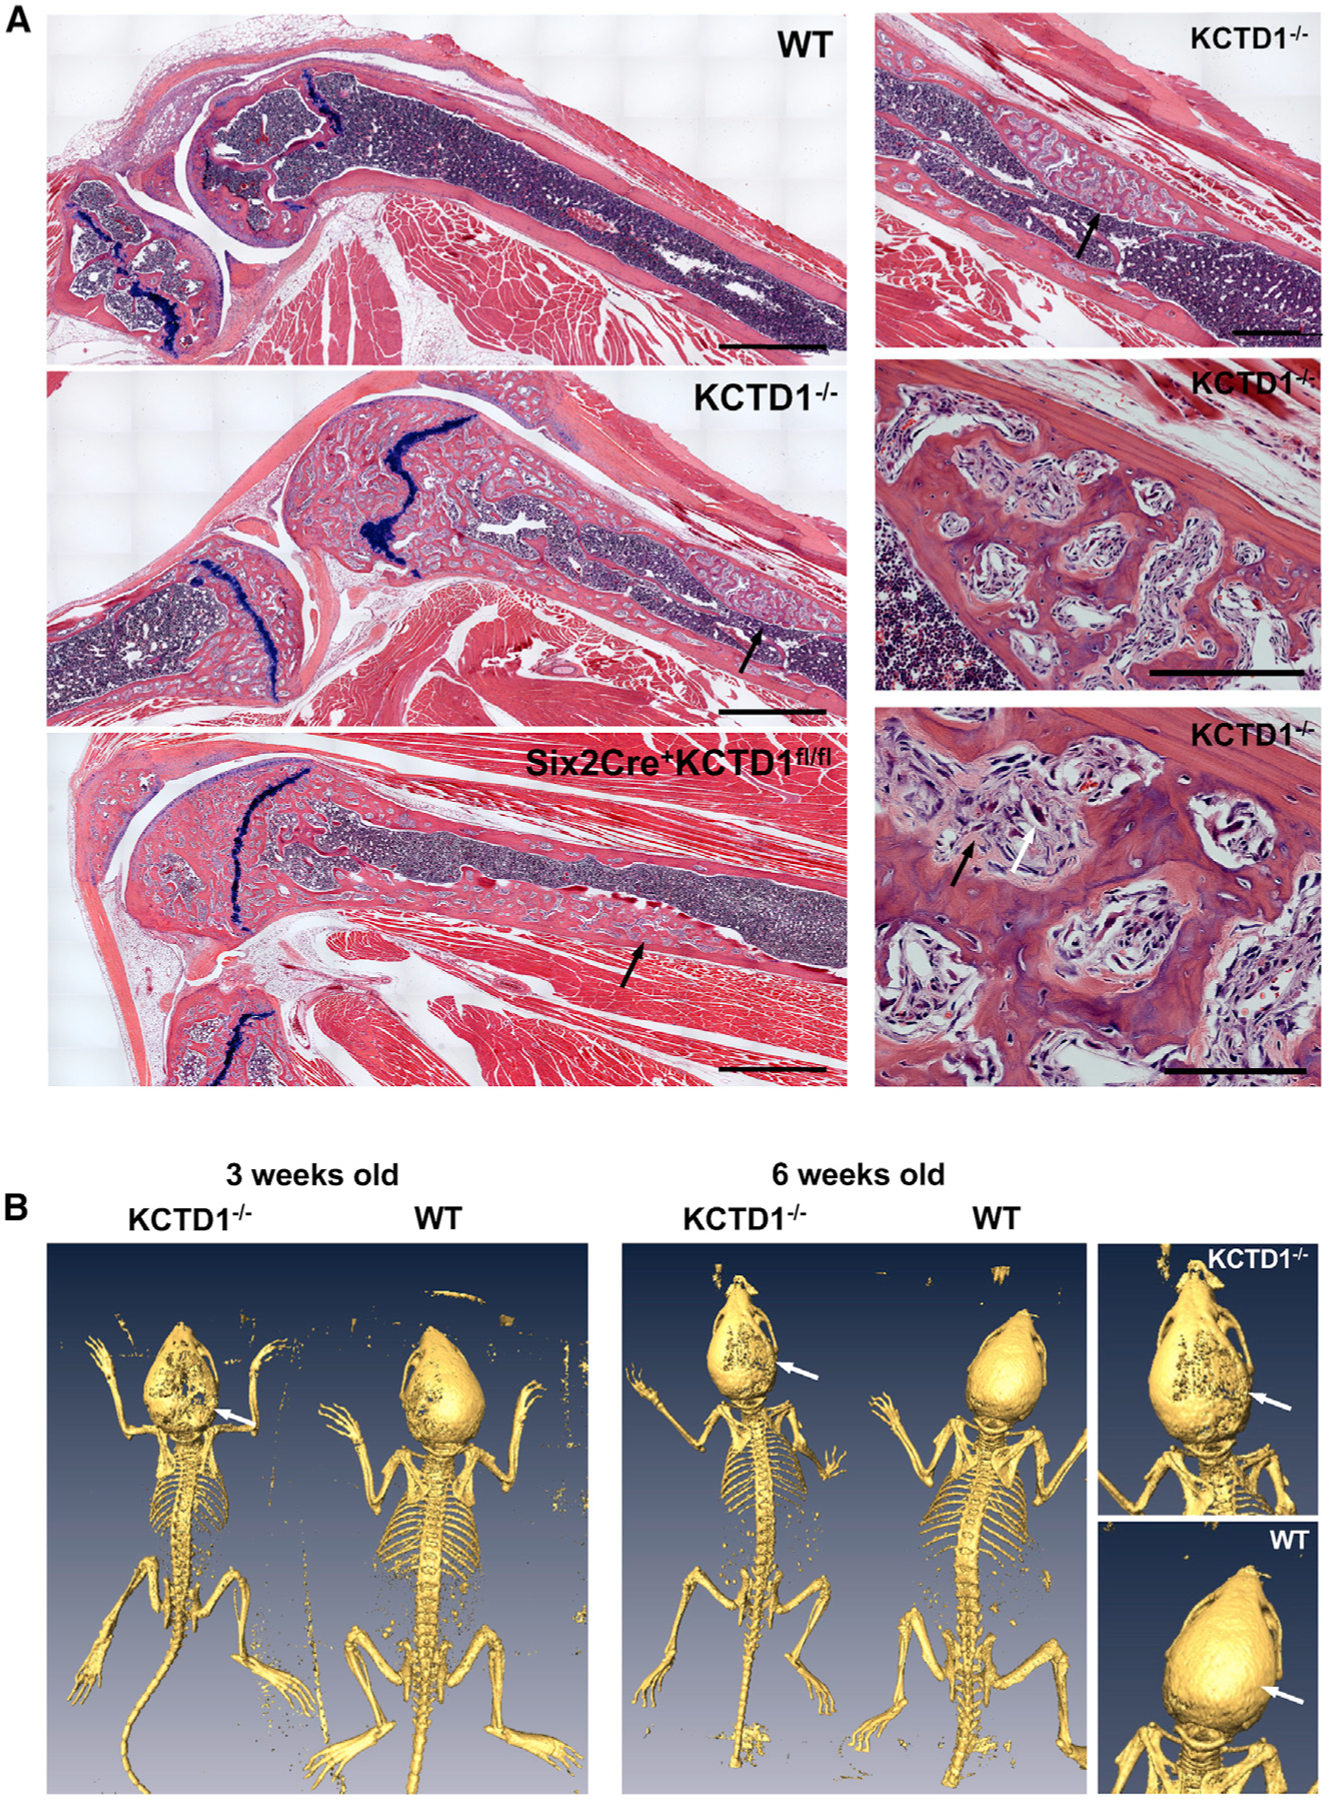
(A) Left: knee joint with femur and tibia of a 12-month-old KCTD1−/− mouse and its WT control is shown, as well as that of a 9-month-old Six2Cre+KCTDfl/fl mouse. Both KCTD1−/− and Six2Cre+KCTDfl/fl mice show severely abnormal bone with increased fibrous tissue and osteoclasts (black arrows). Right: higher-magnification images of image from KCTD1−/− mouse femur. Abnormal cortical bone with fibroblast-like cells (black arrow) and accumulation of osteoclasts (white arrow). H&E staining. Scale bars, left: 900 µm; right: 500 µm (top), 200 µm (middle), 100 µm (bottom).
(B) PET-CT imaging shows delayed calvarial ossification (arrows) when comparing 3- and 6-week-old male KCTD1−/− mice with their littermate controls.
Figure 6. Bone Histomorphometric Analysis Shows High-turnover Metabolic Bone Disease Already in Young Mice Lacking KCTD1.
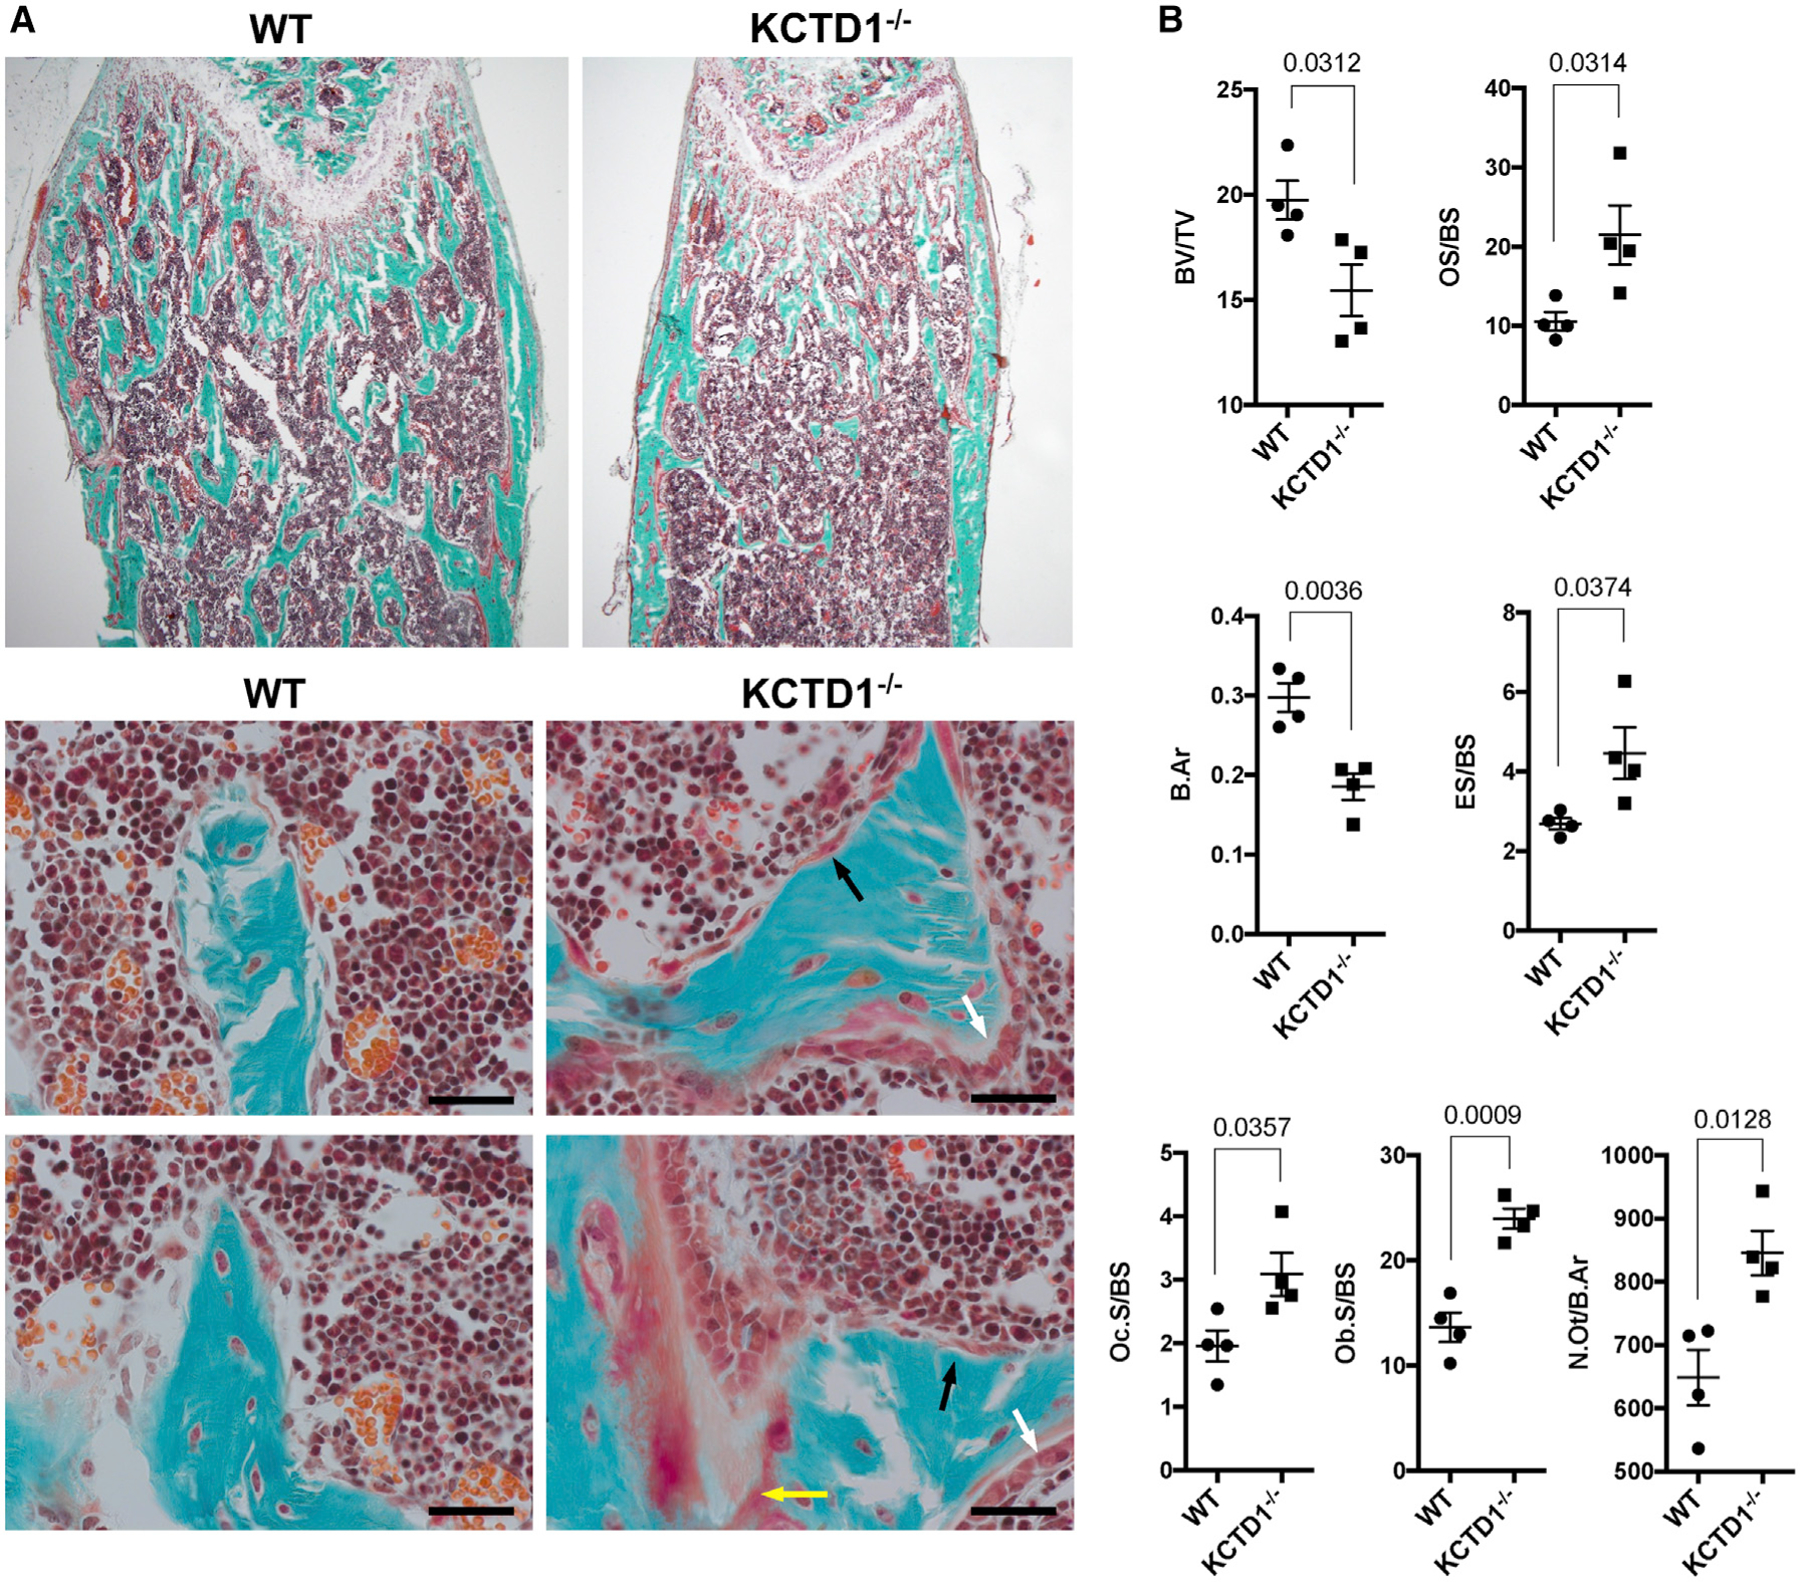
(A) Goldner-trichrome-stained femur shows reduced bone in 6-week-old male KCTD1−/− mice compared with WT control mice. An increase in osteoclasts (black arrows), osteoblasts (white arrows), and osteoid (yellow arrow) is observed in mice lacking KCTD1. Scale bars, 50 µm.
(B) Bone histomorphometry findings in 6-week-old KCTD1−/− and WT control mice. KCTD1−/− mice show reduced bone (BV/TV and B.Ar), and increased osteoclasts (Oc.S/BS), osteoclast activity (ES/BS), osteoblasts (Ob.S/BS), and osteoid (OS/BS). BV/TV, bone volume/tissue volume; B.Ar, trabecular bone area; Oc.S, osteoclast surface/bone surface; Ob.S/BS, osteoblast surface/bone surface; ES/BS, eroded surface/bone surface; OS/BS, osteoid surface/bone surface. Graphs represent data as means ± SEM. p values are shown (two-tailed, unpaired t test).
Figure 7. Reduced Bone Volume and Bone Mineral Density due to KCTD1 Deficiency.
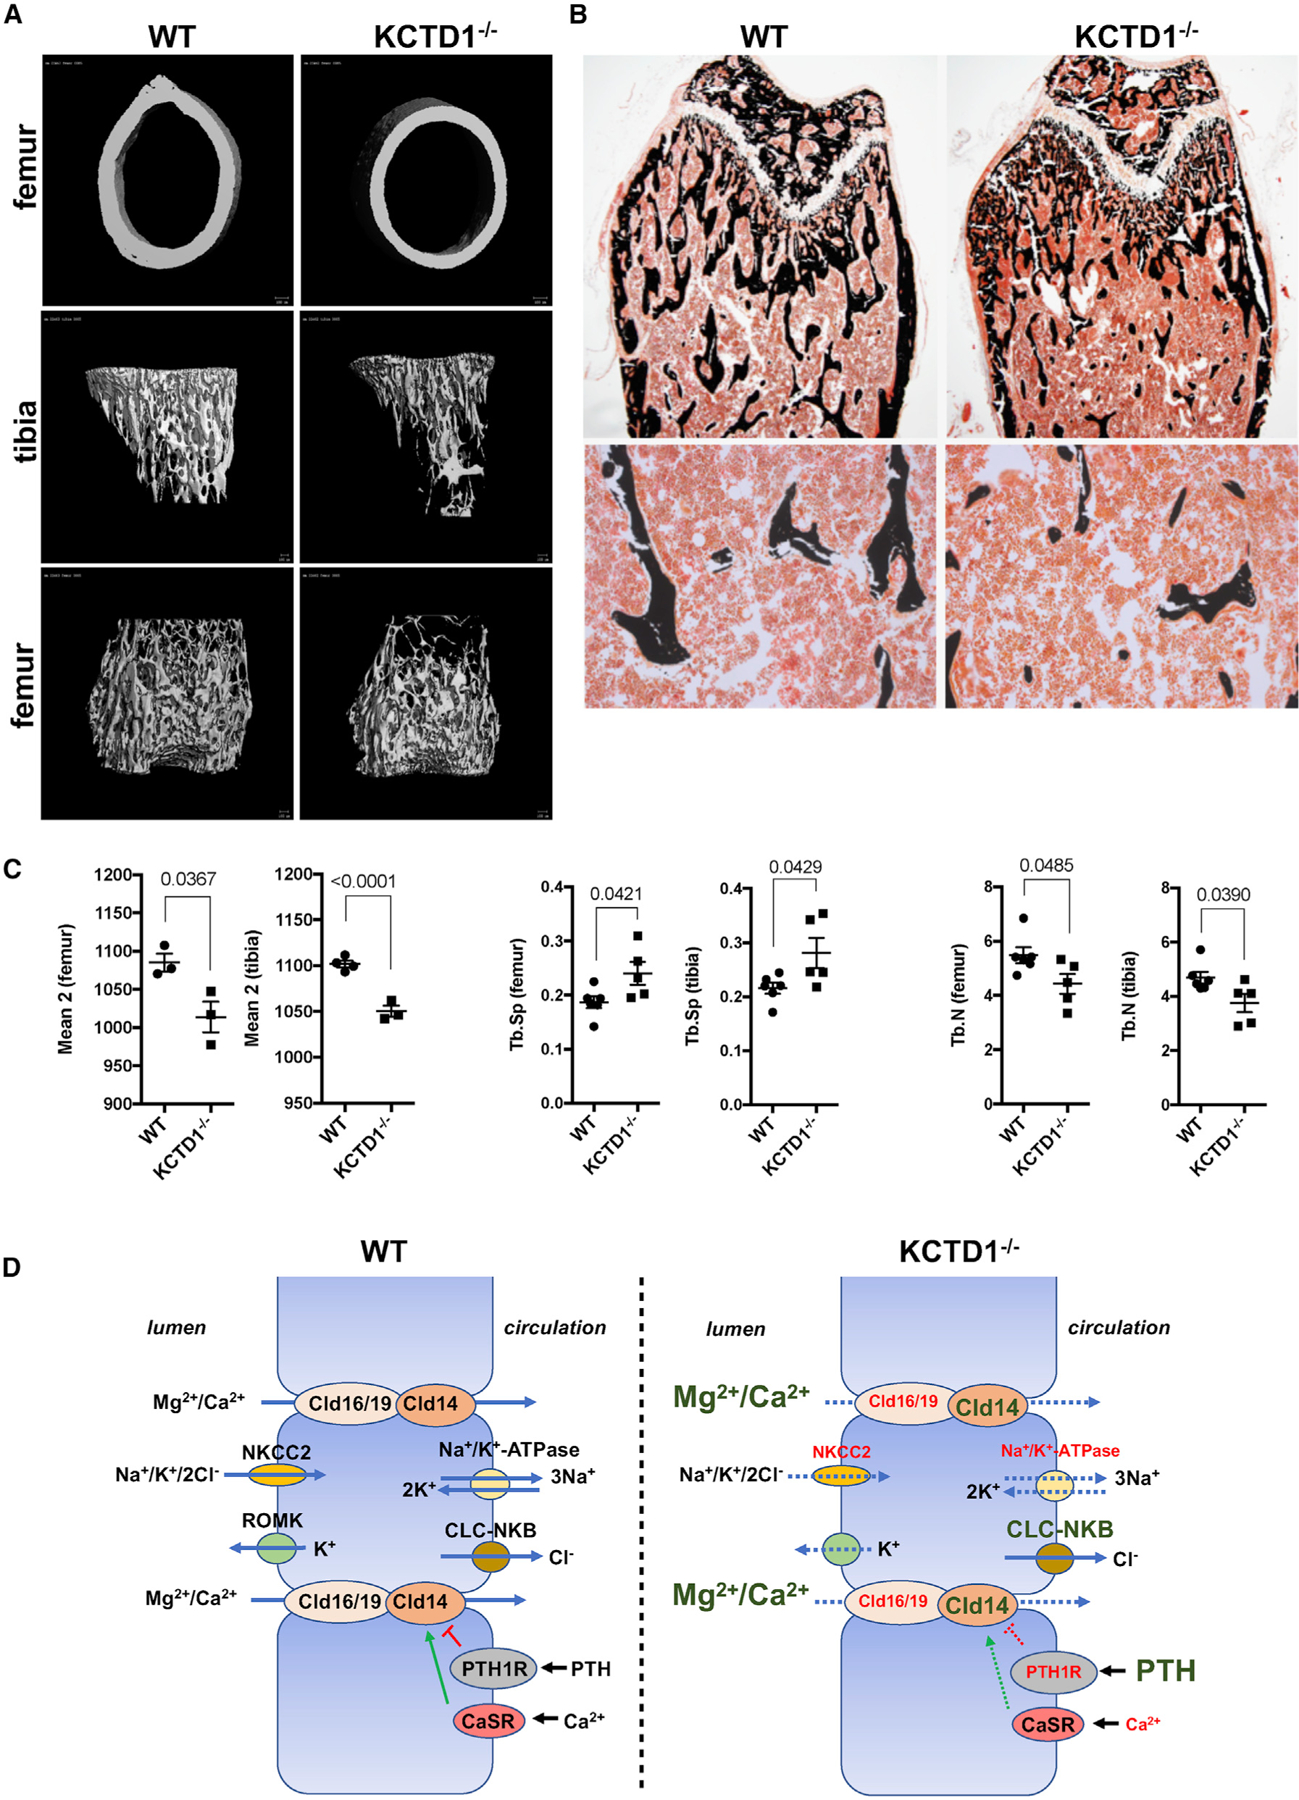
(A) Reduced mineralized bone is observed by µCT imaging of the long bones in 6-week-old, male KCTD1−/− mice compared with control littermate mice.
(B) Von Kossa-stained femurs from the mice analyzed by µCT show diminished bone in KCTD1−/− mice.
(C) Reduced bone density (mean 2) and trabecular bone (Tb.N) with increased trabecular spaces (Tb.Sp) observed by µCT imaging of long bones in 6-week-old, male KCTD1−/− mice compared with control littermates.
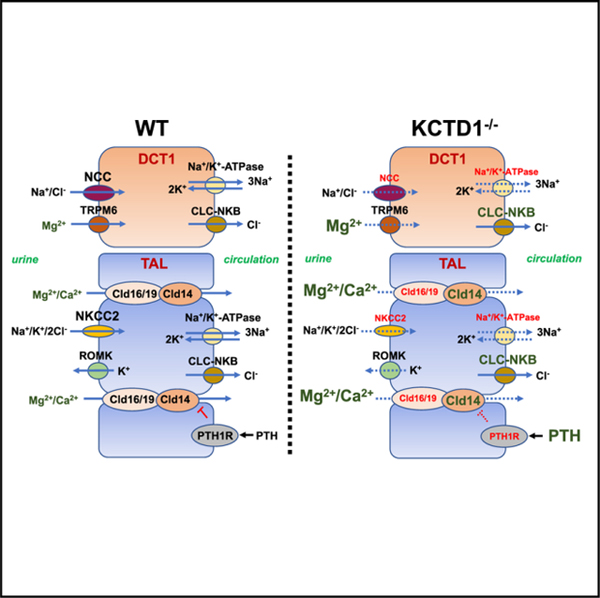
(D) Proposed pathomechanisms through which KCTD1 deficiency impairs paracellular urinary Mg2+ and Ca2+ reabsorption in TALs and thereby leads to secondary hyperparathyroidism and metabolic bone disease. Genes with reduced expression are indicated in a smaller red font; genes with increased expression are in an enlarged green font.
Graphs represent data as means ± SEM. p values are shown (two-tailed, unpaired t test).
DISCUSSION
It has been proposed that NCC is required for transcellular Mg2+ transport in DCT cells, in part by promoting Na+ influx into the cell, which is needed to maintain basolateral Na+/K+-ATPase function that establishes a low intracellular Na+ concentration, thereby driving Na+ entry apically and possibly Mg2+ exit at the basal side in DCT cells (Loffing et al., 2001). Consistent with that role for NCC, KCTD1 inactivation in DCT1s led to diminished NCC levels and hypomagnesemia. These data link AP-2β/KCTD1-mediated induction of NCC expression in DCT1s to the ability of this nephron segment to reabsorb urinary Mg2+. That link is also supported by the observation of hypomagnesemia in patients with Gitelman syndrome, who have mutations in the gene encoding NCC (SLC12A3), or in Slc12a3−/− mice (Schultheis et al., 1998; Simon et al., 1996c). Furthermore, these findings show that proper DCT1 function is critical for urinary Mg2+ uptake and cannot be compensated for by the DCT2. Notably, KCTD1 deficiency in the DCT1 did not significantly affect TRPM6 protein levels, suggesting that loss of KCTD1 does not lead to an overall reduction of all DCT differentiation genes but particularly affects NCC. EGF deficiency did not lead to significant hypomagnesemia. Thus, EGF is not a rate-limiting magnesiotropic factor in vivo.
TALs reabsorb about 50%–60% of filtered Mg2+ and about 20% of filtered Ca2+ via the paracellular pathway (Mount, 2014). The importance of TALs for paracellular reabsorption of both urinary Mg2+ and Ca2+ is demonstrated by the observation of mutations in the tight junction genes for claudin-16 and claudin-19, which regulate paracellular transport of those cations in TALs in human disorders that manifest with hypomagnesemia and hypercalciuria (Konrad et al., 2006; Simon et al., 1999). As claudin-16 and claudin-19 are significantly downregulated in kidneys lacking KCTD1, it is likely that urinary Mg2+ wasting due to KCTD1 deficiency occurs as a consequence of both impaired transcellular Mg2+ reabsorption in DCT1s and reduced paracellular Mg2+ uptake from urine in TALs. Collectively, these findings un-cover a critical role for KCTD1 in DCT1s and TALs for overall Mg2+ homeostasis.
Moreover, these data demonstrate that KCTD1 is also required for the ability of TALs (and possibly to some extent DCT2s) to reabsorb filtered Ca2+ from urine. In addition to urinary Mg2+ wasting, KCTD1 deficiency also leads to urinary Ca2+ loss, resulting in hypocalcemia and consequently chronic secondary hyperparathyroidism with high-turnover metabolic bone disease already at an early age and that progresses to severe renal osteodystrophy-like pathologies in aged KCTD1 mutant mice. Kidneys lacking KCTD1 show diminished expression of TAL genes that regulate paracellular Ca2+ reabsorption, whereas genes that regulate transcellular Ca2+ reabsorption in DCT2s/CTs were increased (Figure 7D). This suggests that urinary Ca2+ wasting and the associated abnormalities in calcium/phosphate metabolism are due to primarily insufficient paracellular Ca2+ transport in TALs. However, it is possible that transcellular Ca2+ uptake by DCT2 epithelial cells is also impaired in mice lacking KCTD1 and that the upregulation of TRPV5/TRPV6 is a compensatory mechanism without an actual functional increase of reabsorption of filtered Ca2+ in DCT2s. Nevertheless, it is more likely that the observed hypercalciuria is at least to a greater extent due to defects in TALs rather than DCT2s in mice lacking KCTD1 because the TALs contribute significantly more to reabsorption of filtered Ca2+ in the kidney, and the TAL transporters involved in this process were strongly diminished, whereas the DCT transporters involved in Ca2+ transport were increased.
The absence of urinary Ca2+ wasting in PvalbCre+KCTD1fl/fl and Aqp2Cre+KCTD1fl/fl mice shows that DCT1s and CTs/CDs are not contributing to this phenotype of defective renal Ca2+ reuptake; similarly, the lack of KCTD1 in PTGs or intestines had no effects on calcium/phosphate homeostasis. Six2Cre+KCTD1fl/fl mice phenocopied KCTD1−/− mice and showed very similar abnormalities in calcium/phosphate metabolism, demonstrating that these abnormalities are due to kidney-specific alterations and not due to potential roles of KCTD1 in other organs. In addition to the TALs, PTs are also a major site of Mg2+ and Ca2+ reabsorption. However, KCTD1 is not expressed in the PTs, which showed no morphological abnormalities in young adult KCTD1−/− or Six2Cre+KCTD1fl/fl mice that have already manifested urinary Mg2+ and Ca2+ loss. Nevertheless, the progressive impairment of overall renal function in kidneys lacking KCTD1 may contribute, to some extent, to the urinary Mg2+ and Ca2+ loss as well.
Paracellular Ca2+ and Mg2+ reabsorption from the TAL lumen into the circulation requires a lumen-positive transepithelial electrical gradient that is generated by a NKCC2-mediated influx of Na+/K+/Cl− ions into TAL epithelial cells and the concomitant efflux of K+ ions back into the tubular lumen through the inward-rectifier K+-channel ROMK (KCNJ1) (Moor and Bonny, 2016). Although NKCC2 and ROMK are localized at the apical site of the TAL epithelial cells, the Na+-K+-ATPase and the chloride channel CLC-NKB are located at the basolateral site and are required for Na+ and Cl− transport, respectively, into the circulation (in addition a K+ channel and a K+/Cl− cotransporter are pre-sent). The overall net effect of these transporters is that a lumen-positive electrical gradient drives paracellular Ca2+ and Mg2+ transport from the tubular lumen of the TAL into the circulation (Mount, 2014). The critical roles of NKCC2 and ROMK for paracellular Ca2+ reabsorption in the TALs are well established because mutations in their genes in Bartter syndrome lead to hypercalciuria, hyperparathyroidism, and osteopenia (and a subset of patients also develop hypomagnesemia) (Simon et al., 1996a, 1996b), and mice with NKCC2 mutations develop hypercalciuria and osteopenia as well (Kemter et al., 2010). TAL defects as a consequence of the lack of KCTD1 were associated with diminished expression of NKCC2 and ATP1A1 in kidneys of both KCTD1−/− and Six2Cre+KCTD1fl/fl mice. These changes would be expected to reduce the transepithelial electrical gradient that is required for paracellular Mg2+ and Ca2+ transport in the TAL, explaining, at least in part, the urinary Mg2+ and Ca2+ loss in mice lacking KCTD1, which leads to secondary hyperparathyroidism and metabolic bone disease, resembling findings in patients with Bartter syndrome (Figure 7D).
Paracellular Ca2+ and Mg2+ transport in TALs is also regulated by specific claudins (Moor and Bonny, 2016). Claudin-16 and claudin-19 are hemichannels that form a paracellular pore in TALs through which Mg2+ and Ca2+ transport occurs. Patients with mutations in these genes develop hypomagnesemia and hypercalciuria (Konrad et al., 2006; Simon et al., 1999). Mice lacking claudin-16 manifested urinary Ca2+ and Mg2+ wasting and compensatory increased expression of TRPV5 and TRPV6, which can form heteromultimers and serve as apical channels for transcellular Ca2+ transport into the epithelial cells of DCT2s/CTs (Hou et al., 2007; Will et al., 2010).
The tight junction protein claudin-14 interacts with claudin-16 and interferes with paracellular Ca2+ and Mg2+ reabsorption in the TALs (claudins 14, 16, and 19 are highly expressed in TALs [Park et al., 2018; Ransick et al., 2019]), whereas loss of claudin-14 results in increased Ca2+ and Mg2+ reabsorption, which leads to hypermagnesemia and hypocalciuria (Gong et al., 2012). Ca2+ reabsorption in TALs is stimulated by PTH/PTH1R signaling through a mechanism that suppresses claudin-14 expression and induces its cytosolic translocation from the tight junction (Sato et al., 2017). Consistent with those findings, urinary Ca2+ wasting in KCTD1−/− and Six2Cre+KCTD1fl/fl mice was associated with decreased renal expression of PTH1R and claudins-16 and -19 and increased expression of claudin-14. Moreover, a compensatory increase in expression of TRPV5 and TRPV6 was observed in kidneys of these mice. PTH and FGF23 both increase expression of TRPV5 in DCT2s/CTs (Andrukhova et al., 2014; de Groot et al., 2009; van Abel et al., 2005), explaining the compensatory increase in its expression observed in mice lacking KCTD1, which have increased PTH and FGF23. Collectively, these findings provide evidence that a defect primarily in paracellular Ca2+ reabsorption in the TALs contributes to the urinary Ca2+ loss in KCTD1−/− and Six2Cre+KCTD1fl/fl mice.
Notably, PTH1R is expressed in podocytes, PTs, TALs, DCTs, and CTs, and overall renal expression of PTH1R was reduced in 2-month-old KCTD1−/− and Six2Cre+KCTD1fl/fl mice (Ransick et al., 2019). The absence of KCTD1 in podocytes and PTs and their normal morphology in young KCTD1 mutants suggests that PTH1R function in PTs may be normal and properly regulates the activity of the renal sodium phosphate co-transporters Npt2a and Npt2c (explaining their downregulation with increased PTH levels in these mice). Alternatively, even if PTH1R activity in PTs would be reduced, the increase in FGF23 in KCTD1−/− and Six2Cre+KCTD1fl/fl mice would explain the decreased expression of these sodium phosphate co-transporters in PTs as well. Similarly, should PTH1R expression also be reduced in DCT2s, the increase in TRPV5/TRPV6 expression could be explained by increased FGF23. Thus, the observation of reduced expression of Npt2a and Npt2c genes in the PTs and increased TRPV5/TRPV6 in DCT2s and increased claudin-14 in TALs would be explained by increased serum FGF23 and PTH levels even if PTH1R would not only be diminished in TALs.
In CKD, phosphate excretion and phosphate serum levels are initially maintained within a normal range through a decrease in reabsorption of phosphate in PTs, which is mediated by the inhibitory effects of PTH and FGF23 on Npt2a and Npt2c. Similarly, the increase in PTH and FGF23 in both KCTD1−/− and Six2Cre+KCTDfl/fl mice was associated with decreased expression of these sodium phosphate co-transporters. However, with deteroration of kidney function in patients with more advanced CKD, this compensatory mechanism is not sufficient, and hyperphosphatemia develops. In particular, serum levels of the main phosphaturic hormone FGF23 are already increased early in the disease course of CKD and precede a detectable increase in serum phosphate levels. This observation seen in CKD patients was also observed in KCTD1−/− mice: young KCTD1-deficient mice showed a strong increase in FGF23 when serum phosphate levels were still normal, but aged KCTD1−/− mice with more severe renal abnormalities had highly increased serum phosphate levels. Similarly, metabolic bone disease can develop at early stages of CKD and progress with further deterioration of kidney function. Mice lacking KCTD1 also developed bone loss and reduced bone mineralization already at an early age. Secondary hyperparathyroidism is also a relatively early consequence of kidney impairment in CKD and increased PTH concentrations can be observed when serum levels of calcium or phosphate are still within the normal range. Similarly, KCTD1−/− mice had increased PTH serum levels already at a young age. The high PTH levels in KCTD1 mutants are likely due to a combination of phosphate retention as a consequence of progressive renal insufficiency and hypocalcemia because of impaired urinary Ca2+ reabsorption.
Bone pathologies in KCTD1 mutants show high-turnover metabolic bone disease with features of osteitis fibrosa cystica or mixed uremic osteodystrophy, such as the loss of bone volume and reduced bone mineralization. Osteitis fibrosa cystica shows an increase in the number and activity of osteoblasts and osteoclasts and an increase in osteoid. Lack of KCTD1 resulted in increased osteoid, osteoclasts, and osteoblasts and in reduced bone mineralization. Thus, the lack of KCTD1 causes secondary hyperparathyroidism, which results in high-turnover bone disease with the typical features of metabolic bone disease seen in CKD. Overall, the temporal changes in calcium/phosphate and bone metabolism observed in mice lacking KCTD1 show many similarities to clinical observations in CKD. Notably, the metabolic bone disease in KCTD1−/− and Six2Cre+KCTD1fl/fl mice occurs not only in the setting of chronic hyperparathyroidism but also in the setting of progressive renal insufficiency with marked morphological renal abnormalities and a salt-losing tubulopathy. Thus, it is likely that the observed bone abnormalities in KCTD1 mutants are a consequence of the combination of those renal abnormalities and are not explained exclusively by hypocalcemia. In summary, these findings identify KCTD1 as a critical regulator of TAL/DCT function and as being essential for the ability of the kidney to reabsorb filtered Mg2+ and Ca2+ and control overall magnesium and calcium/phosphate metabolism.
STAR★METHODS
RESOURCE AVAILABILITY
Lead Contact
Further information and requests for resources and reagents should be directed to and will be fulfilled by the Lead Contact, Alexander G. Marneros (amarneros@mgh.harvard.edu).
Materials Availability
Mouse lines generated in this study are available upon request.
Data and Code Availability
RNA-seq data has been deposited to the GEO database: GSE126326 and GSE130864.
EXPERIMENTAL MODEL AND SUBECT DETAILS
KCTD1-reporter mice, KCTD1−/− mice, as well as mice with floxed KCTD1 alleles were generated as previously reported (Marneros, 2020). KCTD1fl/fl mice were crossed with several Cre lines: Six2Cre+ mice (Kobayashi et al., 2008), PvalbCre+ mice (IMSR Cat# JAX:008069, RRID:IMSR_JAX: 008069) (Grimm et al., 2017), Aqp2Cre+ mice [IMSR Cat# JAX:006881, RRID:IMSR_JAX:006881; using only female Aqp2Cre+ mice for matings]), VilCre+ mice (IMSR Cat# JAX:004586, RRID:IMSR_JAX:004586), and PTH-Cre+ mice (Libutti et al., 2003) (IMSR Cat# JAX:005989, RRID:IMSR_JAX:005989) in order to obtain mice that are homozygous for the KCTD1fl/fl allele and heterozygous for the corresponding Cre to establish cell type-specific conditional KCTD1 KO mice. Cre activity and specificity were confirmed by crossing these strains with an EYFP-reporter strain (B6.Cg-Gt(ROSA)26Sortm3(CAG-EYFP)Hze/J (Ai3) reporter mice; IMSR Cat# JAX:007903, RRID:IMSR_JAX:007903). Induced inactivation of KCTD1 in the adult (at 6-weeks of age) was achieved in b-actinCreERT2+KCTD1fl/fl mice (generated by crossing CAGGCreERT2+ mice [IMSR Cat# JAX:004682, RRID:IMSR_JAX:004682] (Hayashi and McMahon, 2002) with KCTD1fl/fl mice) with injection of tamoxifen (TAM) (6mg/40 gm BW daily for 5 consecutive days IP), a tamoxifen administration regimen that has been shown to efficiently and uniformly activate Cre recombinase in the kidney (Hayashi and McMahon, 2002). Efficient Cre-mediated removal of exon 3 of KCTD1 with this treatment regimen was confirmed by semiquantitative RT-PCR (one primer within exon 3) (Marneros, 2020). TFAP2Bfl/fl mice were kindly provided by Dr. Trevor Williams. The generation of these mice has previously been described: Cre-mediated recombination results in removal of exon 6 that is critical for DNA binding, resulting in TFAP2B without transcription factor activity (Van Otterloo et al., 2018). These mice were crossed with PvalbCre+ mice or b-actinCreERT2+KCTD1fl/fl mice. The generation of EGF−/− mice has previously been described (Luetteke et al., 1999). For metabolic studies single mice were kept for 24-hours in metabolic cages (3600M021, Techniplast) and urine and stool production, as well as water and food intake were measured. Treatments were performed with dDAVP (0.4 mg/kg intraperitoneally) or furosemide (40mg/kg intraperitoneally) and effects on these parameters were assessed. For all animal studies, institutional approval was granted and international guidelines for the care and use of laboratory research animals were followed. ARRIVE guidelines for reporting of animal studies were followed. Age and gender information of mice used in the experiments is provided in the Results and Figure Legends section.
METHOD DETAILS
Western blotting
Kidneys were lysed in NP40 lysis buffer (Life Technologies) with 1mM PMSF and protease inhibitor cocktail (Complete, Roche) using the QIAGEN TissueLyser-II. After centrifugation, the protein concentrations in the supernatant were determined with a Bradford assay. Equal amounts of protein were loaded onto NuPage 4%–12% Bis-Tris gels (Life Technologies) and blotted to nitrocellulose membranes. Equal protein loading was assessed using a rabbit polyclonal anti-β-actin antibody (Cell Signaling Technology Cat# 4970, RRID:AB_2223172). Antibodies against NKCC2 (Cell Signaling Technology, Cat# 38436, RRID:AB_2799134), NCC (Millipore Cat# AB3553, RRID:AB_571116) and TRPM6 (Thermo Fisher Scientific Cat#PA5–77326, RRID:AB_2736741) were used as well. HRP-conjugated secondary antibodies were used and chemiluminescence signal was determined with the SuperSignal WestPico chemiluminescent substrate (Pierce).
Immunolabeling of kidney sections and morphological kidney analyses
For morphological analysis of mouse kidneys, kidneys were fixed in 4% paraformaldehyde. Kidneys were bisected and then processed and embedded in paraffin for histological analysis. H&E stainings, lacZ stainings and TUNEL assays were performed according to standard protocols. The other kidney half was embedded in 30% sucrose and subsequently in OCT for immunolabeling experiments. For immunolabeling, 7 µm kidney sections were permeabilized in 0.5% Triton X-100 and subsequently blocked with 5% serum in which the secondary antibodies were raised. The following primary antibodies were used: rabbit anti-β-galactosidase (Thermo Fisher Scientific Cat# A-11132, RRID:AB_221539), chicken anti-β-galactosidase (Abcam Cat# ab9361, RRID:AB_307210), goat anti-Aqp2 (Santa Cruz Biotechnology Cat# sc-9882, RRID:AB_2289903), rabbit anti-GFP (Thermo Fisher Scientific Cat# A-11122, RRID:AB_221569), rabbit anti-NKCC2 (Cell Signaling Technology, Cat# 38436, RRID:AB_2799134), goat anti-THP (Santa Cruz Biotechnology Cat# sc-19554, RRID:AB_793728), rabbit anti-parvalbumin (Abcam Cat# ab11427, RRID:AB_298032), goat anti-EGF (R&D Systems Cat# AF2028, RRI-D:AB_355111), active b-catenin (non-phospho Ser33/37/Thr41) (Cell Signaling Technology Cat# 8814S, RRID:AB_11127203), anti-TRPV5 (MyBioSource Cat# MBS9125453), anti-Cldn14 (MyBioSource Cat# MBS1494658), and anti-Cldn19 (BiCell Scientific, Cat# 00219). Phalloidin conjugated with Alexa647 (Thermo Fisher Scientific Cat# A22287, RRID:AB_2620155) was used for cytoskeletal staining at a dilution of 1:100. DAPI was used to stain nuclei (Thermo Fisher Scientific Cat# D3571, RRID:AB_2307445). Secondary Alexa 488/555/647 antibodies were used at a dilution of 1:200 (Thermo Fisher). Controls included stainings with no primary antibody or with IgG control primary antibodies. Rhodamine-conjugated peanut agglutinin lectin (Vector Laboratories Cat# RL-1072, RRID:AB_2336642) [epithelial staining of distal nephron epithelial cells; contiguous staining of PTs] was used at a dilution of 1:100.
Semiquantitative RT-PCR
For gene expression studies, cDNA was obtained using the Transcriptor First strand synthesis kit utilizing hexamer primers (Roche). Semiquantitative RT-PCR was performed using a LightCycler 480 system with the LightCycler 480 SYBR Green I master mix according to standard procedures (45 amplification cycles) (Roche Applied Science, Indianapolis, IN). Primers for 36b4 were used as a normalization control. Concentrations were determined using a standard dilution curve. Experiments for all samples were performed in triplicate. Primer sequences for semiquantitative RT-PCR are listed in Table S1.
ELISAs, serum and urine chemistries
Serum levels of 1,25 (OH)2 vitamin D3 were measured with an EIA kit by immunoextraction followed by quantitation with an enzyme-immunoassay (ImmunoDiagnosticSystems PLC, Tyne and Wear, UK; Cat# AC-62F1). Mouse serum FGF23 was measured using the Quidel ELISA Kit that measures C-terminal FGF-23 according to the manufacturer’s instructions (Quidel, San Diego, USA; Cat# 60–6300). Mouse PTH serum levels were determined with an ELISA kit that measures intact PTH (PTH 1–84) (Quidel, San Diego, USA; Cat 60–2305). Mouse serum chemistries were determined with a Dri-Chem7000 chemistry analyzer (Heska). Urine chemistries were determined with a Roche ModP analyzer. Ionized serum calcium measurements were performed with a Siemens RAPIDlab 348EX machine.
Bone analyses
Hindlimbs were dissected and fixed in Bouin’s fixative for 2 weeks and subsequently processed for paraffin embedding, sectioned and stained by H&E according to standard protocols. A second group of hindlimbs were fixed in 4% paraformaldehyde for 2 days and subsequently processed and embedded in resin. These non-decalcified mineralized bones were used for Van Kossa stainings to visualize calcified bone or for Goldner-Trichrome stainings. Femurs from mice were subjected to bone histomorphometric analysis. Fixed bones were dehydrated in graded ethanol, then infiltrated and embedded in methylmethacrylate without demineralization. Un-decalcified 5 mm and 10 mm thick longitudinal sections were obtained using a microtome (RM2255, Leica Biosystems., IL, USA). The 5 mm sections were stained with Goldner-Trichome and at least two nonconsecutive sections per sample were examined for measurement of cellular parameters. A standard bone histomorphometric analysis of the femural metaphysis was done using the Osteomeasure analyzing system (Osteometrics Inc., Decatur, GA, USA). Measurements were performed in the area of secondary spongiosa, 250–300 µm below the proximal growth plate. The observer was blinded to the experimental genotype at the time of measurement. The structural and cellular parameters were calculated and expressed according to the standardized nomenclature (Dempster et al., 2013). For µCT analysis of tibias and femurs, the bones were dissected from each animal and collected into individual glass vials with 4% paraformaldehyde. Samples were fixed overnight at 4 C on a shaker. After overnight fixation, samples were kept in paraformaldehyde solution to be assessed with µCT. A Scanco Medical MicroCT 35 system with an isotropic voxel size of 7 µm was used to image the samples. Scans were conducted with an X-ray tube potential of 70kVP, an X-ray intensity of 0.145 mA and an integration time of 600ms per tomographic projection. 3-Dimensional images were reconstructed and obtained from the scans. Whole body skeletal imaging was performed using a Siemens Inveon PET-CT.
QUANTIFICATION AND STATISTICAL ANALYSIS
RNA-seq data analysis
Analysis of RNA-seq data was performed based on datasets that we recently reported: (1) P8 Six2Cre+KCTD1fl/fl mice and littermate KCTD1fl/fl control mice (n = 4 per group); (2) 4-months-old β-actinCreERT2+TFAP2Bfl/fl mice versus control littermates treated with TAM at 6 weeks of age (n = 4 per group) (Marneros, 2020). RNA-seq data has been deposited to the GEO database: GSE126326 and GSE130864.
Statistics
An unpaired two-tailed Student’s t test was used for statistical analyses. P values < 0.05 were considered to be statistically significant. P values are indicated. Graphs show mean ± SEM. Graphs, heatmaps and analyses were performed with GraphPad Prism version 8.4.3.
Supplementary Material
KEY RESOURCES TABLE
| REAGENT or RESOURCE | SOURCE | IDENTIFIER |
|---|---|---|
| Antibodies | ||
| rabbit anti-β-galactosidase | Thermo Fisher Scientific | Cat# A-11132, RRID:AB_221539 |
| rabbit anti-TRPM6 | Thermo Fisher Scientific | Cat# PA5–77326, RRID:AB_2736741 |
| rabbit anti-TRPV5 | MyBiosource | Cat# MBS9125453 |
| rabbit anti-Cldn14 | MyBiosource | Cat# MBS1494658 |
| rabbit anti-Cldn19 | BiCell Scientific | Cat# 00219 |
| chicken anti-β-galactosidase | Abcam | Cat# ab9361, RRID:AB_307210 |
| goat anti-Aqp2 | Santa Cruz Biotechnology | Cat# sc-9882, RRID:AB_2289903 |
| rabbit anti-NCC | Millipore | Cat# AB3553, RRID:AB_571116 |
| goat anti-THP | Santa Cruz Biotechnology | Cat# sc-19554, RRID:AB_793728 |
| rabbit anti-GFP | Thermo Fisher Scientific | Cat# A-11122, RRID:AB_221569 |
| rabbit anti-NKCC2 | Cell Signaling Technologies | Cat# 38436, RRID:AB_2799134 |
| rabbit anti-parvalbumin | Abcam | Cat# ab11427, RRID:AB_298032 |
| goat anti-EGF | R&D Systems | Cat# AF2028, RRID:AB_355111 |
| rabbit anti-b-actin antibody | Cell Signaling Technology | Cat# 4970, RRID:AB_2223172 |
| rabbit anti-active β-catenin (non-phospho Ser33/37/Thr41) | Cell Signaling Technology | Cat# 8814S, RRID:AB_11127203 |
| Chemicals, Peptides, and Recombinant Proteins | ||
| tamoxifen | Sigma Aldrich | T5648 |
| Critical Commercial Assays | ||
| mouse 1,25 (OH)2 vitamin D3 EIA kit | ImmunoDiagnosticSystems PLC, Tyne and Wear, UK | Cat# AC-62F1 |
| mouse FGF23 Immutopics ELISA Kit | Quidel, San Diego, USA | Cat# 60–6300 |
| mouse PTH (PTH 1–84) ELISA kit | Quidel, San Diego, USA | Cat# 60–2305 |
| Deposited Data | ||
| RNA-seq data | Marneros, 2020 | GEO: GSE126326 |
| RNA-seq data | Marneros, 2020 | GEO: GSE130864 |
| Experimental Models: Organisms/Strains | ||
| KCTD1−/− mice and KCTD1fl/fl mice | Marneros, 2020 | N/A |
| Six2Cre+ mice | Kobayashi et al., 2008 | JAX:009606 |
| PvalbCre+ mice | Grimm et al., 2017 | JAX:017320 |
| Aqp2Cre+ mice | Jackson Labs | JAX:006881 |
| VilCre+ mice | Jackson Labs | JAX:004586 |
| PTHCre+ mice | Libutti et al., 2003 | JAX:005989 |
| B6.Cg-Gt(ROSA)26Sortm3(CAG-EYFP)Hze/J (Ai3) | Jackson Labs | JAX:007903 |
| CAGGCreERT2+ mice | Hayashi and McMahon, 2002 | JAX:004453 |
| EGF−/− mice | Luetteke et al., 1999 | N/A |
| TFAP2Bfl/fl mice | Van Otterloo et al., 2018 | N/A |
| Oligonucleotides | ||
| semiquantitative RT-PCR primers | Life Technologies | See Table S1 |
| Other | ||
| rhodamine-conjugated peanut agglutinin | Vector Laboratories | Cat# RL-1072, RRID:AB_2336642 |
| metabolic cages | Techniplast | 3600M021 |
| phalloidin conjugated with Alexa647 | Thermo Fisher Scientific | Cat# A22287, RRID:AB_2620155 |
Highlights.
KCTD1 in early distal convoluted tubules regulates active urinary Mg2+ reabsorption
EGF is not a major regulator of Mg2+ homeostasis
Lack of KCTD1 in thick ascending limbs impairs paracellular Ca2+ and Mg2+ reabsorption
These thick ascending limb defects cause hypocalcemia and hyperparathyroidism
ACKNOWLEDGMENTS
The author would like to thank Karin Strittmatter and Janaina Da Silva Martins for technical assistance and Michael Mannstadt for critical reading of this manuscript. Services of the Harvard School of Dental Medicine Micro CT Core Facility and of the NIH-sponsored Center for Skeletal Research Core (NIH P30 AR066261) at Massachusetts General Hospital are acknowledged. This study was supported by institutional funds and by funding from the NIH (R01DK118134, R01DK121178, and R21AG063377) to A.G.M.
Footnotes
SUPPLEMENTAL INFORMATION
Supplemental Information can be found online at https://doi.org/10.1016/j.celrep.2020.108616.
DECLARATION OF INTERESTS
The author declares no competing interests.
REFERENCES
- Andrukhova O, Smorodchenko A, Egerbacher M, Streicher C, Zeitz U, Goetz R, Shalhoub V, Mohammadi M, Pohl EE, Lanske B, and Erben RG (2014). FGF23 promotes renal calcium reabsorption through the TRPV5 channel. EMBO J 33, 229–246. [DOI] [PMC free article] [PubMed] [Google Scholar]
- Belge H, Gailly P, Schwaller B, Loffing J, Debaix H, Riveira-Munoz E, Beauwens R, Devogelaer JP, Hoenderop JG, Bindels RJ, and Devuyst O (2007). Renal expression of parvalbumin is critical for NaCl handling and response to diuretics. Proc. Natl. Acad. Sci. USA 104, 14849–14854. [DOI] [PMC free article] [PubMed] [Google Scholar]
- Blaine J, Chonchol M, and Levi M (2015). Renal control of calcium, phosphate, and magnesium homeostasis. Clin. J. Am. Soc. Nephrol 10, 1257–1272. [DOI] [PMC free article] [PubMed] [Google Scholar]
- Cha SK, Wu T, and Huang CL (2008). Protein kinase C inhibits caveolae-mediated endocytosis of TRPV5. Am. J. Physiol. Renal Physiol 294, F1212–F1221. [DOI] [PubMed] [Google Scholar]
- de Groot T, Lee K, Langeslag M, Xi Q, Jalink K, Bindels RJ, and Hoenderop JG (2009). Parathyroid hormone activates TRPV5 via PKA-dependent phosphorylation. J. Am. Soc. Nephrol 20, 1693–1704. [DOI] [PMC free article] [PubMed] [Google Scholar]
- Dempster DW, Compston JE, Drezner MK, Glorieux FH, Kanis JA, Malluche H, Meunier PJ, Ott SM, Recker RR, and Parfitt AM (2013). Standardized nomenclature, symbols, and units for bone histomorphometry: a 2012 update of the report of the ASBMR Histomorphometry Nomenclature Committee. J. Bone Miner. Res 28, 2–17. [DOI] [PMC free article] [PubMed] [Google Scholar]
- Ding XF, Luo C, Ren KQ, Zhang J, Zhou JL, Hu X, Liu RS, Wang Y, Gao X, and Zhang J (2008). Characterization and expression of a human KCTD1 gene containing the BTB domain, which mediates transcriptional repression and homomeric interactions. DNA Cell Biol 27, 257–265. [DOI] [PubMed] [Google Scholar]
- Ding X, Luo C, Zhou J, Zhong Y, Hu X, Zhou F, Ren K, Gan L, He A, Zhu J, et al. (2009). The interaction of KCTD1 with transcription factor AP-2alpha inhibits its transactivation. J. Cell. Biochem 106, 285–295. [DOI] [PubMed] [Google Scholar]
- Gong Y, Renigunta V, Himmerkus N, Zhang J, Renigunta A, Bleich M, and Hou J (2012). Claudin-14 regulates renal Ca++ transport in response to CaSR signalling via a novel microRNA pathway. EMBO J 31, 1999–2012. [DOI] [PMC free article] [PubMed] [Google Scholar]
- Grimm PR, Coleman R, Delpire E, and Welling PA (2017). Constitutively Active SPAK Causes Hyperkalemia by Activating NCC and Remodeling Distal Tubules. J. Am. Soc. Nephrol 28, 2597–2606. [DOI] [PMC free article] [PubMed] [Google Scholar]
- Groenestege WM, Thébault S, van der Wijst J, van den Berg D, Janssen R, Tejpar S, van den Heuvel LP, van Cutsem E, Hoenderop JG, Knoers NV, and Bindels RJ (2007). Impaired basolateral sorting of pro-EGF causes isolated recessive renal hypomagnesemia. J. Clin. Invest 117, 2260–2267. [DOI] [PMC free article] [PubMed] [Google Scholar]
- Hayashi S, and McMahon AP (2002). Efficient recombination in diverse tis-sues by a tamoxifen-inducible form of Cre: a tool for temporally regulated gene activation/inactivation in the mouse. Dev. Biol 244, 305–318. [DOI] [PubMed] [Google Scholar]
- Hou J, Shan Q, Wang T, Gomes AS, Yan Q, Paul DL, Bleich M, and Goodenough DA (2007). Transgenic RNAi depletion of claudin-16 and the renal handling of magnesium. J. Biol. Chem 282, 17114–17122. [DOI] [PubMed] [Google Scholar]
- Kemter E, Rathkolb B, Bankir L, Schrewe A, Hans W, Landbrecht C, Klaften M, Ivandic B, Fuchs H, Gailus-Durner V, et al. (2010). Mutation of the Na(+)-K(+)-2Cl(−) cotransporter NKCC2 in mice is associated with severe polyuria and a urea-selective concentrating defect without hyperreninemia. Am. J. Physiol. Renal Physiol 298, F1405–F1415. [DOI] [PubMed] [Google Scholar]
- Kobayashi A, Valerius MT, Mugford JW, Carroll TJ, Self M, Oliver G, and McMahon AP (2008). Six2 defines and regulates a multipotent self-renewing nephron progenitor population throughout mammalian kidney development. Cell Stem Cell 3, 169–181. [DOI] [PMC free article] [PubMed] [Google Scholar]
- Konrad M, Schaller A, Seelow D, Pandey AV, Waldegger S, Lesslauer A, Vitzthum H, Suzuki Y, Luk JM, Becker C, et al. (2006). Mutations in the tight-junction gene claudin 19 (CLDN19) are associated with renal magnesium wasting, renal failure, and severe ocular involvement. Am. J. Hum. Genet 79, 949–957. [DOI] [PMC free article] [PubMed] [Google Scholar]
- Li X, Chen C, Wang F, Huang W, Liang Z, Xiao Y, Wei K, Wan Z, Hu X, Xiang S, et al. (2014). KCTD1 suppresses canonical Wnt signaling pathway by enhancing β-catenin degradation. PLoS ONE 9, e94343. [DOI] [PMC free article] [PubMed] [Google Scholar] [Retracted]
- Libutti SK, Crabtree JS, Lorang D, Burns AL, Mazzanti C, Hewitt SM, O’Connor S, Ward JM, Emmert-Buck MR, Remaley A, et al. (2003). Parathyroid gland-specific deletion of the mouse Men1 gene results in parathyroid neoplasia and hypercalcemic hyperparathyroidism. Cancer Res 63, 8022–8028. [PubMed] [Google Scholar]
- Lindström NO, De Sena Brandine G, Tran T, Ransick A, Suh G, Guo J, Kim AD, Parvez RK, Ruffins SW, Rutledge EA, et al. (2018). Progressive Recruitment of Mesenchymal Progenitors Reveals a Time-Dependent Process of Cell Fate Acquisition in Mouse and Human Nephrogenesis. Dev. Cell 45, 651–660.e4. [DOI] [PMC free article] [PubMed] [Google Scholar]
- Loffing J, Loffing-Cueni D, Valderrabano V, Kläusli L, Hebert SC, Rossier BC, Hoenderop JG, Bindels RJ, and Kaissling B (2001). Distribution of transcellular calcium and sodium transport pathways along mouse distal nephron. Am. J. Physiol. Renal Physiol 281, F1021–F1027. [DOI] [PubMed] [Google Scholar]
- Luetteke NC, Qiu TH, Fenton SE, Troyer KL, Riedel RF, Chang A, and Lee DC (1999). Targeted inactivation of the EGF and amphiregulin genes reveals distinct roles for EGF receptor ligands in mouse mammary gland development. Development 126, 2739–2750. [DOI] [PubMed] [Google Scholar]
- Marneros AG (2020). AP-2β/KCTD1 control distal nephron differentiation and protect against renal fibrosis. Dev. Cell 54, 348–366.e5. [DOI] [PMC free article] [PubMed] [Google Scholar]
- Marneros AG, Beck AE, Turner EH, McMillin MJ, Edwards MJ, Field M, de Macena Sobreira NL, Perez AB, Fortes JA, Lampe AK, et al. ; University of Washington Center for Mendelian Genomics (2013). Mutations in KCTD1 cause scalp-ear-nipple syndrome. Am. J. Hum. Genet 92, 621–626. [DOI] [PMC free article] [PubMed] [Google Scholar]
- Martin KJ, and González EA (2007). Metabolic bone disease in chronic kidney disease. J. Am. Soc. Nephrol 18, 875–885. [DOI] [PubMed] [Google Scholar]
- Moor MB, and Bonny O (2016). Ways of calcium reabsorption in the kidney. Am. J. Physiol. Renal Physiol 310, F1337–F1350. [DOI] [PubMed] [Google Scholar]
- Mount DB (2014). Thick ascending limb of the loop of Henle. Clin. J. Am. Soc. Nephrol 9, 1974–1986. [DOI] [PMC free article] [PubMed] [Google Scholar]
- Park J, Shrestha R, Qiu C, Kondo A, Huang S, Werth M, Li M, Barasch J, and Suszták K (2018). Single-cell transcriptomics of the mouse kidney reveals potential cellular targets of kidney disease. Science 360, 758–763. [DOI] [PMC free article] [PubMed] [Google Scholar]
- Quarles LD (2008). Endocrine functions of bone in mineral metabolism regulation. J. Clin. Invest 118, 3820–3828. [DOI] [PMC free article] [PubMed] [Google Scholar]
- Ransick A, Lindström NO, Liu J, Zhu Q, Guo JJ, Alvarado GF, Kim AD, Black HG, Kim J, and McMahon AP (2019). Single-cell profiling reveals sex, lineage, and regional diversity in the mouse kidney. Dev. Cell 51, 399–413.e7. [DOI] [PMC free article] [PubMed] [Google Scholar]
- Sato T, Courbebaisse M, Ide N, Fan Y, Hanai JI, Kaludjerovic J, Den-smore MJ, Yuan Q, Toka HR, Pollak MR, et al. (2017). Parathyroid hormone controls paracellular Ca2+ transport in the thick ascending limb by regulating the tight-junction protein Claudin14. Proc. Natl. Acad. Sci. USA 114, E3344–E3353. [DOI] [PMC free article] [PubMed] [Google Scholar]
- Schlingmann KP, Weber S, Peters M, Niemann Nejsum L, Vitzthum H, Klingel K, Kratz M, Haddad E, Ristoff E, Dinour D, et al. (2002). Hypomagnesemia with secondary hypocalcemia is caused by mutations in TRPM6, a new member of the TRPM gene family. Nat. Genet 31, 166–170. [DOI] [PubMed] [Google Scholar]
- Schultheis PJ, Lorenz JN, Meneton P, Nieman ML, Riddle TM, Flagella M, Duffy JJ, Doetschman T, Miller ML, and Shull GE (1998). Phenotype resembling Gitelman’s syndrome in mice lacking the apical Na+-Cl− cotransporter of the distal convoluted tubule. J. Biol. Chem 273, 29150–29155. [DOI] [PubMed] [Google Scholar]
- Simon DB, Karet FE, Hamdan JM, DiPietro A, Sanjad SA, and Lifton RP (1996a). Bartter’s syndrome, hypokalaemic alkalosis with hypercalciuria, is caused by mutations in the Na-K-2Cl cotransporter NKCC2. Nat. Genet. 13, 183–188. [DOI] [PubMed] [Google Scholar]
- Simon DB, Karet FE, Rodriguez-Soriano J, Hamdan JH, DiPietro A, Trachtman H, Sanjad SA, and Lifton RP (1996b). Genetic heterogeneity of Bartter’s syndrome revealed by mutations in the K+ channel, ROMK. Nat. Genet 14, 152–156. [DOI] [PubMed] [Google Scholar]
- Simon DB, Nelson-Williams C, Bia MJ, Ellison D, Karet FE, Molina AM, Vaara I, Iwata F, Cushner HM, Koolen M, et al. (1996c). Gitelman’s variant of Bartter’s syndrome, inherited hypokalaemic alkalosis, is caused by mutations in the thiazide-sensitive Na-Cl cotransporter. Nat. Genet 12, 24–30. [DOI] [PubMed] [Google Scholar]
- Simon DB, Lu Y, Choate KA, Velazquez H, Al-Sabban E, Praga M, Ca-sari G, Bettinelli A, Colussi G, Rodriguez-Soriano J, et al. (1999). Paracellin-1, a renal tight junction protein required for paracellular Mg2+ resorption. Science 285, 103–106. [DOI] [PubMed] [Google Scholar]
- Subramanya AR, and Ellison DH (2014). Distal convoluted tubule. Clin. J. Am. Soc. Nephrol 9, 2147–2163. [DOI] [PMC free article] [PubMed] [Google Scholar]
- van Abel M, Hoenderop JG, van der Kemp AW, Friedlaender MM, van Leeuwen JP, and Bindels RJ (2005). Coordinated control of renal Ca(2+) transport proteins by parathyroid hormone. Kidney Int 68, 1708–1721. [DOI] [PubMed] [Google Scholar]
- Van Otterloo E, Li H, Jones KL, and Williams T (2018). AP-2α and AP-2β cooperatively orchestrate homeobox gene expression during branchial arch patterning. Development 145, dev157438. [DOI] [PMC free article] [PubMed] [Google Scholar]
- Voets T, Nilius B, Hoefs S, van der Kemp AW, Droogmans G, Bindels RJ, and Hoenderop JG (2004). TRPM6 forms the Mg2+ influx channel involved in intestinal and renal Mg2+ absorption. J. Biol. Chem 279, 19–25. [DOI] [PubMed] [Google Scholar]
- Walder RY, Landau D, Meyer P, Shalev H, Tsolia M, Borochowitz Z, Boettger MB, Beck GE, Englehardt RK, Carmi R, and Sheffield VC (2002). Mutation of TRPM6 causes familial hypomagnesemia with secondary hypocalcemia. Nat. Genet 31, 171–174. [DOI] [PubMed] [Google Scholar]
- Will C, Breiderhoff T, Thumfart J, Stuiver M, Kopplin K, Sommer K, Günzel D, Querfeld U, Meij IC, Shan Q, et al. (2010). Targeted deletion of murine Cldn16 identifies extra- and intrarenal compensatory mechanisms of Ca2+ and Mg2+ wasting. Am. J. Physiol. Renal Physiol 298, F1152–F1161. [DOI] [PubMed] [Google Scholar]
- Xi Q, Hoenderop JG, and Bindels RJ (2009). Regulation of magnesium reabsorption in DCT. Pflugers Arch 458, 89–98. [DOI] [PubMed] [Google Scholar]
Associated Data
This section collects any data citations, data availability statements, or supplementary materials included in this article.
Supplementary Materials
Data Availability Statement
RNA-seq data has been deposited to the GEO database: GSE126326 and GSE130864.