Abstract
Background:
Gestational diabetes mellitus (GDM) is defined as the new onset of impairment in carbohydrate tolerance during pregnancy. The aim of the current study was to define fetal epicardial fat thickness (fEFT) changes that developed before 24 weeks of gestation, to evaluate the diagnostic effectiveness of fEFT in predicting GDM diagnosis, and to correlate fEFT values with hemoglobin A1C (HbA1C) values.
Methods:
The study included a total of 60 GDM patients and 60 control subjects. A record consisted of fEFT measurements, maternal body mass index, maternal subcutaneous fat thickness, and fetal subcutaneous fat thickness during sonographic screening performed at 18–22 gestational weeks. Fetal abdominal circumference (AC) values, estimated fetal weight (EFW), and fetal gender were also recorded.
Results:
The median fEFT measurement of the whole study population was 0.9 ± 0.21 mm; 1.05 ± 0.21 mm in the GDM patients, and 0.8 ± 0.15 mm in the control group. The median fEFT values of the GDM patients were significantly higher than those of the control group (P < 0.01). According to the correlation analysis results, a strong positive correlation was determined between the fEFT and HbA1C values (r = 0.71, P < 0.01), gestational week of the fetus (r = 0.76, P = P < 0.01), AC (r = 0.81, P < 0.01), and EFW (r = 0.71, P < 0.01). According to the receiver operating characteristic analysis results, a fEFT value of > 0.95 can predict GDM diagnosis with sensitivity of 65% and specificity of 88% (odds ratio = 13).
Conclusion:
fEFT values are increased in GDM cases, and the increase can be detected earlier than 24 weeks of gestation. fEFT values are positively correlated with HbA1C values and can serve as an early predictor for GDM diagnosis.
Keywords: Epicardial fat thickness, fetal, gestational diabetes mellitus, hemoglobin A1C, ultrasound
INTRODUCTION
Gestational diabetes mellitus (GDM) is defined as the new onset of impairment in carbohydrate tolerance during pregnancy. The reported incidence can increase up to 14%. GDM creates a risk for developing Type 2 diabetes mellitus (DM) after pregnancy, and Type 2 DM creates a cardiovascular risk for females. Therefore, the diagnosis and management of GDM are crucial.[1,2]
Epicardial fat tissue (EFT) is located between the myocardium and visceral pericardium. It is directly connected to the myocardium, and these tissues share the same microcirculation. EFT, which develops from the same embryogenic layer as visceral adipose tissue, maintains the energy supply to the heart, serves as an anatomic barrier, and can secrete hormones, such as adiponectin and leptin. EFT has been shown to be related to obesity, hypertension, insulin resistance, and coronary artery disease.[3,4] Previous studies have also shown that increased EFT measurements are related to increased insulin resistance in DM.[5] Pregnant women with an increased EFT measurement are at greater risk of preeclampsia.[6]
Together with the metabolic changes in GDM, fetal EFT (fEFT) is also affected, showing changes in comparison with normal pregnancies. There are some studies in literature indicating that fEFT increases in GDM and DM.[7,8,9] These studies have been mainly performed at 24–28 weeks of gestation and do not offer satisfactory information about the effectiveness of second-trimester fEFT measurements in predicting GDM. In addition, the above-mentioned studies have generally included relatively small number of patients.
According to our experience in daily practice, it can be considered that fEFT examination during the second trimester might be a predictor for a future (third trimester) GDM diagnosis. The aim of the current study was to define fEFT changes before 24 weeks of gestation, to evaluate the diagnostic effectiveness of fEFT in predicting future GDM diagnosis, and to correlate fEFT values with other parameters, such as hemoglobin A1C (HbA1C) and body mass index (BMI) in GDM cases.
MATERIALS AND METHODS
The study was conducted in accordance with the Declaration of Helsinki and was approved by the Institutional Local Ethics Committee (IRB number: 2013-KAEK-11/14305). Informed written consent was obtained from all patients prior to their enrollment in the study. All data were collected between June 2018 and December 2019.
All the pregnant who were referred to the radiology department for detailed morphological abnormality scans were examined to measure fEFT during the study period. Then, these pregnant were? followed up until the labor to get information about pregnancy outcomes, such as having GDM or any other diagnosis. GDM diagnosis was created according to the American Diabetes Association guidelines using the results of the oral glucose tolerance test (OGTT) and HbA1C values obtained at 24–28 weeks of gestation. OGTT results were acquired by both using two-step approach (100 g glucose load) and one-step approach (75 g glucose load) (a: one-step approach: after loading 75-g oral glucose, the glucose levels are measured at fasting, 1st h, and 2nd h; b: two-step approach: an initial screening was performed by measuring the plasma or serum glucose concentration 1 h after a 50-g oral glucose load [glucose challenge test (GCT)]), and a diagnostic OGTT was performed on that subset of women exceeding the glucose threshold value on the GCT. The threshold values for both 75 g and 100 g glucose load tests are shown in Tables 1 and 2.[10]
Table 1.
Diagnosis of gestational diabetes mellitus with a 100-g oral glucose load
| mg/dl | mmol/l | |
|---|---|---|
| Fasting | 95 | 5.3 |
| 1 h | 180 | 10 |
| 2 h | 155 | 8.6 |
| 3 h | 140 | 7.8 |
Two or more of the venous plasma concentrations must be met or exceeded for a positive diagnosis. The test should be done in the morning after an overnight fast of between 8 and 14 h and after at least 3 days of unrestricted diet (≥150 g carbohydrate/day) and unlimited physical activity. The subject should remain seated and should not smoke throughout the test
Table 2.
Diagnosis of gestational diabetes mellitus with a 75-g oral glucose load
| mg/dl | mmol/l | |
|---|---|---|
| Fasting | 95 | 5.3 |
| 1 h | 180 | 10 |
| 2 h | 155 | 8.6 |
Two or more of the venous plasma concentrations must be met or exceeded for a positive diagnosis. The test should be done in the morning after an overnight fast of between 8 and 14 h and after at least 3 days of unrestricted diet (≥150 g carbohydrate/day) and unlimited physical activity. The subject should remain seated and should not smoke throughout the test
According to the follow-up information, we constituted the GDM and control groups. The control group consisted of randomly selected healthy pregnant with similar age and BMI values of GDM group. Sixty GDM patients and 60 control patients were included in the current study. Exclusion criteria were (1) having a diagnosis of type 1 or 2 DM, (2) fetal abnormality detected at ultrasonography (US), (3) having an abnormal double (free beta-human chorionic gonadotropin and pregnancy-associated plasma protein A) and/or triple (alpha-fetoprotein, free human chorionic gonadotropin, and unconjugated estriol) screen test result, (4) coexisting morbidities (preeclampsia, thyroidal disorders, and coagulation problems), (5) multiple gestation pregnancy, and (6) the presence of fetal pericardial fluid. Flowchart of patient selection is shown in Figure 1.
Figure 1.
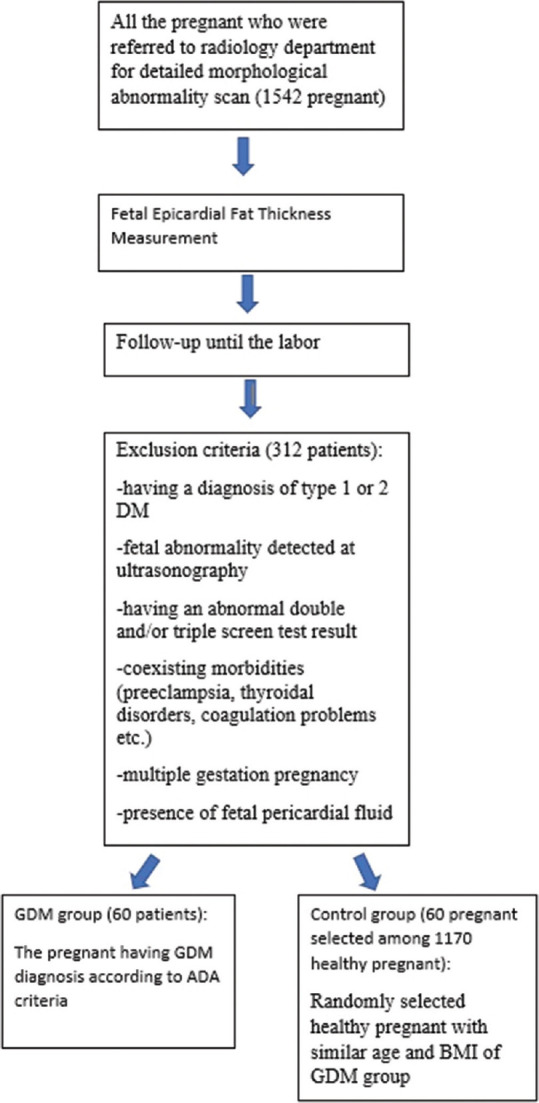
Flowchart for patient selection
fEFT measurements were performed from the standardized four-chamber view[11] at the midpoint of the ventricle wall. To be able to optimally discriminate the fetal epicardial fat from possible pericardial fluid, color Doppler US (CDUS) examination was used. The region measured as fetal epicardial fat was also evaluated with CDUS. If any signal was detected, then the case was excluded to prevent any confusion between fetal epicardial fat and pericardial fluid [Figures 2 and 3]. Abdominal circumference (AC) measurements were performed from the standardized view described in the literature.[12] Fetal subcutaneous fat thickness (fSFT)values were obtained from the same view together with AC [Figure 4]. Estimated fetal weight (EFW) was calculated on US according to the AC data, and the measurements were taken using a 3.5 MHz convex transducer (Toshiba, Xario). Maternal subcutaneous fat thickness (mSFT)values were obtained from the subxiphoid area using a 7 MHz linear transducer (Toshiba, Xario) [Figure 5].
Figure 2.
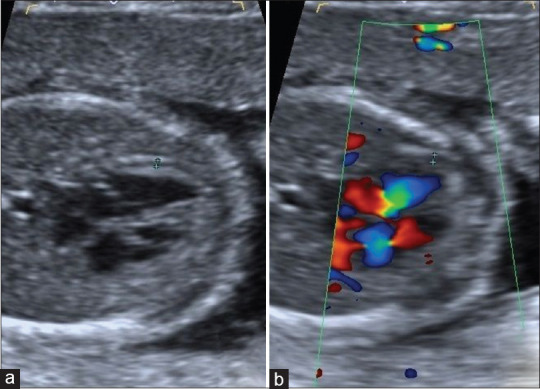
Fetal epicardial fat thickness measurement of a pregnant with gestational diabetes mellitus. Fetal epicardial fat thickness was measured as 1.4 mm (between calipers) (a). Color Doppler ultrasonography was used to eliminate pericardial fluid presence (b)
Figure 3.
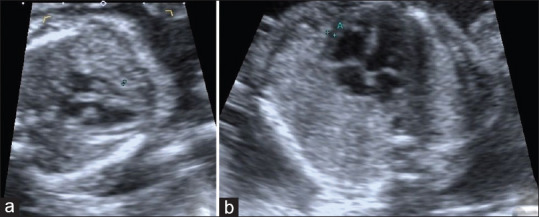
(a) 23-year-old healthy pregnant and 21-week-old fetus. Between calipers, fetal epicardial fat thickness is seen (0.9 mm). (b) 35-year-old pregnant with gestational diabetes mellitus and 21-week-old fetus. Between calipers, fetal epicardial fat thickness is seen (1.4 mm)
Figure 4.
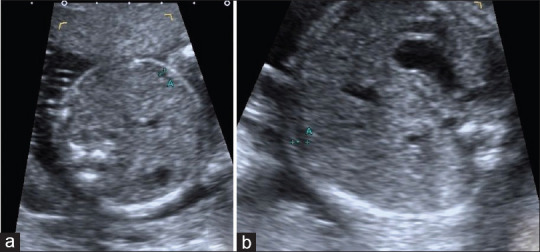
(a) 23-year-old healthy pregnant and 21-week-old fetus. Standardized abdominal circumference view, between calipers, fetal subcutaneous fat thickness is seen (2 mm). (b) 35-year-old pregnant with gestational diabetes mellitus and 21-week-old fetus. Standardized abdominal circumference view, between calipers, fetal subcutaneous fat thickness is seen (2.1 mm)
Figure 5.
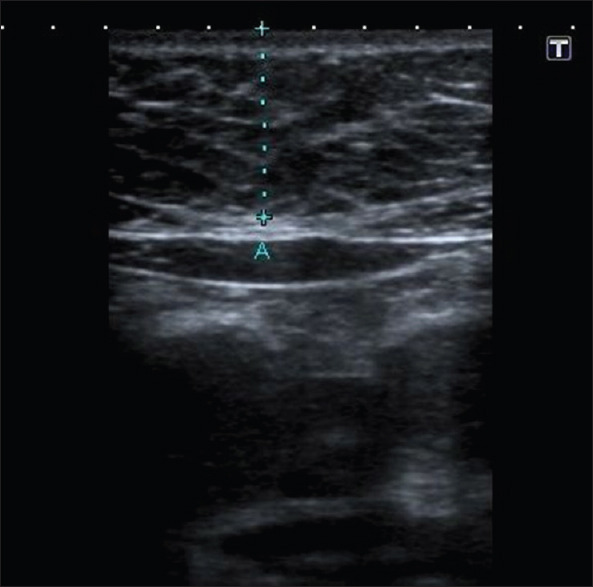
Maternal subcutaneous fat thickness measurement of 22-year-old pregnant with gestational diabetes mellitus (18 mm)
The HbA1C values and BMI values obtained at 24–28 weeks of gestation (at the same visit as the OGTT) were used, and other data were acquired from the medical records of the patients.
Statistical analysis
Data were analyzed using the Statistical Package for the Social Sciences (SPSS) 20 for Windows (IBM SPSS Inc., Chicago, IL, USA). Conformity of the data to normal distribution was evaluated with the Kolmogorov–Smirnov test. Numerical variables with normal distribution were shown as mean ± standard deviation values. The variables not showing normal distribution were shown as minimum–maximum values. Categorical variables were shown as number and percentage. For the comparison of numerical variables between the two groups, the Mann–Whitney U-test and Student's t-test were used. To define the possible correlations between fEFT and the other variables, Spearman and Pearson correlations were performed. Receiver operating characteristic (ROC) curve analysis was applied for diagnostic performance evaluation of fEFT values for GDM diagnosis. The Youden Index was used to define the predictive values of fEFT.
A two-tailed value of P < 0.05 was considered statistically significant.
RESULTS
The evaluation consisted of 60 GDM and 60 healthy, control pregnant women. All the US examinations were performed between 18 and 22 gestational weeks.
Of the total study population, 65 fetuses (54.2%) were male and 55 fetuses (45.8%) were female. In the GDM group, 34 fetuses (56.7%) were male and 26 fetuses (43.3%) were female. In the control group, 31 fetuses (51.7%) were male and 29 fetuses (48.3%) were female. The distribution of fetal gender was similar in the GDM and control groups.
The mean maternal age of the whole population was 32.10 ± 6.55 years; 33.46 ± 5.76 years in the GDM group and 31.75 ± 5.52 years in the control group. The mean maternal age was similar in the GDM patients and the control group.
The median BMI value of the whole population was 29 ± 2.44; 29 ± 2.17 in the GDM group and 29 ± 2.41 in the control group. The median BMI values were similar in both the groups.
The median mSFT value of the whole population was 15 ± 1.52 mm; 15 ± 1.67 in the GDM group and 15 ± 1.37 in the control group. The median mSFT values of the GDM patients and the control group were similar.
The mean HbA1C value of the whole population was 6% ± 0.78%; 6.50% ± 0.59 in the GDM group and 5.50% ± 0.68% in the control group. The mean HbA1C values of GDM patients were statistically significantly higher than those of the control group (P < 0.01).
The mean AC value of all the fetuses was 153.76 ± 16.72 mm; 155.25 ± 18.60 mm in the GDM group and 152.28 ± 14.59 mm in the control group. The mean AC values of the GDM patients and the control group were similar.
The median EFW value of all the fetuses was 340 ± 102.7 g; 335.5 ± 98.90 in the GDM group and 325.5 ± 104.8 in the control group. The median EFW values of the GDM patients and the control group were similar.
The median fSFT value of the whole population was 2.10 ± 0.19 mm; 2 ± 0.15 in the GDM group and 2.10 ± 0.21 in the control group. The median fSFT values of the GDM patients and the control group were similar.
The median fEFT measurement of the whole population was 0.9 ± 0.21 mm; 1.05 ± 0.21 in the GDM group and 0.8 ± 0.15 in the control group. The median fEFT values of the GDM patients were significantly higher than those of the control group (P < 0.01).
The mean/median values of the parameters and the changes according to the subgroups are shown in Table 3.
Table 3.
Distribution of the variables according to gestational diabetes mellitus and control subgroups
| Variables | GDM group | Control group | P |
|---|---|---|---|
| Male fetus (%) | 34 (56.7) | 31 (51.7) | >0.05 |
| Female fetus (%) | 26 (43.3) | 29 (48.3) | >0.05 |
| Mean maternal age | 33.46±5.76 | 31.75±5.52 | >0.05 |
| Median maternal BMI | 29±2.17 | 29±2.41 | >0.05 |
| Median mSFT (mm) | 15±1.67 | 15±1.37 | >0.05 |
| Median HbA1C (%) | 6.50±0.59 | 5.50±0.68 | <0.01 |
| Mean AC (mm) | 155.25±18.60 | 152.28±14.59 | >0.05 |
| Median EFW (gr) | 335.5±98.90 | 325.5±104.8 | >0.05 |
| Median fSFT (mm) | 2±0.15 | 2.10±0.21 | >0.05 |
| Median fEFT (mm) | 1.05±0.21 | 0.8±0.15 | <0.01 |
P<0.05 statistical significance. BMI: Body mass index, mSFT: Maternal subcutaneous fat thickness, HbA1C: Hemoglobin A1C, AC: Abdominal circumference, EFW: Estimated fetal weight, fSFT: Fetal subcutaneous fat thickness, fEFT: Fetal epicardial fat thickness, GDM: Gestational diabetes mellitus
According to the correlation analysis results of the whole population, there was a strong positive correlation between the fEFT values and HbA1C values (r = 0.71, P < 0.01) and the gestational week of the fetus (r = 0.76, P = P < 0.01), AC measurements (r = 0.81, P < 0.01), and EFW (r = 0.71, P < 0.01). There was also determined to be a weak positive correlation between fEFT values and maternal age (r = 0.34, P < 0.01) and maternal BMI (r = 0.26, P < 0.01) [Table 4].
Table 4.
Correlations of fetal epicardial fat thickness values in the whole population
| HbA1C | Gestational week | AC | EFW | Maternal Age | Maternal BMI | |
|---|---|---|---|---|---|---|
| fEFT value | ||||||
| r | 0.71 | 0.76 | 0.81 | 0.71 | 0.34 | 0.26 |
| P | 0.00 | 0.004 | 0.005 | 0.004 | 0.00 | 0.00 |
P<0.05 statistical significance. HbA1C: Hemoglobin A1C, AC: Abdominal circumference, EFW: Estimated fetal weight, fEFT: Fetal epicardial fat thickness, BMI: Body mass index
The correlation analysis results of the subgroups showed that positive correlations between fEFT values and HbA1C, gestational week of the fetus, and AC/EFW values continued, whereas there were no continuing correlations between fEFT values and maternal age and maternal BMI [Tables 5a and b].
Table 5a.
Correlations of fetal epicardial fat thickness values in gestational diabetes mellitus group
| HbA1C | Gestational week | AC | EFW | Maternal Age | Maternal BMI | |
|---|---|---|---|---|---|---|
| fEFT value | ||||||
| r | 0.49 | 0.93 | 0.91 | 0.94 | 0.23 | 0.32 |
| P | 0.02 | 0.01 | 0.00 | 0.00 | 0.07 | 0.08 |
P<0.05 statistical significance. HbA1C: Hemoglobin A1C, AC: Abdominal circumference, EFW: Estimated fetal weight, fEFT: Fetal epicardial fat thickness, BMI: Body mass index
Table 5b.
Correlations of fetal epicardial fat thickness values in the control group
| HbA1C | Gestational week | AC | EFW | Maternal Age | Maternal BMI | |
|---|---|---|---|---|---|---|
| fEFT value | ||||||
| r | 0.62 | 0.90 | 0.89 | 0.91 | 0.10 | 0.09 |
| P | 0.00 | 0.01 | 0.00 | 0.00 | 0.44 | 0.45 |
P<0.05 statistical significance. HbA1C: Hemoglobin A1C, AC: Abdominal circumference, EFW: Estimated fetal weight, fEFT: Fetal epicardial fat thickness, BMI: Body mass index
According to the ROC analysis results, when a fEFT value of 0.95 is accepted as a cutoff value, the presence of GDM diagnosis can be predicted with a sensitivity of 65% and specificity of 88% (odds ratio = 13) [Figure 6].
Figure 6.
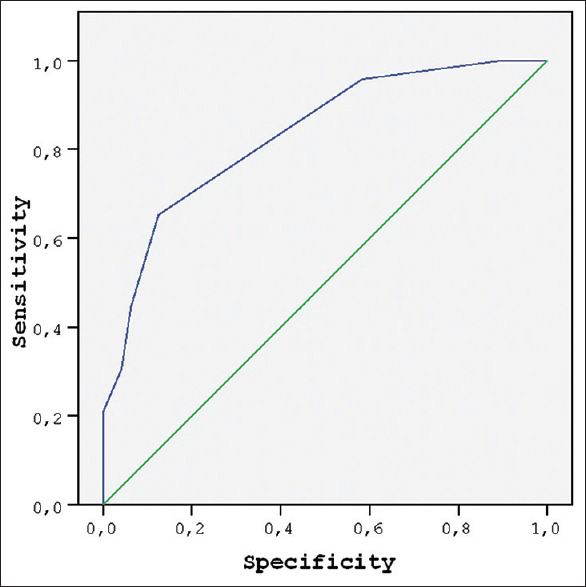
Receiver operating characteristic curve of fetal epicardial fat thickness values to predict gestational diabetes mellitus
DISCUSSION
According to the results of the current study, fEFT measured during the second trimester can serve as an early predictor for GDM. fEFT was found to be higher in pregnant patients with GDM than in the normal controls. The fEFT measurements were positively correlated with HbA1C values.
EFT is known to have important metabolic effects.[9] EFT measurements and the investigation of possible correlations of EFT with metabolic syndrome and/or coronary heart diseases are frequent topics of research.[13,14] Previous publications have shown a significant correlation between EFT and blood glucose levels, DM, obesity, and insulin resistance in adult populations.[15,16] A relationship between mEFT and fasting glucose levels has also been identified in a nondiabetic population.[17]
The alterations in fEFT values in GDM are a relatively new subject of the research. There are a limited number of studies that have focused on this subject. The previous publications on this topic have included smaller populations,[7,8,9] have been performed retrospectively,[7,9] have generally been performed after 24 weeks of gestation,[8,9] and have not provided information about the effectiveness of fEFT in predicting GDM diagnosis.[7,8,9] Consistent with the literature, the current study results showed that fEFT values increased in GDM. When the parameters affecting the mentioned increase were evaluated, a strong positive correlation was determined between fEFT values and HbA1C, gestational week, and AC/EFW values.
In the previous studies, there were similar results about the positive relationship between fEFT and AC/EFW values.[7] The offspring of patients with GDM are known to have greater AC and EFW values.[18] This information can confirm the possible effect of GDM on fEFT when considered together with the positive relationship of fEFT and AC/EFW values. The above-mentioned correlation could also be the result of the previously defined effect of EFT on obesity.[16] However, there is a slight difference between the current study results and another recent study,[7] in which it was stated that a positive correlation between fEFT and AC/EFW was only present in GDM cases not in the control group. In contrast, the correlation was seen to be present in both the groups in the current study. This difference could be due to the different population sizes.
In the current study, a positive correlation was determined between fEFT and gestational week in both the GDM and control groups. This result was expected as an effect of fetal growth. Gestational week was not statistically different in the GDM and control groups, so this relationship could not have affected the significant difference in the fEFT values between the subgroups.
The relationship between fEFT values and HbA1C has not been previously examined in the literature. There are publications stating the relationship between mEFT and HbA1C values,[19] but there is no information about fEFT and maternal HbA1C levels. As a contribution to the literature, the results of this study demonstrate a significant positive correlation between fEFT and maternal HbA1C levels. This correlation can also explain the effect on fEFT values of the metabolic changes occurring in GDM cases. In addition, the current study results showed that the fEFT value measured before 22 weeks of gestation, of > 0.95 mm, can predict GDM diagnosis after 24 weeks of gestation with a sensitivity of 65% and specificity of 88%. To the best of our knowledge, there is no cutoff value for fEFT to predict GDM in the available literature. This cutoff value can serve as an early indicator of possible GDM presence and can be detected in the routine morphological sonographic anomaly screening, earlier than the OGTT test for GDM.
There is limited information in literature about the relationship between maternal age, maternal BMI, and fEFT. In a recent study,[7] it was stated that maternal BMI is not related with fEFT values. Similarly, in the current study, a weak correlation was determined between these parameters in the whole population, and the relationship was not seen in the subgroup analysis. Thus, no significant relationship could be determined between maternal BMI values and fEFT, as well as maternal age.
Only one previous study has examined the relationship between fSFT and fEFT.[7] Similar results were obtained in the current study with no significant correlation determined between fSFT and fEFT values. This could be attributed to the time of examination, as US examinations performed in the last trimester might reveal correlations between these parameters.
No relationship was determined between mSFT, fetal gender, and fEFT values. To the best of our knowledge, no previous study has examined these parameters.
All the similar studies in literature have used fetal echocardiography to measure fEFT.[7,8,9] In contrast, the current study results showed that fEFT values can be measured during routine second-trimester US screening.
The study had some limitations. First, not all the participants could be evaluated by both of the researchers, so interobserver reliability data of fEFT could not be presented. It was attempted to eliminate potential cases with pericardial fluid to be able to provide a more correct fEFT measurement. However, small amount of pericardial fluid may still be confused with fetal epicardial fat, and this might have decreased the reliability of the results.
CONCLUSION
fEFT values are increased in GDM cases, and the increase can be detected earlier than 24 weeks of gestation. fEFT values are positively correlated with HbA1C values and can serve as an early predictor for GDM diagnosis.
Financial support and sponsorship
Nil.
Conflicts of interest
There are no conflicts of interest.
REFERENCES
- 1.Nar G, Inci S, Aksan G, Unal OK, Nar R, Soylu K. The relationship between epicardial fat thickness and gestational diabetes mellitus. Diabetol Metab Syndr. 2014;6:120. doi: 10.1186/1758-5996-6-120. [DOI] [PMC free article] [PubMed] [Google Scholar]
- 2.Noussitou P, Monbaron D, Vial Y, Gaillard RC, Ruiz J. Gestational diabetes mellitus and the risk of metabolic syndrome: A population-based study in Lausanne, Switzerland. Diabetes Metab. 2005;31:361–9. doi: 10.1016/s1262-3636(07)70205-7. [DOI] [PubMed] [Google Scholar]
- 3.Gorter PM, de Vos AM, van der Graaf Y, Stella PR, Doevendans PA, Meijs MF, et al. Relation of epicardial and pericoronary fat to coronary atherosclerosis and coronary artery calcium in patients undergoing coronary angiography. Am J Cardiol. 2008;102:380–5. doi: 10.1016/j.amjcard.2008.04.002. [DOI] [PubMed] [Google Scholar]
- 4.Rosito GA, Massaro JM, Hoffmann U, Ruberg FL, Mahabadi AA, Vasan RS, et al. Pericardial fat, visceral abdominal fat, cardiovascular disease risk factors, and vascular calcification in a community-based sample: The Framingham heart study. Circulation. 2008;117:605–13. doi: 10.1161/CIRCULATIONAHA.107.743062. [DOI] [PubMed] [Google Scholar]
- 5.Cetin M, Cakici M, Polat M, Suner A, Zencir C, Ardic I. Relation of epicardial fat thickness with carotid intima-media thickness in patients with type 2 diabetes mellitus. Int J Endocrinol. 2013;2013:769175. doi: 10.1155/2013/769175. [DOI] [PMC free article] [PubMed] [Google Scholar]
- 6.Can MM, Can E, Ozveren O, Okuyan E, Ayca B, Dinckal MH. Epicardial fat tissue thickness in preeclamptic and normal pregnancies. ISRN Obstet Gynecol. 2012;2012:389539. doi: 10.5402/2012/389539. [DOI] [PMC free article] [PubMed] [Google Scholar]
- 7.Jackson D, Deschamps D, Myers D, Fields D, Knudtson E, Gunatilake R. Fetal epicardial fat thickness in diabetic and non-diabetic pregnancies: A retrospective cross-sectional study. Obesity (Silver Spring) 2016;24:167–71. doi: 10.1002/oby.21353. [DOI] [PubMed] [Google Scholar]
- 8.Yavuz A, Akkurt MO, Yalcin S, Karakoc G, Varol E, Sezik M. Second trimester fetal and maternal epicardial fat thickness in gestational diabetic pregnancies. Horm Metab Res. 2016;48:595–600. doi: 10.1055/s-0042-111435. [DOI] [PubMed] [Google Scholar]
- 9.Akkurt MO, Turan OM, Crimmins S, Harman CR, Turan S. Increased fetal epicardial fat thickness: A novel ultrasound marker for altered fetal metabolism in diabetic pregnancies. J Clin Ultrasound. 2018;46:397–402. doi: 10.1002/jcu.22602. [DOI] [PubMed] [Google Scholar]
- 10.American Diabetes Association. 2.Classification and diagnosis of diabetes: Standards of medical care in diabetes-2018. Diabetes Care. 2018;41:S13–27. doi: 10.2337/dc18-S002. [DOI] [PubMed] [Google Scholar]
- 11.Shultz SM, Pretorius DH, Budorick NE. Four-chamber view of the fetal heart: Demonstration related to menstrual age. J Ultrasound Med. 1994;13:285–9. doi: 10.7863/jum.1994.13.4.285. [DOI] [PubMed] [Google Scholar]
- 12.Bethune M, Alibrahim E, Davies B, Yong E. A pictorial guide for the second trimester ultrasound. Australas J Ultrasound Med. 2013;16:98–113. doi: 10.1002/j.2205-0140.2013.tb00106.x. [DOI] [PMC free article] [PubMed] [Google Scholar]
- 13.Ahn SG, Lim HS, Joe DY, Kang SJ, Choi BJ, Choi SY, et al. Relationship of epicardial adipose tissue by echocardiography to coronary artery disease. Heart. 2008;94:e7. doi: 10.1136/hrt.2007.118471. [DOI] [PubMed] [Google Scholar]
- 14.Nakazato R, Dey D, Cheng VY, Gransar H, Slomka PJ, Hayes SW, et al. Epicardial fat volume and concurrent presence of both myocardial ischemia and obstructive coronary artery disease. Atherosclerosis. 2012;221:422–6. doi: 10.1016/j.atherosclerosis.2011.12.018. [DOI] [PubMed] [Google Scholar]
- 15.Sengul C, Ozveren O, Duman D, Eroglu E, Oduncu V, Tanboga HI, et al. Echocardiographic epicardial fat thickness is related to altered blood pressure responses to exercise stress testing. Blood Press. 2011;20:303–8. doi: 10.3109/08037051.2011.569992. [DOI] [PubMed] [Google Scholar]
- 16.Iacobellis G, Willens HJ. Echocardiographic epicardial fat: A review of research and clinical applications. J Am Soc Echocardiogr. 2009;22:1311–9. doi: 10.1016/j.echo.2009.10.013. [DOI] [PubMed] [Google Scholar]
- 17.Iacobellis G, Barbaro G, Gerstein HC. Relationship of epicardial fat thickness and fasting glucose. Int J Cardiol. 2008;128:424–6. doi: 10.1016/j.ijcard.2007.12.072. [DOI] [PubMed] [Google Scholar]
- 18.Bethune M, Bell R. Evaluation of the measurement of the fetal fat layer, interventricular septum and abdominal circumference percentile in the prediction of macrosomia in pregnancies affected by gestational diabetes. Ultrasound Obstet Gynecol. 2003;22:586–90. doi: 10.1002/uog.885. [DOI] [PubMed] [Google Scholar]
- 19.Akkurt MO, Higgs A, Turan OT, Turan OM, Turan S. Prenatal diagnosis of inverted duplication deletion 8p syndrome mimicking trisomy 18. Am J Med Genet A. 2017;173:776–9. doi: 10.1002/ajmg.a.38074. [DOI] [PubMed] [Google Scholar]


