Abstract
The nervous system is hypothesized to compute reward prediction errors (RPEs) to promote adaptive behavior. Correlates of RPEs have been observed in the midbrain dopamine system, but the extent to which RPE signals exist in other regions implicated in reward processing is less well understood. Here, we quantified outcome history-based RPE signals in the ventral pallidum (VP), a basal ganglia nucleus functionally linked to reward-seeking behavior. We trained rats to respond to reward-predicting cues and fit computational models to the firing rates of individual neurons at the time of reward delivery. We found that a subset of VP neurons encoded RPEs and did so more robustly than nucleus accumbens, an input to VP. VP RPEs predicted changes in task engagement, and optogenetic manipulation of VP during reward delivery bidirectionally altered rats’ subsequent reward-seeking behavior. Our data suggest a pivotal role for VP in computing teaching signals that influence adaptive reward seeking.
INTRODUCTION
Adaptive behavior is characterized by responding flexibly to stimuli in our environments. The framework of reinforcement learning is a well-established approach for describing how individuals flexibly interact with environments to maximize reward (1). Reinforcement learning frameworks formalize the notion that individuals integrate information about past rewards to make predictions about the future. Deviations from these predictions, known as reward prediction errors (RPEs), are used to iteratively update future predictions (2). One remarkable extension of reinforcement learning to neuroscience was the discovery that midbrain dopamine neurons encode RPEs (3) and do so over local timescales (4).
Although the midbrain dopamine system has been extensively studied for its role in learning, many limbic regions are involved in reward-guided behavior, and a role for RPE signals across this broader circuit has been largely overlooked. One candidate is the ventral pallidum (VP), a region critical for numerous reward-based behaviors (5; 6). VP is part of the ventral striatopallidal system within the basal ganglia. Historically, VP has been viewed primarily as an output of the nucleus accumbens (NAc), transmitting reward-related information from the NAc to downstream motor regions to mediate behavioral responses (7; 5; 6). However, this view has recently been challenged, and VP is now known to encode neural representations that are not directly inherited from striatum (8; 9; 10; 11). This has renewed interest in VP as an important site for reward processing in its own right. Large fractions of VP neurons are responsive to reward-related task events (12; 13; 8; 9; 10), and there are hints that some VP neural activity is consistent with an RPE signal (14; 15; 16). Moreover, phasic manipulations of VP activity impact reward-based behaviors (8; 17; 18; 15), suggesting links between the reward-related computations in VP and behavioral responses.
Here, by recording from VP in rats performing a series of reward-seeking tasks, we demonstrate that VP neural activity is quantitatively consistent with an RPE signal. By adapting and fitting computational models to predict spike counts of individual neurons, we classify a subset of VP neurons as RPE-encoding. Importantly, we demonstrate that our RPE model predicts key features of VP neural activity, including RPE tuning and trial-by-trial firing rates, in contrast to poorer prediction of these features by the nucleus accumbens (NAc), a main input to VP. We further find that VP RPE neuron activity predicts subsequent task engagement, and optogenetic manipulation of VP bidirectionally impacts task engagement.
RESULTS
Ventral pallidum neurons signal prediction errors according to reward preference
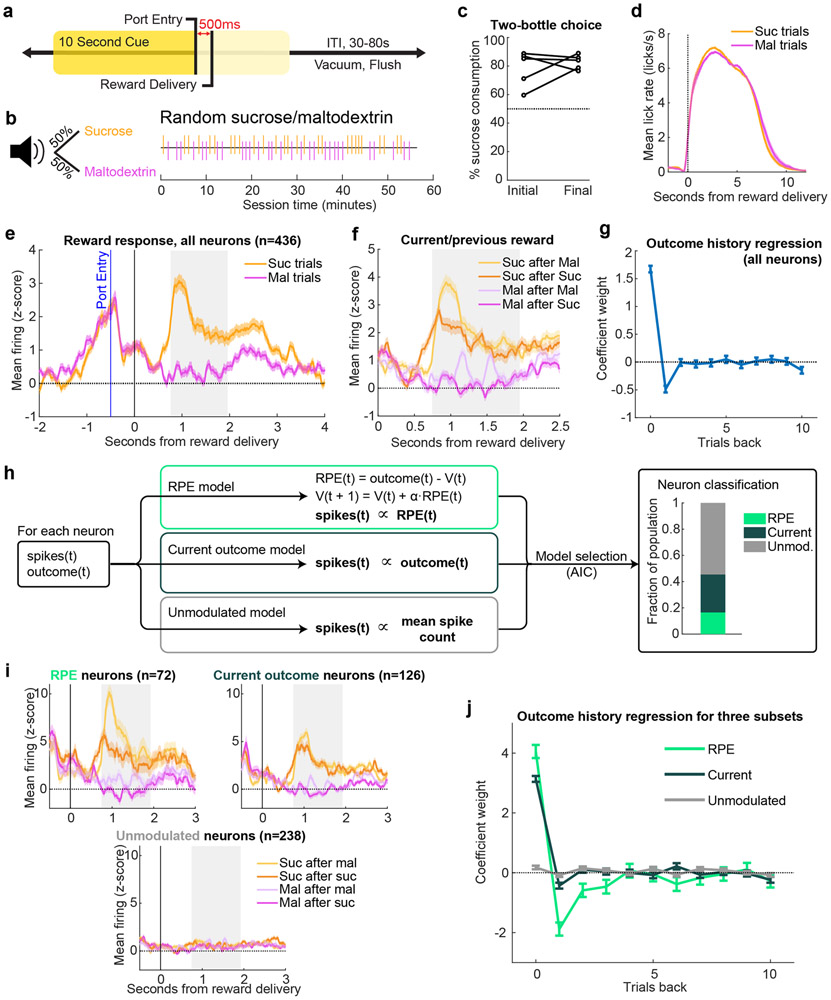
Rats were trained to respond to a 10-second white noise cue indicating the availability of 10% solutions of either sucrose or maltodextrin contingent upon entry into the reward port (Fig. 1a). In this task (“random sucrose/maltodextrin”), there was only one cue, which predicted sucrose or maltodextrin reward with equal probability. This task design ensured rats could not accurately predict upcoming reward identity (Figure 1b). As reported (19; 9), rats preferred sucrose when given free access to both sucrose and maltodextrin in their homecage, despite the rewards’ equivalent caloric value (Fig. 1c). Nevertheless, they licked robustly for both during the task (Figure 1d) reflecting the high palatability of both outcomes. This feature allowed us to control for a contribution of motor responses to reward-specific neural activity. We recorded the activity of 436 VP neurons while rats (n = 5) performed the task (Extended Data Fig. 1) (some analyses of these recordings were published previously (9)). Despite similar licking patterns, sucrose and maltodextrin evoked significantly different neural responses, with higher mean firing rate when sampling sucrose (Wilcoxon sign-rank test on all neurons’ mean firing 0.75-1.95s after sucrose or maltodextrin delivery, p < 10−10), consistent with the rats’ preference for sucrose (Fig. 1e). Moreover, the previous outcome modulated the reward signal in a direction consistent with reward prediction error (RPE) coding (Fig. 1f). For example, receiving sucrose on the previous trial increased expectation of future sucrose, leading to decreased firing when sucrose was delivered on the current trial. The expected trend held true for all combinations of past/current outcomes, suggesting that VP neural activity may contain an RPE signal.
Figure 1. A subset of ventral pallidum neurons signal preference-based reward prediction errors.
(a, c-f) are adapted from (9). (a) Task: entering the reward port during a 10s cue triggered reward delivery. (b) The cue indicated 50/50 probability of receiving sucrose or maltodextrin solutions, as seen in example session (right). (c) Percentage sucrose of total solution consumption in a two-bottle choice, before (“Initial”) and after (“Final”) recording. (d) Mean(+/−SEM) lick rate relative to pump onset. (e) Mean(+/−SEM) activity of all recorded neurons on sucrose (Suc) and maltodextrin (Mal) trials.Gray rectangle indicates window used for analysis in (g-h,j) and all equivalent analyses in subsequent figures. (f) Mean(+/−SEM) activity of all recorded neurons on trials sorted by previous and current outcome. (g) Coefficients(+/−SE) from a linear regression fit to the z-scored activity of all neurons (n=436 neurons) and the outcomes on the current and preceding 10 trials. (h) Schematic of model-fitting and neuron classification process. For each neuron, the reward outcome and spike count following reward delivery on each trial were used to fit three models: RPE, Current outcome, and Unmodulated. Akaike information criterion (AIC) was used to select which model best fit each neuron’s activity (right). (i) Mean(+/−SEM) activity of neurons best fit by each of the three models, plotted according to previous and current outcome. (j) Coefficients(+/−SE) for outcome history linear regression for each class of neurons (n=72 RPE, 126 Current outcome, and 238 Unmodulated neurons).
Intrigued by the possibility of RPE signaling in VP, we expanded upon these initial findings by quantifying the impact of current and previous outcomes on reward-evoked firing in VP. We applied a linear regression that has previously been used to quantify the effect of reward history on dopamine neuron firing (4). When the activity of all neurons was pooled, only the current trial and previous trial significantly impacted firing rates at the time of the outcome (Fig. 1g). While this pattern is consistent with RPE coding, it is on a much shorter timescale than has been observed for dopamine neurons (4; 20). One limitation of the pooled linear regression approach is it assumed that VP is largely homogeneous, which risks introducing bias into coefficient estimates. This left open the possibility that VP contains subsets of neurons encoding reward history on longer timescales and led us to analyze individual neuronal responses.
To identify neurons in VP sensitive to reward history, we developed three computational models to fit firing rates of individual neurons, corresponding to three potential patterns of neuronal activity. The first model, ‘RPE,’ is based on the Rescorla-Wagner model (2). The model generated trial-by-trial value estimates (V) which constitute reward predictions. On each trial, an RPE was generated by the difference between actual and predicted rewards, and this RPE was multiplied by a learning rate (α) before updating V for the next trial. Small learning rate values allow for integration of reward history multiple trials into the past. The spike counts of individual neurons were fit to the estimated RPE on each trial (Fig. 1h). We also fit two additional models to serve as controls, one in which the spike count was determined only by the current outcome (‘Current outcome’), and one with no impact of outcome (‘Unmodulated’). We used maximum likelihood estimation to fit the models to each neuron and selected the most parsimonious model using the Akaike information criterion (AIC), which selects the best-fit model after penalizing for model complexity. This classification process revealed that 17% of VP neurons were best described by the RPE model, and another 29% were best fit by the Current outcome only (Fig. 1h); notably, of the 47% of neurons we had previously classified as sucrose-preferring in our prior work (9), 74% were classified as either RPE or Current outcome here, demonstrating general agreement between the approaches.
We plotted the mean reward-evoked activity of each subset of neurons according to previous and current outcome and found that the firing rates of each subset matched the properties of the models with which they were classified (Figure 1i). For instance, 86% of RPE neurons had both higher firing rates for sucrose following maltodextrin than for sucrose following sucrose (positive RPE) and lower firing rates for maltodextrin following sucrose than for maltodextrin following maltodextrin (negative RPE). We then performed the same outcome history linear regression on each subset of neurons rather than the entire population; this revealed an exponential decay-like influence of multiple previous trials on firing of neurons best fit by the RPE model, indicating that VP neurons modulated by reward history were in fact integrating information over a more extended period of time (Fig. 1j, significant weights for 1-3 trials back). Indeed, the mean (median) learning rate across all neurons was 0.56 (0.52); this corresponds to an exponential learning process with a half-life of 0.84 (0.94) trials, indicating that neurons accumulate information over ~ 4.22 (4.72) trials to reach a steady-state value estimate (full distribution in Extended Data Fig. 2a). Thus, given the closely-matched caloric value and motor responses to each reward, these data indicate that some VP neurons signal an outcome history-based RPE according to reward preference.
VP encodes reward preference RPEs more robustly than nucleus accumbens, a key input region
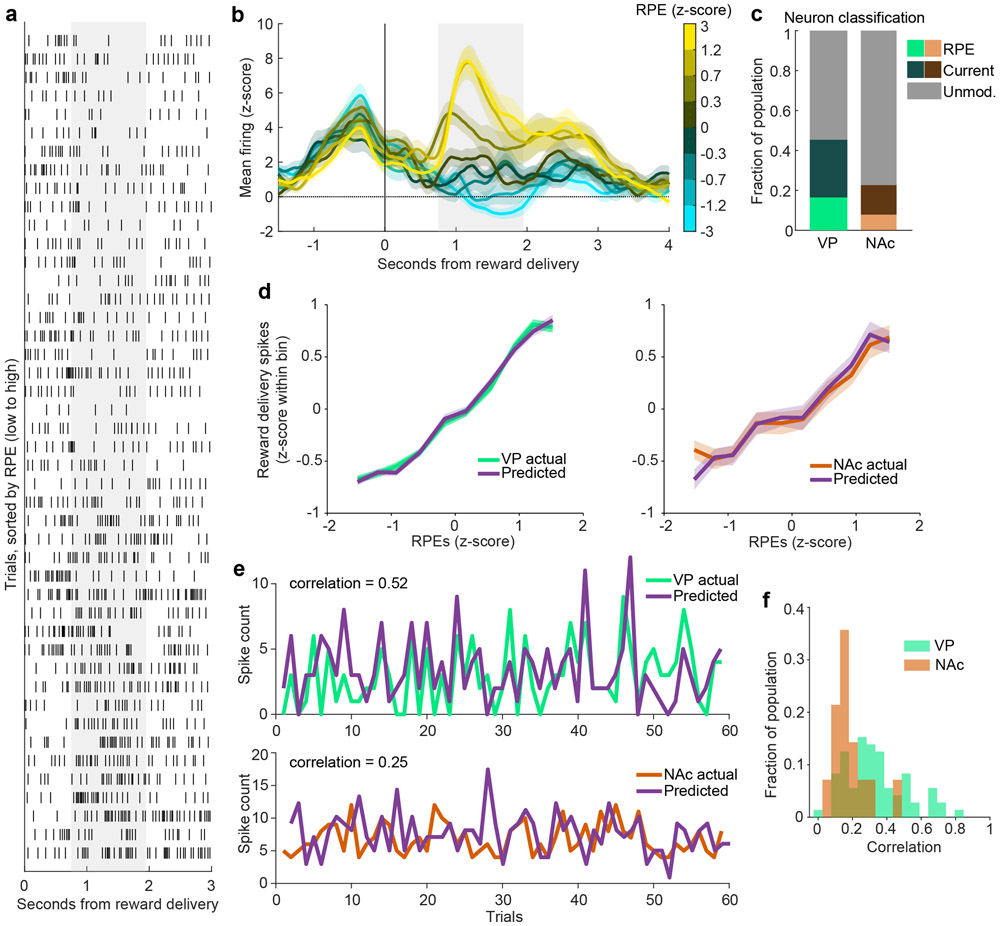
We next asked how faithfully VP neurons encoded RPEs. Our fitting procedure allowed recovery of trial-by-trial estimates of RPEs, based on parameter estimates for that individual neuron as well as the outcome history for that session. Model-derived RPEs were strongly correlated with the activity of individual neurons (Fig 2a) and the average activity across all RPE neurons (Fig 2b). Importantly, this approach revealed a finer dynamic range of firing than revealed by only looking at current and previous outcomes (Fig. 1i). We next generated RPE tuning curves for these neurons and found a strong monotonic relationship (t3,961 = 41.3, p < 10−10, linear relationship between RPEs and z-scored firing rates). As a stronger test, we used parameters estimated for each neuron to simulate RPE-correlated spike counts and generated an ‘ideal’ RPE tuning curve. We observed a clear overlap between real and simulated tuning curves (Fig 2d). Finally, we quantified the correlation between predicted and real spike counts and found good agreement (Pearson’s correlation coefficient: mean - 0.34, median - 0.31; Fig 2e-f).
Figure 2. RPE encoding is more prevalent and robust in VP than in NAc.
(a) Raster of an individual VP neuron’s spikes on each trial, aligned to reward delivery, and sorted by the model-derived RPE value for each trial. Gray shaded region indicates window used for analysis. (b) Population mean(+/−SEM) of all VP RPE neurons identified in Fig. 1. The trials for each neuron are binned according to their model-derived RPE. (c) Proportion of the population in VP and NAc classified as RPE, Current outcome, or Unmodulated. There were fewer RPE cells in NAc than in VP (8% versus 17%, χ2 = 8.3, p = 0.004) and Current outcome cells (14% in NAc versus 29% in VP, χ2 = 13.6, p = 0.0002). (d) Mean(+/−SEM) population activity of simulated and actual RPE neurons according to each trial’s RPE value for VP (top) and NAc (bottom). (e) The model-predicted and actual spike counts on each trial for one RPE neuron each from VP (top) and NAc (bottom). These neurons were the 85th percentile for correlation for each respective region. (f) Distribution of correlations between model-predicted and actual spiking for all RPE neurons from each region.
To contextualize the robustness of VP RPE responses, we ran the same analysis on neurons (n = 183) recorded during the same task in nucleus accumbens (NAc) (9) (Extended Data Fig. 1), a major VP input (7; 5; 6). We found fewer cells with activity best fit by the RPE model in NAc than in VP (8% versus 17%, χ2 = 8.3, p = 0.004) and by the Current outcome model (14% in NAc versus 29% in VP, χ2 = 13.6, p = 0.0002) (Fig. 2c). Moreover, NAc neurons classified as RPE-signaling were described less well by the model than similarly classified VP neurons. This was evident by a poorer match between real and simulated neuron tuning curves (mean squared error between real and simulated tuning curves; bootstrapped 95% confidence intervals: [1.24 1.38] in VP, [1.44 1.77] in NAc; Fig. 2d) and in poorer correlation between model-predicted and actual spiking for individual RPE neurons (Pearson’s correlation coefficient: mean - 0.18, median - 0.15; Wilcoxon rank-sum test p < 0.001; Fig. 2e-f). Thus, in the current task, VP has more robust RPE signaling than NAc, a notable finding since VP is considered to inherit its firing from NAc.
An expanded value space reveals stronger RPE signaling in VP
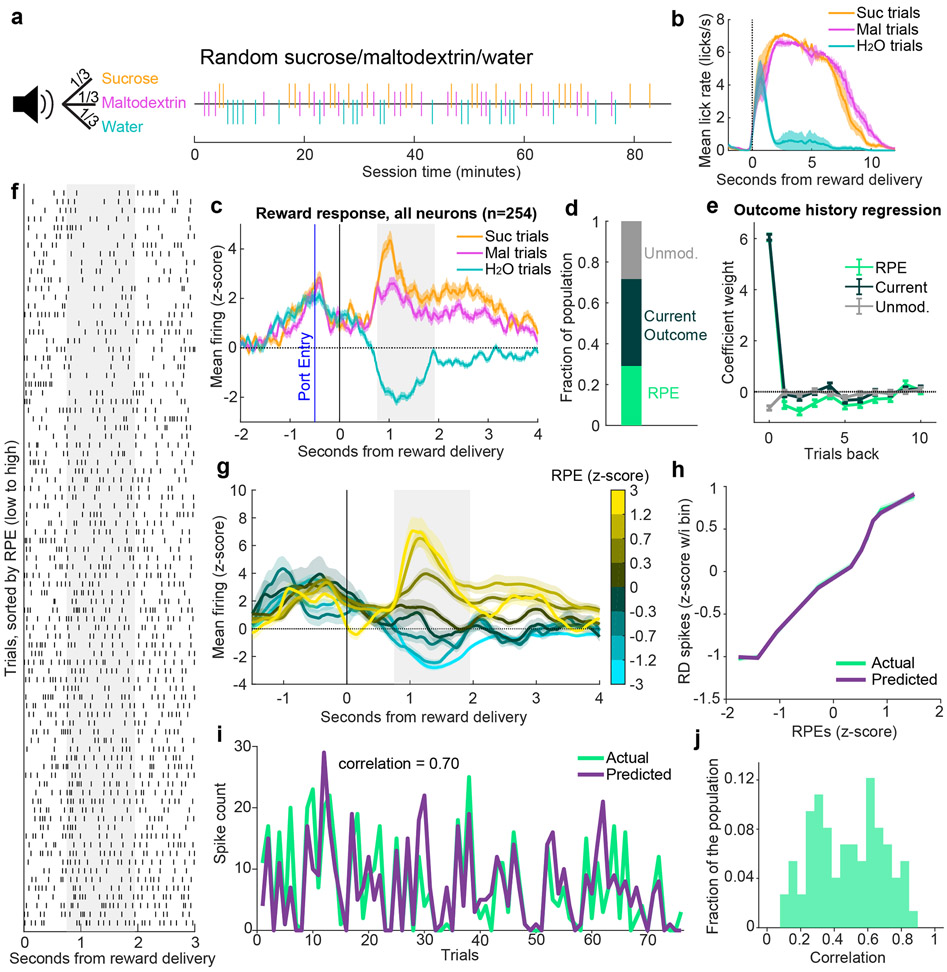
One shortcoming of the experiment contrasting sucrose and maltodextrin is that the similar palatability of the outcomes may not fully probe the limits of value signaling, potentially constraining our ability to identify RPE neurons; maltodextrin delivery does not typically strongly inhibit responses at the time of reward (Fig. 1e). We previously found that delivering water, an outcome less rewarding than maltodextrin, more strongly inhibited firing rates (‘random sucrose/maltodextrin/water’ task; Fig. 3a-c) (9). We hypothesized that this expansion of the dynamic range of firing would reveal additional RPE neurons. We applied the same models as before to neurons recorded during this three-outcome task (n=254) to identify cells with firing patterns that reflected outcome history-based RPEs, current outcome only, or no modulation, with an additional free parameter to estimate the value associated with maltodextrin on the scale of water (0) to sucrose (1). As hypothesized, a greater proportion of neurons was best fit by the RPE model in this task than in the random sucrose/maltodextrin task (29% versus 17%, χ2 = 15.3, p < 0.0001; Fig. 3d). Outcome history regressions revealed an impact of many previous trials on these neurons (Fig. 3e, significant weights for 1-3, 5-7, and 9 trials back). We observed graded changes in firing rates as a function of estimated RPEs for individual neurons (Fig. 3f); this relationship was consistent in the population-average PSTH (Fig. 3g). Firing rates of these RPE neurons monotonically increased as a function of estimated RPEs, and this relationship was consistent with tuning curves for simulated RPE neurons (Fig. 3h). Moreover, the model’s predictions of trial-by-trial spiking for each neuron was robust and stronger than in the random sucrose/maltodextrin task (Pearson’s correlation coefficient: mean - 0.49, median - 0.48; Wilcoxon rank-sum test between VP-RPE correlation in ‘random sucrose/maltodextrin’ vs ‘random sucrose/maltodextrin/water’ task, p < 0.0001; Fig. 2e-f). Thus, with outcomes spanning an expanded value space, we found more neurons that encode RPEs and do so more robustly.
Figure 3. An expanded value space reveals stronger RPE signaling in VP.
(b-c) are adapted from (9). (a) A white noise cue indicated 1/3 probability each of receiving sucrose, maltodextrin, or water, as seen in the example session (right). (b) Mean(+/−SEM) lick rate relative to pump onset. (c) Mean(+/−SEM) activity of all recorded neurons on sucrose, maltodextrin, and water trials. (d) Fraction of the population of neurons recorded in this task best fit by each of the three models. (e) Coefficients(+/−SE) for outcome history regression for each of the three classes of neurons (n=74 RPE, 108 Current outcome, and 72 Unmodulated neurons). (f) Raster of an individual neuron’s spikes on each trial, aligned to reward delivery, and sorted by the model-derived RPE value for each trial. Gray shaded region indicates window used for analysis. (g) Population mean(+/−SEM) of all RPE neurons. The trials for each neuron are binned according to their model-derived RPE. (h) Mean(+/−SEM) population activity of simulated and actual VP RPE neurons according to each trial’s RPE value. (i) The model-predicted and actual spike counts on each trial for the RPE neuron with the 85th percentile correlation. (f) Distribution of correlations between model-predicted and actual spiking for all RPE neurons.
VP reward activity mediates trial-by-trial task engagement
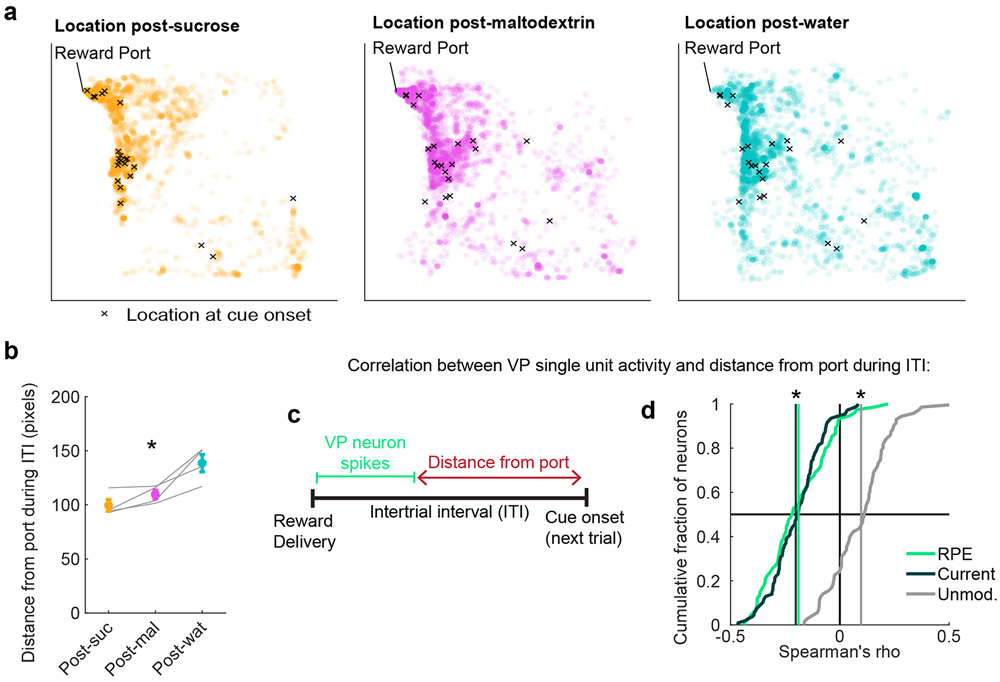
The presence of adaptive RPE signals in VP in these tasks raises the question of whether rats were similarly adapting their behavior in response to reward outcomes. Because the rats were freely moving, task participation represented a trade-off between reward seeking and competing interests, including rest, grooming, and exploring the behavioral chamber. To evaluate task participation, we analyzed videos (n = 4) from the random sucrose/maltodextrin/water recording sessions. To estimate trial-by-trial task engagement, we calculated the average distance from the port in each intertrial interval (ITI). This analysis revealed instances where rats traveled far from the reward port and, in some cases, remained far from the reward port at the beginning of the next trial (Fig. 4a). Consistent with their relative reward palatability, rats remained close to the reward port during the ITI following sucrose, moved further from the port after maltodextrin, and even further after water delivery (Fig. 4b).
Figure 4. VP reward activity tracks changes in trial-by-trial task engagement.
(a) All locations of a rat from an example session during the intertrial interval (ITI) following sucrose (left), maltodextrin (center), and water (right) delivery. Each circle is one location during a 0.2s bin. X marks the location at cue onset for the subsequent trial. Chamber is 32.4cm x 32.4cm (approximately 306 x 306 pixels). (b) Mean(+/−SEM) distance from the port during ITI following sucrose (orange), maltodextrin (pink), and water (blue) trials during recording sessions (n=4 sessions from 3 rats). Gray lines represent mean for one subject in one session. * = ρ = −0.86, p = 0.0004, Spearman’s rank correlation coefficient between distance from port and reward preference ranking. (c) Approach for correlating the activity of individual VP cells with distance from the port on a trial-by-trial basis. (d) Distribution of correlations between individual VP neurons’ firing rates on each trial and the distance from the port during the subsequent ITI. * = significant shift in mean correlation coefficient (vertical lines) compared to 1000 shuffles of data for RPE (p = 8 * 10−10), Current outcome (p = 3 * 10−18), and Unmodulated neurons (p = 0.00008), Wilcoxon signed-rank test, two-sided.
Next, we determined if this behavioral measure, proximity to the reward port, was related to the VP neural signals we characterized. Consistent with the idea that VP reward signals guide task engagement, there was on average a negative correlation between the activity of VP RPE cells (n = 74) and Current outcome cells (n = 108) at reward delivery and distance from the port during the following ITI (Fig. 4c,d); there was a modest positive correlation for Unmodulated cells, perhaps reflecting a VP population that promotes avoidance (17; 18; 15). The negative correlation for RPE and Current outcome cells indicates rats traveled around the chamber and remained far from the reward port after activity of these neurons was low (i.e., negative prediction errors or less-preferred outcomes); conversely, rats remained closer to the port after high activity. This pattern of results held for sessions contrasting sucrose and maltodextrin as well: rats were closer to the port following sucrose trials (p = 0.048, Wilcoxon signed-rank test), and there was a negative correlation between RPE and Current outcome cell activity and distance from port (p = 0.001 for both, Wilcoxon signed-rank test) but not for Unmodulated cells (p = 0.75, Wilcoxon signed-rank test).
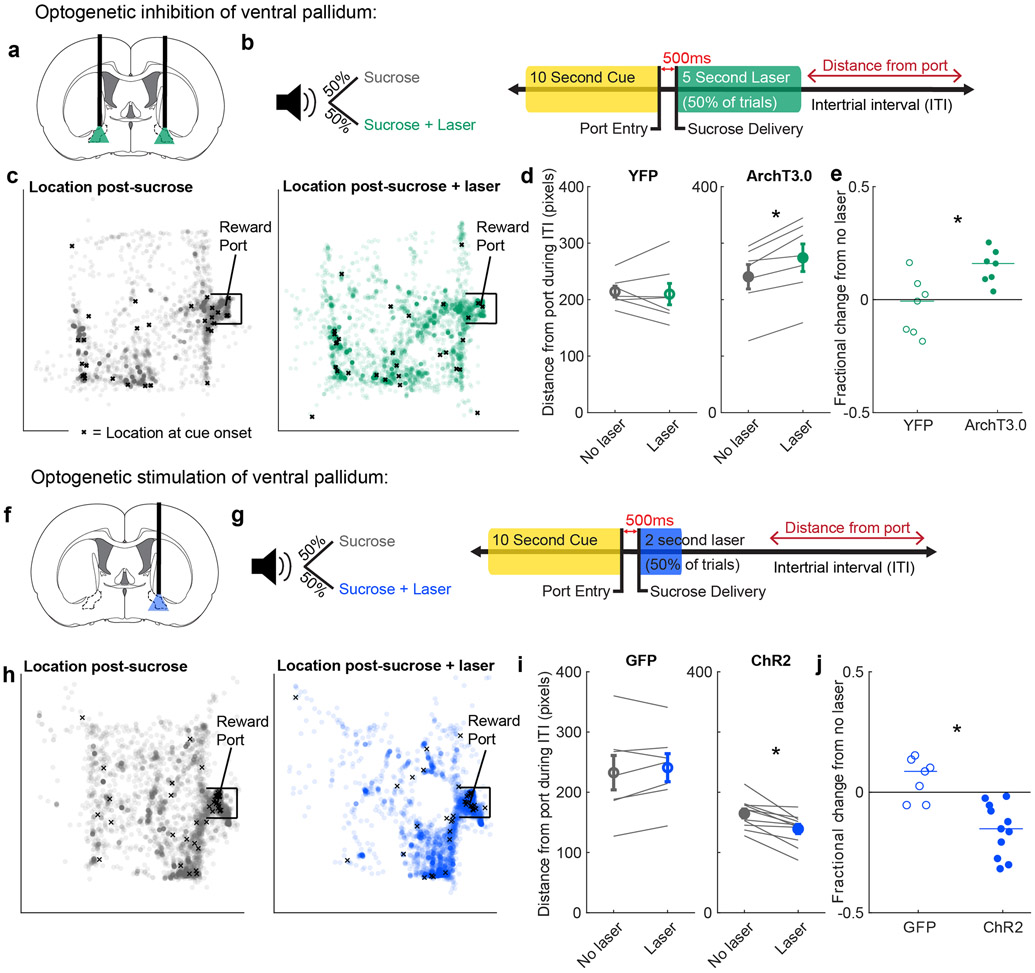
The correlation between VP neuron activity and task engagement suggests VP may causally influence task engagement. To explore this possibility, we used an optogenetic approach. Rats were infused with virus containing either the inhibitory opsin, ArchT3.0-eYFP (n = 7), or eYFP alone as a control (n = 7), and implanted with optic fibers aimed at VP (Fig. 5a, Extended Data Fig. 3). We then trained these rats on a simplified task in which port entry during a 10s cue earned a sucrose reward. On half of the trials, we inhibited VP for 5s beginning at onset of sucrose delivery, mimicking a negative prediction error or a non-preferred outcome signal (Fig. 5b). Much like water delivery (a less-preferred option), optogenetic inhibition of VP increased rats’ average distance from the port during the following ITI relative to control rats (p = 0.01, Wilcoxon rank-sum test) (Fig. 5c-e). We then performed the complementary experiment by injecting channelrhodopsin-containing virus (n = 10) or GFP control (n = 7) into another group of rats (Fig. 5f, Extended Data Fig. 3). Rats were trained on the same task, and on half of trials we stimulated VP for 2s at 40Hz, approximating a positive prediction error or a preferred outcome (Fig. 5g). VP stimulation increased subsequent task engagement, decreasing distance from port during the following ITI relative to control rats (p = 0.001, Wilcoxon rank-sum test) (Fig. 5h-j). Thus, VP activity is instructive for task engagement-related behavior, suggesting that outcome-related signals in VP are used to motivate task performance.
Figure 5. Manipulation of VP reward activity bidirectionally alters task engagement.
(a) Optogenetic inhibition of VP with ArchT3.0. (b) Experimental approach to evaluate the contribution of VP to task engagement. Rats received a sucrose reward on every completed trial; on 50% of trials, they also received laser inhibition (left). Specifically, entry into the reward port during the 10s cue triggered delivery of sucrose 500ms later and 5s of constant green laser (right). We then evaluated the rats’ distance from the port in the subsequent ITI. (c) All locations of a rat from an example session during the intertrial interval (ITI) following sucrose delivery without laser (left) and with laser (right). Each circle is one location during a 0.2s bin. X marks the location at cue onset for the subsequent trial. Chamber is 29.2cm x 24.4cm (approximately 542 x 460 pixels). (d) Mean(+/−SEM) distance from the port in the ITI following sucrose with and without laser for animals receiving a control virus (YFP, left, n=7 rats) or the ArchT3.0 virus (right, n=7 rats). Individual rats’ data shown in gray lines. * = p = 0.02, Wilcoxon signed-rank test, two-sided. (e) Fractional change in ITI distance from port for each rat (median: −0.01 YFP, n=7 rats; 0.15 ArchT3.0, n=7 rats), * = p = 0.01, Wilcoxon rank-sum test, two-sided. (f) Optogenetic stimulation of VP with ChR2. (g) Like (b), but entry into the reward port during the cue triggered delivery of 2s of blue laser at 40Hz, 10ms pulse width (right). (h) All locations of a rat from an example session during the intertrial interval (ITI) following sucrose delivery without laser (left) and with laser (right). (i) Mean(+/−SEM) distance from the port in the ITI following sucrose with and without laser for animals receiving a control virus (GFP, left, n=7 rats) or the ChR2 virus (right, n=11 rats). Individual rats’ data shown in gray lines. * = p = 0.001, Wilcoxon signed-rank test, two-sided. (j) Fractional change in ITI distance from port for each rat (median: 0.09 GFP, n=7 rats; −0.14 ChR2, n=11 rats), * = p = 0.001, Wilcoxon rank-sum test, two-sided.
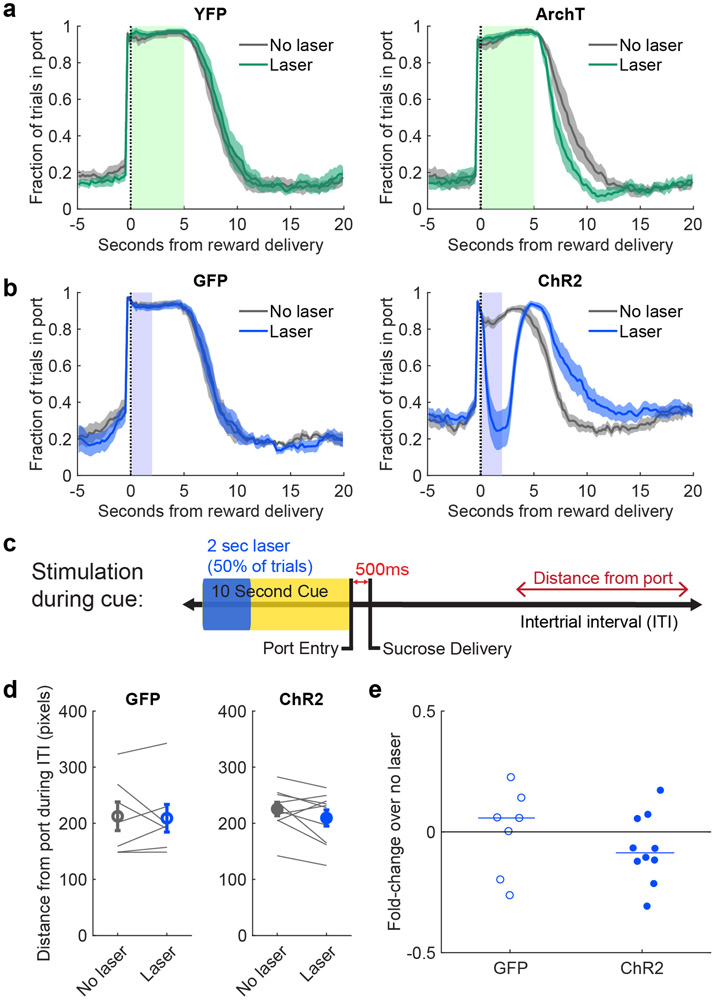
To ensure the robustness of these findings, we more closely analyzed the effect of optogenetic manipulation on behavior. First, we analyzed how the laser affected ongoing behavior. There was no noticeable impact of the laser on time spent in the reward port for control groups nor for the ArchT3.0 group, meaning the effects of manipulation on task engagement were not likely due to interruption of the consumption phase (Extended Data Fig. 4a). Interestingly, in the ChR2 group, stimulation of VP caused rats to move their head out of the port, leading to delayed reward consumption (Extended Data Fig. 4b). To control for the possibility that delayed consumption led to the difference in ITI distance, we restricted our analysis to the ITI period beyond 15s following reward delivery, when port entry occupancy on laser and no laser trials was similar (p = 0.12, Wilcoxon signed-rank test). We confirmed that ChR2 rats were closer to the port following laser trials than following no laser, relative to control (p = 0.01, Wilcoxon rank-sum test). Finally, we ran a similar experiment to ask how VP activation during the cue (for 2s), rather than reward, would influence behavior (Extended Data Fig. 4c) and observed no effect on ITI distance in ChR2 rats relative to control (p = 0.36; Extended Data Fig. 4d-e). This indicates that VP activity during the reward outcome epoch specifically influences task engagement during the subsequent ITI.
VP RPE neuron firing adapts to repeated reward presentations
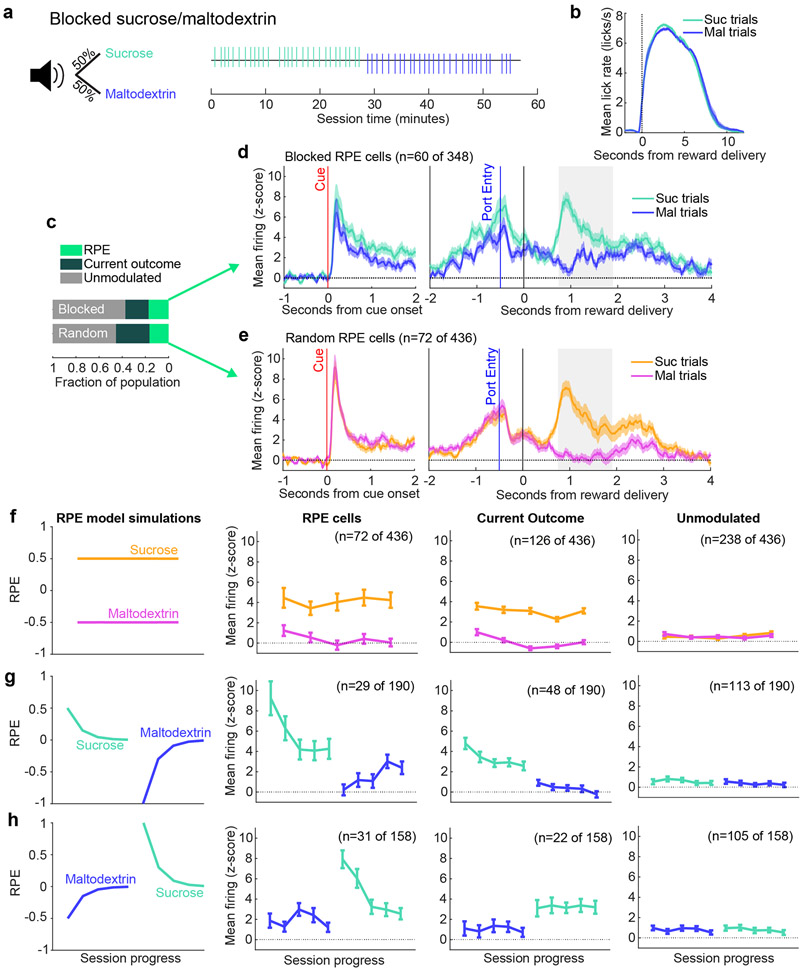
Repeated presentation of the same reward (or sets of rewards) can produce adaptation in neural responses as the outcome becomes expected (21; 22; 23), a phenomenon that can be explained by RPE models. We investigated whether VP neurons also attenuate their reward-evoked firing to repeated outcomes by analyzing activity of neurons (n = 348) recorded during a variation of the sucrose and maltodextrin task where each reward was presented in blocks of 30 trials (Fig. 6a-b). Neural activity was fit to the same three models (RPE, Current outcome, and Unmodulated; Fig. 1h) revealing a similar fraction of RPE neurons during this task as in the random sucrose/maltodextrin task (Fig. 6c). There were noticeable differences in the average firing rate of RPE neurons in the blocked task compared to the interspersed task, consistent with an acquired reward expectation in the blocked task (Fig. 6d-e). To determine how the reward-evoked activity evolved across each block, we plotted the activity in 3-trial bins evenly spaced throughout the session (Fig. 6f-h). RPE neurons demonstrated notable reward-specific adaptations: a reduction in activity within sucrose blocks (t804 = −5.7, p < 10−7 for a linear model fitting neural activity to session progress for RPE neurons recorded with sucrose block presented first; t882 = −8.5, p < 10−10 for RPE neurons when sucrose block was second) and an increase within the maltodextrin block when maltodextrin was second (t697 = 4.3, p < 0.0001) although not when it was first (t821 = 0.38,p = 0.71), resulting in a significant interaction between the effects of session progress and outcome on the firing rates of RPE neurons in both session types (sucrose first: t1501 = −6.8, p < 10−10, sucrose second: t1703 = −6.4, p < 10−9). This pattern was consistent with predictions of the RPE model (Fig. 6f); over time, positive prediction errors for sucrose decrease as expectation for sucrose builds across repeated sucrose trials, and, similarly, negative prediction errors for maltodextrin attenuate (resulting in increased firing rate) as expectation for maltodextrin builds across the maltodextrin block. Notably, Current outcome and Unmodulated neurons in the blocks sessions did not follow this pattern (Fig. 6f-h, all p > 0.05 for interaction between session progress and outcome). RPE neurons from random sucrose/maltodextrin sessions also did not follow this pattern (t3959 = 1.7, p > 0.05), demonstrating that these across-session changes are specific to the blocked structure. The same RPE model, therefore, that describes neurons sensitive to outcome history when rewards are randomly interspersed can also identify neurons in VP that exhibit adaptation across blocks.
Figure 6. VP RPE neuron signaling adapts across reward blocks.
(a) A white noise cue indicated an overall 50/50 probability of receiving sucrose or maltodextrin solutions, but the order of trials was structured into blocks of thirty trials, as seen in example session (right). (b) Mean(+/−SEM) lick rate relative to pump onset. (c) Proportion of neurons best fit by each of the three models in the random and blocked sucrose/maltodextrin tasks. (d) Mean(+/−SEM) activity of all RPE neurons from the blocks tasks aligned to cue onset and to reward delivery. (e) Mean(+/−SEM) activity of all RPE neurons from the random sucrose/maltodextrin task aligned to cue onset and to reward delivery. (f) RPE model simulations (left) and mean(+/−SEM) activity of RPE, Current outcome, and Unmodulated cells from the random sucrose/maltodextrin task, plotted in bins of three trials evenly spaced throughout all completed sucrose and maltodextrin trials. (g) As in (f), for blocked sessions with sucrose first. (h) As in (f) and (g) for blocked sessions with maltodextrin first.
Impact of reward-predicting cues on VP firing
In the analysis thus far we applied a Rescorla-Wagner trial-based RPE model (2; 4) to characterize how expectation is updated iteratively by the outcome on each trial. A critical expansion of the Rescorla-Wagner model is the temporal difference (TD) model, which allows within-trial updating of expectation by events such as reward-predicting cues (24; 1; 3; 25). We used a number of approaches to evaluate whether reward-predicting cues impacted VP firing in a TD-like pattern. First, we analyzed the cue-evoked activity in the random sucrose/maltodextrin and random sucrose/maltodextrin/water tasks. Although there is only one cue in these sessions, the cue value can change according to the recently received outcomes. We used the same model-fitting classification procedure that we applied to firing at reward delivery to characterize cue-evoked activity. We compared the fits of the Unmodulated model and a ‘Value’ model, which is identical to the RPE model but maps V (the expected value) rather than RPE onto the neuron’s cue-evoked spiking on each trial (Extended Data Fig. 5). Although there were few neurons classified as encoding Value in the sucrose/maltodextrin task, they were more common among neurons encoding RPEs at the outcome (15%) than non-RPE neurons (8%, χ2 = 4.2, p < 0.04). In the sucrose/maltodextrin/water task, in which a greater fraction of VP neurons encoded RPE at the outcome, there was also a greater fraction encoding Value at the cue (χ2 = 5.9, p < 0.02, Extended Data Fig. 6), and, again, RPE neurons were more likely to encode Value during the cue than non-RPE neurons (Value coding in 28% of RPE neurons, 9% of non-RPE neurons; χ2 = 14.8, p < 0.001). This pattern of results indicates that some VP cells fire in a TD-like pattern, with the expected outcome reflected in the firing rate of both cue- and outcome-evoked activity.
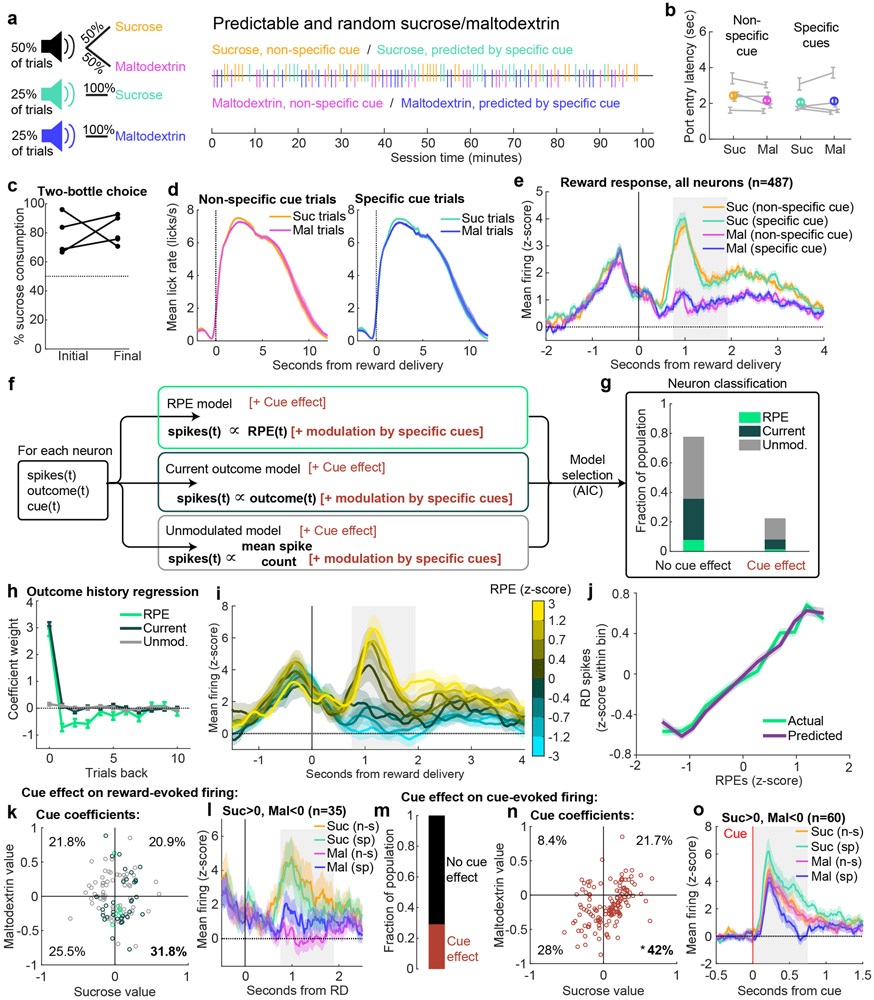
A key demonstration of TD RPEs in dopamine neurons was the observation that firing at both the cue and the outcome is sensitive to specific learned cue-reward associations (26; 27). To assess whether the firing of VP neurons is also sensitive to specific cue predictions, we trained a new cohort of rats to associate one ‘non-specific’ cue with unpredictable sucrose/maltodextrin (like the ‘random sucrose/maltodextrin’ task), and two ‘specific’ cues, the first which fully predicted sucrose and the second which fully predicted maltodextrin, and recorded VP neurons (n = 487) while they performed the task (Extended Data Figs. 7 and 8) This task is somewhat unusual in that the predicted outcomes are similar in value, perhaps explaining why rats did not noticeably adjust their behavior according to each cue’s prediction (Extended Data Fig. 8b). To quantify how the specific cue predictions modulated outcome-evoked firing rates, we the RPE, Current outcome, and Unmodulated models were augmented with two free parameters to estimate the contribution of the new cues; thus, each neuron was fit with six models. Although we replicated our finding that a subset of VP neurons encode Rescorla-Wagner RPEs at the time of the outcome (Extended Data Fig. 8g-j), we did not observe many neurons with a TD-like impact of specific reward-predicting cues on their outcome-evoked activity (Extended Data Fig. 8g,k). We did, however, find that the cue-evoked activity of 29% of neurons was impacted by cue identity (Extended Data Fig. 8m). These cells were not more likely to be modulated by cues at the time of the outcome (p = 0.07). Importantly, these cells tended to have elevated firing for the sucrose cue and reduced firing for the maltodextrin cue relative to the non-specific cue (Fig. 8n-o), indicating that the relative values of sucrose and maltodextrin are represented in the firing evoked by their respective predictive cues. Therefore, in this task, where the cues do not overtly influence behavior, VP neurons had cue-evoked but not outcome-evoked activity that followed the pattern of a TD error, but additional experiments with more salient cue-reward associations are necessary for definitive conclusions.
DISCUSSION
We investigated the influence of outcome history on reward-evoked firing in ventral pallidum (VP) through the lens of reward prediction error (RPE) signaling. Random presentations of reward revealed a subset of VP neurons that reflected an RPE generated from previously received outcomes and consistent with reward preference. This RPE signal correlated with measures of task engagement in the subsequent trial, and optogenetic manipulation of VP during reward delivery predictably altered subsequent task engagement. We further found that VP RPE neurons demonstrate the expected adaptation when the same reward is presented repeatedly. This series of findings is strong evidence for encoding of outcome history-based RPEs by VP neurons and suggests a role for this signal in adaptive reward seeking.
A reward prediction error signal beyond dopamine neurons
A longstanding view is that dopamine neurons compute RPEs locally by integrating distinct elements of the signal relayed from different input regions (28; 14; 29). Previous work has revealed that different components of the dopamine neuron RPE calculation depend on various inputs, including lateral habenula (30; 31), rostromedial tegmental nucleus (32; 33), orbitofrontal cortex, (22), ventral striatum (23), and GABAergic neurons in the ventral tegmental area (VTA) (27). A pioneering study on neural activity of monosynaptic inputs to dopamine neurons revealed a mixture of reward and expectation signals across brain regions (including VP), but notably, there were very few upstream neurons encoding full RPEs (14), maintaining the idea that, by and large, RPE is calculated within dopamine neurons themselves (29).
The focus on the construction of an RPE signal within dopamine neurons has left RPE correlates in other reward-processing regions less explored. Here, we describe a robust RPE signal in VP, a region within a highly interconnected circuit implicated in reward learning and reward processing (5; 6). Previously, we characterized a relative value signal in VP by presenting rats with various combinations of differentially-preferred rewards (9). In that work, we observed an influence of only one previous trial on reward-evoked signaling when looking at the full recorded population, a result we replicated here by performing an outcome history regression on all VP neurons (Fig. 1g). Our innovation in the present work is implementing a computational modeling approach that allowed us to identify individual neurons whose firing was consistent with RPEs, integrating outcome history over several trials.
There have been a few prior attempts to characterize RPE-like signals in VP (12; 14; 15; 16), with mixed results. An important distinction in our present work is that we focused the majority of our analysis on Rescorla-Wagner trial-based RPEs, which integrate over outcome history, whereas prior studies looked for outcome signaling modulation by specific predictive cues within a temporal difference (TD) learning framework. Both models have been useful for characterizing dopamine neuron activity. Our data here indicate that, much like dopamine neurons (25; 4; 20), a subset of VP neurons encode trial-based RPEs. Additionally, we linked VP activity during the reward epoch with changes in task engagement, indicating that this signal may contribute to updating the estimate of the task’s value, consistent with the Rescorla-Wagner model. We once again found mixed evidence for TD error signals in VP.
One possible explanation for the apparent lack of TD signaling is that VP may not update the values of particular cues, but rather may update the estimate of average environmental reward over behaviorally-relevant timescales. Theories and experiments have suggested that average environmental reward signals are critical for invigorating behavior (34; 35; 36). Intriguingly, subtle manipulations of VP slow response vigor (8) and gross manipulations are typically associated with motivational deficits (5; 6). Both of these effects are consistent with a role for VP in computing average reward. Our finding that VP activity correlates with subsequent task engagement and that VP optogenetic manipulations alter subsequent task engagement additionally supports this idea. Since the cue-response contingency was identical on all trial types in the tasks presented here, future work will need to clarify whether this signal updates estimates of global reward rate, or perhaps the value of specific reward-seeking actions. Additionally, a task with greater motivation and learning demands could help distinguish the roles of RPE and Current outcome cells.
Relationship between VP and dopamine RPE signals
VP neurons have direct and indirect reciprocal connections with VTA dopamine neurons, so a natural question is how RPE signals in each population may influence each other. Building upon the discussion above, it is possible that VP integrates reward history to provide an average-reward error signal to dopamine neurons. Indeed, dopamine activity tracks average reward (34; 25; 35). Since we saw less RPE-like activity in NAc, another input to midbrain dopamine neurons, VP could be a privileged source for this information. There are multiple routes for VP activity to reach VTA given demonstrations of VP synapses not only onto VTA neurons (6; 37; 14; 18) but also onto VTA input nuclei such as lateral habenula and rostromedial tegemental nucleus (38; 39; 17; 18). Stimulation of VP GABAergic neurons increases the number of putative midbrain dopamine neurons expressing Fos, consistent with an indirect mechanism for modulating features of dopamine neuron RPE signaling (18). Interestingly, in songbird, VP has been shown to send performance-related error signals to the VTA during singing (40; 41; 42).
On the other hand, VTA could be a source for VP RPE signals; in addition to dopaminergic innvervation of VP (5; 6; 37), VTA sends dense glutamatergic projections, which may be more likely to mediate the phasic responses we observed in VP (43). Future work should untangle a uni- or bidirectional influence of error-related signals in these regions, as well as possible unique roles of each population in adaptive behavior. A combination of projection-specific recordings and manipulations in VP and VTA would help clarify this question. Additionally, other candidate downstream regions whereby VP RPE signals may mediate learning and behavior include the classical VP thalamic output, the mediodorsal nucleus (7; 5; 6; 44), as well as lateral hypothalamus (45) and lateral habenula (17; 18; 38; 39).
One metric upon which signaling in VP and VTA can be compared is the prevalence of outcome history-sensitive RPEs across the population. In our task, we found as many as ~ 30% of neurons encoded RPEs, but this was variable across tasks. This proportion is similar to that found in dopamine neurons, which ranges from 15% to 50% in rodents (21; 22; 20). In our dataset, we noted that the task with the greatest range in reward value revealed the most RPE cells. Future work should explore how additional changes in task parameters, such as the inclusion of aversive outcomes (14; 15), Pavlovian versus instrumental contingencies (46; 47), and deterministic versus probabilistic outcomes, impact RPE signaling in VP relative to NAc.
METHODS
Animals.
Subjects for electrophysiology experiments were male Long-Evans rats (n=15) from Envigo weighing 250-275g at arrival. Subjects for the optogenetic experiment were male (n=6) and female (n=8) Long-Evans rats from Envigo weighing 200-275g at arrival. Rats were single-housed on a 12hr light/dark cycle and given free access to food and water in their home cages for the duration of the experiment. All experimental procedures were performed in strict accordance with protocols approved by the Animal Care and Use Committee at Johns Hopkins University.
Reward solutions.
Reward solutions were 10% solutions by weight of sucrose (Thermo Fisher Scientific) and maltodextrin (SolCarb, Solace Nutrition) in tap water. Rats were given free access to the solutions in their home cages before training began.
Behavioral tasks.
Random sucrose/maltodextrin:
Data from this task were previously published (9). Rats (n=11) were trained to respond to a 10s white noise cue by making an entry into the reward port. The cue terminated upon port entry, and 500ms following port entry, 110μL of either reward was delivered into the metal cup within the reward port. Sucrose and maltodextrin trials were pseudorandomly interspersed throughout the session such that rats could not detect the identity of the reward until it was delivered. Individual licks were recorded with a custom-built arduino-based lickometer using a capacitance sensor (MPR121, Adafruit Industries) with a 1kHz sampling rate. Each cue was separated by a variable intertrial interval (ITI) that averaged 45s. During the ITI, the reward cup was evacuated via vacuum pump, flushed with 110μL of water, and evacuated again. Maltodextrin, sucrose, and water were each delivered via separate infusion pumps (Med Associates) and separate metal tubes entering the cup. There were 60 trials per session. For three rats, two additional sessions were conducted with tap water as a third outcome for a total of 90 trials (‘random sucrose/maltodextrin/water’). Blocked sucrose/maltodextrin: For the same group of rats as the random task, additional blocks sessions were performed on alternating days with the random sucrose/maltodextrin task. In blocked sessions, sucrose and maltodextrin were presented 30 trials in a row for a total of 60 trials. The order of the rewards switched each blocks session. Predictable and random sucrose/maltodextrin: A new group of rats (n=4) was trained on a task with the same trial structure (with a shorter ITI of 30s) but with three possible auditory cues. One predicted sucrose delivery with 100% probability (30 trials), one maltodextrin with 100% probability (30 trials), and one, as in the random sucrose/maltodextrin task, predicted each reward with a 50% probability (60 trials).
Preference test.
To assay rats’ preference for sucrose or maltodextrin, we performed two 60-minute two-bottle choice tests, during which rats had free access to 10% solutions of each reward. Bottles were weighed before and after to determine the amount of each solution consumed by each rat. The first test was following recovery from surgery and prior to recording. The second was at least a day after the final session with sucrose and maltodextrin.
Surgical procedures.
Electrophysiology studies:
Drivable electrode arrays were prepared with custom-designed 3D-printed plastic pieces assembled with metal tubing, screws, and nuts. 16 insulated tungsten wires and 2 silver ground wires were soldered to an adapter that permitted interfacing with the headstage (Plexon Inc). The drives were surgically implanted in trained rats. Rats were anesthetized with isoflurane (5%) and maintained under anesthesia for the duration of the surgery (1-2%). Rats received injections of carprofen (5 mg/kg) and cefazolin (70 mg/kg) prior to incision. Using a stereotactic arm, electrodes were aimed at VP (n=9, AP +0.5mm, ML +2.4mm ML, DV −8mm) or NAc (n=6, AP +1.5mm, ML +1.2mm, DV −7mm). The base of the drive and the adapter were secured to the skull with 7 screws and cement. The ground wire was wrapped around a screw and placed superficially in brain tissue in a separate craniotomy posterior to the recording electrodes. Optogenetic studies: Rats were anesthetized with isoflurane (5%) and maintained under anesthesia for the duration of the surgery (1-2%). Rats received injections of carprofen (5 mg/kg) and cefazolin (70 mg/kg) prior to incision. First, 0.7 μL of virus containing the archaerhodopsin gene construct (AAV5-CamKIIa-eArchT3.0-eYFP, 7*1012 viral particles/mL from the University of North Carolina Vector Core), channelrhodopsin (AAV5-hsyn-hChR2(H134R)-EYFP, 1.7 * 1013 viral particles/mL from Addgene, gift from Karl Deisseroth) or their respective control virus (AAV5-CamKIIa-eYFP, 7.4*1012 viral particles/mL from the University of North Carolina Vector Core, or AAV5-hsyn-EGFP, 1.2*1013 viral particles/mL from Addgene, gift from Bryan Roth) was delivered bilaterally to VP through 31 gauge gastight Hamilton syringes at a rate of 0.1 μL per min for 7 minutes controlled by a Micro4 Ultra Microsyringe Pump 3 (World Precision Instruments). Injectors were left in place for 10 min following the infusion to allow virus to diffuse away from the infusion site. Injector tips were aimed at the following coordinates in relation to Bregma: +0.5 mm AP, +/−2.5 mm mediolateral, −8.2 mm dorsoventral. Then, rats were implanted with 300 micron diameter optic fibers constructed in house, aimed 0.3 mm above the center of the virus infusion. Optic fiber implants were secured to the skull with 4 screws and dental cement.
Electrophysiological recording.
Following a week of recovery in their home cages (and the first two-bottle choice test), rats were trained on the task again until they became accustomed to performing the task while tethered via a cable from their headstage to a commutator in the center of the chamber ceiling. Electrical signals and behavioral events were collected using the OmniPlex system (Plexon) with a 40kHz sampling rate. For rats in the random and blocked sucrose/maltodextrin tasks, we continued to record from the same location for multiple sessions if new neurons appeared on previously unrecorded channels. For the random task, if multiple sessions from the same location were included in analysis, the same wire was never included more than once. For the blocked task, we occasionally included a wire in the same location twice if each of the two sessions had a different block order. If no neurons were detectable or following successful recording, the drive was advanced 160μm, and recording resumed in the new location at minimum two days later to ensure settling of the tissue around the wires. For rats in the predictable and random sucrose/maltodextrin task, we maintained the wires in the same position for the duration of the experiment. Each wire from these rats only contributed to the included dataset once.
Optogenetic manipulations.
Inhibition:
At least 5 weeks after surgery and completion of operant training, rats were habituated to patch cord connections. Animals were connected via a ceramic mating sleeve to a 200 μm core patch cord, which was then connected through a fiber-optic rotary joint (Doric), to another patch cord which interfaced with a 532 nm DPSS laser (Opto-Engine LLC). The time of laser delivery was initiated by TTL pulses from MedPC SmartCTRL cards to a Master9 Stimulus Controller (AMPI) which dictated the duration of stimulation. For this experiment, rats were trained on a variation of the random sucrose/maltodextrin task where instead of maltodextrin delivery, rats received sucrose + continuous (5 sec, 15-20 mW) photoinhibition of VP. We chose 5 sec to span the majority of consumption (Extended Data Fig. 4a) and minimize the possibility that the release of inhibition within the first few seconds would also impact the behavior, since reward-specific signaling persists for up to 4 sec (Fig. 1e). For these sessions the reward volume was reduced to 55μL and the total number of trials was increased to 90. In our analysis, we only included rats who completed at least 30 trials and had both fibers and viral expression in VP. This resulted in 7 rats in each group: 4 males and 3 females in the ArchT3.0 group, and 2 males and 5 females in the YFP group. Excitation: We used the same protocol as the inhibition group, but with unilateral 40Hz pulsed photoexcitation of VP for 2 sec (10ms pulse width, 10-12mW). We also conducted a session where stimulation occurred at cue onset for 2 sec (or until reward delivery if sooner). Because rats were implanted bilaterally, we stimulated the side with maximal effect and minimal off-target effects as determined in prior experiments. We only included rats who completed at least 30 trials and had their stimulated fiber and viral expression in VP. This resulted in 5 males and 5 females in the ChR2 group, and 3 males and 4 females in the GFP group.
Histology.
Animals were deeply anesthetized with pentobarbital. For rats in the electrophysiology experiments, electrode sites were labeled by passing a DC current through each electrode. All rats were perfused intracardially with 0.9% saline followed by 4% paraformaldehyde, post fixed and sectioned into 50um slices on a cryostat. Cresyl violet (electrophysiology experiments) or DAPI (optogenetic experiments) were used to visualize electrode, virus, and fiber placements.
Spike sorting and initial analysis.
Spikes were sorted into units using offline sorter (Plexon); following initial manual selection of units based on clustering of waveforms along the first two principal components, units were separated and refined using waveform energy and waveform heights at various times relative to threshold crossing (slices). Any units that were not detectable for the entire session were discarded. Event creation and review of individual neurons’ responses were conducted in NeuroExplorer (Nex Technologies). Cross-correlation was plotted for simultaneously recorded units to identify and remove any neurons that were recorded on multiple channels. All subsequent analysis was performed in MATLAB (MathWorks).
PSTH creation.
Peri-stimulus time histograms (PSTHs) were constructed using 0.01ms bins surrounding the event of interest (generally, reward delivery). PSTHs were smoothed using a half-normal filter (σ = 6.6) that only used activity in previous, but not upcoming, bins. Each bin of the PSTH was z-scored by subtracting the mean firing rate across 10s windows before each trial and dividing by the standard deviation across those windows (n = # of trials). PSTHs for licking were created in the same manner (without z-scoring) using 0.05ms bins and σ = 8. For the neural activity plots with trials binned by RPE, we smoothed both individual trials (σ = 10) and the entire PSTH (σ = 20) with half-normal filters because each trace was constructed from just a handful of trials.
Model fitting.
For each neuron, we took the spike count, s(t), within the 0.75-1.95s post-reward delivery time bin for each trial and fit Poisson spike count models using maximum likelihood estimation. Maximum likelihood estimation is a method for estimating the parameters that best predict the observed data (in this case, spike counts), under the assumed model. For the random and blocked sucrose/maltodextrin tasks, we fit the following three models.
RPE model
where V (t) is the expected value, δ(t) is the RPE, o(t) is the outcome and α is the learning rate. For the tasks with sucrose and maltodextrin outcomes, we coded o(t) = 0 for maltodextrin, and 1 for sucrose. For the tasks with sucrose, maltodextrin, and water outcomes, we coded o(t) = 0 for water, 1 for sucrose, and ρ for maltodextrin, a free parameter we estimated during model fitting. To map RPEs to spike counts, we used a as a slope (gain) and b as an intercept (offset) parameter. This affine-transformed RPE was mapped through an exponential function, to avoid negative values, and used as the rate parameter for a Poisson distribution. To identify neurons with value responses at the time of the cue, we replaced δ(t) with V (t) in the Poisson function mapping latent variables to spike counts.
Current outcome model
Unmodulated model
where is the mean firing rate.
For the predictable and random sucrose/maltodextrin task, we added the following three models
RPE + cue model
where Vsucrose and Vmaltodextrin are free parameters for the values of the sucrose- and maltodextrin-predicting cues, respectively.
Current outcome + cue model
Unmodulated + cue model
To estimate predictive cue effects on firing at the time of the cue, we fit the Unmodulated model and Unmodulated + cue model, with Vsucrose and Vmaltodextrin sign-flipped.
We also considered RPE models in which the predictive cue allowed for partial to full cancellation of RPEs.
We fixed Vsucrose = 1 and Vmaltodextrin = 0 and set w as a free parameter. If w = 0, this is equivalent to the RPE model, and if w = 1, the predictive cues allow for full cancellation of the RPE (η(t) = 0). Intermediate values of w allow the predictive cues to partially cancel the outcome history-based RPE. This model was best for a negligible number of neurons.
We only analyzed trials in which the rat licked within the first two seconds of reward delivery, to ensure that they sampled the outcome. For all RPE models except those in the three outcome task, V (1) was initialized to 0.5. For the three outcome task, V (1) was initialized to , where ρ is the estimated value of maltodextrin, to avoid biasing the initial value estimation. For all models with a slope parameter, we constrained the slope, a, to be > 0, as previous work showed that a trivial fraction of VP neurons preferentially encode low-value rewards (9). We found maximum likelihood estimates for each model and selected the best model using Akaike information criterion (lower AIC indicates a better fit, after taking into account the number of parameters). We used 10 randomly-selected starting initial values for each parameter to avoid finding local minima.
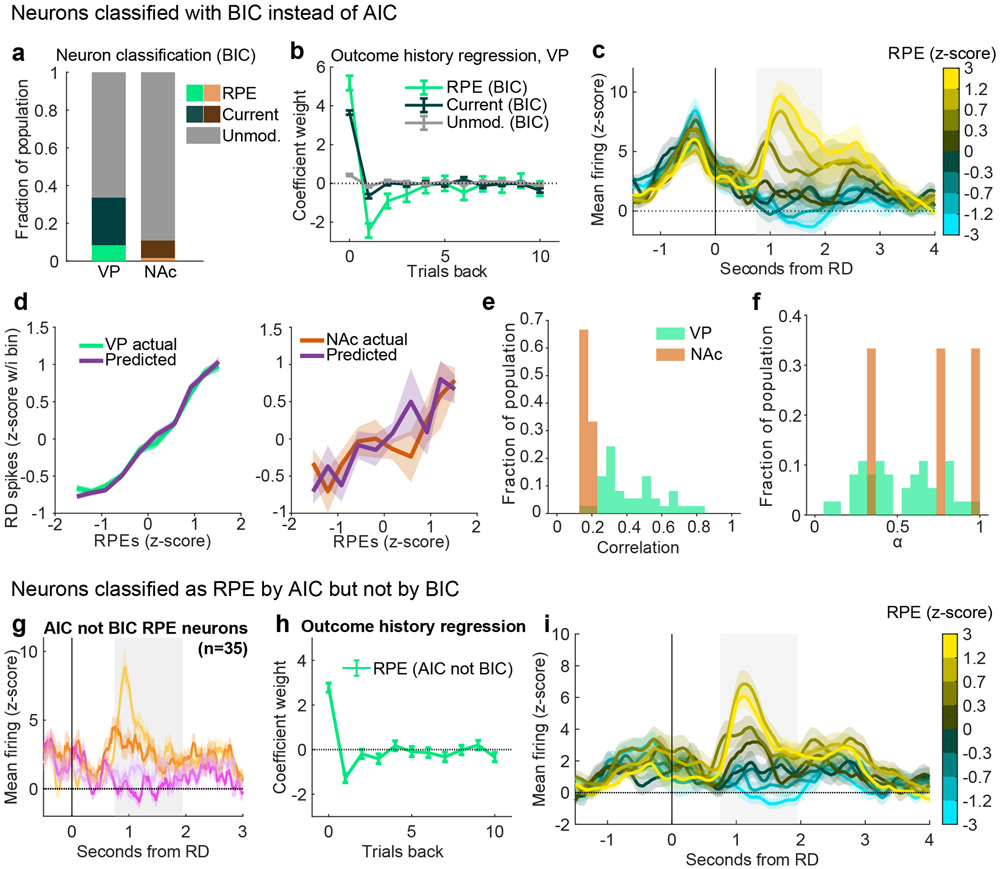
We performed a number of checks to ensure reliability of the model classification approach. First, we conducted a model recovery exercise by generating simulated neurons for each of our three models (see ‘Model recovery below’). We then classified these simulated neurons (blinded to the true category) and asked how many were correctly recovered. Overall, simulated neurons were classified as the correct model the majority of the time (Extended Data Fig. 2c). Moreover, our classification of RPE neurons was likely on the conservative end; RPE neurons were more often classified as Current outcome or Unmodulated neurons than vice versa. We also found that our approach allowed for unbiased estimates of the parameters used to simulate the neurons (Extended Data Fig. 2d). Second, as an additional test of reliability, we repeated the classification of VP and NAc neurons with the Bayesian information criteria (BIC), which more harshly punishes additional free parameters. Although this approach classified fewer neurons as RPE and Current outcome in both VP and NAc, the pattern of results remained the same, with more RPE and Current outcome cells in VP than in NAc and higher correlation between RPE model predictions and actual spike counts in VP than in NAc (Extended Data Fig. 9a-e). We further analyzed the subset of VP neurons classified as RPE cells by AIC but not by BIC. Intuitively, since this subset of neurons less robustly encode RPEs, we sought to determine whether they were simply noise or likely encoding RPEs. These AIC RPE cells were strongly modulated by the previous outcome and demonstrated firing patterns typical of the broader RPE population (Extended Data Fig. 9g-i), suggesting that RPE was the appropriate classification and BIC is likely too conservative for estimating the prevalence of outcome history-sensitive signaling across the population. Therefore, we used AIC for all analyses in the main text and figures.
We also considered a number of alternatives to our standard RPE model. First, we fit asymmetric learning models, with separate learning rates for positive prediction errors and negative prediction errors (αPPE and αNPE, respectively). These models allow for biased (optimistic or pessimistic) estimates of the value function. The asymmetric learning models were initialized with , the steady-state biased value estimate. Note that if αPPE = αNPE, then V (1) = 0.5, the initialization we used for our single learning-rate models. These models fit best for a small number of neurons (of 75 total RPE neurons in the “random sucrose/maltodextrin” task, 15 were best fit by the asymmetric RPE model), suggesting asymmetric RPE coding is not a cardinal feature.
Second, we allowed the slope parameter, a, to be negative, to capture neurons that signal negative RPEs or negative outcomes with an increase in firing rate. Only 5 of 77 RPE neurons and 16 of 142 Current outcome neurons were best fit by negative-slope models, suggesting the vast majority of neurons in VP signal positive RPEs or positive outcomes with an increase in firing rate.
Third, we considered two phenomenological models to explain the firing rates of VP neurons. In both models, spike counts were a function of the reward (that is, s(t) ~ Poisson(exp(a · o(t) + b)). The first, the ‘Habituation’ model, allowed the slope parameter, a, to vary as a function of recent reward history. We allowed the slope to decrease closer to 0 when reward history was greater (sucrose in the recent past), and increase when reward history was poorer. We re-coded o(t) to 0.5 for sucrose and −0.5 for maltodextrin to allow the slope to modulate the firing rate on maltodextrin trials (if o(t) = 0 on maltodextrin trials, then a · o(t) = 0, regardless of the slope). This allowed spike counts to decrease when sucrose or maltodextrin were presented repeatedly, allowing for habituation. The second, the ‘Adaptation’ model, allowed the intercept parameter, b, to vary as a function of recent reward history. This allowed spike counts to decrease suddenly when maltodextrin was delivered after a string of sucrose rewards, and increase suddenly when sucrose was delivered after a string of maltodextrin rewards, simulating RPE-like signals. When we fit all models to firing rates (RPE, Current outcome, Unmodulated, Habituation, Adaptation), the Habituation model fit best for 33 neurons, and the Adaptation model fit best for 18 neurons. The RPE model fit best for 54 neurons, which was significantly more than the Habituation model (p < 0.02) and the Adaptation model (p < 10−5).
Fourth, to test whether our procedure for classifying neurons was invariant to transformations of the data, we z-scored the spike counts and fit Gaussian observation models, with an extra parameter to estimate the variance. Using these models, we identified 66 of 436 (15%) neurons as RPE coding, similar to the 72 of 436 (17%) we identified with the Poisson observation model.
Fifth, a recent study has argued that neurons may be inappropriately classified as coding a latent variable if there are temporal correlations in both the latent variable and the firing rates (48). This concern does not hold for our study since, in all but the blocked task, reward was delivered randomly. This ensures that the estimated RPE signal is not autocorrelated. However, to test this concern rigorously, we adapted and implemented the permutation test recommended by the authors. The permutation test identifies neurons that are more correlated with RPEs estimated from that session than from other sessions. As such, it is an exceedingly strict test. We first fit a linear regression to each neuron to predict z-scored spike count as a function of RPEs. The resulting t-statistic was then compared to a null distribution of t-statistics, generated by fitting similar linear regressions using RPEs from all other sessions. A neuron was considered to encode RPEs if the t-statistic fell outside the 5% significance boundary of the null distribution. We found that 91% of our model-identified RPE neurons were considered RPE neurons by the permutation test. This was likely because the correlation between RPEs across session was not significantly different from chance (median correlation between RPEs [±95% bootstrapped CI]: 0.112 [0.107-0.117]; median correlation between two random Gaussian vectors: 0.105 [0.103 - 0.108])
Correlation and RPE tuning curves for real and simulated neurons.
For neurons best fit by the RPE model, we report correlations between real and predicted spike trains, as well as RPE tuning curves for real and predicted spike counts. For each neuron, we estimated the Pearson correlation coefficient between real spike counts and 501 independent model-generated spike count trains, using parameters estimated from the same neuron, and report the median correlation. The median-correlated spike count is plotted in Fig. 2e, 3i. We also compared the mean and standard deviations of real vs simulated spike counts in plotted in Figs. 2e and 3i. To generate RPE tuning curves for real spike counts, we took z-scored spike counts and binned according to estimated RPEs. We performed this procedure for all RPE neurons and report the average tuning curve. To generate tuning curves for predicted spike counts, we simulated spike trains using neuron-derived parameter estimates and followed the same procedure.
Model recovery.
We simulated 200 RPE model neurons, 200 Current outcome model neurons, and 200 Unmodulated model neurons to assess whether our modeling recovery strategy could correctly classify neurons. For each neuron, we simulated 55 trials of the random sucrose/maltodextrin task. We constrained α to 0 to 1, slope (a) to 1 to 4, and the intercept (b) to −5 to 5. We again used 10 randomly-selected starting initial values for each parameter to avoid finding local minima.
Outcome history-based linear regression.
To estimate how the outcome of the current and previous trials affected the firing rate of the current trial, we conducted a complete-pooling linear regression analysis. We z-scored the firing rate of each neuron using the baseline activity across the set of 10s bins prior to each trial and combined the firing rates of all neurons of interest. Similarly, our design matrix included the current and ten previous trial outcomes for all neurons of interest. Significance for each trial lag was determined during model fitting using the t-statistic against the null hypothesis that the coefficient for that trial was zero (p < 0.05 cutoff). For the random sucrose/maltodextrin task, we gave maltodextrin a value of 0 and sucrose a value of 1. For the random sucrose/maltodextrin/water task, water was given a value of 0, sucrose was given a value of 1, and maltodextrin was given a value of 0.75 for RPE cells and 0.8 for current outcome cells, the values which achieved the maximum R2 for the linear regression. We followed the same process to generate outcome history regression coefficients for simulated neurons (Extended Data Figure 2).
Because the linear regression model can capture arbitrary linear relationships between outcome history and firing rate, it is not immediately clear what pattern of coefficients should be taken as evidence of RPE-coding. We can directly relate the linear regression model to the Rescorla-Wagner model to gain insight. To begin, the regression model takes the following form
Where f(t) is the firing rate on trial t, o(t) is the outcome (1 for sucrose, 0 for maltodextrin), βint is the regression coefficient for the intercept, and βi is the regression coefficient for o(t – i). This can be rearranged as
Recall that δ(t) = o(t) – V (t) in the Rescorla-Wagner model. We can relate the above equation to δ(t) if we assume
Therefore, the firing rate (after subtracting βint and scaling by β0) can be linearly related to the reward prediction error. To understand under what conditions we can relate the firing rate to RPE-coding, we can recursively expand V (t) as follows, where α is the learning rate (from (1))
allowing us to relate V (t) in the following two ways (the first from recursively expanding V (t) above; the second from our assumption that )
This means that the regressors (β1, β2, …) should decay exponentially (, , and so on), and that for i ≥ 1. In summary, regression coefficients with a positive β0 and negative βi’s (for i ≥ 1) that exponentially decay is consistent with RPE-coding, as seen in our data and in previous reports (4; 20).
Video analysis.
During recording sessions, videos were taken at 30 frames per second of the rats as they performed the task. During the optogenetic sessions, videos were taken at 6-8 frames per second. These videos permitted analysis of movement around the behavioral chamber. We used DeepLabCut (49; 50) in Python to determine the location of the rat’s head in each frame. DeepLabCut generates a likelihood for the location of each feature in each frame, and we discarded any frames below 0.95. We further processed the X-coordinate and Y-coordinate traces to remove outliers above 2 standard deviations of the median across moving 1s bins. These traces were used to calculate the location of the rat within a 0.2s window surrounding each cue onset and the locations of the rat in 0.2s bins from the last lick within the first 15s after reward delivery (or 15s even if rats were still licking) until the next cue onset for rats from the recording sessions, or from the final port exit within the first 10s after reward delivery (or 10s even if the rats were still in the port) until the next cue onset for rats from the optogenetic sessions. To find the average distance from the port during this time period, we found the area under the curve for distance from the port and divided by the total time. To compare this measure across sucrose and maltodextrin (or sucrose + laser trials), we found the average across all trials of each type for rat and compared the two groups with a Wilcoxon signed-rank test. For the electrophysiology experiment, this measure was then correlated (Spearman’s) to the activity of each RPE neuron in our bin of interest on each trial. To compare to shuffled data, we produced 1000 correlations for each neuron with shuffled trial order and compared the true mean to the distribution of means from the 1000 shuffled populations. For the optogenetic experiment, we calculated for each rat the fractional change in distance from the port produced by the laser by dividing the difference (laser - no laser) by the no laser value. We compared the values from these two groups with a Wilcoxon rank-sum test.
Evolution of activity across session.
To visualize how the reward-evoked activity of neurons changed across each reward block in the blocked task, we plotted the mean activity within our bin of interest (0.75s-1.95s post-reward delivery) for 5 groups of 3 trials at a time, equally spaced throughout the completed trials of each reward (and applied the same approach to the random sucrose/maltodextrin task, as well). To assess the impact of session progress on firing rate, we pooled the activity on each trial for all neurons of interest (say, RPE cells in sessions with sucrose block first) and the proportional progress throughout the session (of total completed trials) for the respective trial and performed a linear regression.
Statistics and reproducibility.
Data are presented as mean +/− s.e.m. unless otherwise noted. Statistical analyses were performed in MATLAB (MathWorks) on unsmoothed data. Specific tests are noted in the text, figure legends, and throughout the methods. We did not test for normality; rather, we elected to use non-parametric tests (Wilcoxon rank-sum and signed-rank tests) and Poisson models (although we replicated our main result with Gaussian models on z-scored spike counts). No statistical methods were used to pre-determine sample sizes, but our sample sizes are similar to those reported in previous publications (12; 22; 8). Data collection and analysis were not performed blind to the conditions of the experiments; however, the experimenter was not in the room during data collection, and the analysis scripts were applied uniformly to all subjects. For electrophysiology experiments, there were no features upon which to randomize. For optogenetic experiments, sex and experimental group were randomized across two cohorts (run consecutively on each day). Stimulus presentation was randomized and unique for each rat (except when we intentionally explored repeated stimulus presentation in the blocked sucrose/maltodextrin experiment). We excluded sessions where rats did not complete a sufficient number of trials for analysis (noted above). For electrophysiology sessions, we included the sessions that maximized the number of neurons recorded on each wire in order to increase our sample size. We excluded rats if the wires, virus, or optic fiber(s) were outside of VP (or NAc). The main finding of RPE signaling in VP was replicated in 4 different tasks across 2 groups of rats. The correlation between RPE signaling and task engagement was replicated in 2 tasks with the same group of rats. RPE signaling in NAc was only tested in one task. The optogenetic experiments were only conducted once each.
Reporting Summary.
Further information on research design is available in the Life Sciences Reporting Summary.
Code availabiliy.
The code used to analyze and visualize the data in this manuscript are available as Supplementary software and online at https://doi.org/10.12751/g-node.3lbd0c.
Extended Data
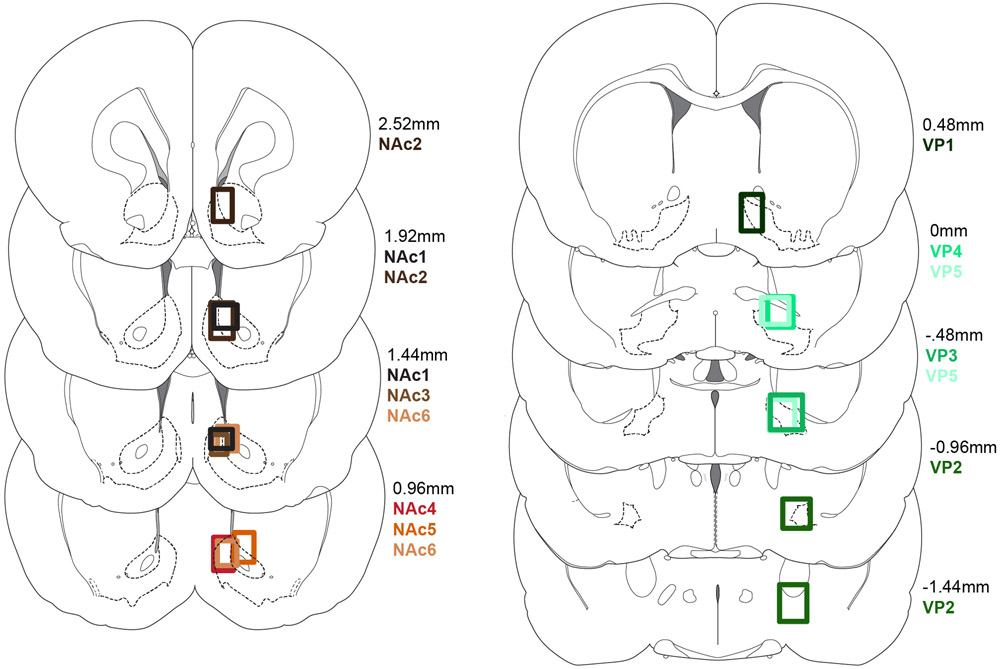
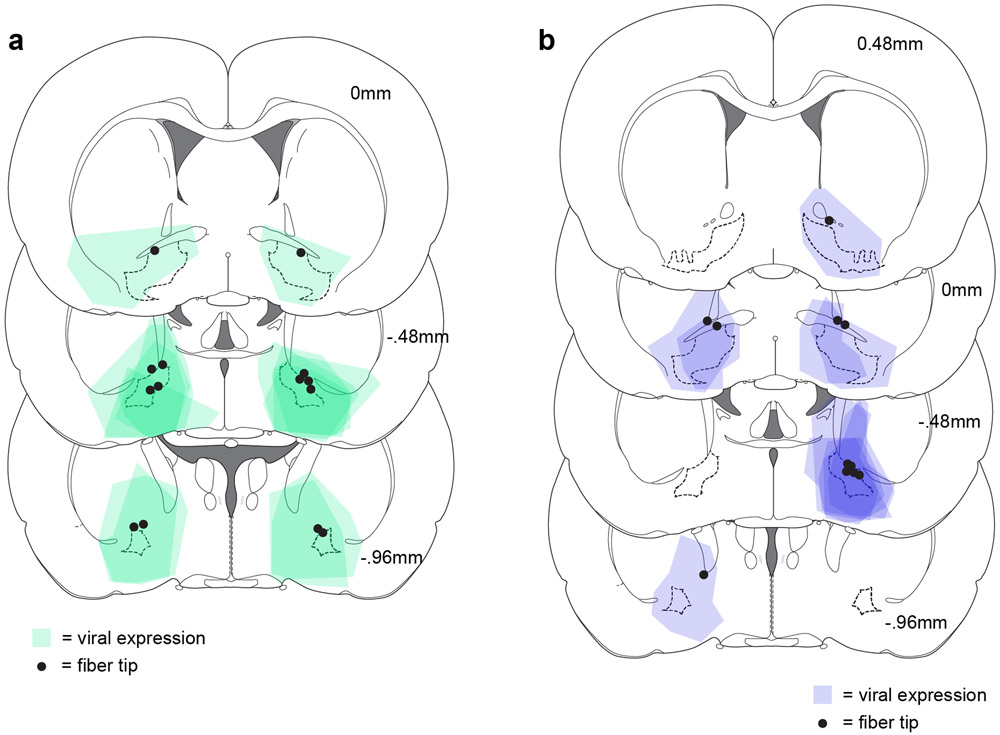
Extended Data Figure 1. Placements for random sucrose/maltodextrin, random sucrose/maltodextrin/water, and blocked sucrose/maltodextrin rats.
Recording locations for nucleus accumbens (left) and ventral pallidum (right) rats.
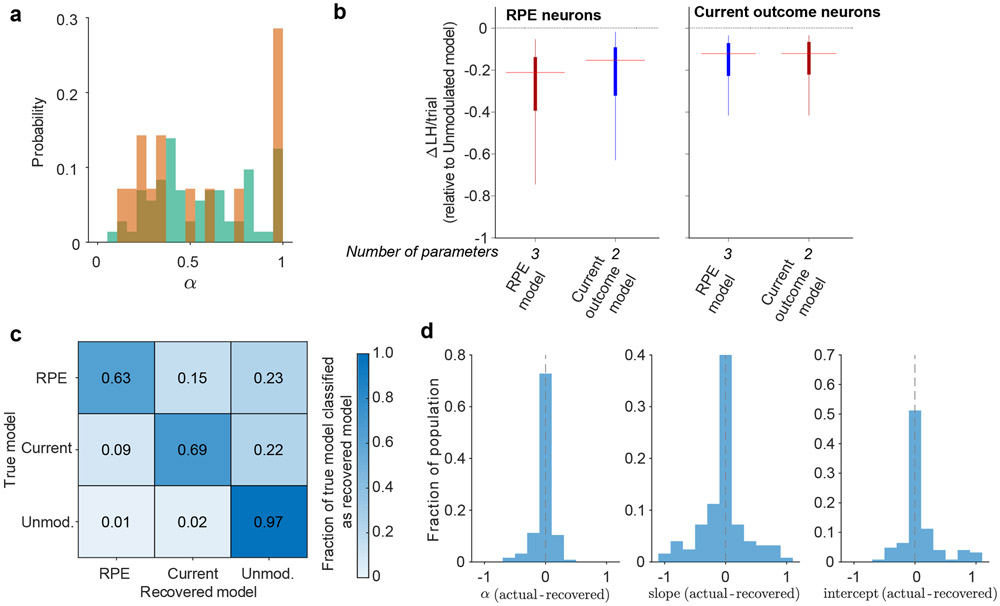
Extended Data Figure 2. Evaluation of model fitting.
(a) Distribution of the learning rate, α, for RPE neurons in VP (green) and NAc (orange). (b) Likelihood (LH) per trial for RPE (n=72) and Current outcome (n=126) neurons for RPE and Current outcome models, relative to the LH per trial of the Unmodulated model. Lower (more negative) indicates a better fit. Line represents median, box represents 25th and 75th percentile, and whiskers extend to 1.5 times the interquartile range. Red highlights the AIC-selected model. Median [25th to 75th percentile; min to max] ΔLH/trial are: RPE neurons, RPE model −0.21 [−0.39 to −0.14; −3.16 to −0.05], RPE neurons, Current outcome model −0.15 [−0.32 to −0.09; −3.03 to −0.02], Current outcome neurons, RPE model −0.12 [−0.23 to −0.07; −0.174 to −0.03], Current outcome neurons, Current outcome model −0.12 [−0.22 to −0.07; −1.73 to −0.03]. Median [25th-75th percentile] LH per trial for RPE neurons was 2.29 [2.04 to 2.49] and for Current outcome neurons was 2.15 [1.92 to 2.37]. (c) Model recovery, plotted as the fraction of neurons simulated with each model recovered as that model. (d) Distribution of difference between the true value of the parameters used to simulate the neurons in (c) and the values recovered by MLE.
Extended Data Figure 3. Placements for optogenetic experiments.
(a) Expression of ArchT3.0:YFP and fiber tip placement for the rats included in the ArchT3.0 group for the optogenetic experiment in Figure 3. (b) Expression of ChR2:GFP and fiber tip placement for the rats included in the ChR2 group. Pattern of results remained unchanged with or without inclusion of the rat with the most caudal placement.
Extended Data Figure 4. Supplemental optogenetic data.
(a) Mean(+/−SEM) port occupancy in time surrounding reward delivery on laser and no laser trials for YFP (left, n=7 rats) and ArchT (right, n=7 rats) groups. (b) Mean(+/−SEM) port occupancy in time surrounding reward delivery on laser and no laser trials for GFP (left, n=7 rats) and ChR2 (right, n=11 rats) groups. To account for the disruption of port occupancy by laser stimulation, we ran our distance from port analysis on the time beyond 15s past reward delivery and found the same pattern of results. (c) Additional optogenetic experiment in ChR2 rats and controls where the 2 sec of laser stimulation was at the onset of the cue. (d) Mean(+/−SEM) distance from port in the ITI following laser stimulation did not differ from no laser trials for GFP (p = 0.94, Wilcoxon signed-rank test, two-sided, n=7 rats) or ChR2 (p = 0.11, Wilcoxon signed-rank test, two-sided, n=10 rats) groups. (e) The effect of laser was similar across both groups (median: 0.06 GFP, n=7 rats; −0.09 ChR2, n=10 rats; p = 0.36, Wilcoxon rank-sum test, two-sided).
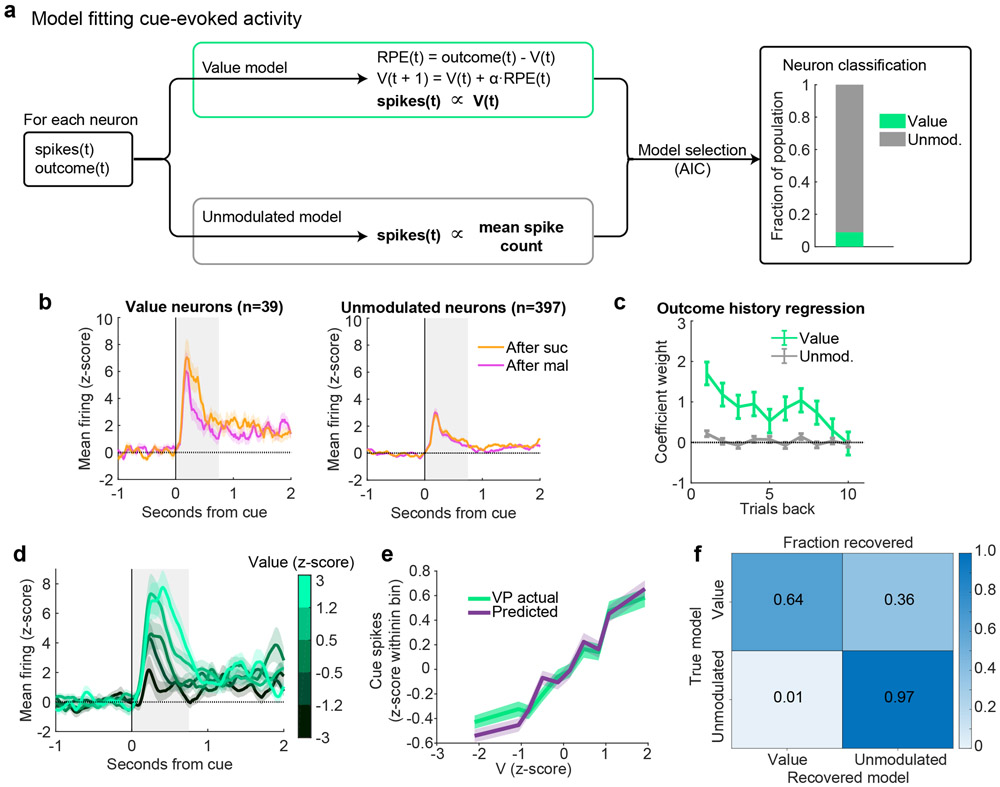
Extended Data Figure 5. Value encoding in VP at the time of cue onset in the random sucrose/maltodextrin task.
(a) Schematic of model-fitting and neuron classification process. For each neuron, the reward outcome and spike count following reward delivery on each trial were used to fit two models: Value and Unmodulated. Akaike information criterion (AIC) was used to select which model best fit each VP neuron’s activity (right). (b) Mean(+/−SEM) activity of neurons best fit by each of the models, plotted according to previous outcome. (c) Coefficients(+/−SE) for outcome history linear regression for each class of neurons (n=39 Value and 397 Unmodulated neurons). (d) Mean(+/−SEM) activity of all Value neurons with trials binned by model-derived Value. (e) Mean(+/−SEM) population activity of simulated and actual Value neurons according to each trial’s Value (V). (f) Model recovery, plotted as the fraction of neurons simulated with each model recovered as that model.
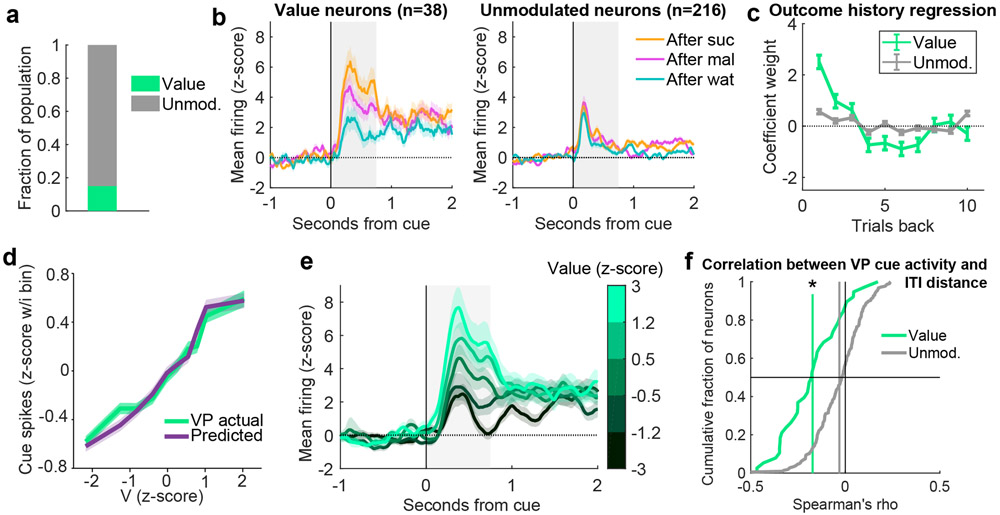
Extended Data Figure 6. Value encoding at the time of cue onset in the random sucrose/maltodextrin/water task.
(a) Fraction of VP neurons best fit by the Value and Unmodulated models in the random sucrose/maltodextrin/water task. (b) Mean(+/−SEM) activity of neurons best fit by each of the models, plotted according to previous outcome. (c) Coefficients(+/−SE) for outcome history linear regression for each class of neurons (n=38 Value and 216 Unmodulated neurons). (d) Mean(+/−SEM) population activity of simulated and actual Value neurons according to each trial’s Value (V). (e) Mean(+/−SEM) activity of all Value neurons with trials binned by model-derived Value. (f) Distribution of correlations between individual VP neurons’ firing rates at cue onset on each trial and the distance from the port during the previous ITI. * = p = 0.00001 for significant negative shift in mean correlation coefficient (vertical line) compared to 1000 shuffles of data for Value neurons, Wilcoxon signed-rank test, two-sided, as well as p = 0.0000002 for more negative coefficients for Value neurons compared to Unmodulated neurons, Wilcoxon rank-sum test, two-sided. See also Fig. 4c-d.
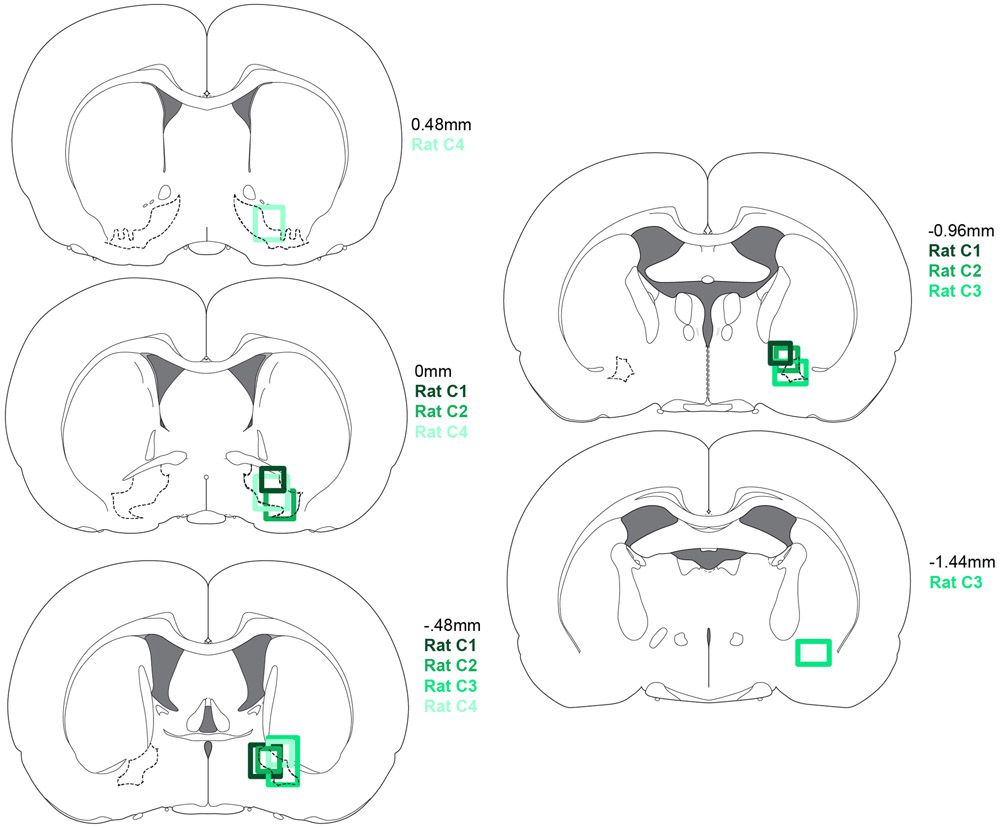
Extended Data Figure 7. Placements for predictable and random sucrose/maltodextrin rats.
Recording locations for rats from predictable and random sucrose/maltodextrin experiment in Extended Data Fig. 8.
Extended Data Figure 8. Cue-derived and outcome history-derived predictions separately impact VP firing.
(a) Three distinct auditory cues indicated three trial types: a 50/50 probability of receiving sucrose or maltodextrin solutions, a 100% probability of receiving sucrose, or a 100% probability of receiving maltodextrin, as seen in the example session (right). (b) Median latency to enter reward port following onset of cue for each trial type, plotted as the mean(+/−SEM) across all sessions for each rat (gray lines, n=8, 9, 10, and 10 sessions for the 4 rats) and the overall mean(+/−SEM) (n=37 sessions). (c) Percentage sucrose of total solution consumption in a two-bottle choice, before (“Initial”) and after (“Final”) recording. (d) Mean(+/−SEM) lick rate relative to pump onset for each trial type. (e) Mean(+/−SEM) activity of all neurons recorded in the predictable and random sucrose/maltodextrin task, aligned to reward delivery. (f) Schematic of cue model-fitting and neuron classification process. The reward outcome and spike count from each trial were used to fit six models: RPE, Current outcome, and Unmodulated with and without the cue effect, which allowed a different weight for the impact of each cue. Neurons were classified according to Akaike information criterion. (g) Fraction of the population best fit by each model. (h) Coefficients(+/−SE) for outcome history regression for each class of neurons with no cue effect (n=38 RPE, 135 Current outcome, and 204 Unmodulated neurons). (i) Mean(+/−SEM) activity of all RPE neurons with no cue effect (n=38 neurons). The trials for each neuron are binned according to their model-derived RPE. (j) Population activity of simulated and actual VP RPE neurons with no cue effect according to each trial’s RPE value. (k) Scatterplot of each cue effect neuron’s weight for specific sucrose and maltodextrin cues (n=7 RPE, 33 Current outcome, and 70 Unmodulated cells with cue effects). The percentage of neurons falling in each quadrant is indicated. The percentage in our quadrant of interest (bottom right, positive value for sucrose and negative value for maltodextrin) did not differ from chance (p > 0.09 for exact binomial test compared to null of 25%). (l) Mean(+/−SEM) activity of neurons with sucrose values > 0 and maltodextrin values < 0, consistent with a value-based cued expectation modulation. (m) Neurons with cue effects for cue-evoked signaling, rather than reward-evoked signaling, as in (g). (n) As in (k), for activity at the time of the cue rather than time of reward (n=143 neurons with cue effects). * = p < 0.0001 for exact binomial test compared to null of 25%. (o) As in (l), for activity at the time of the cue rather than time of reward.
Extended Data Figure 9. Classifying neurons with BIC instead of AIC.
(a) Fraction of neurons classified as RPE, Current outcome, and Unmodulated in VP and NAc in the random sucrose/maltodextrin task using Bayesian information criterion (BIC) as the selection criterion. (b) Coefficients(+/−SE) for outcome history regression for VP neurons of each BIC subset (n=37 RPE, 110 Current outcome, and 289 Unmodulated cells). (c) Population mean(+/−SEM) of all VP BIC RPE neurons, binned according to the model-derived RPE. (d) Mean(+/−SEM) population activity of simulated and actual BIC RPE neurons according to each trial’s RPE value for VP (left) and NAc (right). (e) Distribution of correlations between model-predicted and actual spiking for all RPE neurons from each region. (f) Distribution of α for RPE neurons in VP (green) and NAc (orange). (g) Mean(+/−SEM) activity of VP neurons classified as RPE by AIC but not BIC according to current and previous outcome. (h) Coefficients(+/−SE) for outcome history regression for these neurons (n=35 neurons). (i) Mean(+/−SEM) activity of these neurons binned according to model-derived RPE on each trial.
ACKNOWLEDGMENTS
This work was supported by National Institutes of Health grants 5 T32 NS91018-17 (D.J.O.), F30MH110084 (B.A.B.), K99 AA025384 (J.M.R.), Klingenstein-Simons (J.Y.C.), MQ(J.Y.C.), NARSAD (J.Y.C.), Whitehall (J.Y.C.), R01DA042038 (J.Y.C.), R01NS104834 (J.Y.C.), and R01DA035943 (P.H.J.), by a NARSAD Young Investigator Award (J.M.R.), and by the National Science Foundation Graduate Research Fellowship under Grant No. DGE-1746891 (D.J.O.). The authors thank K. Wang and X. Tong for technical assistance.
Footnotes
COMPETING INTERESTS
The authors declare no competing interests.
DATA AVAILABILITY
The data generated and analyzed for this manuscript are available publicly at https://doi.org/10.12751/g-node.3lbd0c.
REFERENCES
- 1.Sutton RS & Barto AG Introduction to reinforcement learning (MIT press; Cambridge, 1998). [Google Scholar]
- 2.Rescorla RA & Wagner AR A theory of pavlovian conditioning: Variations in the effectiveness of reinforcement and nonreinforcement. Classical conditioning II: Current research and theory 2, 64–99 (1972). [Google Scholar]
- 3.Schultz W, Dayan P & Montague PR A neural substrate of prediction and reward. Science 275, 1593–1599 (1997). [DOI] [PubMed] [Google Scholar]
- 4.Bayer HM & Glimcher PW Midbrain dopamine neurons encode a quantitative reward prediction error signal. Neuron 47, 129–141 (2005). [DOI] [PMC free article] [PubMed] [Google Scholar]
- 5.Smith KS, Tindell AJ, Aldridge JW & Berridge KC Ventral pallidum roles in reward and motivation. Behavioural brain research 196, 155–167 (2009). [DOI] [PMC free article] [PubMed] [Google Scholar]
- 6.Root DH, Melendez RI, Zaborszky L & Napier TC The ventral pallidum: Subregion-specific functional anatomy and roles in motivated behaviors. Progress in neurobiology 130, 29–70 (2015). [DOI] [PMC free article] [PubMed] [Google Scholar]
- 7.de Olmos JS & Heimer L The concepts of the ventral striatopallidal system and extended amygdala. Annals of the New York Academy of Sciences 877, 1–32 (1999). [DOI] [PubMed] [Google Scholar]
- 8.Richard JM, Ambroggi F, Janak PH & Fields HL Ventral pallidum neurons encode incentive value and promote cue-elicited instrumental actions. Neuron 90, 1165–1173 (2016). [DOI] [PMC free article] [PubMed] [Google Scholar]
- 9.Ottenheimer D, Richard JM & Janak PH Ventral pallidum encodes relative reward value earlier and more robustly than nucleus accumbens. Nature communications 9, 4350 (2018). [DOI] [PMC free article] [PubMed] [Google Scholar]
- 10.Fujimoto A et al. Signaling incentive and drive in the primate ventral pallidum for motivational control of goal-directed action. Journal of Neuroscience 39, 1793–1804 (2019). [DOI] [PMC free article] [PubMed] [Google Scholar]
- 11.White JK et al. A neural network for information seeking. Nature communications 10, 1–19 (2019). [DOI] [PMC free article] [PubMed] [Google Scholar]
- 12.Tindell AJ, Berridge KC & Aldridge JW Ventral pallidal representation of pavlovian cues and reward: population and rate codes. Journal of Neuroscience 24, 1058–1069 (2004). [DOI] [PMC free article] [PubMed] [Google Scholar]
- 13.Tachibana Y & Hikosaka O The primate ventral pallidum encodes expected reward value and regulates motor action. Neuron 76, 826–837 (2012). [DOI] [PMC free article] [PubMed] [Google Scholar]
- 14.Tian J et al. Distributed and mixed information in monosynaptic inputs to dopamine neurons. Neuron 91, 1374–1389 (2016). [DOI] [PMC free article] [PubMed] [Google Scholar]
- 15.Stephenson-Jones M et al. Opposing contributions of gabaergic and glutamatergic ventral pallidal neurons to motivational behaviors. Neuron 105, 921–933 (2020). [DOI] [PMC free article] [PubMed] [Google Scholar]
- 16.Kaplan A, Mizrahi-Kliger AD, Israel Z, Adler A & Bergman H Dissociable roles of ventral pallidum neurons in the basal ganglia reinforcement learning network. Nature Neuroscience 23, 556–564 (2020). [DOI] [PubMed] [Google Scholar]
- 17.Tooley J et al. Glutamatergic ventral pallidal neurons modulate activity of the habenula–tegmental circuitry and constrain reward seeking. Biological psychiatry 83, 1012–1023 (2018). [DOI] [PMC free article] [PubMed] [Google Scholar]
- 18.Faget L et al. Opponent control of behavioral reinforcement by inhibitory and excitatory projections from the ventral pallidum. Nature communications 9, 849 (2018). [DOI] [PMC free article] [PubMed] [Google Scholar]
- 19.Sclafani A, Hertwig H, Vigorito M & Feigin MB Sex differences in polysaccharide and sugar preferences in rats. Neuroscience & Biobehavioral Reviews 11, 241–251 (1987). [DOI] [PubMed] [Google Scholar]
- 20.Mohebi A et al. Dissociable dopamine dynamics for learning and motivation. Nature 570, 65–70 (2019). [DOI] [PMC free article] [PubMed] [Google Scholar]
- 21.Roesch MR, Calu DJ & Schoenbaum G Dopamine neurons encode the better option in rats deciding between differently delayed or sized rewards. Nature neuroscience 10, 1615 (2007). [DOI] [PMC free article] [PubMed] [Google Scholar]
- 22.Takahashi YK et al. Expectancy-related changes in firing of dopamine neurons depend on orbitofrontal cortex. Nature neuroscience 14, 1590 (2011). [DOI] [PMC free article] [PubMed] [Google Scholar]
- 23.Takahashi YK, Langdon AJ, Niv Y & Schoenbaum G Temporal specificity of reward prediction errors signaled by putative dopamine neurons in rat vta depends on ventral striatum. Neuron 91, 182–193 (2016). [DOI] [PMC free article] [PubMed] [Google Scholar]
- 24.Sutton RS Learning to predict by the methods of temporal differences. Machine learning 3, 9–44 (1988). [Google Scholar]
- 25.Nakahara H, Itoh H, Kawagoe R, Takikawa Y & Hikosaka O Dopamine neurons can represent context-dependent prediction error. Neuron 41, 269–280 (2004). [DOI] [PubMed] [Google Scholar]
- 26.Fiorillo CD, Tobler PN & Schultz W Discrete coding of reward probability and uncertainty by dopamine neurons. Science 299, 1898–1902 (2003). [DOI] [PubMed] [Google Scholar]
- 27.Eshel N et al. Arithmetic and local circuitry underlying dopamine prediction errors. Nature 525, 243 (2015). [DOI] [PMC free article] [PubMed] [Google Scholar]
- 28.Keiflin R & Janak PH Dopamine prediction errors in reward learning and addiction: from theory to neural circuitry. Neuron 88, 247–263 (2015). [DOI] [PMC free article] [PubMed] [Google Scholar]
- 29.Watabe-Uchida M, Eshel N & Uchida N Neural circuitry of reward prediction error. Annual review of neuroscience 40, 373–394 (2017). [DOI] [PMC free article] [PubMed] [Google Scholar]
- 30.Matsumoto M & Hikosaka O Lateral habenula as a source of negative reward signals in dopamine neurons. Nature 447, 1111 (2007). [DOI] [PubMed] [Google Scholar]
- 31.Tian J & Uchida N Habenula lesions reveal that multiple mechanisms underlie dopamine prediction errors. Neuron 87, 1304–1316 (2015). [DOI] [PMC free article] [PubMed] [Google Scholar]
- 32.Jhou TC, Fields HL, Baxter MG, Saper CB & Holland PC The rostromedial tegmental nucleus (rmtg), a gabaergic afferent to midbrain dopamine neurons, encodes aversive stimuli and inhibits motor responses. Neuron 61, 786–800 (2009). [DOI] [PMC free article] [PubMed] [Google Scholar]
- 33.Hong S, Jhou TC, Smith M, Saleem KS & Hikosaka O Negative reward signals from the lateral habenula to dopamine neurons are mediated by rostromedial tegmental nucleus in primates. Journal of Neuroscience 31, 11457–11471 (2011). [DOI] [PMC free article] [PubMed] [Google Scholar]
- 34.Niv Y, Daw ND, Joel D & Dayan P Tonic dopamine: opportunity costs and the control of response vigor. Psychopharmacology 191, 507–520 (2007). [DOI] [PubMed] [Google Scholar]
- 35.Hamid AA et al. Mesolimbic dopamine signals the value of work. Nature neuroscience 19, 117 (2016). [DOI] [PMC free article] [PubMed] [Google Scholar]
- 36.Bari BA et al. Stable representations of decision variables for flexible behavior. Neuron 103, 922–933 (2019). [DOI] [PMC free article] [PubMed] [Google Scholar]
- 37.Beier KT et al. Circuit architecture of vta dopamine neurons revealed by systematic input-output mapping. Cell 162, 622–634 (2015). [DOI] [PMC free article] [PubMed] [Google Scholar]
- 38.Hong S & Hikosaka O Diverse sources of reward value signals in the basal ganglia nuclei transmitted to the lateral habenula in the monkey. Frontiers in human neuroscience 7, 778 (2013). [DOI] [PMC free article] [PubMed] [Google Scholar]
- 39.Knowland D et al. Distinct ventral pallidal neural populations mediate separate symptoms of depression. Cell 170, 284–297 (2017). [DOI] [PMC free article] [PubMed] [Google Scholar]
- 40.Gale SD & Perkel DJ A basal ganglia pathway drives selective auditory responses in songbird dopaminergic neurons via disinhibition. Journal of Neuroscience 30, 1027–1037 (2010). [DOI] [PMC free article] [PubMed] [Google Scholar]
- 41.Chen R et al. Songbird ventral pallidum sends diverse performance error signals to dopaminergic midbrain. Neuron 103, 266–276 (2019). [DOI] [PMC free article] [PubMed] [Google Scholar]
- 42.Kearney MG, Warren TL, Hisey E, Qi J & Mooney R Discrete evaluative and premotor circuits enable vocal learning in songbirds. Neuron 104, 559–575 (2019). [DOI] [PMC free article] [PubMed] [Google Scholar]
- 43.Hnasko TS, Hjelmstad GO, Fields HL & Edwards RH Ventral tegmental area glutamate neurons: electrophysiological properties and projections. Journal of Neuroscience 32, 15076–15085 (2012). [DOI] [PMC free article] [PubMed] [Google Scholar]
- 44.Leung BK & Balleine BW Ventral pallidal projections to mediodorsal thalamus and ventral tegmental area play distinct roles in outcome-specific pavlovian-instrumental transfer. Journal of Neuroscience 35, 4953–4964 (2015). [DOI] [PMC free article] [PubMed] [Google Scholar]
- 45.Prasad AA et al. Complementary roles for ventral pallidum cell types and their projections in relapse. Journal of Neuroscience 40, 880–893 (2020). [DOI] [PMC free article] [PubMed] [Google Scholar]
- 46.Richard JM, Stout N, Acs D & Janak PH Ventral pallidal encoding of reward-seeking behavior depends on the underlying associative structure. Elife 7, e33107 (2018). [DOI] [PMC free article] [PubMed] [Google Scholar]
- 47.Ottenheimer DJ, Wang K, Haimbaugh A, Janak PH & Richard JM Recruitment and disruption of ventral pallidal cue encoding during alcohol seeking. European Journal of Neuroscience 50, 3428–3444 (2019). [DOI] [PMC free article] [PubMed] [Google Scholar]
- 48.Elber-Dorozko L & Loewenstein Y Striatal action-value neurons reconsidered. eLife 7 (2018). [DOI] [PMC free article] [PubMed] [Google Scholar]
- 49.Mathis A et al. Deeplabcut: markerless pose estimation of user-defined body parts with deep learning. Nature neuroscience 21, 1281 (2018). [DOI] [PubMed] [Google Scholar]
- 50.Nath T et al. Using deeplabcut for 3d markerless pose estimation across species and behaviors. Nature protocols 14, 2152–2176 (2019). [DOI] [PubMed] [Google Scholar]
Associated Data
This section collects any data citations, data availability statements, or supplementary materials included in this article.
Data Availability Statement
The data generated and analyzed for this manuscript are available publicly at https://doi.org/10.12751/g-node.3lbd0c.


