

Abstract
Background:
Drug induced anaphylaxis is a well-known adverse drug reaction for some drug classes, but emerging drug causes of anaphylaxis and novel mechanisms may contribute in unrecognized ways.
Objective:
We sought to determine the top drugs reported in association with anaphylaxis and anaphylaxis followed by death in the FDA Adverse Event Reporting System (FAERS).
Methods:
We reviewed the publicly available FAERS database from 1999-2019. Using search terms “anaphylactic shock” or “anaphylactic reaction” and sorting cases by generic drug names, we counted and trended reports to FAERS in which a drug was associated with anaphylaxis or anaphylaxis followed by death.
Results:
From 1999-2019, there were 17,506,002 adverse drug events reported in FAERS, of which 47,496 (0.27%) were reported as anaphylaxis. Excluding patients without age, sex, or country data, respectively, the median age of patients in reports of anaphylaxis was 52 [IQR: 28], 62.71% were female, and 13,899/34,381 (40.43%) reports were from the US. There were 2,984/47,496 (6.28%) reports of anaphylaxis followed by death. Top drug classes associated with anaphylaxis in FAERS were antibiotics, monoclonal antibodies (mAbs), NSAIDs and acetaminophen. Top drug classes associated with anaphylaxis deaths were antibiotics, radiocontrast agents and intraoperative agents. Linear regression demonstrated reports of anaphylaxis to mAbs increasing at an average rate of 0.77 percent of total anaphylaxis reports per year (95% CI: 0.65, 0.88)from 2.00% in 1999 to 17.37% in 2019, faster than any other drug class.
Conclusion:
Antibiotics were highly reported for anaphylaxis overall and anaphylaxis followed by death. Increasing reports were noted for anaphylaxis to monoclonal antibody therapies.
Keywords: FDA, FAERS, anaphylaxis, drug allergy, death, fatal
Introduction:
Drug induced anaphylaxis is a well-known, life-threatening and feared side effect for some drug classes, but emerging drug causes of anaphylaxis and novel mechanisms leading to non-IgE mediated mast cell activation may contribute. IgE-mediated anaphylaxis to beta-lactam antibiotics, while rare,1 is probably the best appreciated and most rapidly recognized version of drug-induced anaphylaxis. NSAIDs are implicated in a wide variety of immediate, accelerated and delayed type reactions via several potential mechanisms, and have therefore received their own reaction classification scheme.2 Recent discoveries of non-IgE mediated mechanisms for mast cell degranulation via the MRGPRX2 receptor are relevant for understanding immediate drug hypersensitivity reactions to multiple categories of drugs such as neuromuscular blocking agents, fluoroquinolones, opiates, vancomycin, and contrast agents, but data about the scope of such reactions is limited.3–5
Our group, along with others, has previously used data from the publicly available FDA Adverse Event Reporting System (FAERS) to assess the scope to which specific drugs are reported in association with anaphylaxis.6–12 Cases of drug associated adverse events are required to be reported to FAERS if received by the drug’s manufacturer, and are also reported to FAERS on a voluntary basis by patients or by healthcare professionals at the point of care. In addition, all drugs given in temporal association with an adverse drug reaction are reported; firm causality of an individual drug in association with the adverse event can be difficult to determine, and rescue medications such as epinephrine are frequently included. As a result, FAERS is limited by its nature, such that firm conclusions about prevalence, incidence and causality of adverse drug reactions cannot be drawn, and significant biases in reporting can exist based upon national attention or regional awareness. Despite these limitations, FAERS contains a large repository of drug associated adverse events, and to our knowledge, no one has ever looked at this database to determine which drugs are reported most frequently to the FDA in association with anaphylaxis. Therefore, we sought to determine the top 50 drugs reported in association with anaphylaxis and which drugs were associated with more than 20 reports of anaphylaxis followed by death. We also sought to assess how these reports were changing over time and how this compares with contemporary reported literature.
Methods:
To evaluate the scope to which cases of anaphylaxis are reported to the FDA in association with specific drugs, we undertook a review of the publicly available FDA FAERS database13 from 1999 through 2019 using the search terms “anaphylactic shock” or “anaphylactic reaction” and sorting cases by generic drug names.
To develop a weighting of individual drug reports we determined the top 50 drugs associated with anaphylaxis in FAERS from 1999 to 2019, based upon the total counts of reports associated with the generic drug, and then divided these into US reports versus non-US reports. The top 10 drugs associated with anaphylaxis were determined for the six countries reporting the most FAERS anaphylactic cases: United States, United Kingdom, Germany, France, Japan and Canada. Year over year trends in these top 50 drugs, as well as other relevant classes, were evaluated as a percentage of total anaphylaxis reports to the FDA, using time series plots and linear regression.
Finally, we identified drugs associated with 20 or more cases of anaphylaxis reported to the FDA that ended in a patient death, to understand whether these drugs might mirror or differ from the top drugs reported in association with anaphylaxis in general or provide clues to which drugs might be associated with non-IgE mediated mast cell activation versus true IgE mediated reactions and anaphylaxis. For each, we calculated the percent of their total FAERS anaphylactic reactions that was followed by a patient death. The data reported by the FAERS database is limited in terms of death causality, as individual reports do not firmly establish anaphylaxis as the cause for death, only that it preceded death. Hence, we chose the term “anaphylaxis followed by death”, abbreviated throughout this manuscript as “anaphylaxis death” rather than “fatal anaphylaxis.” Year over year trends in anaphylaxis death to individual drugs were evaluated as a percentage of total anaphylaxis death to the FDA, using time series plots and linear regression.
Our methods for generating the relevant dataset, performing the calculations in the tables, and evaluating changes in reporting over time can be found in the Online Repository Text.
Results:
The Top 50 Drugs Associated with Anaphylaxis:
During our study period from 1999-2019, there were 17,506,002 adverse events reported to the FDA, of which 47,496 (0.27%) were reported as anaphylactic reaction or anaphylactic shock. The median age of patients in reports of anaphylaxis was 52 [IQR: 28] and 62.71% were female. (Table 1, Figure 1)
Table 1:
The Top 50 Drugs Associated with Reports of Anaphylactic Shock or Anaphylactic Reaction to the FDA from 1999-2019
| Drug Name and Rank | Total Adverse Event Reports | Anaphylaxis Reports (% of Total Adverse Event Reports) Bolded if >10% | United States Anaphylaxis Reports (% of Drug-Specific Anaphylaxis Reports⌘) Bolded if <10% or >60% (n=34381⌘) | Maximum Anaphylaxis Reports in a Year (Year) | Median Year [IQR]& | Reported Female (%) (n=42816⌘) | Age Median [IQR] (n=35727⌘)& |
|---|---|---|---|---|---|---|---|
| Overall Database from 1999–2019 | 17506002 | 47496 (0.27%) | 13899 (40.43%) | 6287 (2019) | 2014 [9] | 26851 (62.71%) | 52 [28] |
| Top 50 Drugs Combined | 2708904 | 25982 (0.96%) | 7015 (34.81%) | 3756 (2019) | 2014 [9] | 14890 (63.41%) | 52 [27] |
| 1. Omalizumab | 33196 | 2079 (6.26%) | 1162 (58.45%) | 414 (2019) | 2016 [5] | 1506 (83.11%) | 39 [24] |
| 2. Propofol | 13271 | 1613 (12.15%) | 54 (4.05%) | 347 (2019) | 2015 [7] | 853 (55.90%) | 53 [24] |
| 3. Infliximab | 136641 | 1559 (1.14%) | 495 (37.02%) | 273 (2019) | 2015 [8] | 931 (70.85%) | 36 [35] |
| 4. Moxifloxacin | 21671 | 1394 (6.43%) | 728 (77.45%) | 275 (2008) | 2009 [4] | 813 (67.19%) | 51 [20] |
| 5. Rocuronium | 4595 | 1178 (25.63%) | 39 (4.23%) | 265 (2019) | 2016 [5] | 652 (58.48%) | 55 [24] |
| 6. Amoxicillin Clavulanic Acid | 24558 | 1120 (4.56%) | 50 (4.90%) | 167 (2019) | 2013 [9] | 553 (54.97%) | 53 [26] |
| 7. Ibuprofen | 81572 | 1015 (1.24%) | 235 (28.55%) | 182 (2019) | 2015 [6] | 536 (60.84%) | 39 [37] |
| 8. Amoxicillin | 23943 | 1005 (4.20%) | 73 (8.51%) | 246 (2019) | 2016 [8] | 507 (54.99%) | 53 [23] |
| 9. Acetaminophen | 191130 | 996 (0.52%) | 205 (24.46%) | 175 (2019) | 2015 [7] | 507 (58.01%) | 39 [35] |
| 10. Diclofenac | 44015 | 975 (2.22%) | 36 (4.40%) | 190 (2019) | 2016 [7] | 557 (61.89%) | 55 [22] |
| 11. Adalimumab | 444944 | 894 (0.20%) | 332 (38.12%) | 315 (2019) | 2018 [4] | 694 (83.31%) | 49 [21] |
| 12. Rituximab | 84707 | 837 (0.99%) | 205 (30.33%) | 234 (2019) | 2017 [5] | 520 (71.23%) | 54 [22] |
| 13. Methotrexate | 142703 | 817 (0.57%) | 131 (17.63%) | 373 (2019) | 2018 [2] | 620 (81.05%) | 51 [20] |
| 14. Ceftriaxone | 16592 | 791 (4.77%) | 103 (17.64%) | 70 (2018) | 2013 [11] | 365 (52.14%) | 54 [36] |
| 15. Cefuroxime | 7963 | 771 (9.68%) | 28 (4.24%) | 104 (2019) | 2015 [8] | 436 (60.81%) | 52 [23] |
| 16. Paclitaxel | 57407 | 746 (1.30%) | 76 (15.11%) | 120 (2019) | 2014 [13] | 515 (74.64%) | 60 [16] |
| 17. Etanercept | 510674 | 719 (0.14%) | 233 (33.87%) | 278 (2019) | 2018 [5] | 594 (89.86%) | 52 [17] |
| 18. Fentanyl | 101564 | 714 (0.70%) | 120 (22.10%) | 140 (2019) | 2015 [9] | 371 (57.79%) | 50 [31] |
| 19. Lidocaine | 20670 | 699 (3.38%) | 101 (18.30%) | 132 (2019) | 2015 [8] | 364 (56.79%) | 51 [29] |
| 20. Naproxen | 83622 | 694 (0.83%) | 240 (53.69%) | 83 (2019) | 2012 [10] | 435 (69.94%) | 53 [20] |
| 21. Carboplatin | 48464 | 647 (1.34%) | 68 (16.55%) | 122 (2019) | 2015 [11] | 454 (81.22%) | 62 [16] |
| 22. Ranitidine | 23961 | 621 (2.59%) | 54 (10.23%) | 96 (2019) | 2014 [8] | 367 (64.84%) | 56 [32] |
| 23. Human IgG | 41480 | 619 (1.49%) | 250 (53.53%) | 91 (2019) | 2016 [7] | 335 (60.69%) | 48 [42] |
| 24. Sufentanil | 2745 | 606 (22.08%) | 0 (0%) | 161 (2019) | 2016 [8] | 348 (59.49%) | 53 [22] |
| 25. Oxaliplatin | 37422 | 590 (1.58%) | 39 (8.57%) | 115 (2019) | 2016 [7] | 264 (48.80%) | 62 [14] |
| 26. Cetuximab | 22466 | 565 (2.51%) | 301 (67.79%) | 56 (2010) | 2012 [7] | 84 (16.94%) | 63 [12] |
| 27. Cefazolin | 4089 | 557 (13.62%) | 56 (14.07%) | 85 (2019) | 2013 [10] | 295 (57.39%) | 52 [29] |
| 28. Aspirin | 138757 | 557 (0.40%) | 192 (39.75%) | 84 (2019) | 2015 [8] | 299 (62.16%) | 51 [32] |
| 29. Glatiramer | 41333 | 548 (1.33%) | 340 (75.06%) | 94 (2018) | 2015 [8] | 447 (84.82%) | 40 [18] |
| 30. Methylprednisolone | 35944 | 529 (1.47%) | 120 (28.78%) | 73 (2019) | 2014 [9] | 289 (59.47%) | 50 [37] |
| 31. Lisinopril | 43188 | 529 (1.22%) | 216 (63.91%) | 65 (2019) | 2015 [7] | 193 (38.37%) | 62 [16] |
| 32. Natalizumab | 151024 | 514 (0.34%) | 366 (81.33%) | 61 (2013) | 2013 [5] | 398 (79.13%) | 43 [18] |
| 33. Celecoxib | 60716 | 511 (0.84%) | 113 (30.79%) | 123 (2019) | 2013 [11] | 333 (75.68%) | 56 [19] |
| 34. Levofloxacin | 43855 | 508 (1.16%) | 125 (46.13%) | 48 (2018) | 2010.5 [11] | 293 (63.15%) | 52 [26.5] |
| 35. Iopromide | 6347 | 487 (7.67%) | 52 (22.41%) | 42 (2006) | 2007 [10] | 253 (53.26%) | 60 [22] |
| 36. Succinylcholine | 2440 | 475 (19.47%) | 23 (5.96%) | 88 (2019) | 2013 [9] | 294 (65.63%) | 51 [23] |
| 37. Metronidazole | 21420 | 461 (2.15%) | 70 (18.82%) | 79 (2019) | 2016 [5] | 292 (69.19%) | 50 [32.5] |
| 38. Midazolam | 8539 | 460 (5.39%) | 49 (14.54%) | 53 (2018) | 2013 [7] | 230 (53.49%) | 53 [27] |
| 39. Dexamethasone | 69241 | 460 (0.66%) | 51 (14.37%) | 124 (2019) | 2017 [6] | 240 (58.97%) | 55 [28] |
| 40. Abatacept | 54891 | 421 (0.77%) | 84 (20.24%) | 223 (2019) | 2019 [2] | 373 (93.95%) | 54 [18] |
| 41. Morphine | 72360 | 414 (0.57%) | 179 (52.49%) | 93 (2019) | 2016 [5] | 263 (70.70%) | 53.5 [23.5] |
| 42. Vancomycin | 24075 | 414 (1.72%) | 132 (48.71%) | 77 (2019) | 2016 [6] | 195 (51.45%) | 59 [29] |
| 43. Atracurium | 1623 | 406 (25.02%) | 1 (0.31%) | 58 (2019) | 2015 [8] | 232 (59.79%) | 51 [25] |
| 44. Epinephrine | 13540 | 385 (2.84%) | 124 (41.61%) | 57 (2019) | 2016 [6] | 199 (61.23%) | 47 [29] |
| 45. Iopamidol | 3779 | 384 (10.16%) | 91 (39.39%) | 30 (2017 – 2019) | 2012 [9] | 176 (46.56%) | 64 [23] |
| 46. Ciprofloxacin | 42232 | 378 (0.90%) | 120 (44.61%) | 48 (2016, 2019) | 2015 [7] | 224 (66.08%) | 53 [30] |
| 47. Tocilizumab | 39275 | 378 (0.96%) | 106 (29.69%) | 150 (2019) | 2018 [4] | 309 (87.29%) | 54 [15] |
| 48. Ondansetron | 16129 | 333 (2.06%) | 38 (13.24%) | 53 (2019) | 2015 [7] | 244 (76.49%) | 52 [29.5] |
| 49. Hydroxychloroquine | 24495 | 331 (1.35%) | 47 (14.55%) | 175 (2019) | 2019 [1] | 306 (97.14%) | 52 [17] |
| 50. Iohexol | 5593 | 326 (5.83%) | 42 (19.91%) | 47 (2015) | 2015 [6] | 153 (57.30%) | 59 [25] |
Percentages reflect reports with available data, not total data. Reports without country, sex, or age data (depending on the specific measurement) were excluded from these denominators for each drug and drug class.
Years or interquartile ranges that end in .5 denote the presence of two medians or quartiles, respectively.
Figure 1.
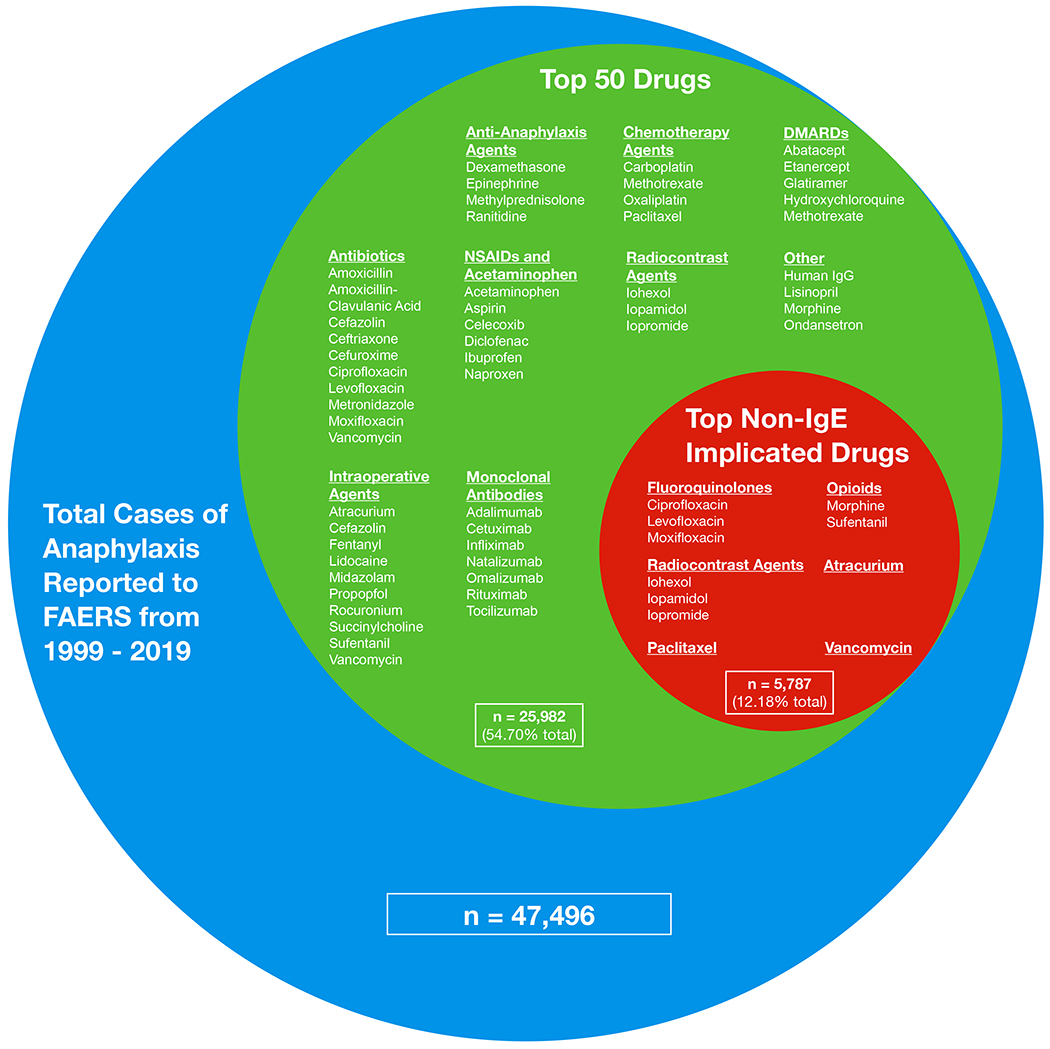
Top 50 drugs associated with a report of anaphylactic shock or anaphylactic reaction to the FDA Adverse Event Reporting System (FAERS) from 1999 to 2019, separated further by drugs with reported non-IgE implicated mast cell activation. Relative size of circles correlates with percent of total cases reported.
The top 50 drugs associated with a report of anaphylaxis to the FDA are shown in Figure 1. These top 50 drugs comprised 25,982 (54.7%) of all reports associated with anaphylaxis to the FDA during the study period. Reports from the United States comprised 13899/34381 (40.43%) of all FAERS anaphylactic reports that had an associated country.
When grouped into functional classes (Table 2, E1), the main drug classes reported to the FDA in association with anaphylaxis in descending order were antibiotics, monoclonal antibodies, NSAIDs and acetaminophen, intraoperative agents, chemotherapy agents, DMARDs, anti-anaphylaxis agents, radiocontrast agents, and “other”.
Table 2:
The Top 50 Drugs Associated with Reports of Anaphylactic Shock or Anaphylactic Reaction to the FDA from 1999-2019 – Drug Classes
| Drug Class | Anaphylaxis Reports (% of Total Anaphylaxis Reports) | United States Anaphylaxis Reports (% of Class-Specific Anaphylaxis Reports⌘) (n=34381⌘) | Maximum Anaphylaxis Reports in a Year (Year) | Median Year [IQR] | Reported Female (%) (n=42816⌘) | Age Median [IQR] (n=35727⌘) | Average % Change per Year (95% CI), P value* |
|---|---|---|---|---|---|---|---|
| Antibiotics | 7061 (14.87%) | 1411 (26.45%) | 875 (2019) | 2012 [9] | 3800 (59.52%) | 53 [27] | −0.02 (−0.35, 0.31), P = .91 |
| Monoclonal Antibodies | 6202 (13.06%) | 2838 (51.58%) | 1092 (2019) | 2015 [7] | 3892 (71.15%) | 45 [28] | 0.77 (0.65, 0.88), P < .001 |
| NSAIDs and Acetaminophen | 4196 (8.83%) | 924 (28.28%) | 684 (2019) | 2015 [9] | 2353 (62.70%) | 49 [28] | 0.12 (0.01, 0.23), P = .03 |
| Intraoperative Agentsa | 4078 (8.59%) | 432 (14.16%) | 747 (2019) | 2015 [10] | 2237 (58.64%) | 53 [26] | 0.08 (−0.07, 0.22), P = .30 |
| Chemotherapy Agents | 2639 (5.56%) | 297 (14.42%) | 693 (2019) | 2017 [8] | 1754 (72.54%) | 58 [18] | 0.08 (−0.09, 0.25), P = .33 |
| DMARDs | 1906 (4.01%) | 731 (43.05%) | 534 (2019) | 2017 [6] | 1456 (82.49%) | 49 [20] | 0.28 (0.20, 0.35), P < .001 |
| Anti–Anaphylaxis Agents | 1856 (3.91%) | 336 (21.99%) | 330 (2019) | 2015 [7] | 1006 (60.75%) | 51 [32] | 0.14 (0.10, 0.18), P < .001 |
| Radiocontrast Agents | 1196 (2.52%) | 185 (27.49%) | 95 (2015) | 2011 [11] | 582 (52.01%) | 61 [23] | −0.18 (−0.23, −0.12), P < .001 |
| Other | 1871 (3.94%) | 673 (47.56%) | 298 (2019) | 2015 [7] | 1016 (58.97%) | 57 [26] | 0.19 (0.14, 0.23), P < .001 |
| Drugs in Top 50 Implicated in Non-IgE Mediated Reactionsb | 5787 (12.18%) | 1522 (39.06%) | 651 (2019) | 2012 [10] | 3290 (62.19%) | 56 [23] | −0.31 (−0.50, −0.13), P < .001 |
| Overall Database from 1999-2019 | 47496 | 13899 (40.43%) | 6287 (2019) | 2014 [9] | 26851 (62.71%) | 52 [28] |
Propofol, Rocuronium, Fentanyl, Lidocaine, Sufentanil, Cefazolin, Succinylcholine, Midazolam, Vancomycin, Atracurium
Fluoroquinolones (Moxifloxacin, Levofloxacin, Ciprofloxacin), Opioids (Sufentanil, Morphine), Radiocontrast Agents (Iopromide, Iopamidol, Iohexol), Atracurium, Paclitaxel, Vancomycin
Percentages reflect reports with available data, not total data. Reports without country, sex, or age data (depending on the specific measurement) were excluded from these denominators for each drug class.
Average change in % per year calculated as the slope of linear regression. Linear regressions with P < .05 were considered significant.
The Top Drug Classes Associated with Anaphylaxis
By class, antibiotics were the most reported drug class in association with anaphylaxis, comprising 14.87% of all anaphylactic reactions reported to FDA during our study period. (Table 2) The proportion of antibiotic-associated anaphylaxis cases peaked in 2008 at 26.53% of all anaphylactic reports, coinciding with a spike of 275 moxifloxacin-associated anaphylaxis reports. (Table E1) Monoclonal antibodies (mAbs) were the second most reported class of drugs at 13.06% of all reports during our study period, followed by NSAIDs and acetaminophen (8.83%) and intraoperative agents (8.59%). Omalizumab was the number one drug reported in association with anaphylaxis to the FDA, comprising 4.38% of all anaphylaxis-associated reports. However, if amoxicillin and amoxicillin-clavulanic acid were combined, amoxicillin containing drugs would be the top drug reported in association with anaphylaxis at 4.41% (2,096/47,496) of all anaphylactic reports.
Linear regression was performed for each of the major drug classes associated with anaphylaxis. Regression on mAbs (Table 2, Figure 2) demonstrated an increasing slope over time, with the percentage of anaphylaxis reactions each year that were associated with mAbs increasing at an average rate of 0.77 percent of total anaphylaxis reports to the FDA (95% CI: 0.65, 0.88) from 2.00% in 1999 to 17.37% in 2019, faster than any other drug class. Linear regressions on NSAIDs and acetaminophen, DMARDs, and anti-anaphylaxis agents also showed a trend toward an increasing percentage of anaphylactic reactions being reported to the FDA over our study period. Radiocontrast agents (−0.18 percent per year) and drugs implicated in non-IgE mediated reactions (−0.31 percent per year) decreased in their share of all anaphylaxis reactions reported over our study period. The other drug classes (antibiotics, intraoperative agents, chemotherapy agents) did not have a slope that differed significantly from a null hypothesis of stable percentages of reports over time.
Figure 2.
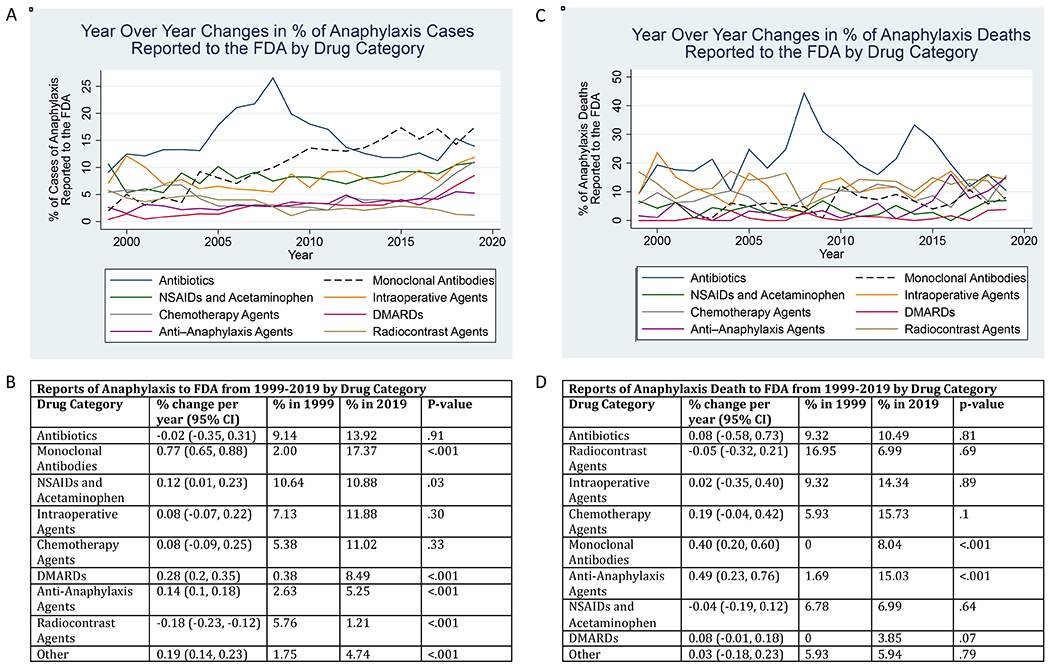
A) The percent of anaphylaxis cases reported to the FDA Adverse Event Reporting Systems (FAERS) in association with drug classes. B) Linear regressions on the percent of anaphylaxis cases reported in association with drug classes. Slopes, 95% confident interval, P values, and percentages in 1999 and 2019 are included for each drug class. C) The percent of anaphylaxis death cases reported to the FDA Adverse Event Reporting Systems (FAERS) in association with drug classes. D) Linear regressions on the percent of anaphylaxis death cases reported in association with drug classes. Slopes, 95% confident interval, P values, and percentages in 1999 and 2019 are included for each drug class. Intraoperative agent class was selected a priori to include Propofol, Rocuronium, Fentanyl, Lidocaine, Sufentanil, Cefazolin, Succinylcholine, Midazolam, Vancomycin, Atracurium, and Sevoflurane.
Reporting Considerations: Country Data
We next calculated the proportion of each drug’s anaphylactic cases that were reported in the United States. US reports of anaphylaxis made up 13,899/34,381 (40.43%) of all FAERS-reported anaphylactic reactions with an associated country. Intraoperative agents (14.16%) and chemotherapy agents (14.42%) had less than 15% of their anaphylaxis cases reported in the US. All other classes fell within the range of 20 – 52%. (Table 1, 2)
Of the top 50 drugs, moxifloxacin, cetuximab, glatiramer, lisinopril, and natalizumab had over 60% of their anaphylaxis cases reported in the US, whereas propofol, rocuronium, amoxicillin-clavulanic acid, amoxicillin, diclofenac, cefuroxime, sufentanil, oxaliplatin, succinylcholine, and atracurium had less than 10% of their anaphylaxis cases reported in the US. Propofol, rocuronium, amoxicillin clavulanic acid, amoxicillin, and diclofenac were all in the top 10 drugs associated with anaphylaxis reports to the FDA, but cases were driven by reports outside the US.
To better discern the sources for anaphylaxis cases that were reported outside the US, we identified the five non-US countries (France, UK, Japan, Canada, and Germany) that reported the most anaphylactic reactions to the FDA during our study period, and measured the top 10 drugs that contributed to each country’s anaphylaxis-associated reports. (Table 3, Figure E1)
Table 3:
The Top 6 Countries Associated with a Report of Anaphylactic Shock or Anaphylactic Reaction to the FDA from 1999–2019 – Top 10 Drugs
| 1. United States | 2. France | 3. United Kingdom | |||
|---|---|---|---|---|---|
| Drug Name | Anaphylaxis Reports (% of Total Country Anaphylaxis Reports) | Drug Name | Anaphylaxis Reports (% of Total Country Anaphylaxis Reports) | Drug Name | Anaphylaxis Reports (% of Total Country Anaphylaxis Reports) |
| Total Country Anaphylaxis Reports | 13899 | Total Country Anaphylaxis Reports | 3268 | Total Country Anaphylaxis Reports | 3030 |
| Omalizumab | 1162 (8.36%) | Propofol | 766 (23.44%) | Augmentin | 287 (9.47%) |
| Moxifloxacin | 728 (5.24%) | Sufentanil | 496 (15.18%) | Rocuronium | 238 (7.85%) |
| Infliximab | 495 (3.56%) | Amoxicillin | 401 (12.27%) | Metronidazole | 160 (5.28%) |
| Natalizumab | 366 (2.63%) | Augmentin | 350 (10.71%) | Fentanyl | 130 (4.29%) |
| Glatiramer | 340 (2.45%) | Succinylcholine | 286 (8.75%) | Propofol | 118 (3.89%) |
| Adalimumab | 332 (2.39%) | Ketamine | 216 (6.61%) | Amoxicillin | 112 (3.70%) |
| Cetuximab | 301 (2.17%) | Rocuronium | 214 (6.55%) | Atracurium | 103 (3.40%) |
| Human Immunoglobulin G | 250 (1.80%) | Atracurium | 185 (5.66%) | Lisinopril | 97 (3.20%) |
| Naproxen | 240 (1.73%) | Remifentanil | 182 (5.57%) | Cefuroxime | 94 (3.10%) |
| Ibuprofen | 235 (1.69%) | Acetaminophen | 179 (5.48%) | Ibuprofen | 89 (2.94%) |
| 4. Japan | 5. Canada | 6. Germany | |||
| Drug Name | Anaphylaxis Reports (% of Total Country Anaphylaxis Reports) | Drug Name | Anaphylaxis Reports (% of Total Country Anaphylaxis Reports) | Drug Name | Anaphylaxis Reports (% of Total Country Anaphylaxis Reports) |
| Total Country Anaphylaxis Reports | 2484 | Total Country Anaphylaxis Reports | 1790 | Total Country Anaphylaxis Reports | 1270 |
| Oxaliplatin | 119 (4.79%) | Methotrexate | 399 (22.29%) | Cefuroxime | 109 (8.58%) |
| Iopamidol | 97 (3.90%) | Omalizumab | 371 (20.73%) | Infliximab | 65 (5.12%) |
| Rocuronium | 85 (3.42%) | Adalimumab | 324 (18.10%) | Human IgG | 56 (4.41%) |
| Ioversol | 80 (3.22%) | Etanercept | 318 (17.77%) | Diclofenac | 49 (3.86%) |
| Carboplatin | 78 (3.14%) | Leflunomide | 275 (15.36%) | Adalimumab | 42 (3.31%) |
| Iohexol | 77 (3.10%) | Abatacept | 264 (14.75%) | Paclitaxel | 42 (3.31%) |
| Ranitidine | 76 (3.06%) | Rituximab | 243 (13.58%) | Methotrexate | 39 (3.07%) |
| Propofol | 73 (2.94%) | Hydroxychloroquine | 235 (13.13%) | Ibuprofen | 38 (2.99%) |
| Ceftriaxone | 73 (2.94%) | Infliximab | 230 (12.85%) | Glatiramer | 35 (2.76%) |
| Cefazolin | 70 (2.82%) | Tocilizumab | 165 (9.22%) | Omalizumab | 31 (2.44%) |
Monoclonal antibodies (mAbs) made up 5 of the top 10 drugs reported by the United States in association with anaphylaxis, and contributed to the top 10 drugs reported by Canada and Germany. Canada’s top 10 drugs reported to FDA were all mAbs or DMARDs. Neither the US, Canada, or Germany recorded any intraoperative agents in their top 10 drugs.
In contrast, neither France, the United Kingdom, or Japan recorded any mAbs in their top 10 drugs associated with anaphylaxis reports to the FDA, but France, the United Kingdom, and Japan reported 7, 4, and 3 intraoperative agents in their top 10 drugs, respectively. Japan was the only country to report radiocontrast agents or platinum-based anticancer drugs in their top 10 drugs.
To further understand the extent to which monoclonal antibodies were relevant for different countries, the mAbs in the top 50 anaphylaxis-associated drugs were separated based off country, and linear regressions were performed on each mAb for each country. (Table E2) Linear regressions on individual mAbs either demonstrated a positive slope or did not have a P value < .05. Furthermore, linear regressions on the combined mAbs counts for each country all demonstrated an increasing slope, indicating that these mAbs collectively made up an increasing percentage of each country’s anaphylactic reactions each year. In Canada, the percentage of mAbs increased at an average of 3.34 percent each year (95% CI: 2.91, 3.78) from 0% in 1999 to 64.81% in 2019, followed by the United States at 1 percent each year (95% CI: 0.41, 1.6) from 0% in 1999 to 14.48% in 2019. Similarly, 51.17% of Canada’s total anaphylaxis reports included mAbs, followed by the United States (24.27%) and Germany (15.91%). Monoclonal antibodies made up less than 10% of total anaphylactic reports in France, the United Kingdom, and Japan, reflecting the distribution of each country’s top 10 drugs (Table 3).
Anaphylaxis Followed by Death
During our study period from 1999-2019, the FDA received 2984/47,496 (6.28%) reports of anaphylaxis followed by death (anaphylaxis death). Overall, anaphylaxis death was rare, comprising only 2984/17,506,002 (0.01%) of all adverse events reported to the FDA. Total annual reports of anaphylaxis death to FAERS increased through our study period (linear regression β = 6.63 reports, 95% CI: 4.58, 8.69 from 118 reports in 1999 to 286 reports in 2019), but decreased as a proportion of total reports of anaphylaxis (linear regression β = −0.36 percent, 95% CI: −0.45, −0.27 from 14.77% in 1999 to 4.55% in 2019). (Table E3)
The median age of patients reported to have had anaphylaxis death was 60 [IQR: 26] and 50.19% were female. We identified all 56 drugs associated with 20 or more reports of anaphylaxis followed by death. (Table 4)
Table 4:
Drugs with ≥20 Associated Reports of Anaphylaxis Death from 1999-2019
| Drug Name | Anaphylaxis Death Reports (% of Drug-Specific Anaphylactic Reports) | Drug Name | Anaphylaxis Death Reports (% of Drug-Specific Anaphylactic Reports) | |
|---|---|---|---|---|
| Ceftriaxone | 226 (28.57%) | Fluorescein | 32 (28.57%) | |
| Propofol | 114 (7.07%) | Sufentanil | 32 (5.28%) | |
| Iopamidol | 112 (29.17%) | Acetaminophen | 31 (3.11%) | |
| Amoxicillin Clavulanic Acid | 105 (9.38%) | Docetaxel | 30 (13.76%) | |
| Rocuronium | 95 (8.06%) | Gadopentetate | 28 (13.15%) | |
| Paclitaxel | 92 (12.33%) | Dexamethasone | 28 (6.09%) | |
| Diclofenac | 89 (9.13%) | Infliximab | 27 (1.73%) | |
| Iopromide | 81 (16.63%) | Sevoflurane | 25 (13.97%) | |
| Lidocaine | 67 (9.59%) | Heparin | 25 (12.76%) | |
| Carboplatin | 61 (9.43%) | Bevacizumab | 25 (11.96%) | |
| Epinephrine | 59 (15.32%) | Lapine T-Lymphocyte Immune Globulin | 24 (24.49%) | |
| Iohexol | 54 (16.56%) | Cyclophosphamide | 24 (11.65%) | |
| Oxaliplatin | 54 (9.15%) | Levofloxacin | 24 (4.72%) | |
| Cefuroxime | 54 (7.00%) | Vancomycin | 23 (5.56%) | |
| Rituximab | 54 (6.45%) | Metronidazole | 23 (4.99%) | |
| Fentanyl | 52 (7.28%) | Alteplase | 22 (16.92%) | |
| Cetuximab | 51 (9.03%) | Clarithromycin | 22 (9.91%) | |
| Ranitidine | 46 (7.41%) | Cyclosporine | 21 (11.93%) | |
| Atracurium | 44 (10.84%) | Iron | 21 (8.90%) | |
| Succinylcholine | 42 (8.84%) | Human IgG | 21 (3.39%) | |
| Methylprednisolone | 42 (7.94%) | Methotrexate | 21 (2.57%) | |
| Moxifloxacin | 41 (2.94%) | Cytarabine | 20 (17.70%) | |
| Cefoperazone | 39 (27.66%) | Doxorubicin | 20 (11.98%) | |
| Ioversol | 36 (12.86%) | Trastuzumab | 20 (9.95%) | |
| Piperacillin | 35 (12.54%) | Gadobenate | 20 (7.41%) | |
| Midazolam | 35 (7.61%) | Ondansetron | 20 (6.01%) | |
| Cefazolin | 34 (6.10%) | Ciprofloxacin | 20 (5.29%) | |
| Aprotinin | 33 (27.73%) | Lisinopril | 20 (3.78%) |
Six drugs had over 20% of their reported anaphylactic reactions end in death: iopamidol (29.17%), ceftriaxone (28.57%), fluorescein (28.57%), aprotinin (27.73%), cefoperazone (27.66%), and lapine T-lymphocyte immune globulin (24.49%). Of these, fluorescein, aprotinin, cefoperazone, and lapine T-lymphocyte immune globulin, alongside 16 other drugs associated with 20 or more cases of anaphylaxis death, were not part of the top 50 drugs associated with anaphylaxis in general. Of the top 20 drugs reported in association with general anaphylaxis, rank 1 omalizumab (8 total deaths reported out of 2079 anaphylactic reports), rank 7 ibuprofen (7/1015 reports), and rank 8 amoxicillin (19/1005 reports) did not have 20 or more reports of anaphylaxis death.
By archetypal category (Table 5), antibiotics were associated with the most cases of anaphylaxis death, followed by radiocontrast agents, intraoperative agents, chemotherapy agents, monoclonal antibodies, anti-anaphylaxis agents, NSAIDs and acetaminophen, DMARDs and other drugs.
Table 5:
Drugs with ≥20 Associated Reports of Anaphylaxis Death from 1999-2019, Combined into Classes
| Drug Class | Anaphylaxis Death Cases (% of Total Anaphylaxis Reports) | Maximum Anaphylaxis Death Reports in a Year (Year) | Median Year [IQR]& | Average % Change per Year (95% CI), P value* |
|---|---|---|---|---|
| Overall Database from 1999-2019 | 2984 | 286 (2019) | 2012 [10] | |
| Drugs with ≥20 Reports of Anaphylaxis Death, Combined | 2006 (67.23%) | 193 (2019) | 2012 [10] | |
| Antibiotics | 622 (20.84%) | 75 (2008) | 2010.5 [8] | 0.08 (−0.58, 0.73), P = .81 |
| Radiocontrast Agents | 362 (12.13%) | 31 (2018) | 2012 [11] | −0.05 (−0.32, 0.21), P = .69 |
| Intraoperative Agentsa | 354 (11.86%) | 41 (2019) | 2013 [12] | 0.02 (−0.35, 0.40), P = .89 |
| Chemotherapy Agents | 271 (9.08%) | 45 (2019) | 2012 [9] | 0.19 (−0.04, 0.42), P = .10 |
| Monoclonal Antibodies | 170 (5.70%) | 23 (2019) | 2013 [7] | 0.40 (0.20, 0.60), P < .001 |
| Anti-Anaphylaxis Agents | 167 (5.60%) | 43 (2019) | 2016 [6] | 0.49 (0.23, 0.76) P < .001 |
| NSAIDs and Acetaminophen | 120 (4.02%) | 20 (2019) | 2012 [13] | −0.04 (−0.19, 0.12), P = .64 |
| DMARDs | 40 (1.34%) | 11 (2019) | 2016 [11] | 0.08 (−0.01, 0.18), P = .07 |
| Other | 185 (6.20%) | 17 (2019) | 2010 [10] | 0.03 (−0.18, 0.23), P = .79 |
Propofol, Rocuronium, Lidocaine, Fentanyl, Atracurium, Succinylcholine, Midazolam, Cefazolin, Sufentanil, Sevoflurane, Vancomycin
Years that end in .5 denote the presence of two medians.
Average change in % per year calculated as the slope of linear regression. Linear regressions with P < .05 were considered significant.
The Top Drug Classes Associated with 20 or More Cases of Anaphylaxis Death
Ceftriaxone, Amoxicillin-Clavulanic Acid, Cefuroxime, Moxifloxacin, Cefoperazone, Piperacillin, Cefazolin, Levofloxacin, Vancomycin, Metronidazole, Clarithromycin, Ciprofloxacin. Antibiotics with more than 20 associated reports of anaphylaxis death were associated with 20.84% of all anaphylaxis death cases within our study period, peaking in 2008 at 44.38% of the anaphylaxis death cases. (Table E4) Radiocontrast agents were the second most reported class of drugs at 12.13% of all anaphylaxis death reports during our study period, followed by intraoperative agents (11.86%), chemotherapy agents (9.08%), and monoclonal antibodies (5.70%).
The radiocontrast agents, excepting gadobenate, each had over 12% of their anaphylactic reactions followed by death. Despite iopromide, iopamidol, and iohexol ranking 35th, 45th, and 50th in the top 50 drugs, these radiocontrast agents ranked 8th, 3rd, and 12th, respectively, in the 56 drugs associated with 20 or more cases of anaphylaxis death. However, only three out of 12 antibiotics, 2/11 intraoperative agents, 5/8 chemotherapy agents, and 1/5 mAbs had over 10% of their anaphylactic reactions followed by death.
A linear regression on mAbs (Table E4, Figure 2) shows that the percent of anaphylaxis death reactions each year that were associated with mAbs increased at an average rate of 0.4 percent per year (95% CI: 0.2, 0.6) from 0% in 1999 to 8.04% in 2019. Anti-anaphylaxis agents also showed an upward trend in use associated with anaphylaxis death cases (0.49 percent per year, 95% CI: 0.23, 0.76 from 1.69% in 1999 to 15.03% in 2019). The other drug classes did not demonstrate a significant linear trend in anaphylaxis deaths.
Discussion:
In our review of publicly available FAERS data, we uncovered important themes and trends in reports of drug associated anaphylaxis. In particular, antibiotics were highly reported for both anaphylaxis overall and anaphylaxis followed by death. We also identified an emerging trend of increasing reports of anaphylaxis to monoclonal antibody therapies over time.
To put our findings in context, reports of anaphylaxis to FAERS increased year over year from 1999 to 2019.21–25 62.71% of all reports of anaphylaxis to the FDA in our study period were female, reflecting a previously reported female bias towards anaphylaxis,21–23, 26–28 including drugs associated with non-IgE mediated mast cell activation and urticaria which is noted to be both dose and weight based and potentially more common in women.29 The notable exception was cetuximab, a drug used to treat head and neck tumors that are more prevalent in men.30 Population and electronic health record studies corroborate our results that drug-induced anaphylaxis is attributed to antibiotics first, 21, 22, 26, 28, 31 followed by NSAIDs, chemotherapy agents, and intraoperative agents in varying orders.
While rare, total reports of anaphylaxis death to FAERS increased through our study period.25, 32 With 6.28% of total anaphylaxis reports to FAERS followed by death, we suspect there is a reporting bias favoring more severe cases, especially for drug classes that are given to patients with multiple comorbidities. However, reports of anaphylaxis death decreased as a percentage of general anaphylaxis reports during the same period. (Table E3)24, 33 As previously stated by Taylor et al.33 this suggests that there is changing recognition and management for anaphylaxis. Anaphylaxis to antimicrobials was the most reported drug category in association with anaphylaxis death, followed by contrast agents, intraoperative agents, and chemotherapy agents in varying orders.21, 23, 25, 32, 34 50.19% of FAERS anaphylaxis death reports were female, suggesting no gender bias for drug-associated anaphylaxis death cases.23, 25 Furthermore, intravenous drugs used in the treatment of infections, cancer, rheumatologic and immunologic disease were disproportionately represented compared to agents that were reported in association with anaphylaxis in general. The potential severity of these reactions may be a factor of both the intravenous mode of administration and the underlying treatment population. While a large contributor to FAERS anaphylaxis cases, NSAIDS were less commonly followed by death, suggesting a less severe phenotype for anaphylaxis.25 While IV radiocontrast made up the second largest class of drugs associated with anaphylaxis death cases, such drugs appeared to contribute a slowly decreasing share of anaphylaxis followed by death. An important limitation is that we suspect that anaphylaxis followed by death would be more likely to be reported to the FDA.
Anaphylaxis to antimicrobials was the most frequently reported drug category in association with both general anaphylaxis and anaphylaxis death. Amoxicillin-containing drugs were the most frequently reported cause of anaphylaxis to the FDA, but domestic US reports made up less than 4.90% and 8.51% of the reports to amoxicillin-davulanic acid and amoxicillin, corroborating observations that aminopenicillin allergy may be less common in the United States.35–39 Ceftriaxone was the top drug reported in association with anaphylaxis death to the FDA. Though all fluoroquinolones have been associated with non-IgE mediated anaphylaxis, moxifloxacin has been the most associated with IgE mediated anaphylaxis. The proportion (61%) of moxifloxacin in the top 50 anaphylactic-associated fluoroquinolones is comparable to the 54% reported in mandated post-marketing studies.20 There was a notable spike in reports of anaphylaxis associated with antibiotics in 2008 that was not easily explained.
Our most unexpected finding was the high volume and year over year increases in the frequency and percentage of anaphylaxis reported in association with mAbs, even when examined across multiple countries. This likely corresponds with the rising relevance and use of this drug class in therapeutic treatment. We note that the most important antibodies contributing to this phenomenon were all humanized monoclonals. Omalizumab was the top drug reported in association with anaphylaxis in general to the FDA after amoxicillin containing drugs.40 While omalizumab has long been reported in association with true anaphylactic reactions,41 many reports to FAERS may be confounded by its indicated and off-label treatments as a treatment for immediate hypersensitivity and IgE-mediated inflammation, including idiopathic anaphylaxis.42 Furthermore, several of the top mAbs (ritixumab, infliximab, cetuximab) in our study are reported to contain alpha-gal allergen.43 These 3 mAbs were also associated with a higher proportion of anaphylaxis death cases whereas the other top 50 mAbs (omalizumab, natalizumab, tocilizumab, and adalimumab) did not meet our threshold of 20 cases followed by death. Bevacizumab and trastuzumab were associated with more than 20 anaphylaxis death cases and are also humanized mAbs. Omalizumab, natalizumab, tocilizumab, bevacizumab, trastuzumab have not been evaluated to determine whether they might contain alpha-gal allergen. Infliximab, rituximab, and natalizumab also contain polysorbate 80 as an inactive ingredient, which is implicated as a relevant allergen causing both anaphylaxis and possibly non-IgE mediated mast cell activation for some patients.9, 10 An important limitation of our findings is that FAERS is a voluntarily reported adverse event database, and monoclonal antibodies are typically given under stricter supervision due to their cost or routes of administration. Tighter supervision could translate into a higher rate of reporting adverse events if anaphylaxis episodes were directly witnessed by clinical staff.
Domestic reports in the United States associated with monoclonal antibodies are comparatively larger than foreign reports, while domestic reports associated with intraoperative and chemotherapy agents were lower despite prevalent use of those drugs in US intraoperative settings.44 These differences between countries may be attributed to variations in drug usage patterns, reporting rates, and true biological and genetic effects. However, it is also clear from our study that very little data on anaphylaxis is reported to FAERS from many portions of the world, including South America, Africa, the Middle East, and much of Asia.
A major limitation of the self-reported data in FAERS is the lack of denominator data and high risk of selection and reporting bias, so this data should not be used to estimate the true incidence of general anaphylaxis or anaphylaxis death to the drugs. Drugs that are closely monitored during their provision (intraoperative setting, infusion centers) could appear to have a lower rate of anaphylaxis followed by death due to earlier recognition. Literature reports could also skew FDA reports. Specifically, relying on patient, physician, pharmaceutical company, or literature initiated reports to the FDA is not an exact estimate of the true volume of anaphylaxis to a drug, because the data is inherently limited by under-reporting of cases, indeterminate causality, and the potential existence of duplicate reports. FAERS is also unable to provide aggregate data on more than 5 drugs at a time, limiting our focus to the top 50 drugs. Furthermore, FAERS also lacks ethnicity data, which is an important piece of the narrative in considering all adverse drug reactions and the ecological and genetic contributors.
Ultimately, we believe that our analysis of FAERS data affirms prior anaphylaxis population studies, and that FAERS data can therefore be used to identify themes and trends in anaphylaxis and guide our field in determining which types of testing strategies are most relevant to current care delivery, both now and in the future.
Conclusions:
In a review of publicly available FAERS data, we uncovered important themes and trends in reports of drug associated anaphylaxis. Antibiotics are highly reported for both anaphylaxis overall and anaphylaxis followed by death. We also identified an emerging trend in reports of anaphylaxis to monoclonal antibody therapies. Validated testing strategies for drugs beyond antibiotics are needed, as the volume of such reports to the FDA is likely reflective of an unmet need. While our report has many limitations due to the nature of FDA FAERS voluntary reporting, it draws attention to a number of important issues and should be used to guide anaphylaxis researchers in generating hypotheses related to drugs of potential importance.
Supplementary Material
Figure E1. The top 6 countries (United States, France, United Kingdom, Japan, Canada, and Germany) associated with reports of anaphylactic shock or anaphylactic reaction to the Food and Drug Administration Adverse Event Reporting System (FAERS) from 1999 to 2019, shown on the world map. The total number of cases and top 10 drugs are listed for each country.
Highlights:
What is already known about this topic?
Drug induced anaphylaxis is a well-known and feared side effect for some drug classes, but emerging drug causes of anaphylaxis and novel mechanisms may contribute in ways that we have not recognized.
What does this article add to our knowledge?
The top drug classes that were associated with anaphylaxis reported to the FDA were antibiotics and monoclonal antibodies. The top drug classes associated with anaphylaxis followed by death were antibiotics, radiocontrast agents and intraoperative agents.
How does this study impact current management guidelines?
Validated testing strategies have previously focused on IgE-mediated antibiotic allergy. Monoclonal antibodies are an emerging cause of anaphylaxis reports. Validated testing strategies for drugs beyond antibiotics are needed.
Acknowledgments
Funding:
Dr. Phillips receives funding from National Institutes of Health (1P50GM115305, R34 AI136815, R21 AI139021, 1R01HG010863, National Health and Medical Research Foundation of Australia
Dr. Stone receives funding support from 1K12HS026395-01.
Abbreviations:
- FAERS
FDA Adverse Event Report System
Footnotes
Publisher's Disclaimer: This is a PDF file of an unedited manuscript that has been accepted for publication. As a service to our customers we are providing this early version of the manuscript. The manuscript will undergo copyediting, typesetting, and review of the resulting proof before it is published in its final form. Please note that during the production process errors may be discovered which could affect the content, and all legal disclaimers that apply to the journal pertain.
Disclosures: The authors declare that they have no conflicts of interest to disclose.
References:
- 1.Liang E, Chen L, Macy E. Adverse Reactions Associated with Penicillins, Carbapenems, Monobactams, and Clindamycin: A Retrospective Population-based Study. J Allergy Clin Immunol Pract 2020; 8:1302–13 e2. [DOI] [PubMed] [Google Scholar]
- 2.Kowalski M, Makowska J, Blanca M, Bavbek S, Bochenek G, Bousquet J, et al. Hypersensitivity to nonsteroidal anti-inflammatory drugs (NSAIDs) - classification, diagnosis and management: review of the EAACI/ENDA(#) and GA2LEN/HANNA*. Allergy 2011; 66:818–29. [DOI] [PubMed] [Google Scholar]
- 3.Kelso J MRGPRX2 signaling and skin test results. J Allergy Clin Immunol Pract 2020; 8:426. [DOI] [PubMed] [Google Scholar]
- 4.Weiler C Mastocytosis, Quinolones, MRGPRX2, and Anaphylaxis. J Allergy Clin Immunol Pract 2019; 7:2091–2. [DOI] [PubMed] [Google Scholar]
- 5.Subramanian H, Gupta K, Ali H. Roles of Mas-related G protein-coupled receptor X2 on mast cell-mediated host defense, pseudoallergic drug reactions, and chronic inflammatory diseases. J Allergy Clin Immunol 2016; 138:700–10. [DOI] [PMC free article] [PubMed] [Google Scholar]
- 6.Iarikov D, Wassel R, Farley J, Nambiar S. Adverse Events Associated with Fosfomycin Use: Review of the Literature and Analyses of the FDA Adverse Event Reporting System Database. Infect Dis Ther 2015; 4:433–58. [DOI] [PMC free article] [PubMed] [Google Scholar]
- 7.Gentry W, Dotson M, Williams B, Hartley M, Stafford K, Bottorff M, et al. Investigation of pegloticase-associated adverse events from a nationwide reporting system database. Am J Health Syst Pharm 2014; 71:722–7. [DOI] [PubMed] [Google Scholar]
- 8.Raisch D, Garg V, Arabyat R, Shen X, Edwards B, Miller F, et al. Anaphylaxis associated with gadolinium-based contrast agents: data from the Food and Drug Administration’s Adverse Event Reporting System and review of case reports in the literature. Expert Opin Drug Saf 2014; 13:15–23. [DOI] [PubMed] [Google Scholar]
- 9.Stone C Jr., Liu Y, Relling M, Krantz M, Pratt A, Abreo A, et al. Immediate Hypersensitivity to Polyethylene Glycols and Polysorbates: More Common Than We Have Recognized. J Allergy Clin Immunol Pract 2019; 7:1533–40 e8. [DOI] [PMC free article] [PubMed] [Google Scholar]
- 10.Krantz M, Liu Y, Phillips E, Stone C Jr Anaphylaxis to PEGylated liposomal echocardiogram contrast in a patient with IgE-mediated macrogol allergy. J Allergy Clin Immunol Pract 2020; 8:1416–9 e3. [DOI] [PMC free article] [PubMed] [Google Scholar]
- 11.Kadoyama K, Kuwahara A, Yamamori M, Brown J, Sakaeda T, Okuno Y. Hypersensitivity reactions to anticancer agents: data mining of the public version of the FDA adverse event reporting system, AERS. J Exp Clin Cancer Res 2011; 30:93. [DOI] [PMC free article] [PubMed] [Google Scholar]
- 12.Raisch D, Campbell W, Garg V, Qureshi Z, Bookstaver P, Norris L, et al. Description of anaphylactic reactions to paclitaxel and docetaxel reported to the FDA, with a focus on the role of premedication. Expert Opin Drug Saf 2011; 10:521–8. [DOI] [PubMed] [Google Scholar]
- 13.FDA Adverse Event Reporting System (FAERS) Public Dashboard. https://www.fda.gov/drugs/questions-and-answers-fdas-adverse-event-reporting-system-faers/fda-adverse-event-reporting-system-faers-public-dashboard: FDA; 2018.] [Google Scholar]
- 14.Eisenhauer E, ten Bokkel Huinink W, Swenerton K, Gianni L, Myles J, van der Burg M, et al. European-Canadian randomized trial of paclitaxel in relapsed ovarian cancer: high-dose versus low-dose and long versus short infusion. J Clin Oncol 1994; 12:2654–66. [DOI] [PubMed] [Google Scholar]
- 15.Brockow K Immediate and delayed cutaneous reactions to radiocontrast media. Chem Immunol Allergy 2012; 97:180–90. [DOI] [PubMed] [Google Scholar]
- 16.Solinski H, Gudermann T, Breit A. Pharmacology and signaling of MAS-related G protein-coupled receptors. Pharmacol Rev 2014; 66:570–97. [DOI] [PubMed] [Google Scholar]
- 17.Wong J, Ripple R, MacLean J, Marks D, Bloch K. Vancomycin hypersensitivity: synergism with narcotics and “desensitization” by a rapid continuous intravenous protocol. J Allergy Clin Immunol 1994; 94:189–94. [DOI] [PubMed] [Google Scholar]
- 18.McNeil B, Pundir P, Meeker S, Han L, Undem B, Kulka M, et al. Identification of a mast-cell-specific receptor crucial for pseudo-allergic drug reactions. Nature 2015; 519:237–41. [DOI] [PMC free article] [PubMed] [Google Scholar]
- 19.Ali H Emerging Roles for MAS-Related G Protein-Coupled Receptor-X2 in Host Defense Peptide, Opioid, and Neuropeptide-Mediated Inflammatory Reactions. Adv Immunol 2017; 136:123–62. [DOI] [PubMed] [Google Scholar]
- 20.Sachs B, Riegel S, Seebeck J, Beier R, Schichler D, Barger A, et al. Fluoroquinolone-associated anaphylaxis in spontaneous adverse drug reaction reports in Germany: differences in reporting rates between individual fluoroquinolones and occurrence after first-ever use. Drug Saf 2006; 29:1087–100. [DOI] [PubMed] [Google Scholar]
- 21.Liew W, Williamson E, Tang M. Anaphylaxis fatalities and admissions in Australia. J Allergy Clin Immunol 2009; 123:434–42. [DOI] [PubMed] [Google Scholar]
- 22.Dhopeshwarkar N, Sheikh A, Doan R, Topaz M, Bates D, Blumenthal K, et al. Drug-Induced Anaphylaxis Documented in Electronic Health Records. J Allergy Clin Immunol Pract 2019; 7:103–11. [DOI] [PMC free article] [PubMed] [Google Scholar]
- 23.Jerschow E, Lin R, Scaperotti M, McGinn A. Fatal anaphylaxis in the United States, 1999–2010: temporal patterns and demographic associations. J Allergy Clin Immunol 2014; 134:1318–28 e7. [DOI] [PMC free article] [PubMed] [Google Scholar]
- 24.Ma L, Danoff T, Borish L. Case fatality and population mortality associated with anaphylaxis in the United States. J Allergy Clin Immunol 2014; 133:1075–83. [DOI] [PMC free article] [PubMed] [Google Scholar]
- 25.Turner P, Campbell D. Epidemiology of severe anaphylaxis: can we use population-based data to understand anaphylaxis? Curr Opin Allergy Clin Immunol 2016; 16:441–50. [DOI] [PMC free article] [PubMed] [Google Scholar]
- 26.Wong A, Seger D, Lai K, Goss F, Blumenthal K, Zhou L. Drug Hypersensitivity Reactions Documented in Electronic Health Records within a Large Health System. J Allergy Clin Immunol Pract 2019; 7:1253–60 e3. [DOI] [PMC free article] [PubMed] [Google Scholar]
- 27.Cho H, Kim D, Choo Y, Park J, Choi J, Jang D, et al. Common causes of emergency department visits for anaphylaxis in Korean community hospitals: A cross-sectional study. Medicine (Baltimore) 2019; 98:e14114. [DOI] [PMC free article] [PubMed] [Google Scholar]
- 28.Zhao Y, Sun S, Li X, Ma X, Tang H, Sun L, et al. Drug-induced anaphylaxis in China: a 10 year retrospective analysis of the Beijing Pharmacovigilance Database. Int J Clin Pharm 2018; 40:1349–58. [DOI] [PMC free article] [PubMed] [Google Scholar]
- 29.Kasperska-Zajac A, Brzoza Z, Rogala B. Sex hormones and urticaria. J Dermatol Sci 2008; 52:79–86. [DOI] [PubMed] [Google Scholar]
- 30.Chung C, Mirakhur B, Chan E, Le Q, Berlin J, Morse M, et al. Cetuximab-induced anaphylaxis and IgE specific for galactose-alpha-1,3-galactose. N Engl J Med 2008; 358:1109–17. [DOI] [PMC free article] [PubMed] [Google Scholar]
- 31.Alonso M, Garcia M, Hernandez J, Moro M, Ezquerra P, Ingelmo A, et al. Recurrence of anaphylaxis in a Spanish series. J Investig Allergol Clin Immunol 2013; 23:383–91. [PubMed] [Google Scholar]
- 32.Xu Y, Kastner M, Harada L, Xu A, Salter J, Waserman S. Anaphylaxis-related deaths in Ontario: a retrospective review of cases from 1986 to 2011. Allergy Asthma Clin Immunol 2014; 10:38. [DOI] [PMC free article] [PubMed] [Google Scholar]
- 33.Turner P, Gowland M, Sharma V, Ierodiakonou D, Harper N, Garcez T, et al. Increase in anaphylaxis-related hospitalizations but no increase in fatalities: an analysis of United Kingdom national anaphylaxis data, 1992–2012. J Allergy Clin Immunol 2015; 135:956–63 e1. [DOI] [PMC free article] [PubMed] [Google Scholar]
- 34.Mullins R, Wainstein B, Barnes E, Liew W, Campbell D. Increases in anaphylaxis fatalities in Australia from 1997 to 2013. Clin Exp Allergy 2016; 46:1099–110. [DOI] [PubMed] [Google Scholar]
- 35.Bourke J, Pavlos R, James I, Phillips E. Improving the Effectiveness of Penicillin Allergy De-labeling. J Allergy Clin Immunol Pract 2015; 3:365–34 e1. [DOI] [PubMed] [Google Scholar]
- 36.Romano A, Gueant-Rodriguez RM, Viola M, Pettinato R, Gueant JL. Cross-reactivity and tolerability of cephalosporins in patients with immediate hypersensitivity to penicillins. Ann Intern Med 2004; 141:16–22. [DOI] [PubMed] [Google Scholar]
- 37.Romano A, Gaeta F, Valluzzi RL, Maggioletti M, Caruso C, Quaratino D. Cross-reactivity and tolerability of aztreonam and cephalosporins in subjects with a T cell-mediated hypersensitivity to penicillins. J Allergy Clin Immunol 2016; 138:179–86. [DOI] [PubMed] [Google Scholar]
- 38.Romano A, Gaeta F, Valluzzi R, Maggioletti M, Zaffiro A, Caruso C, et al. IgE-mediated hypersensitivity to cephalosporins: Cross-reactivity and tolerability of alternative cephalosporins. J Allergy Clin Immunol 2015; 136:685–91 e3. [DOI] [PubMed] [Google Scholar]
- 39.Macy E, Blumenthal KG. Are Cephalosporins Safe for Use in Penicillin Allergy without Prior Allergy Evaluation? J Allergy Clin Immunol Pract 2018; 6:82–9. [DOI] [PubMed] [Google Scholar]
- 40.Sala-Cunill A, Luengo O, Cardona V. Biologics and anaphylaxis. Curr Opin Allergy Clin Immunol 2019; 19:439–46. [DOI] [PubMed] [Google Scholar]
- 41.Lieberman P, Jones I, Rajwanshi R, Rosen K, Umetsu D. Anaphylaxis associated with omalizumab administration: Risk factors and patient characteristics. J Allergy Clin Immunol 2017; 140:1734–6 e4. [DOI] [PubMed] [Google Scholar]
- 42.El-Qutob D Off-Label Uses of Omalizumab. Clin Rev Allergy Immunol 2016; 50:84–96. [DOI] [PubMed] [Google Scholar]
- 43.Chitnavis M, Stein D, Commins S, Schuyler A, Behm B. First-dose anaphylaxis to infliximab: a case of mammalian meat allergy. J Allergy Clin Immunol Pract 2017; 5:1425–6. [DOI] [PubMed] [Google Scholar]
- 44.Pumphrey R Lessons for management of anaphylaxis from a study of fatal reactions. Clin Exp Allergy 2000; 30:1144–50. [DOI] [PubMed] [Google Scholar]
Associated Data
This section collects any data citations, data availability statements, or supplementary materials included in this article.
Supplementary Materials
Figure E1. The top 6 countries (United States, France, United Kingdom, Japan, Canada, and Germany) associated with reports of anaphylactic shock or anaphylactic reaction to the Food and Drug Administration Adverse Event Reporting System (FAERS) from 1999 to 2019, shown on the world map. The total number of cases and top 10 drugs are listed for each country.