

Abstract
G protein coupled receptors signal through G proteins or arrestins. A long-standing mystery in the field is why vertebrates have two non-visual arrestins, arrestin-2 and arrestin-3. These isoforms are ~75% identical and 85% similar; each binds numerous receptors, and appear to have many redundant functions, as demonstrated by studies of knockout mice. We previously showed that arrestin-3 can be activated by inositol-hexakisphosphate (IP6). IP6 interacts with the receptor-binding surface of arrestin-3, induces arrestin-3 oligomerization, and this oligomer stabilizes the active conformation of arrestin-3. Here, we compared the impact of IP6 on oligomerization and conformational equilibrium of the highly homologous arrestin-2 and arrestin-3 and found that these two isoforms are regulated differently. In the presence of IP6, arrestin-2 forms “infinite” chains, where each promoter remains in the basal conformation. In contrast, full length and truncated arrestin-3 form trimers and higher-order oligomers in the presence of IP6; we showed previously that trimeric state induces arrestin-3 activation1. Thus, in response to IP6, the two non-visual arrestins oligomerize in different ways in distinct conformations. We identified an insertion of eight residues that is conserved across arrestin-2 homologs, but absent in arrestin-3 that likely accounts for the differences in the IP6 effect. Because IP6 is ubiquitously present in cells, this suggests physiological consequences, including differences in arrestin-2/3 trafficking and JNK3 activation. The functional differences between two non-visual arrestins are in part determined by distinct modes of their oligomerization. The mode of oligomerization might regulate the function of other signaling proteins.
Keywords: oligomer, isoforms, IP6, signaling protein, structure
Graphical Abstract

Introduction
Arrestins are key modulators of G protein-coupled receptors (GPCRs) and have multiple signaling modes in the cell. Arrestins were discovered as proteins that directly compete with G proteins for activated GPCRs2; 3 and recruit the components of endocytic machinery, clathrin and AP2, to the receptors to promote internalization4; 5. Both actions lead to the attenuation of G protein-mediated signaling. Arrestins also initiate distinct branches of signaling by serving as scaffolding proteins. In their signaling capacity, they bring numerous effectors to the active receptors6; 7. In contrast to the diversity of GPCRs, there are only two non-visual arrestins in vertebrates, arrestin-2 and -3 (a.k.a. β-arrestin1 and 2)a. Both are ubiquitously expressed and responsible for the regulation of hundreds of different GPCRs6; 8. The other two arrestin family members, arrestin-1 and -4, are expressed in the photoreceptor cells where they desensitize rhodopsin and cone opsins9.
Phosphorylation of GPCRs by GPCR kinases (GRKs) is necessary for high-affinity arrestin binding10; 11. In most GPCRs, GRK phosphorylation sites are clustered in the receptor C-terminus or the third intracellular loop with several Ser or Thr residues in close proximity. Structural evidence revealed that positively charged lysines and arginines on the concave side of the arrestin N-domain directly bind receptor-attached phosphates (Figure 1; reviewed in10; 12). Poly-anions, including inositol-hexakisphosphate (IP6) and heparin, can bind to arrestins in a way that competes with phospho-receptor binding, suggesting overlapping binding sites. Indeed, it has been shown that IP6 and heparin directly bind arrestin-1 and each can specifically inhibit the interaction between arrestin-1 and phosphorhodopsin13; 14. Our structure of arrestin-3 in complex with IP6 is consistent with poly-anions competing with receptor for the same binding site. In this structure, IP6 engages all of the positively charged side chains that bind receptor-attached phosphates, plus several additional residues (Figure 1A)1. Thus, if there are 826 GPCRs that can activate arrestin-3 by competing for a single broadly-selective site, IP6 works as the 827th activator that competes for this same site. In contrast, a crystal structure of arrestin-2 with IP6 revealed a different IP6 binding position15. In arrestin-2, this binding position only partially overlaps with the phosphoreceptor binding site. Here, IP6 still engages a subset of the receptor-binding lysines and arginines and is expected to compete with receptor for binding, but the shifted position involves the recruitment of several other unique residues (Figure 1B–F)15. As a note, in addition to the receptor-binding positively charged residues in the N-domain, IP6 also engages lysines and arginines in the C-domain of both non-visual arrestins that were not reported to be involved in receptor binding.
Figure 1. Comparison of arrestin structures.

A. Active arrestin-3 structure determined in the presence of IP61. B. Basal arrestin-2 structure in the presence of IP615. C. Arrestin-2 with human V2 vasopressin receptor-derived phosphopeptide V2Rpp53. D. Arrestin-1 bound to rhodopsin with a C tail replaced with V2Rpp20. E. Arrestin-2 in complex with β1-adrenergic receptor with the C-terminal tail replaced with V2Rpp33. F. Arrestin-2 in complex with M2 muscarinic receptor with C-terminal tail replaced with V2Rpp32. Arrestin C-tail in B is colored deep teal, yellow sticks represent the residues involved in interaction with phosphates and blue dashed lines represent H-bonds.
One of the structural changes, the release of the C-tail, is associated with the engagement of these phosphate-binding residues and has been used to measure arrestin activation. In the basal state, phosphate-binding lysines and arginines are shielded by the C-tail of arrestin1; 16; 17; 18; 19; 20; 21. The phosphorylated receptor C-terminus displaces the C-tail of arrestin to gain access to these residues, thereby releasing the restraints keeping arrestin in the basal state. Therefore, the release of the C-tail is believed to be one of early events in arrestin activation and also an important activation hallmark. IP6 binding has been shown to lead to the C-tail release in both arrestin-1 and arrestin-314; 22. Less is known about how IP6 influences arrestin-2. In the crystal structure of IP6-bound arrestin-2, pre-formed crystals were soaked with IP615. Crystal packing interactions would prevent the conformational changes associated with activation of arrestin-2. There are no studies testing whether IP6 activates arrestin-2 in solution.
Like many signaling proteins, arrestins are known to oligomerize. Arrestin-1 forms dimers and tetramers, which serve as storage forms23; 24; 25; 26; 27. It has been shown that arrestin-2 and arrestin-3 form homo- and hetero-oligomers in living cells15; 28. However, purified arrestin-2 and -3 do not oligomerize in vitro, indicating that other factors in the cell contribute to their oligomerization25. Indeed, IP6 facilitates oligomerization of arrestin-215; 25 and full-length and truncated arrestin-3 (arrestin-3-(1–393))1; 25. Importantly, in the IP6-induced trimer arrestin-3-(1–393) adopts an active receptor-bound-like conformation1. Importantly, the trimer involves the surface of arrestin that also interacts with receptor, such that oligomerization is anticipated to prevent receptor interaction. This is consistent with past biochemical work that showed that only arrestin monomers bind to rhodopsin24; 29 and is also consistent with recent structures of receptor-arrestin complexes20; 30; 31; 32; 33; 34. In addition, oligomerization stabilizes an active conformation that appears to be critical for receptor-independent and arrestin-3-dependent JNK3 activation1. Arrestin-3 variants designed to affect oligomerization but do not alter the IP6-binding site are associated with significantly reduced receptor-independent JNK3 activation1.
Here we used multi-angle laser light scattering (MALLS), small angle X-ray scattering (SAXS) and double electron electron resonance (DEER) spectroscopy to probe the solution structure of arrestin-2 and arrestin-3 oligomers. Our results revealed strikingly different impact of IP6 on the two highly homologous non-visual arrestins. IP6 does not activate arrestin-2 and induces the formation of “infinite” chains. In contrast, IP6 activates arrestin-3 and promotes the formation of trimers and higher order oligomers. We identified a sequence insert of eight residues in a loop of arrestin-2 responsible for the differences in IP6-induced arrestin-2 and -3 oligomerization.
Results
IP6 does not activate arrestin-2
In the basal state of arrestin, the C-tail is anchored to the N-domain. A conformational hallmark of arrestin activation is the release of the C-tail13; 35; 36; 37. To assess whether IP6 mimics the receptor-attached phosphates and directly displaces the C-tail of arrestin-2, we employed DEER spectroscopy to monitor the distance between the C-tail and the N-domain. We introduced cysteines at position 12 in the N-domain and 392 in the C-tail of arrestin-2 on a cysteine-less background (Figure 2A); this Cys-less mutant, as well as spin labeled single cysteine mutants constructed on its basis, retains normal receptor binding36; 38. We then chemically modified these cysteines with nitroxide spin label (R1) and monitored the distance between the two spin labels using Q-band DEER spectroscopy. In the absence of IP6, the distance between these two labels is short, with a relatively narrow distribution centered under 20 Å (black line, Figure 2B). This is consistent with the crystal structure of the basal state where the C-tail is anchored to the N-domain17 (Figure 1B). In the presence of IP6, this short distance is retained, but a much longer and broader distance centered under 55 Å appears (blue line, Figure 2B). There are two plausible explanations for the data: one is that the C-tail is partially released from the N-domain of arrestin-2 monomer, which would result in a longer distance between the spin labels; the other is that IP6 promotes the oligomerization of arrestin-2 with the longer distances between two arrestin-2 protomers appearing. To discriminate between these possibilities, we replaced 80% of the labeled arrestin-2 with the unlabeled protein. The unlabeled arrestin-2 would still form oligomers with the labeled arrestin-2, but would not show distances between protomers, whereas the distances between the pair of spins in the N-domain and C-tail within individual arrestin-2 molecule would not be affected. The unlabeled arrestin-2 almost completely eliminated the longer distance without affecting the shorter one (orange line, Figure 2B). These data indicate that IP6 does not promote the release of the C-tail of arrestin-2 but mediates its oligomerization.
Figure 2. IP6 mediates the oligomerization of arrestin-2 but does not trigger the release of its C tail.

A. One site on the N-domain (position 12) and another site on the C-tail (position 392) were selected for spin labeling to report the distance between the N-domain and C-tail of arrestin-2. The locations of these two sites are shown in basal arrestin-2 (PDB entry 1G4M17). B. Plot of the probability of the distances between these two spin labels for 100 μM labeled arrestin-2 (black line), 100 μM labeled arrestin-2 with100 μM IP6 (blue line) or 20 μM labeled, 80 μM unlabeled arrestin-2 with100 μM IP6 (orange line). C. The MALLS data showing that arrestin-2 average molecular weight as the function of arrestin-2 concentration in the presence and absence of 100 μM of IP6.
Arrestin-2 forms large oligomers in the presence of IP6
Previous studies from us and others revealed that in the presence of IP6, the average molecular weight of arrestin-2 increases with the protein concentration15; 25. In our hands, no apparent saturation was reached within the concentration range tested (100 μM IP6 and 1.8 μM to 14.4 μM arrestin-2)25. To obtain more comprehensive data, we employed MALLS with an extended concentration range of arrestin-2, up to 84 μM. In the absence of IP6, arrestin-2 remains monomeric (Figure 2C). We then repeated the measurement in the presence of 100 μM IP6, which is in the range of reported intracellular concentrations of IP6, from 37 to 105 μM39. We found that in the presence of 100 μM IP6, the average molecular weight of arrestin-2 does not saturate with increased protein concentration (Figure 2C). At the highest arrestin-2 concentration tested (84 μM), the average molecular weight was ~202 kDa, which exceeds the expected molecular weight for an arrestin-2 tetramer (184 kDa). These data do not fit the monomer-dimer-tetramer model, which fits the data for arrestin-125 and was previously proposed as a possibility for arrestin-225. The most parsimonious explanation for a sustained increase in average molecular weight without detectable saturation is that arrestin-2 forms polymeric chains that do not have a natural limit. Therefore, we analyzed the data using a linear polymerization model40 and found a fit, with a polymerization constant of 5.50 ± 0.25 μM. It should be noted that in cells the size of these chains would be limited by the local concentration of endogenous arrestin-2, which has only been measured in neurons41; 42.
The solution structure of arrestin-2 oligomer in the presence of IP6
If the packing interactions observed in the arrestin-2 crystals reflect a physiological association (Figure 3A)15 it could be consistent with the proposed polymer model. To assess whether this was a reasonable model, we performed buried surface area analysis on the reported IP6-arrestin-2 structure (PDB entry 1ZSH15) using the program PISA43. Calculation showed that the crystallographic oligomer buries ~600 Å2 of surface at each interface for a total ~1,200 Å2 of surface per protomer (Figure 3A), which suggests that this could be a physiological interaction. To probe the solution structure of arrestin-2 oligomers in the presence of IP6, we generated single cysteine mutants at thirteen different locations on a cysteine-less background that retains normal receptor binding36; 38, modified them with nitroxide spin label and monitored the distances between two adjacent arrestin-2 protomers (Figure 3A,B). In the absence of IP6, we did not detect dipolar interactions even at arrestin-2 concentration as high as 300 μM (Figure 3C), supporting the MALLS data that arrestin-2 does not oligomerize by itself (Figure 2C). The addition of IP6 promoted the oligomerization of arrestin-2, bringing the distances between two spin labels within the detectable range. The distance between two non-adjacent protomers in the proposed chain model is ~79 Å (Figure 3A), which is beyond the detectable limit for DEER as implemented in our experiments. Therefore, the resulting distances solely reflect the distances between two adjacent protomers in the presence of IP6.
Figure 3. The solution structure of arrestin-2 oligomer in the presence of IP6.

A. IP6 bridges adjacent arrestin-2 monomers to form a chain-like oligomer in the structure of arrestin-2 crystal soaked with IP6 (PDB entry 1ZSH15). The buried interface between two adjacent protomers is ~600 Å2. B. Sites selected for spin labeling are shown as spheres on the crystal structure of basal arrestin-2 (PDB entry 1G4M17). The sites with inter-subunit distances shorter than 50 Å (L68, V70, L71, L73, V167, Y238, T246), as measured by DEER spectroscopy in the presence of IP6, are colored blue, and the ones with inter-subunit distance longer than 50Å (L33, K49, V81, I158, S234, C269) are colored pink. C. For each mutant, background-corrected X-band DEER spectroscopy dipolar evolution data for arrestin-2 in the presence of excess IP6 are shown. The gray dots represent the data and the black lines indicate the fits to the data that yield distance distributions for each site tested. Distances longer than 50 Å cannot be precisely determined from the dipolar evolution data (see Table 1). The upper dataset (green) for L71R1 was collected in the absence of IP6; no distances were observed.
The sites selected for DEER measurements were from both the N-domain (L33, K49, L68, V70, L71, L73, V81, I158, V167) and the C-domain (S234, Y238, T246, C269) of arrestin-2 to give a comprehensive view of arrestin-2 oligomers (Figure 3B). Comparison of experimentally measured distances with those predicted based on the crystal structure (PDB entry 1ZSH15) revealed a remarkable match (Figure 3C, Table 1). Seven sites were expected to be within the measurable range of DEER and each one showed a distance nearly identical to those predicted based on the crystallographic polymer; four matched to within 1.5 Å of the expected distances and three matched to within 5 Å. The remaining sites showed observable distances that were greater than the reliably quantifiable upper limit. This is consistent with the longer-range distances expected for these sites in the crystal structure. Moreover, the sites with distances shorter than 50 Å are clustered in the middle of the concave side of arrestin-2, while the sites in the distal C- or N-domains or on the convex side of the molecule yield distances longer than 50 Å (Figure 3B, C). This suggests that IP6 bridges N- and C-domains of two adjacent arrestin-2 molecules, so that only the central parts of the concave side of neighboring protomers come close enough to yield measurable distances. Collectively, the results strongly suggest that the structure of the solution oligomer closely resembles the arrangement of protomers in the arrestin-2 crystals soaked with IP6, further supporting the model that arrestin-2 forms “infinite” chains in the presence of IP6 in solution, where each protomer remains in the basal conformation.
Table 1.
Inter-subunit distances from the arrestin-2 crystal structure determined in complex with IP6 (PDB: 1ZSH15) and DEER distances measured in the presence of IP6.
| Arrestin-2 | 33R1 | 49R1 | 68R1 | 70R1 | 71R1 | 73R1 | 81R1 | 158R1 | 167R1 | 234R1 | 238R1 | 246R1 | 269R1 |
|---|---|---|---|---|---|---|---|---|---|---|---|---|---|
| R1-R1 distance 1ZSH (Å) | 78.2 | 75.8 | 44.3 | 39.5 | 45.7 | 43.6 | 61.5 | 53.3 | 43.1 | 50.0 | 40.4 | 44.1 | 76.8 |
| DEER distance (Å) | >55 | >58 | 41.4 | 39.9 | 41.0 | 43.3 (32,>51) |
>52 | >51 | 43.3 | >53 | 41.9 | 40.5 49 |
>59 |
The solution structure of the arrestin-3 oligomer in the presence of IP6
We reported that truncated arrestin-3-(1–393) in the presence of IP6 forms trimers both in a crystal and in solution, as detected by size exclusion chromatography (SEC) and analytical ultracentrifugation (AUC)1. This did not match our previous MALLS results suggesting that arrestin-3 forms dimers in the presence IP625; 44. After careful comparison of the experimental conditions, we found that benzamidine used in the buffer for MALLS interferes with trimer formation1. In addition, arrestin-3 previously used for MALLS was full length (1–408), whereas the arrestin-3 used for crystallography, SEC and AUC analysis was truncated at 393 because the highly flexible C tail hindered crystallization. Therefore, we performed in-line SEC-MALLS-SAXS experiments with full-length arrestin-3 without benzamidine.
The SEC and MALLS data indicated that arrestin-3 exists as a monomer with average molecular weight ~50 kDa at protein concentrations ranging from 6 to 45 μM (Figure 4A–C), which is consistent with previous results1. In the presence of 100 μM IP6, we observed a substantial shift in retention time in SEC indicative of higher order oligomers (Figure 4A, B). In addition, the broadening of the arrestin-3 peak in the presence of IP6 suggested that there are likely multiple species of arrestin-3 oligomers (Figure 4A, B). Indeed, MALLS analysis showed that at low concentration (5.75 μM), the average molecular weight of arrestin-3 oligomer is ~170 kDa, corresponding to trimer. At higher concentrations of arrestin-3, we observed additional oligomeric species with higher molecular weight, predominantly between 230–270 kDa. These results suggest that IP6 promotes the formation of heterogeneous oligomeric species of full-length arrestin-3 in solution. In contrast, arrestin-3-(1–393) forms trimers within a wide range of concentrations1. Thus, the distal C-terminus plays an important role in regulating the oligomeric state of arrestin-3 in the presence of IP6. Importantly, in contrast to arrestin-2, where the average molecular weight increases with concentration without reaching a plateau, arrestin-3 in the presence of IP6 starts with a trimer and appears to stop as a pentamer or hexamer.
Figure 4. The solution structure of arrestin-3 oligomers in the presence of IP6.

A, B. SEC-MALLS data of purified full-length arrestin-3 in the absence and presence of 100 μM IP6 at the protein concentration of 5.75 μM or 45 μM. Light scattering signals are shown as peaks and the molecular weight as horizontal lines. C. The MALLS data showing that average molecular weight of full-length arrestin-3 as the function of its concentration in the presence and absence of 100 μM of IP6. D. The Kratky plot of full-length arrestin-3 at 45 μM in the absence of IP6. E. The Kratky plot of full-length arrestin-3 at 45 μM in the presence of 100 μM IP6. F. The Kratky plot of arrestin-3-(1–393) at 45 μM in the presence of 100 μM IP6. G. The pair distance distribution analysis of full-length arrestin-3 at 45 μM in the absence of IP6. H. The pair distance distribution analysis of full-length arrestin-3 at 45 μM in the presence of 100 μM IP6. I. The pair distance distribution analysis of arrestin-3-(1–393) at 45 μM in the presence of 100 μM IP6. J. The bead model reconstruction of full-length arrestin-3 at 45 μM in the absence of IP6. The crystal structure of monomeric arrestin-3-(1–393) (PDB entry 3P2D19) is docked into the bead model. K. The bead model reconstruction of full-length arrestin-3 at 45 μM in the presence of 100 μM IP6. L. The bead model reconstruction of arrestin-3-(1–393) at 45 μM in the presence of 100 μM IP6. The crystal structure of trimeric arrestin-3-(1–393) in the presence of IP6 (PDB entry 5TV11) is docked into the bead model.
To further determine the shape of arrestin-3 oligomers, we collected SAXS data of full length arrestin-3 at concentration of 45 μM in the presence or absence of IP6, as lower protein concentrations have poor signal to noise ratio. In the absence of IP6, Rg of full length arrestin-3 is ~28.8 Å, slightly higher than that of monomeric arrestin-3-(1–393) in the crystal structure (~26 Å, PDB entry 3P2D19) likely due to the presence of flexible C-tail, which was not resolved in the crystal (Figure 4D, Supplementary Figure 1A, D). In the presence of 100 μM IP6 we observed two scattering peaks, which were deconvoluted and the predominant component was used for further size/shape analysis (Figure 4E, Supplementary Figure 2). As indicated by Kratky analysis the scattering species were partially flexible in solution with Rg of ~ 66 Å (Figure 4E, Supplementary Figure 1B, E), indicating that IP6 likely induces higher order oligomerization of arrestin-3. In addition, the pair distance distribution analysis showed that IP6 shifts the Dmax of arrestin-3 from ~105 Å to ~240 Å (Figure 4G, H), again suggesting that arrestin-3 forms higher order oligomers. We also collected SAXS data using arrestin-3-(1–393) at 45 μM in the presence of 100 μM of IP6. The sample was monodisperse and compact in solution with dimensions, Rg=39.4 Å and Dmax= 126 Å (Figure 4F, I, Supplementary Figure 1C, F). Next, we carried out bead model reconstructions for all samples. The resulting envelopes of full length arrestin-3 alone and arrestin-3-(1–393) in the presence of IP6 superimposed well with the respective crystal structures upon alignment on the basis of inertial axis (Figure 4J, L). CRYSOL analysis indicated a good match for the theoretical SAXS profile of the crystal structures of arrestin-3 monomer (PDB entry 3P2D19) and arrestin-3 trimer with IP6 (PDB entry 5TV11) with the experimental SAXS data (χ2 of 0.97 and 4.7, respectively, Supplementary Figure 1G,H). The bead model of arrestin-3 in the presence of IP6 shows a larger volume than the arrestin-3-(1–393) trimer Figure 4K), which is consistent with the SEC and MALLS data suggesting higher order oligomers. However, modeling failed to return a reliable prediction for the larger oligomeric species.
We also probed the solution structure of arrestin-3 using DEER spectroscopy. Although the cysteine-less arrestin-3 retains its receptor binding specificity36, it does not undergo IP6-induced oligomerization in the same way as the wild-type arrestin-3, likely due to the substitution of Cys-17 at the oligomeric interface1. Instead, cysteine-less arrestin-3 forms dimers1. Therefore, the measured DEER distances reflect the distance between the selected sites in a dimeric cysteine-less arrestin-3. It is likely that IP6 still bridges the N- and C-domains, but only at one interface. This is consistent with the results that the sites with the major distance shorter than 50 Å are located on the central concave side of arrestin-3, while the sites yielding longer than 50 Å distances are located on the convex side of distal N- and C-domain (Figure 5A, B). With only one domain fixed, the protomers in these dimers are likely flexible, twisting around the fixation point. Indeed, at almost all measured sites, we detected multiple distances, which is indicative of the conformational heterogeneity of arrestin-3 dimers. In comparison, the majority of sites in the arrestin-2 oligomer yielded one major distance, while the sites located in the loops, which are more dynamic (L68, V70, L71, L73)17, showed boarder distance distribution (Figure 3).
Figure 5. The solution structure of arrestin-3 oligomers in the presence of IP6.

A. Sites selected for spin labeling are shown as spheres on crystal structure of basal arrestin-3 (PDB entry 3P2D19). The sites with inter-subunit distances shorter than 50 Å (D68, K313), as measured by DEER spectroscopy in the presence of IP6, are colored blue, and the ones with inter-subunit distance longer than 50 Å (K34, F88, Q122, T188, M193, T222, L278) are colored pink. B. For each mutant, background-corrected Q-band DEER spectroscopy dipolar evolution data for arrestin-3 in the presence of excess IP6 are shown. The gray dots represent the data and the black lines indicate the fits to the data that yield distance distributions for each site tested. The dataset (green) for T188R1 was collected in the absence of IP6 and it shows distances different from the ones in the presence of IP6. Distances longer than the upper limits determined by the data collection time are shown as dotted lines.
An eight amino acid loop insert likely accounts for the differences in oligomerization of arrestin-2 and -3
The strikingly different effect of IP6 on arrestin-2 and -3 oligomerization and activation are surprising considering the >85% sequence conservation and 100% identity of lysines and arginines involved in IP6 binding between these two arrestins (Supplementary Figure 3)6; 45; 46; 47. To understand the possible molecular basis for the observed difference, we modeled the arrestin-2 structure onto the arrestin-3 trimer and detected an apparent steric clash in the arrestin-2 trimeric model (Figure 6A). One loop in arrestin-2 contains eight extra residues, as compared to the homologous loop in arrestin-3, which likely hinders the trimer formation (Figure 6A). These eight residues are absent in all arrestin-3 proteins from different species (Supplementary Figure 3)6; 45, suggesting biological importance of this sequence difference, which could be related to the functional specialization of the two isoforms.
Figure. 6. An extended loop in arrestin-2 likely accounts for the differences in oligomerization of arrestin-2 and -3.
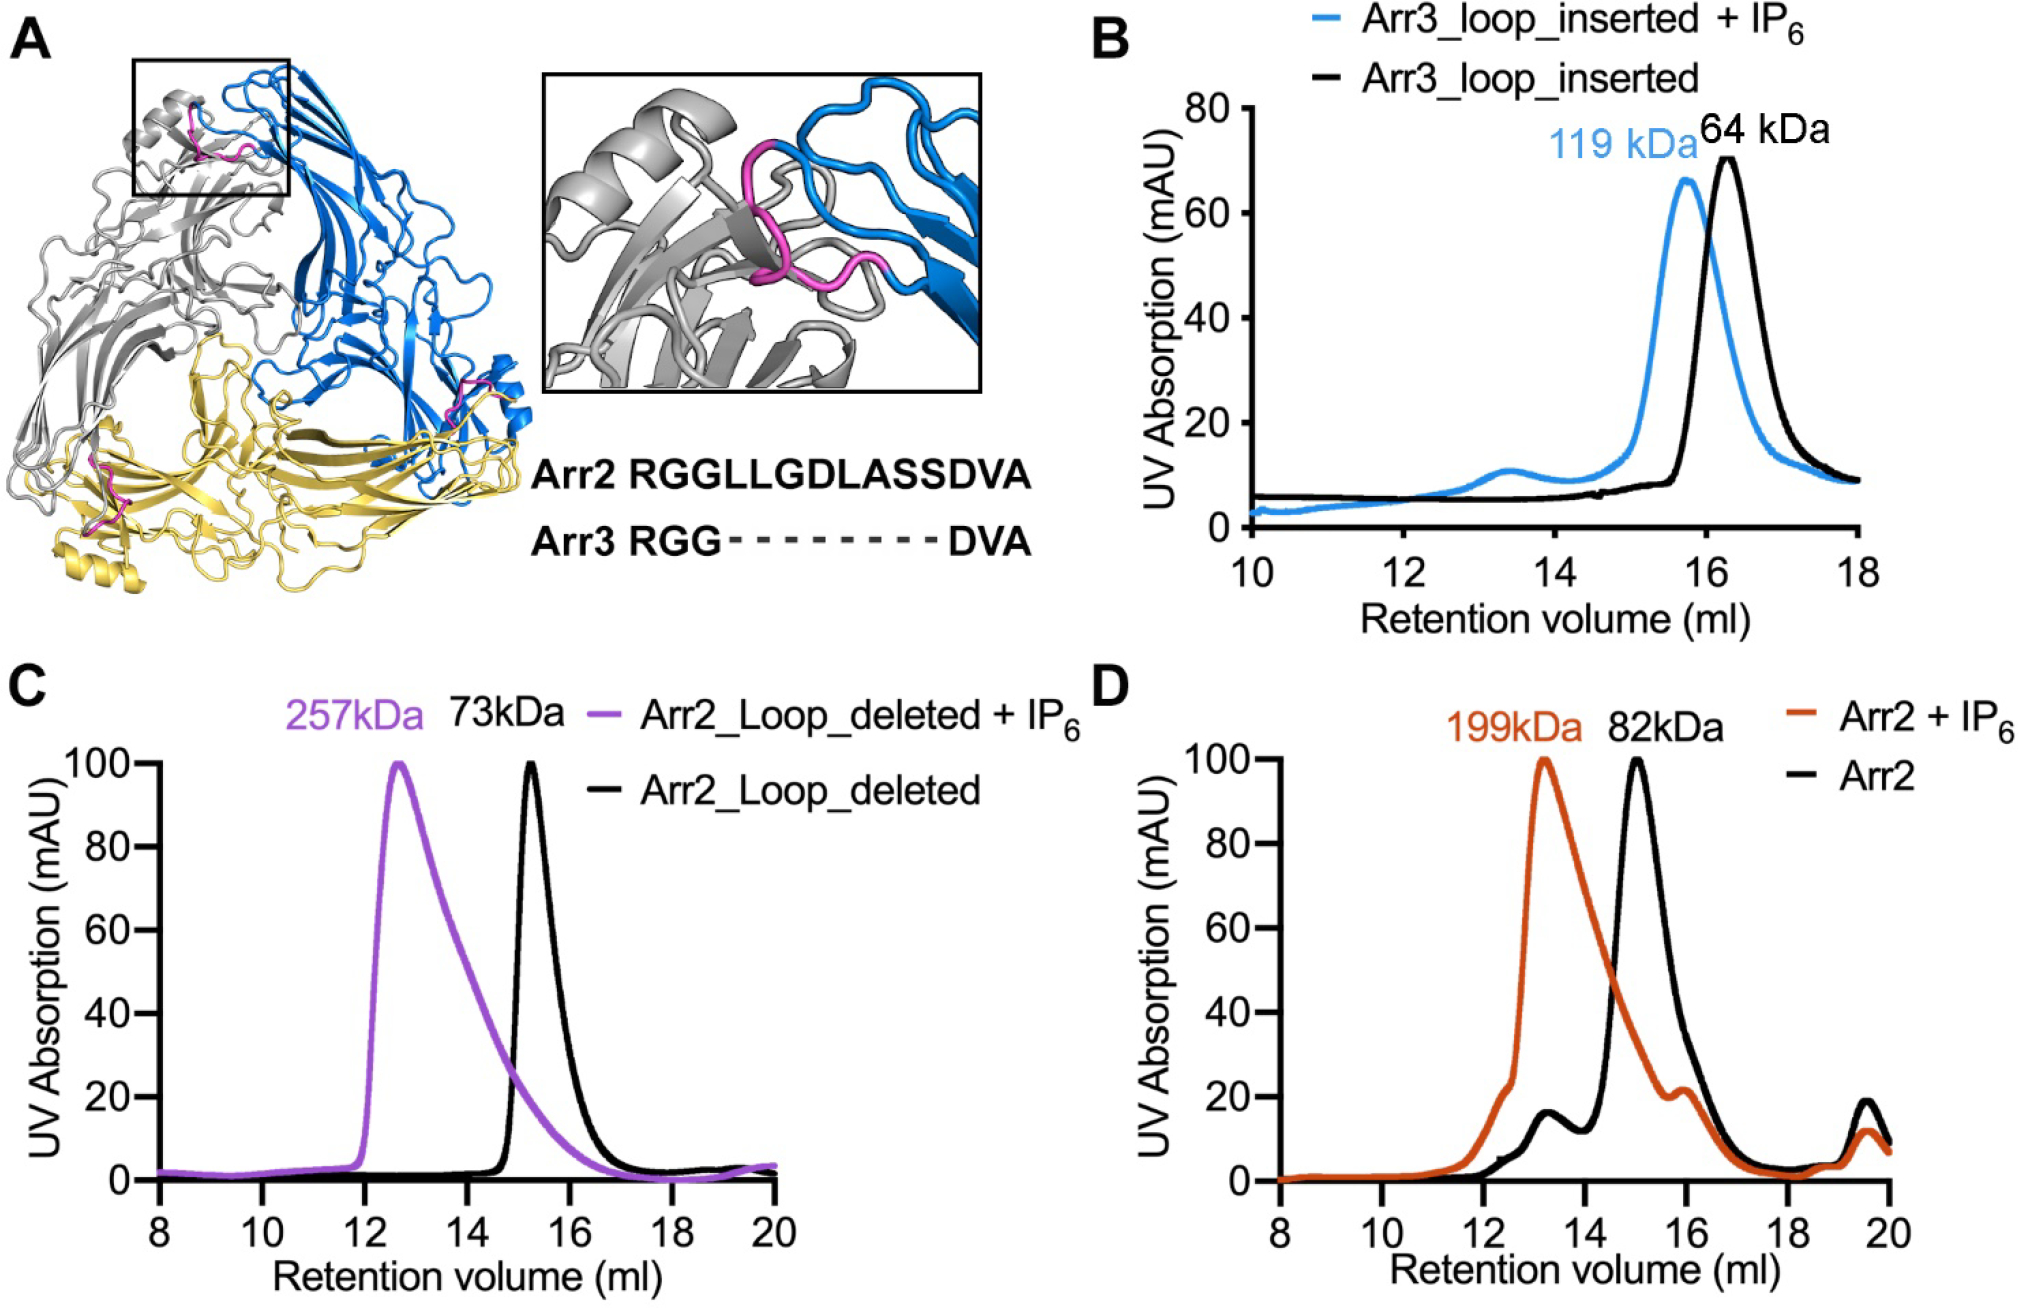
A. Modeling of arrestin-2 monomer structure (PDB entry 1G4M17) into the arrestin-3 trimeric structure (PDB entry 5TV11). The steric clash at the interface is enlarged in the black rectangular box with the extended loop colored magenta. The sequence alignment of this loop between arrestin-2 and -3 is shown. B-D. SEC is employed to assess the oligomerization of the arrestin-3 loop insertion mutant (B), the arrestin-2 loop deletion mutant (C) and the arrestin-2 wild-type (D). B. In the absence of IP6, the loop insertion mutant runs as a monomer with the average molecular weight 64 ± 6 kDa; In the presence of IP6, the loop insertion mutant runs as a dimer with the average molecular weight 119 ± 3 kDa. C. In the absence of IP6, the arrestin-2 loop deletion mutant runs as a monomer with the average molecular weight 73 ± 0.6 kDa; In the presence of IP6, the loop insertion mutant runs as a likely trimer with the average molecular weight 257 ± 17 kDa. D. In the absence of IP6, the arrestin-2 wild-type runs as a monomer with the average molecular weight 82 ± 0.5 kDa; In the presence of IP6, the loop insertion mutant runs with the average molecular weight 199 ± 8 kDa, which does not reflect the heterogenous arrestin-2 chain-like oligomers. This is likely due to that the standard curve for SEC molecular weight estimation was generated with globular proteins.
To test whether this eight-residue element affects IP6-dependent oligomerization, we inserted these eight residues of arrestin-2 into the corresponding region of arrestin-3 and assessed the ability of the mutant protein to form trimers in the presence of IP6 using SEC. We have previously reported that truncated arrestin-3-(1–393) with an otherwise wild type sequence showed a shift of retention volume on SEC, consistent with forming the expected trimer in the presence of IP61. In contrast, when the eight arrestin-2-derived residues were inserted, truncated arrestin-3-(1–393) formed a dimer instead of a trimer in the presence of IP6 (Figure 6B). We then performed the converse experiment, by deleting the eight-residue element from arrestin-2 and evaluating retention time on SEC. The opposite effect was observed and there with the shift in retention volume being consistent with a species somewhat larger than a trimer (Figure 6C,6D). This strongly suggests that the short loop insertion in arrestin-2 prevents IP6-dependent trimerization and regulates arrestin activation by IP6. This identifies this short sequence region as one determinant of isoform specialization.
Discussion
All vertebrates express two non-visual arrestins, arrestin-2 and arrestin-3, encoded by two separate genes (bony fish that underwent an extra whole genome duplication express three)6; 45. While the two are highly homologous46; 47, preservation of both subtypes for 400 million years of evolution from fish to mammals suggests that they are functionally different. Arrestin-3 was shown to have higher affinity for clathrin4; it facilitates the activation of JNK3, in contrast to arrestin-248; 49; 50; 51. Differences between monomers of arrestin-2 and -3 were suggested to underlie their functional specialization (reviewed in7; 8). We showed for the first time that the mode of the oligomerization in the presence of an abundant cytoplasmic metabolite IP6 of the two non-visual arrestins is dramatically different. Thus, distinct structure of the oligomers might also contribute to their functional specialization.
Arrestins contain several surface lysine- and arginine-rich regions. The N-domain region is shielded by the C-tail in the basal state. Structural evidence indicates that the lysines and arginines in this region directly interact with the receptor-attached phosphates (Figure 1), which promote high-affinity arrestin binding to the receptor and trigger arrestin activation20; 31; 32; 33; 34; 52; 53. These lysines and arginines are conserved in all arrestin isoforms (Supplementary Figure 3)1; 36; 53. However, IP6 engages residues in arrestin-2 that are not shielded by the C tail in the basal state (Supplementary Figure 3). Indeed, IP6 does not displace arrestin-2 C-tail (Figure 2) and does not promote arrestin-2 activation. Modeling of active arrestin-2 into the chain-like oligomer results in steric clashes between protomers. Thus, active arrestin-2 cannot form oligomers and its oligomerization in the presence of IP6 stabilizes the basal conformation. Our data support the structure of arrestin-2 crystals soaked with IP615 showing that arrestin-2 forms “infinite” chains with no natural limit. In the cell the prevailing length of these chains would be limited by local concentration of arrestin-2. While there are estimates of average arrestin-2 and -3 concentrations in cells41; 42, local concentrations of either in particular cellular compartments is not known.
Arrestin binding to receptors is most robust when both activation and phosphate sensors are engaged54; 55. The engagement of each sensor contributes to the shift in the arrestin conformational equilibrium towards the active state. In IP6-dependent trimer of arrestin-3 the activation sensors of all three protomers interact with each other1. But the activation sensor is not engaged in the chain-like oligomers of arrestin-215. Short region of sequence might underlie isoform-specific difference in IP6-mediated activation. Eight extra residues (from Leu 334 to Ser 341) in the arrestin-2 C-loop prevent its arrestin-3-like oligomerization (Figure 6). Interestingly, arrestin-2 has a short splice variant lacking these eight residues (Supplementary Figure 3)47. The relative abundance of these splice variants of arrestin-2 varies in different tissues47. While both variants of arrestin-2 bind receptors similarly55, they oligomerize differently (Figure 6). It is tempting to speculate that they have different receptor-independent functions.
IP6-dependent oligomerization likely affects subcellular localization of arrestins15. Arrestin-2 distributes evenly between the cytoplasm and nucleus56. It is actively imported into the nucleus but doesn’t contain a nuclear export signal (NES)57; 58. Because the oligomer cannot be imported into the nucleus, the oligomeric form was proposed to be cytosolic, serving as a storage pool of inactive arrestin-2. In contrast, arrestin-3 contains a NES in its C-tail and predominantly localizes to the cytosol56. The NES in arrestin-3 is located in the C-tail right after the segment anchoring it to the N-domain, which likely hinders its interaction with the nuclear export machinery. In the arrestin-3 trimer the C-tail is released, which would increase NES accessibility. Indeed, arrestin-3 has been shown to relocalize its binding partners, MDM2 and JNK3, from the nucleus to the cytosol56.
Our findings suggest that the IP6-induced oligomerization stabilizes the basal state of arrestin-2 and activated state of arrestin-3. IP6-dependent arrestin-3 activation may bias signaling towards JNK3, which regulates critical functions including proliferation, apoptosis, motility, metabolism, and DNA repair59. Oligomerization might contribute to arrestin-3-mediated JNK3 activation in cells. One recent study shows that an arrestin-3 oligomer prevents the clearance of tau, leading to the degeneration of frontotemporal lobe60. However, the authors assumed that arrestin-3 forms the same type of oligomers as arrestin-2 without experimental evidence60, which is not supported by our data.
To summarize, our data demonstrate that the two non-visual arrestins self-associate in distinct manner, and that the mode of their oligomerization in the presence of IP6 likely affects their functional capabilities. Neither non-visual subtype forms tetramers resembling those of arrestin-123; 24. It was always assumed that the function of each arrestin isoform is encoded in the structure of monomeric protein. Our data suggest for the first time that the mode of oligomerization might underlie functional differences of the two non-visual arrestins. It is tempting to speculate that distinct structure of oligomers might yield functional differences of isoforms of other oligomerizing proteins.
Materials and Methods
Materials.
All restriction endonucleases and DNA modifying enzymes were from New England Biolabs (Ipswich, MA). Other chemicals were from sources recently reported26; 37; 61.
Arrestin mutagenesis, expression, and purification.
Site-directed mutagenesis, expression, and purification of bovine arrestins were performed, as described1; 25; 36; 38. All mutations for the EPR studies were generated on the background of cysteine-less arrestin-2-(C59V, C125S, C140L, C150V, C242V, C251V, C269S), which retains functionality38, similar to cysteine-less arrestin-1-(C63V, C128S, C143V), which was also shown to be fully functional35. Cysteine-less arrestin-3 carried the same mutations as cysteine-less arrestin-2, and an additional Cys408 exposed in the C-terminus was replaced with Ser408.
Light scattering and analysis of arrestin self-association.
10 mM IP6 stock solution was freshly made by dissolving it in buffer containing 50 mM MOPS (pH 7.2) and 100 mM NaCl. The pH was adjusted with NaOH to 7.2. Purified arrestin proteins at different concentrations were incubated with or without 100 μM IP6 at room temperature for 20 min and the 100 μl sample was injected onto a QC-PAK GFC 300 column (Tosoh Bioscience) at a flow rate of 0.6 ml/min in column buffer containing 50 mM MOPS (pH 7.2), 100 mM NaCl. 100 μM IP6 was also added to the column buffer for arrestin samples containing IP6. The column did not resolve oligomeric species, but simply acted as a filter to remove highly scattering particles. All light scattering measurements were made with a DAWN EOS detector coupled to an Optilab T-rEX refractometer (Wyatt Technologies). Light scattering at 7 angles (72°–126°) and refractive index (at 658 nm) for each sample were taken for a narrow slice centered at the peak of the elution profile. ASTRA 5.3.4.20 software (Wyatt Technologies) was used to obtain the experimental weight-averaged molecular weight values. Details of the analysis have been previously described26. Except where noted, the equilibrium dissociation constants are presented. The errors in equilibrium constants were determined from least-squares fitting of the data to the proposed model, taking into account an estimated error of ± 1 kDa in the computed values of the average molecular weight. Self-association of arrestin-2, where the maximum average molecular weight exceeded that of a tetramer, was analyzed using a linear polymerization model40.
DEER measurements and data analysis.
Purified arrestin mutants were spin-labeled with 4-maleimido-TEMPO spin label as previously described36. Four-pulse DEER spectroscopy data were collected on an X-band Bruker ELEXSYS 580 spectrometer fitted with a 3 mm split-ring resonator (Bruker Biospin) or on a Q-band Bruker ELEXSYS 580 spectrometer using a 10W amplifier and an EN5107D2 probehead (Bruker Biospin). Samples of 300 μM arrestin-2 and 600 μM IP6 in buffer containing 20% glycerol were loaded into sealed quartz capillaries and flash frozen in a dry ice-acetone slurry prior to data collection at 80 K. The experimental distance distributions were determined from fits to the background-corrected dipolar evolution data using the model-free algorithms in the LongDistances software program (http://www.biochemistry.ucla.edu/biochem/Faculty/Hubbell/)62.
SEC-MALLS-SAXS.
The SEC-MALLS-SAXS experiments were carried out at BioCAT (beamline 18ID at the Advanced Photon Source, Chicago) with in-line SEC column with an exclusion limit of 1.25MDa (Wyatt WTC-030S5) connected to Agilent Infinity II HPLC. MALLS data were collected on Wyatt DAWN-Helios II and dRI on Wyatt Optilab-T-rEX (Wyatt Technology). The SEC is followed by an UV detector, MALLS detectors and the SAXS flow cell. Purified arrestin-3 was serially diluted from 45 to 5.75 μM in four steps with buffer 20 mM MOPS pH 7.5, 150 mM NaCl, 1 mM TCEP. For each run, 300 μl of protein sample was injected into the SEC column. Similar serial dilutions of arrestin-3 were then mixed with 100 μM IP6 before loading into SEC column. The MALLS data were processed using ASTRA software (Wyatt Technologies). The SAXS flow cell consists of a 1.0 mm ID quartz capillary with ~50 μm walls. A coflowing buffer sheath (20 mM MOPS pH 7.5, 150 mM NaCl, 1 mM TCEP) is used to separate sample from the capillary walls to prevent radiation damage63. The scattering intensity was recorded using a Pilatus3 X 1M (Dectris) detector. The sample to detector distance was 3.64 m which gives an access to a q-range of 0.0046 Å−1 to 0.36 Å−1. The exposures of 0.5 s were acquired every 2 seconds during elution. The acquired data were then reduced to 1D profiles using BioXTAS RAW 1.6.064. This program automatically determined an appropriate buffer region preceding the peak, which was then averaged and subtracted from every frame in the data set.
SAXS data were acquired only at highest protein concentration (i.e. 45μM) with and without 100 μM IP6. The overlapping SAXS elution profiles were deconvolved into the constituent components using evolving factor analysis65 with default settings as implemented in RAW64. The deconvolution was validated through the mean error weighted χ2 for the whole deconvolution range. The component 1 was used for further data analysis on the basis of the quality of scattering profile and SAXS derived molecular weight compared to the values observed from MALLS data. For arrestin-3-(1–393) SAXS data was collected for 45 μM and 22.5 μM protein in the presence of 100 μM IP6 on the SIBYLS beamline (beamline 12.3.1) at the Advanced Light Source, Lawrence Berkeley National Laboratory. Radius of gyration, molecular weight and pair-distance distribution P(r) of the scattering species in solution were carried out by running Guinier analysis, molecular weight estimation and GNOM in RAW64; 66; 67; 68. Bead modelling to get solution shape of scattering particles was done using 15 reconstructions from DAMMIF in slow mode, averaged by DAMAVER, and a final structure was refined in DAMMIN69; 70; 71. AMBIMETER was used to asses ambiguity of reconstructions72.
Size exclusion chromatography.
Purified arrestin-3-(1–393) and its loop insertion mutant were incubated with or without 100 μM of IP6 for 30 min and then injected onto a S-200 Increase column (GE Healthcare) equilibrated with 20 mM MOPS (pH7.5), 150 mM NaCl and 1 mM TCEP. The retention volume was used to estimate the average molecular weight using a standard curve.
Supplementary Material
Table 2.
Inter-subunit distances between equivalent arrestin-3 sites in the arrestin-2 crystal structure in complex with IP6 (PDB: 1ZSH15) and DEER distance measured in the presence of IP6.
| Arrestin-3 | 34R1 | 68R1 | 88R1 | 122R1 | 188R1 | apo 188R1 | 193R1 | 222R1 | 278R1 | 313R1 |
|---|---|---|---|---|---|---|---|---|---|---|
| R1-R1 distance 1ZSH (Å) | 78.2 | 42.7 | 82.8 | 68.0 | 49.4 | 49.4 | 71.5 | 58.6 | 64.6 | 42.4 |
| DEER distance (Å) | >58 | 39.4 >53 (25.6) |
>56 | >56 | >56 (45.2) (25.9) |
37.3 54.1 |
>56 (40.0) |
>50 (24.3) |
>58 | 42.7 >53 |
Highlights.
In the presence of IP6 arrestin-2 and arrestin-3 form different oligomers
IP6 activates arrestin-3, but does not activate arrestin-2
An eight-residue insertion in arrestin-2 controls differential oligomerization
Funding:
Supported in part by National Institutes of Health (NIH) grants GM122491, EY011500, and Cornelius Vanderbilt Chair (VVG), NIH grants GM120569 and DA043680 (TMI), EB001980 (National Biomedical EPR Center), RR022422 and OD011937 (DEER instrumentation) (CSK), and an American Heart Association Fellowship 19POST34450093 (PS). SAXS experiments were performed at the Advanced Photon Source, a US DOE Office of Science User Facility operated by Argonne National Laboratory under Contract No. DE-AC02-06CH11357. Facility was supported by NIH grant GM103622; the use of the Pilatus 3 1M detector was supported by NIH grant OD018090. IP was supported by the National Science Foundation (1937963). Any opinions, findings, and conclusions or recommendations expressed in this material are those of the author(s) and do not necessarily reflect the views of the National Science Foundation.
Abbreviations used:
- AUC
analytical ultracentrifugation
- DEER
pulse EPR technique double electron-electron resonance
- GPCR
G protein-coupled receptor
- GRK
G protein-coupled receptor kinase
- IP6
inositol-hexakisphosphate
- JNK3
c-Jun N-terminal kinase isoform 3
- MALLS
multi-angle laser light scattering
- SAXS
small angle X-ray scattering
- SEC
size exclusion chromatography
Footnotes
Publisher's Disclaimer: This is a PDF file of an unedited manuscript that has been accepted for publication. As a service to our customers we are providing this early version of the manuscript. The manuscript will undergo copyediting, typesetting, and review of the resulting proof before it is published in its final form. Please note that during the production process errors may be discovered which could affect the content, and all legal disclaimers that apply to the journal pertain.
Competing interests: The authors declare no conflict of interest.
We use systematic names of arrestin proteins, where the number after the dash indicates the order of cloning: arrestin-1 (historic names S-antigen, 48 kDa protein, visual or rod arrestin), arrestin-2 (β-arrestin or β-arrestin1), arrestin-3 (β-arrestin2 or hTHY-ARRX), and arrestin-4 (cone or X-arrestin).
Reference:
- 1.Chen Q, Perry NA, Vishnivetskiy SA, Berndt S, Gilbert NC, Zhuo Y, Singh PK, Tholen J, Ohi MD, Gurevich EV, Brautigam CA, Klug KS, Gurevich VV & Iverson TM (2017). Structural basis of arrestin-3 activation and signaling. Nat Commun 8, 1427. [DOI] [PMC free article] [PubMed] [Google Scholar]
- 2.Wilden U (1995). Duration and amplitude of the light-induced cGMP hydrolysis in vertebrate photoreceptors are regulated by multiple phosphorylation of rhodopsin and by arrestin binding. Biochemistry 34, 1446–54. [DOI] [PubMed] [Google Scholar]
- 3.Krupnick JG, Gurevich VV & Benovic JL (1997). Mechanism of quenching of phototransduction. Binding competition between arrestin and transducin for phosphorhodopsin. J Biol Chem 272, 18125–31. [DOI] [PubMed] [Google Scholar]
- 4.Goodman OB Jr., Krupnick JG, Santini F, Gurevich VV, Penn RB, Gagnon AW, Keen JH & Benovic JL (1996). Beta-arrestin acts as a clathrin adaptor in endocytosis of the beta2-adrenergic receptor. Nature 383, 447–50. [DOI] [PubMed] [Google Scholar]
- 5.Laporte SA, Oakley RH, Zhang J, Holt JA, Ferguson s. S. G., Caron MG & Barak LS (1999). The 2-adrenergic receptor/arrestin complex recruits the clathrin adaptor AP-2 during endocytosis. Proc Nat Acad Sci USA 96, 3712–3717. [DOI] [PMC free article] [PubMed] [Google Scholar]
- 6.Gurevich EV & Gurevich VV (2006). Arrestins are ubiquitous regulators of cellular signaling pathways. Genome Biol 7, 236. [DOI] [PMC free article] [PubMed] [Google Scholar]
- 7.Peterson YK & Luttrell LM (2017). The Diverse Roles of Arrestin Scaffolds in G Protein-Coupled Receptor Signaling. Pharmacol Rev 69, 256–297. [DOI] [PMC free article] [PubMed] [Google Scholar]
- 8.Gurevich VV & Gurevich EV (2006). The structural basis of arrestin-mediated regulation of G protein-coupled receptors. Pharm Ther 110, 465–502. [DOI] [PMC free article] [PubMed] [Google Scholar]
- 9.Gurevich VV, Hanson SM, Song X, Vishnivetskiy SA & Gurevich EV (2011). The functional cycle of visual arrestins in photoreceptor cells. Prog Retin Eye Res 30, 405–430. [DOI] [PMC free article] [PubMed] [Google Scholar]
- 10.Gurevich VV & Gurevich EV (2004). The molecular acrobatics of arrestin activation. Trends Pharmacol Sci 25, 105–111. [DOI] [PubMed] [Google Scholar]
- 11.Gurevich EV, Tesmer JJ, Mushegian A & Gurevich VV (2012). G protein-coupled receptor kinases: more than just kinases and not only for GPCRs. Pharmacol Ther 133, 40–6. [DOI] [PMC free article] [PubMed] [Google Scholar]
- 12.Chen Q, Iverson TM & Gurevich VV (2018). Structural basis of arrestin-dependent signal transduction. Trends Biochem Sci 43, 412–423. [DOI] [PMC free article] [PubMed] [Google Scholar]
- 13.Palczewski K, Pulvermuller A, Buczylko J & Hofmann KP (1991). Phosphorylated rhodopsin and heparin induce similar conformational changes in arrestin. J Biol Chem 266, 18649–18654. [PubMed] [Google Scholar]
- 14.Zhuang T, Vishnivetskiy SA, Gurevich VV & Sanders CR (2010). Elucidation of IP6 and heparin interaction sites and conformational changes in arrestin-1 by solution NMR. Biochemistry, 10473–10485. [DOI] [PMC free article] [PubMed] [Google Scholar]
- 15.Milano SK, Kim YM, Stefano FP, Benovic JL & Brenner C (2006). Nonvisual arrestin oligomerization and cellular localization are regulated by inositol hexakisphosphate binding. J Biol Chem 281, 9812–23. [DOI] [PubMed] [Google Scholar]
- 16.Hirsch JA, Schubert C, Gurevich VV & Sigler PB (1999). The 2.8 A crystal structure of visual arrestin: a model for arrestin’s regulation. Cell 97, 257–269. [DOI] [PubMed] [Google Scholar]
- 17.Han M, Gurevich VV, Vishnivetskiy SA, Sigler PB & Schubert C (2001). Crystal structure of beta-arrestin at 1.9 A: possible mechanism of receptor binding and membrane translocation. Structure 9, 869–880. [DOI] [PubMed] [Google Scholar]
- 18.Sutton RB, Vishnivetskiy SA, Robert J, Hanson SM, Raman D, Knox BE, Kono M, Navarro J & Gurevich VV (2005). Crystal Structure of Cone Arrestin at 2.3Å: Evolution of Receptor Specificity. J Mol Biol 354, 1069–1080. [DOI] [PubMed] [Google Scholar]
- 19.Zhan X, Gimenez LE, Gurevich VV & Spiller BW (2011). Crystal structure of arrestin-3 reveals the basis of the difference in receptor binding between two non-visual subtypes. J Mol Biol 406, 467–78. [DOI] [PMC free article] [PubMed] [Google Scholar]
- 20.Zhou XE, He Y, de Waal PW, Gao X, Kang Y, Van Eps N, Yin Y, Pal K, Goswami D, White TA, Barty A, Latorraca NR, Chapman HN, Hubbell WL, Dror RO, Stevens RC, Cherezov V, Gurevich VV, Griffin PR, Ernst OP, Melcher K & Xu HE (2017). Identification of Phosphorylation Codes for Arrestin Recruitment by G Protein-Coupled Receptors. Cell 170, 457–469 e13. [DOI] [PMC free article] [PubMed] [Google Scholar]
- 21.Shukla AK, Manglik A, Kruse AC, Xiao K, Reis RI, Tseng WC, Staus DP, Hilger D, Uysal S, Huang LY, Paduch M, Tripathi-Shukla P, Koide A, Koide S, Weis WI, Kossiakoff AA, Kobilka BK & Lefkowitz RJ (2013). Structure of active beta-arrestin-1 bound to a G-protein-coupled receptor phosphopeptide. Nature 497, 137–41. [DOI] [PMC free article] [PubMed] [Google Scholar]
- 22.Palczewski K, Pulvermüller A, Buczylko J, Gutmann C & Hofmann KP (1991). Binding of inositol phosphates to arrestin. FEBS Lett 295, 195–9. [DOI] [PubMed] [Google Scholar]
- 23.Hanson SM, Dawson ES, Francis DJ, Van Eps N, Klug CS, Hubbell WL, Meiler J & Gurevich VV (2008). A model for the solution structure of the rod arrestin tetramer. Structure 16, 924–34. [DOI] [PMC free article] [PubMed] [Google Scholar]
- 24.Hanson SM, Van Eps N, Francis DJ, Altenbach C, Vishnivetskiy SA, Arshavsky VY, Klug CS, Hubbell WL & Gurevich VV (2007). Structure and function of the visual arrestin oligomer. EMBO J 26, 1726–36. [DOI] [PMC free article] [PubMed] [Google Scholar]
- 25.Hanson SM, Vishnivetskiy SA, Hubbell WL & Gurevich VV (2008). Opposing effects of inositol hexakisphosphate on rod arrestin and arrestin2 self-association. Biochemistry 47, 1070–5. [DOI] [PMC free article] [PubMed] [Google Scholar]
- 26.Kim M, Hanson SM, Vishnivetskiy SA, Song X, Cleghorn WM, Hubbell WL & Gurevich VV (2011). Robust self-association is a common feature of mammalian visual arrestin-1. Biochemistry 50, 2235–2242. [DOI] [PMC free article] [PubMed] [Google Scholar]
- 27.Schubert C, Hirsch JA, Gurevich VV, Engelman DM, Sigler PB & Fleming KG (1999). Visual arrestin activity may be regulated by self-association. J Biol Chem 274, 21186–21190. [DOI] [PubMed] [Google Scholar]
- 28.Storez H, Scott MG, Issafras H, Burtey A, Benmerah A, Muntaner O, Piolot T, Tramier M, Coppey-Moisan M, Bouvier M, Labbé-Jullié C & Marullo S (2005). Homo- and hetero-oligomerization of beta-arrestins in living cells. J Biol Chem 280, 40210–5. [DOI] [PubMed] [Google Scholar]
- 29.Hanson SM, Gurevich EV, Vishnivetskiy SA, Ahmed MR, Song X & Gurevich VV (2007). Each rhodopsin molecule binds its own arrestin. Proc Nat Acad Sci USA 104, 3125–8. [DOI] [PMC free article] [PubMed] [Google Scholar]
- 30.Kang Y, Zhou XE, Gao X, He Y, Liu W, Ishchenko A, Barty A, White TA, Yefanov O, Han GW, Xu Q, de Waal PW, Ke J, Tan MHE, Zhang C, Moeller A, West GM, Van Eps N, Caro LN, Vishnivetskiy SA, Lee RJ, Suino-Powell KM, Gu X, Pal K, Ma J, Zhi X, Boutet S, Williams GJ, Messerschmidt M, Gati C, Zatsepin NA, Wang D, James D, Basu S, Roy-Chowdhuty S, Conrad S, Coe J, Liu H, Lisova S, Kupitz C, Grotjohann I, Fromme R, Jiang Y, Tan M, Yang H, Li J, Wang M, Zheng Z, Li D, Zhao Y, Standfuss J, Diederichs K, Dong Y, Potter CS, Carragher B, Caffrey M, Jiang H, Chapman HN, Spence JCH, Fromme P, Weierstall U, Ernst OP, Katritch V, Gurevich VV, Griffin PR, Hubbell WL, Stevens RC, Cherezov V, Melcher K & Xu HE (2015). Crystal structure of rhodopsin bound to arrestin determined by femtosecond X-ray laser. Nature 523, 561–7. [DOI] [PMC free article] [PubMed] [Google Scholar]
- 31.Yin W, Li Z, Jin M, Yin YL, de Waal PW, Pal K, Yin Y, Gao X, He Y, Gao J, Wang X, Zhang Y, Zhou H, Melcher K, Jiang Y, Cong Y, Zhou XE, Yu X & Xu HE (2019). A complex structure of arrestin-2 bound to a G protein-coupled receptor. Cell Res 29, 971–983. [DOI] [PMC free article] [PubMed] [Google Scholar]
- 32.Staus DP, Hu H, Robertson MJ, Kleinhenz ALW, Wingler LM, Capel WD, Latorraca NR, Lefkowitz RJ & Skiniotis G (2020). Structure of the M2 muscarinic receptor-beta-arrestin complex in a lipid nanodisc. Nature 579, 297–302. [DOI] [PMC free article] [PubMed] [Google Scholar]
- 33.Lee Y, Warne T, Nehmé R, Pandey S, Dwivedi-Agnihotri H, Chaturvedi M, Edwards PC, García-Nafría J, Leslie AGW, Shukla AK & Tate CG (2020). Molecular basis of β-arrestin coupling to formoterol-bound β(1)-adrenoceptor. Nature, in press. [DOI] [PMC free article] [PubMed] [Google Scholar]
- 34.Huang W, Masureel M, Qianhui Q, Janetzko J, Inoue A, Kato HE, Robertson MJ, Nguyen KC, Glenn JS, Skiniotis G & Kobilka BK (2020). Structure of the neurotensin receptor 1 in complex with β-arrestin 1. Nature 579, 303–308. [DOI] [PMC free article] [PubMed] [Google Scholar]
- 35.Hanson SM, Francis DJ, Vishnivetskiy SA, Kolobova EA, Hubbell WL, Klug CS & Gurevich VV (2006). Differential interaction of spin-labeled arrestin with inactive and active phosphorhodopsin. Proc Natl Acad Sci U S A 103, 4900–4905. [DOI] [PMC free article] [PubMed] [Google Scholar]
- 36.Zhuo Y, Vishnivetskiy SA, Zhan X, Gurevich VV & Klug CS (2014). Identification of receptor binding-induced conformational changes in non-visual arrestins. J Biol Chem 289, 20991–1002. [DOI] [PMC free article] [PubMed] [Google Scholar]
- 37.Zhuang T, Chen Q, Cho M-K, Vishnivetskiy SA, Iverson TM, Gurevich VV & Sanders CR (2013). Involvement of distinct arrestin-1 elements in binding to different functional forms of rhodopsin. Proc Nat Acad Sci USA 110, 942–947. [DOI] [PMC free article] [PubMed] [Google Scholar]
- 38.Hanson SM, Cleghorn WM, Francis DJ, Vishnivetskiy SA, Raman D, Song X, Nair KS, Slepak VZ, Klug CS & Gurevich VV (2007). Arrestin mobilizes signaling proteins to the cytoskeleton and redirects their activity. J Mol Biol, in press. [DOI] [PMC free article] [PubMed] [Google Scholar]
- 39.Bunce CM, French PJ, Allen P, Mountford JC, Moor B, Greaves MF, Michell RH & Brown G (1993). Comparison of the levels of inositol metabolites in transformed haemopoietic cells and their normal counterparts. Biochem J 289 (Pt 3), 667–73. [DOI] [PMC free article] [PubMed] [Google Scholar]
- 40.Oosawa F & Asakura S (1975). Thermodynamics of the polymerization of Protein. Molecular Biology Series, 28–35. [Google Scholar]
- 41.Gurevich EV, Benovic JL & Gurevich VV (2002). Arrestin2 and arrestin3 are differentially expressed in the rat brain during postnatal development. Neuroscience 109, 421–436. [DOI] [PubMed] [Google Scholar]
- 42.Gurevich EV, Benovic JL & Gurevich VV (2004). Arrestin2 expression selectively increases during neural differentiation. J Neurochem 91, 1404–1416. [DOI] [PubMed] [Google Scholar]
- 43.Krissinel E & Henrick K (2007). Inference of macromolecular assemblies from crystalline state. J Mol Biol 372, 774–797. [DOI] [PubMed] [Google Scholar]
- 44.Chen Q, Zhuo Y, Kim M, Hanson SM, Francis DJ, Vishnivetskiy SA, Altenbach C, Klug CS, Hubbell WL & Gurevich VV (2014). Self-association of arrestin family members. Handb Exp Pharmacol 219, 205–23. [DOI] [PMC free article] [PubMed] [Google Scholar]
- 45.Indrischek H, Prohaska SJ, Gurevich VV, Gurevich EV & Stadler PF (2017). Uncovering missing pieces: duplication and deletion history of arrestins in deuterostomes. BMC Evol Biol 17, 163. [DOI] [PMC free article] [PubMed] [Google Scholar]
- 46.Attramadal H, Arriza JL, Aoki C, Dawson TM, Codina J, Kwatra MM, Snyder SH, Caron MG & Lefkowitz RJ (1992). Beta-arrestin2, a novel member of the arrestin/beta-arrestin gene family. J Biol Chem 267, 17882–17890. [PubMed] [Google Scholar]
- 47.Sterne-Marr R, Gurevich VV, Goldsmith P, Bodine RC, Sanders C, Donoso LA & Benovic JL (1993). Polypeptide Variants of Beta-Arrestin and Arrestin3. Journal of Biological Chemistry 268, 15640–15648. [PubMed] [Google Scholar]
- 48.McDonald PH, Chow CW, Miller WE, Laporte SA, Field ME, Lin FT, Davis RJ & Lefkowitz RJ (2000). Beta-arrestin 2: a receptor-regulated MAPK scaffold for the activation of JNK3. Science 290, 1574–1577. [DOI] [PubMed] [Google Scholar]
- 49.Miller WE, McDonald PH, Cai SF, Field ME, Davis RJ & Lefkowitz RJ (2001). Identification of a motif in the carboxyl terminus of beta -arrestin2 responsible for activation of JNK3. J Biol Chem 276, 27770–7. [DOI] [PubMed] [Google Scholar]
- 50.Seo J, Tsakem EL, Breitman M & Gurevich VV (2011). Identification of arrestin-3-specific residues necessary for JNK3 activation. J Biol Chem 286, 27894–27901. [DOI] [PMC free article] [PubMed] [Google Scholar]
- 51.Song X, Coffa S, Fu H & Gurevich VV (2009). How does arrestin assemble MAPKs into a signaling complex? J Biol Chem 284, 685–95. [DOI] [PMC free article] [PubMed] [Google Scholar]
- 52.Min K, Yoon HJ, Park JY, Baidya M, Dwivedi-Agnihotri H, Maharana J, Chaturvedi M, Chung KY, Shukla AK & Lee HH (2020). Crystal Structure of β-Arrestin 2 in Complex with CXCR7 Phosphopeptide. Structure S0969–2126, 30205–7. [DOI] [PMC free article] [PubMed] [Google Scholar]
- 53.Shukla AK, Manglik A, Kruse AC, Xiao K, Reis RI, Tseng WC, Staus DP, Hilger D, Uysal S, Huang LY, Paduch M, Tripathi-Shukla P, Koide A, Koide S, Weis WI, Kossiakoff AA, Kobilka BK & Lefkowitz RJ (2013). Structure of active β-arrestin-1 bound to a G-protein-coupled receptor phosphopeptide. Nature 497, 137–141. [DOI] [PMC free article] [PubMed] [Google Scholar]
- 54.Gurevich VV & Benovic JL (1993). Visual arrestin interaction with rhodopsin: Sequential multisite binding ensures strict selectivity towards light-activated phosphorylated rhodopsin. J. Biol. Chem 268, 11628–11638. [PubMed] [Google Scholar]
- 55.Gurevich VV, Dion SB, Onorato JJ, Ptasienski J, Kim CM, Sternemarr R, Hosey MM & Benovic JL (1995). Arrestin Interactions with G-Protein-Coupled Receptors - Direct Binding-Studies of Wild-Type and Mutant Arrestins with Rhodopsin, Beta(2)-Adrenergic, and M2-Muscarinic Cholinergic Receptors. Journal of Biological Chemistry 270, 720–731. [DOI] [PubMed] [Google Scholar]
- 56.Song X, Raman D, Gurevich EV, Vishnivetskiy SA & Gurevich VV (2006). Visual and both non-visual arrestins in their “inactive” conformation bind JNK3 and Mdm2 and relocalize them from the nucleus to the cytoplasm. J Biol Chem 281, 21491–9. [DOI] [PMC free article] [PubMed] [Google Scholar]
- 57.Scott MG, Le Rouzic E, Perianin A, Pierotti V, Enslen H, Benichou S, Marullo S & Benmerah A (2002). Differential nucleocytoplasmic shuttling of beta-arrestins. Characterization of a leucine-rich nuclear export signal in beta-arrestin2. J Biol Chem 277, 37693–701. [DOI] [PubMed] [Google Scholar]
- 58.Wang P, Wu YL, Ge X, Ma L & Pei G (2003). Subcellular localization of beta-arrestins is determined by their intact N domain and the nuclear export signal at the C terminus. Journal of Biological Chemistry 278, 11648–11653. [DOI] [PubMed] [Google Scholar]
- 59.Bogoyevitch MA, Boehm I, Oakley A, Ketterman AJ & Barr RK Targeting the JNK MAPK cascade for inhibition: basic science and therapeutic potential. Biochim Biophys Acta 1697, 89–101. [DOI] [PubMed] [Google Scholar]
- 60.Woo JA, Liu T, Fang CC, Castaño MA, Kee T, Yrigoin K, Yan Y, Cazzaro S, Matlack J, Wang X, Zhao X, Kang DE & Liggett SB (2020). β-Arrestin2 oligomers impair the clearance of pathological tau and increase tau aggregates. Proc Nat Acad Sci USA 117, 5006–5015. [DOI] [PMC free article] [PubMed] [Google Scholar]
- 61.Kim M, Vishnivetskiy SA, Van Eps N, Alexander NS, Cleghorn WC, Zhan X, Hanson SM, Morizumi T, Ernst OP, Meiler J, Gurevich VV & Hubbell WL (2012). The conformation of receptor-bound visual arrestin. Proc Nat Acad Sci USA 109, 18407–18412. [DOI] [PMC free article] [PubMed] [Google Scholar]
- 62.Toledo Warshaviak D, Khramtsov VV, Cascio D, Altenbach C & Hubbell WL (2013). Structure and dynamics of an imidazoline nitroxide side chain with strongly hindered internal motion in proteins. J Magn Reson 232, 53–61. [DOI] [PMC free article] [PubMed] [Google Scholar]
- 63.Kirby N, Cowieson N, Hawley AM, Mudie ST, McGillivray DJ, Kusel M, Samardzic-Boban V & Ryan TM (2016). Improved radiation dose efficiency in solution SAXS using a sheath flow sample environment. Acta Crystallographica Section D-Structural Biology 72, 1254–1266. [DOI] [PMC free article] [PubMed] [Google Scholar]
- 64.Hopkins JB, Gillilan RE & Skou S (2017). BioXTAS RAW: improvements to a free open-source program for small-angle X-ray scattering data reduction and analysis. Journal of Applied Crystallography 50, 1545–1553. [DOI] [PMC free article] [PubMed] [Google Scholar]
- 65.Meisburger SP, Taylor AB, Khan CA, Zhang SN, Fitzpatrick PF & Ando N (2016). Domain Movements upon Activation of Phenylalanine Hydroxylase Characterized by Crystallography and Chromatography-Coupled Small-Angle X-ray Scattering. Journal of the American Chemical Society 138, 6506–6516. [DOI] [PMC free article] [PubMed] [Google Scholar]
- 66.Konarev PV, Volkov VV, Sokolova AV, Koch MHJ & Svergun DI (2003). PRIMUS: a Windows PC-based system for small-angle scattering data analysis. Journal of Applied Crystallography 36, 1277–1282. [Google Scholar]
- 67.Rambo RP & Tainer JA (2013). Accurate assessment of mass, models and resolution by small-angle scattering. Nature 496, 477–+. [DOI] [PMC free article] [PubMed] [Google Scholar]
- 68.Svergun DI (1992). Determination of the Regularization Parameter in Indirect-Transform Methods Using Perceptual Criteria. Journal of Applied Crystallography 25, 495–503. [Google Scholar]
- 69.Franke D & Svergun DI (2009). DAMMIF, a program for rapid ab-initio shape determination in small-angle scattering. J Appl Crystallogr 42, 342–346. [DOI] [PMC free article] [PubMed] [Google Scholar]
- 70.Volkov VV & Svergun DI (2003). Uniqueness of ab initio shape determination in small-angle scattering. Journal of Applied Crystallography 36, 860–864. [DOI] [PMC free article] [PubMed] [Google Scholar]
- 71.Svergun DI (1999). Restoring low resolution structure of biological macromolecules from solution scattering using simulated annealing. Biophys J 76, 2879–86. [DOI] [PMC free article] [PubMed] [Google Scholar]
- 72.Petoukhov MV & Svergun DI (2015). Ambiguity assessment of small-angle scattering curves from monodisperse systems. Acta Crystallogr D Biol Crystallogr 71, 1051–8. [DOI] [PubMed] [Google Scholar]
Associated Data
This section collects any data citations, data availability statements, or supplementary materials included in this article.