Abstract
Background:
This study aims to reveal early breast cancer (BC) specific competing endogenous RNA (ceRNA) network through the expression profiles of microRNAs (miRNAs), long non-coding RNAs (lncRNAs) and mRNAs.
Methods:
Based on The Cancer Genome Atlas (TCGA), we obtained the differentially expressed mRNAs, miRNAs, and lncRNAs (DEmRNAs, DEmiRNAs and DElncRNAs) between early BC and normal samples. The lncRNA–miRNA–mRNA interaction network was constructed using Cytoscape. Functional enrichment were performed using GeneCoDis3. The expression of selected genes were validated by qRT-PCR. Based on the published dataset, we validated the result of TCGA integration analysis. The diagnostic and prognostic value of candidate genes was evaluated by ROC curve analysis and survival analysis, respectively.
Results:
Totally, 1207 DEmRNAs, 194 DElncRNAs and 37 DEmiRNAs were obtained. Functional enrichment analysis results showed that all of DEmRNAs were enriched in pathway of cytokine-cytokine receptor interaction, PPAR signaling pathway and pathways in cancer. The DEmRNA-DEmiRNA-DElncRNA interaction network in early BC was consisted of 23 DEmiRNAs, 95 DElncRNAs and 309 DEmRNAs. Among ceRNA network, IL-6-hsa-miR-182-5p-ADAMTS9-AS1 interactions, LIFR-hsa-miR-21-5p-ADAMTS9-AS1 interactions and MMP1/MMP11-hsa-miR-145-5p-CDKN2B-AS1 interactions were speculated to involve in the development of early BC. The qRT-PCR results were consistent with our integrated analysis. Except for ADAMTS9-AS1 and CDKN2B-AS1, expression of the others results in the Gene Expression Omnibus (GEO) dataset were generally consistent with TCGA integrated analysis. The area under curve (AUC) of the ADAMTS9-AS1, CDKN2B-AS1, IL-6, MMP11, hsa-miR-145-5p and hsa-miR-182-5p were 0.947, 0.862, 0.842, 0.993, 0.960 and 0.944, and the specificity and sensitivity of the 6 biomarkers were 83.4% and 95.6%, 72.2% and 90.3%, 80.1% and 74.3%, 96.2% and 96.5%, 90.1% and 92.3%, and 88.7% and 90.4%, respectively. In addition, IL-6 had potential prognostic value for early BC.
Conclusion:
These findings may provide novel insights into the lncRNA-miRNA-mRNA network and uncover potential therapeutic targets in early BC.
Keywords: early breast cancer, lncRNA, miRNA, ceRNA network, biomarkers
Introduction
Breast cancer (BC) is one of lethal diseases and one of leading causes of cancer death in women.1 Despite several advancements have been achieved in treatments, the predictive value of clinical and pathological symptoms for early BC is limited. In addition, the underlying mechanisms of BC is not fully understood. Thus, the identification of novel and effective biomarker and clarifying potential mechanism of early BC is urgent issues.
Non coding RNAs are RNA molecules that do not encode protein and play a master regulators in a wide range of biological processes. As evidence suggest that non coding RNAs have a variety of biological functions and may play a key roles in development and progression of tumors.2 Compare with other noncoding RNAs, lncRNAs and miRNA have attracted particular attention because there is increasing evidence that they are involved in the occurrence and progression of tumors.3,4 MiRNAs are endogenous small RNA molecules that modulate gene expression and function by suppressing the translation and inducing the degradation of target mRNA.5 LncRNAs are a novel class of RNA molecules which are involved in various diseases.6 LncRNA may modulate miRNA function through acting as endogenous sponges to regulate its target mRNAs expression, and binding of miRNA to a lncRNA can regulate the stability of lncRNAs.7 However the functional mechanisms of the large majority of lncRNAs and miRNAs interactions in early BC remains unclear. The competing endogenous RNA (ceRNA) hypothesis, a novel large-scale regulatory RNA network system, is firstly proposed by Salmena et al.8 CeRNA provides a novel means for studying the pathogenesis of cancer, with high diagnostic accuracy. Subsequent studies confirmed the importance of the ceRNA regulatory network of lncRNA–miRNA–mRNA in various cancers.9-11 However, a comprehensive analysis of early BC-associated ceRNA regulatory network has not been reported.
To address these issues, we attempted to reveal DEmiRNAs, DElncRNAs and DEmRNAs in early BC using data from TCGA. Next, we successfully built a ceRNA network and devolved the novel and effective biomarker for early BC. Our study can help uncover the function of potential biomarkers via ceRNA network in early BC, and provide further insights into the underlying mechanisms of early BC.
Methods
Access of Raw Data
The lncRNA expression profiles (Level 3-IlluminaHiSeq-lncRNASeq data), miRNA expression profiles (Level 3-IlluminaHiSeq-MiRNASeq data) and mRNA expression profiles (Level 3-IlluminaHiSeq-mRNASeq data) and correlated clinical data of BC were download by from the Cancer Genome Atlas (TCGA) using Genomic Data Commons tool. Our study enrolled only patients who were histologically diagnosed as stage I-II breast cancer. Finally, expression data and correlated clinical information of 787 early BC patients and 78 normal adjacent samples were included in this study. All sequencing data were acquired using the Illumina HiSeq RNA-Seq Platforms. The detailed characteristics of the early BC patients and normal adjacent were listed in Table 1.
Table 1.
Baseline Clinical Characteristics of Subjects.
| Overall | Early BC | Control | p | |
|---|---|---|---|---|
| n | 865 | 787 | 78 | |
| Age (mean (SD)) | 58.44 (13.14) | 58.45 (12.91) | 58.35 (15.36) | 0.949 |
| Sex = Male | 9 | 8 | 1 | 1 |
| Sex = Female | 856 | 779 | 77 | 0.68 |
| Race (%) | 0.001 | |||
| ASIAN | 47 (5.4) | 47 (6.0) | 0 (0.0) | |
| Black or African American | 143 (16.5) | 137 (17.4) | 6 (7.7) | |
| White | 616 (71.2) | 545 (69.3) | 71 (91.0) | |
| Not available | 59 (6.8) | 58 (7.4) | 1 (1.3) | |
| OS (median [IQR]) | 926.00 [488.00, 1793.00] | 890.00 [465.50, 1730.00] | 1268.00 [779.00, 2179.00] | 0.002 |
| Event = Dead (%) | 106 (12.3) | 76 (9.7) | 30 (38.5) | <0.001 |
| Stage (%) | 0.19 | |||
| Stage I | 103 (11.9) | 88 (11.2) | 15 (19.2) | |
| Stage IA | 89 (10.3) | 85 (10.8) | 4 (5.1) | |
| Stage IB | 6 (0.7) | 6 (0.8) | 0 (0.0) | |
| Stage II | 6 (0.7) | 6 (0.8) | 0 (0.0) | |
| Stage IIA | 386 (44.6) | 353 (44.9) | 33 (42.3) | |
| Stage IIB | 275 (31.8) | 249 (31.6) | 26 (33.3) | |
| Estrogen_receptor_status (%) | 0.022 | |||
| Indeterminate | 2 (0.2) | 1 (0.1) | 1 (1.3) | |
| Negative | 194 (22.4) | 178 (22.6) | 16 (20.5) | |
| Not evaluated | 42 (4.9) | 34 (4.3) | 8 (10.3) | |
| Positive | 627 (72.5) | 574 (72.9) | 53 (67.9) | |
| New_Event = Yes (%) | 71 (8.2) | 63 (8.0) | 8 (10.3) | 0.635 |
Screening of DElncRNAs, DEmiRNAs and DEmRNAs
The RNA-Seq expression datasets were obtained and then transformed from Fragments PerKilobase Million data into Transcripts PerKilobase Million data. In this study, the expression levels of lncNAs, miRNAs and mRNAs were calculated by the log2 of Transcripts PerKilobase Million. The undetectable lncRNAs, miRNAs and mRNAs (with read count value = 0 in more than 20% early BC case or in more than 20% normal) were deleted. The differentially expressed lncRNAs (DElncRNAs), miRNAs (DEmiRNAs) and mRNAs (DEmRNAs) in early BC were processed with R-bioconductor package DESeq2.12,13 For all the P values, we performed false discovery rate (FDR) to correct the statistical significance of multiple testing. DElncRNAs, DEmiRNAs and DEmRNAs were screened by thresholds of FDR < 0.05 and |logFC (fold change)| > 2. Hierarchical clustering analysis of DElncRNAs, DEmiRNAs and DEmRNAs were further produced by using R package.
Functional Annotation
The GeneCoDis314 (http://genecodis.cnb.csic.es/analysis) was used to conduct functional annotation, and we obtain the Gene Ontology (GO) classification and Kyoto Encyclopedia of Genes and Genomes (KEGG) pathways. FDR < 0.05 indicates statistically significant.
Construction of the Competing Endogenous RNA (DEmRNA–DEmiRNA–DElncRNA) Regulatory Network
The Pearson correlation coefficient was used to obtain DEmiRNA-DEmRNA interaction pairs in early BC vs. normal control. As miRNAs tend to decrease the expression of their target mRNA, target genes were selected from DEmRNAs that expressed inversely with that of miRNA, to subject to further investigation.15 DEmiRNA-DEmRNA co-expression pairs with p < 0.05 and r < 0 were served as significant. Target mRNAs were predicted for DEmiRNAs by 6 algorithms including RNA22,16 miRanda,17 miRDB,18 miRWalk,19 PICTAR220 and Targetscan,21 respectively. The DEmiRNA-DEmRNA pairs derived from miRWalk and the DEmiRNA-DEmRNA pairs recorded by ≥4 algorithms in which DEmRNA was negatively correlated with DEmiRNAs were retained for our subsequent analysis.
The Pearson correlation coefficient was used to obtain DEmiRNA-DElncRNA interaction pairs in early BC vs. normal control. MiRNA may negatively regulate the expression of lncRNA through the mechanism similar to mRNA. DEmiRNA-DElncRNA co-expression pairs with p < 0.05 and r < 0 were served as significant. Target lncRNAs were predicted for DEmiRNAs by 4 algorithms including RNAhybrid, miRanda, miRWalk and Targetscan, and the DElncRNA negatively correlated with DEmiRNA were retained for subsequent study.
DEmiRNA-DElncRNA pairs overlapped with DEmiRNA-DEmRNA interaction pairs were used to establish DElncRNA-DEmiRNA-DEmRNA interaction networks by using Cytoscape software.22,23
Confirmation by qRT-PCR
According to the results of TCGA integration analysis, 2 DEmRNA (IL6 and MMP11), 2 DEmiRNA (hsa-miR-145-5p and hsa-miR-182-5p) and 2 DElncRNA (ADAMTS9-AS1 and CDKN2B-AS1) were screened as candidate genes. Fourteen tissues samples of early BC patients (n = 7) and normal adjacent (n = 7) were obtained. This study has been approved by the ethics institute of our hospital. The signed informed consents of all the participants were obtained. This research complied with the principles of the Declaration of Helsinki.
Total RNA was extracted from samples using a RNA simple total RNA kit (Tiangen, China). RNA (2 μg) was reverse-transcribed using a Fast Quant RT Kit (Tiangen, China) according to the manufacturer’s instructions. Quantitative real-time PCR were conducted using the Super Real PreMix Plus SYBR Green (Tiangen, China) on ABI 7500 real-time PCR system. The 2-ΔΔCt method was used to analyze the relative quantification of mRNA, miRNA and lncRNA levels. Each sample was analyzed in triplicate. The PCR primers used are listed in Table 2. The human GAPDH and ACTB were used as endogenous controls for mRNA and lncRNA expression in analysis. The human hsa-U6 was used as endogenous controls for miRNA expression in analysis. Statistical significance was calculated using one-way ANOVA for experiments. P-values of <0.05 were considered statistically significant.
Table 2.
Primer Sequences Used for qRT-PCR.
| Name | Sequence (5′ to 3′) |
|---|---|
| ACTB-F | CATGTACGTTGCTATCCAGGC |
| ACTB-R | CTCCTTAATGTCACGCACGAT |
| GAPDH-F | CTCCAAAATCAAGTGGGGC |
| GAPDH-R | TGGTTCACACCCATGACGAA |
| ADAMTS9-AS1-F | TCCGATCTGACAGCCCACAT |
| ADAMTS9-AS1-R | AGGTGAGATTCCAGGGAGCC |
| CDKN2B-AS1-F | CAACCTTGAACTCCCAGGCTC |
| CDKN2B-AS1-R | CCCAAATTCCTGCCACTTCCT |
| IL6-F | ACTCACCTCTTCAGAACGAATTG |
| IL6-R | CCATCTTTGGAAGGTTCAGGTTG |
| MMP11-F | CCCTGTGAAGGTGAAGGCTC |
| MMP11-R | GATGGCCATGGGTCTCTAGC |
| hsa-miR-182-5p-F | TTTGGCAATGGTAGAACTCACACT |
| hsa-miR-145-5p-R | GTCCAGTTTTCCCAGGAATCCCT |
Validation in the Gene Expression Omnibus (GEO) Dataset
GSE70947 dataset was obtained from the GEO (https://www.ncbi.nlm.nih.gov/geo/), which consisted of 148 patients with BC and 148 normal controls. GSE125677 dataset including 3 paired breast cancer and adjacent normal tissues was downloaded from the GEO. GSE57897 dataset was downloaded from the GEO, which consisted of 422 patients with BC and 31 normal controls. The GEO dataset GSE70947, GSE125677 and GSE57897 were used to confirm the expression of some DEmRNAs, DEmiRNAs and DElncRNAs, respectively.
Receiver Operating Characteristic (ROC) Curve Analyses
In order to evaluate the diagnostic value of DEmRNAs, DEmiRNAs and DElncRNAs in BC, the “pROC” package was performed to generate ROC, and the area under the ROC curve (AUC) represents the diagnostic value. When AUC value was greater than 0.8, the DEG was thought to be able to distinguish between case and normal controls with good specificity and sensitivity.
Survival Analysis
To evaluate the prognostic of candidate genes in ceRNA network, survival analysis was generated using clinical data from TCGA. For survival analysis, patients from TCGA dataset were divided into high−/low-risk groups according to the Cox regression model. Kaplan–Meier curve was plotted using the survival (https://cran.r-project.org/web/packages/survival/index.html) in R. Statistical significance was calculated using the log-rank test (P-values of <0.05)
Results
DElncRNAs, DEmiRNAs and DEmRNA in Early BC
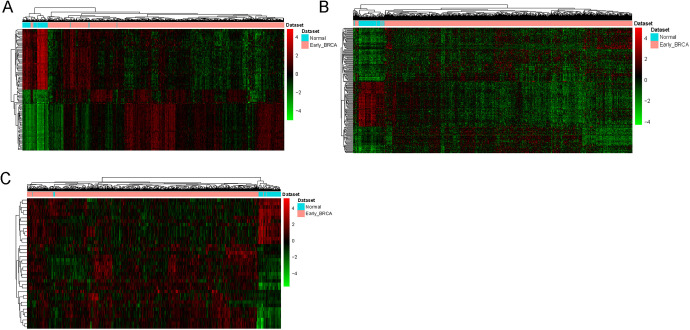
Based on the screening criteria of FDR < 0.05 and |logFC| > 2, a total of 1207 DEmRNAs (554 down-regulated and 653 up-regulated mRNAs), 194 DElncRNAs (69 down-regulated and 125 up-regulated lncRNAs) and 37 DEmiRNAs (13 down-regulated and 24 up-regulated lncRNAs) between early BC and normal tissue were obtained. Hierarchical clustering analysis of the top 100 DEmRNAs and all of DElncRNAs and DEmiRNAs were presented in Figure 1. The DEmRNAs, DElncRNAs and DEmiRNAs of top 20 was displayed in Table 3, Table 4 and Table 5, respectively.
Figure 1.
Hierarchical clustering analysis of top 100 DEmRNAs and all of DElncRNAs and DEmiRNAs between early BC and normal. A, DEmRNAs. B, DElncRNAs. C, DEmiRNAs. Row and column represented DEmRNAs/ DElncRNAs/DEmiRNAs and tissue samples, respectively. The color scale represented the expression levels.
Table 3.
DEmRNAs of Top 20.
| Symbol | log2FoldChange | P_value | FDR | Up/Down |
|---|---|---|---|---|
| COL10A1 | 7.451760998 | 0 | 0 | Up |
| MMP11 | 6.408056734 | 0 | 0 | Up |
| NEK2 | 4.272830104 | 2.08E-229 | 8.51E-226 | Up |
| COL11A1 | 6.023860777 | 4.18E-192 | 1.37E-188 | Up |
| PKMYT1 | 3.96029779 | 7.49E-183 | 1.75E-179 | Up |
| KIF4A | 3.809306443 | 3.26E-181 | 6.23E-178 | Up |
| PCLAF | 3.277756027 | 2.51E-167 | 3.42E-164 | Up |
| PLPP4 | 4.949945395 | 3.99E-165 | 4.66E-162 | Up |
| UBE2C | 4.251984569 | 1.70E-164 | 1.85E-161 | Up |
| CDC25C | 3.439530581 | 2.43E-164 | 2.49E-161 | Up |
| GPAM | −4.266675168 | 3.24E-245 | 1.77E-241 | Down |
| TNS1 | −3.074461745 | 7.99E-186 | 2.18E-182 | Down |
| LYVE1 | −4.993112065 | 3.42E-181 | 6.23E-178 | Down |
| MYOM1 | −3.5392834 | 2.64E-179 | 4.32E-176 | Down |
| FHL1 | −4.526644785 | 2.61E-172 | 3.88E-169 | Down |
| NPR1 | −3.608513492 | 4.87E-166 | 6.13E-163 | Down |
| CAV1 | −3.319891558 | 5.88E-163 | 5.66E-160 | Down |
| RDH5 | −4.22334086 | 2.17E-161 | 1.98E-158 | Down |
| KCNIP2 | −5.062212462 | 1.38E-158 | 1.13E-155 | Down |
| SIK2 | −2.42022422 | 6.11E-158 | 4.65E-155 | Down |
Table 4.
DElncRNAs of Top 20.
| Symbol | log2FoldChange | P_value | FDR | Up/Down |
|---|---|---|---|---|
| LINC01614 | 5.995905724 | 6.20E-226 | 3.07E-222 | Up |
| RP11-417E7.2 | 3.832234893 | 6.57E-106 | 1.08E-102 | Up |
| RP11-863P13.3 | 3.50860538 | 1.11E-99 | 1.10E-96 | Up |
| C6orf99 | 2.730129081 | 6.97E-88 | 5.74E-85 | Up |
| AC015849.16 | 3.774812665 | 3.50E-87 | 2.47E-84 | Up |
| FOXD3-AS1 | 4.6088989 | 1.21E-78 | 4.82E-76 | Up |
| LEF1-AS1 | 2.466854527 | 1.27E-78 | 4.82E-76 | Up |
| RP11-108L7.15 | 2.240957084 | 8.36E-74 | 2.43E-71 | Up |
| LINC01929 | 3.890605017 | 4.96E-72 | 1.07E-69 | Up |
| ATP2A1-AS1 | 2.506601274 | 5.12E-67 | 8.44E-65 | Up |
| LINC02202 | −3.071816654 | 1.34E-114 | 3.32E-111 | Down |
| RP11-736K20.5 | −3.033822808 | 3.17E-104 | 3.92E-101 | Down |
| LINC01537 | −3.381532243 | 4.39E-87 | 2.71E-84 | Down |
| RP11-159H22.2 | −2.88962056 | 6.72E-82 | 3.69E-79 | Down |
| TRHDE-AS1 | −5.287520605 | 8.18E-80 | 3.68E-77 | Down |
| ADAMTS9-AS2 | −3.072073602 | 4.69E-76 | 1.66E-73 | Down |
| AC004490.1 | −3.225524478 | 1.16E-74 | 3.81E-72 | Down |
| KCNIP2-AS1 | −2.070585058 | 4.42E-74 | 1.37E-71 | Down |
| MAGI2-AS3 | −2.059219606 | 4.29E-73 | 1.18E-70 | Down |
| RP1-28O10.1 | −3.911408204 | 1.58E-72 | 3.91E-70 | Down |
Table 5.
DEmiRNAs of Top 20.
| miRNA | log2FoldChange | P_value | FDR | Up/Down |
|---|---|---|---|---|
| hsa-miR-1307-5p | 3.382213613 | 1.17E-120 | 1.75E-118 | Up |
| hsa-miR-21-5p | 2.074458943 | 4.91E-119 | 5.50E-117 | Up |
| hsa-miR-96-5p | 3.315504674 | 6.73E-112 | 6.03E-110 | Up |
| hsa-miR-183-5p | 2.912921213 | 1.76E-111 | 1.31E-109 | Up |
| hsa-miR-429 | 2.655574649 | 1.73E-88 | 8.63E-87 | Up |
| hsa-miR-141-3p | 2.517668996 | 9.12E-88 | 4.09E-86 | Up |
| hsa-miR-21-3p | 2.088860648 | 2.32E-79 | 8.68E-78 | Up |
| hsa-miR-182-5p | 2.2928891 | 1.68E-70 | 5.38E-69 | Up |
| hsa-miR-210-3p | 3.12485003 | 1.06E-67 | 2.96E-66 | Up |
| hsa-miR-200a-3p | 2.141544563 | 4.73E-65 | 1.18E-63 | Up |
| hsa-miR-139-5p | −3.069452198 | 1.66E-138 | 7.45E-136 | Down |
| hsa-miR-486-5p | −4.578021253 | 1.23E-121 | 2.75E-119 | Down |
| hsa-miR-145-5p | −2.344284766 | 1.76E-109 | 1.13E-107 | Down |
| hsa-miR-139-3p | −3.275004431 | 4.55E-91 | 2.55E-89 | Down |
| hsa-miR-378a-5p | −2.449572202 | 1.43E-87 | 5.81E-86 | Down |
| hsa-miR-99a-5p | −2.154881414 | 1.96E-62 | 4.61E-61 | Down |
| hsa-miR-144-5p | −3.01600746 | 4.37E-62 | 9.79E-61 | Down |
| hsa-miR-451a | −3.195338761 | 1.88E-59 | 4.01E-58 | Down |
| hsa-miR-335-5p | −2.353723644 | 3.38E-58 | 6.88E-57 | Down |
| hsa-miR-551b-3p | −2.0469095 | 3.62E-38 | 2.84E-37 | Down |
Functional Annotation of All DEmRNA
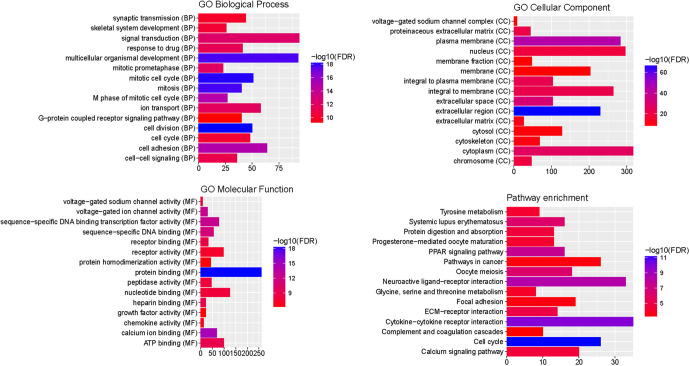
As shown in Figure 2, cell division (FDR = 6.21E-19), mitotic cell cycle (FDR = 8.03E-19) and protein binding (FDR = 5.15E-19) were significantly enriched GO terms. KEGG pathway results suggested that cell cycle (FDR = 4.07E-12), cytokine-cytokine receptor interaction (FDR = 1.18E-10), PPAR signaling pathway (FDR = 3.22E-08) and pathways in cancer (FDR = 0.000379408) were 4 significantly enriched pathways. Top 15 most significantly enriched GO and KEGG pathways of all DEmRNA were shown in Figure 2.
Figure 2.
The enrichment GO terms and KEGG pathways of DEmRNAs between early BC and normal. The x-axis shows −log FDR and y-axis shows GO terms and KEGG pathways.
Competing Endogenous RNA (DEmRNA–DEmiRNA–DElncRNA) Regulatory Network
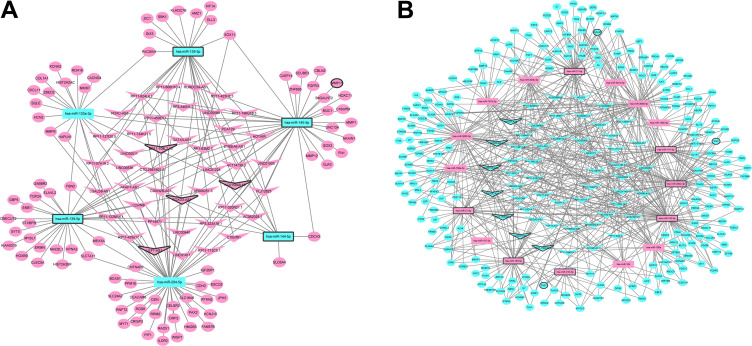
The DEmRNA-DEmiRNA-DElncRNA interaction network in early BC was consisted of 23 DEmiRNAs, 95 DElncRNAs and 309 DEmRNAs (Figure 3). Hsa-miR-182-5p (degree = 76), hsa-miR-3065-5p (degree = 65), hsa-miR-3065-3p (degree = 65), hsa-miR-21-5p (degree = 55), hsa-miR-204-5p (degree = 54), hsa-miR-200a-3p (degree = 51), hsa-miR-141-3p (degree = 49), hsa-miR-183-5p (degree = 44), hsa-miR-190b (degree = 37), hsa-miR-145-5p (degree = 37) were top 10 miRNAs with degree.
Figure 3.
DElncRNA-DEmiRNA-DEmRNA interaction network. The inverted triangles, rectangles and ellipses were represented the DElncRNAs, DEmiRNAs and DEmRNA, spectively. Red and green color represented up- and down-regulation, respectively. The black border indicates top 10 up and down, respectively.
Confirmation by qRT-PCR
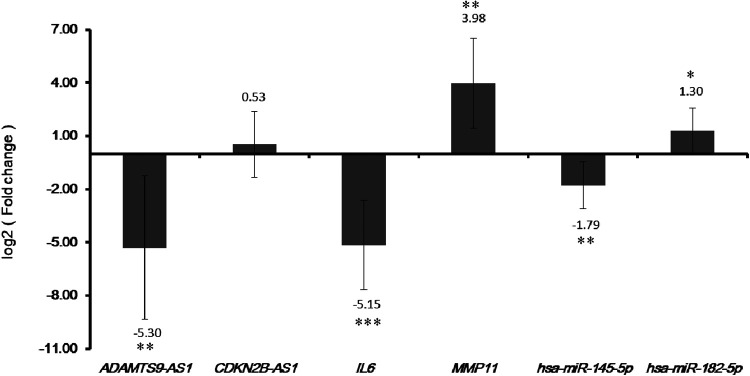
Two DEmRNAs (IL6 and MMP11), 2 DEmiRNAs (hsa-miR-145-5p and hsa-miR-182-5p) and 2 DElncRNAs (ADAMTS9-AS1 and CDKN2B-AS1) were selected to verify in qRT-PCR. Among them, IL-6 was a DEmRNA that was enriched in key pathways. MMP11 was top 20 DEmRNA in early BC. Hsa-miR-145-5p and hsa-miR-182-5p were top 20 DEmiRNA in early BC. ADAMTS9-AS1 and CDKN2B-AS1 were DElncRNA in early BC. Based on TCGA, ADAMTS9-AS1, IL6 and hsa-miR-145-5p were down-regulated while the other 3 genes (CDKN2B-AS1, MMP11 and hsa-miR-182-5p) were up-regulated in early BC compared to adjacent tissues. Based on PCR verification, we confirmed the results of TCGA prediction (Figure 4).
Figure 4.
Validation genes in early BC tissue by qRT-PCR. * P < 0.05, * * P < 0.01 and *** P < 0.001.
Validation in the GEO Dataset
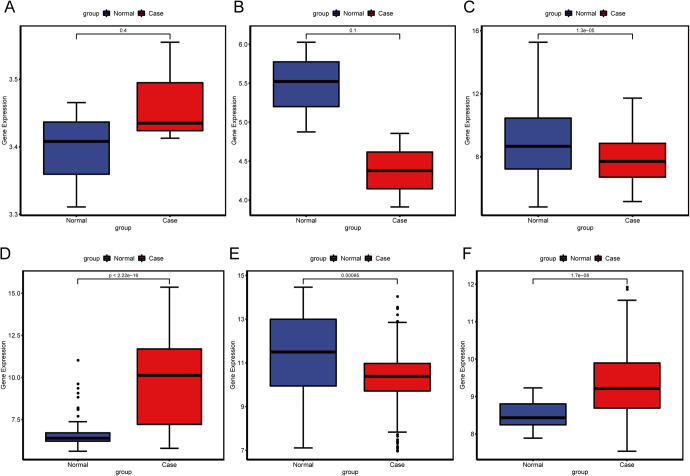
As displayed in Figure 5, ADAMTS9-AS1 was up-regulated and CDKN2B-AS1 was down-regulated, which was inconsistent with our PCR verification and TCGA integration results, partly due to sample size and selection bias. MMP11 and hsa-miR-182-5p were up-regulated while IL-6 and hsa-miR-145-5p were down-regulated in BC, which was consistent with our PCR verification and TCGA integration results, suggesting that the results were convincing.
Figure 5.
Validation in the GEO dataset. The x-axis shows healthy normal control (blue color) and BC (red color) groups and y-axis shows a log2 transformation to the intensities. A, ADAMTS9-AS1. B, CDKN2B-AS1. C, IL-6. D, MMP11. E, hsa-miR-145-5p. F, hsa-miR-182-5p.
ROC Curve Analysis
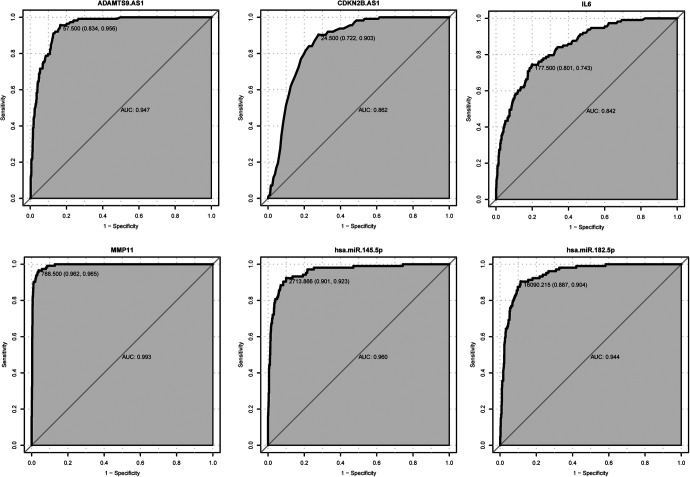
We assessed the diagnostic value of 2 DEmRNAs (IL-6 and MMP11), 2 DElncRNA (ADAMTS9-AS1 and CDKN2B-AS1) and 2 DEmiRNAs (hsa-miR-145-5p and hsa-miR-182-5p) in BC. The AUC of the ADAMTS9-AS1, CDKN2B-AS1, IL-6, MMP11, hsa-miR-145-5p and hsa-miR-182-5p were 0.947, 0.862, 0.842, 0.993, 0.960 and 0.944, and the specificity and sensitivity of the 6 biomarkers were 83.4% and 95.6%, 72.2% and 90.3%, 80.1% and 74.3%, 96.2% and 96.5%, 90.1% and 92.3%, and 88.7% and 90.4%, respectively (Figure 6). These results suggested that ADAMTS9-AS1, CDKN2B-AS1, IL-6, MMP11, hsa-miR-145-5p and hsa-miR-182-5p had diagnostic value in BC.
Figure 6.
ROC analysis. The AUC was analyzed to evaluate the performance of each DEmRNAs, DElncRNAs and DEmiRNAs. The x-axis indicated 1-specificity and y-axis indicated sensitivity.
Survival Analysis
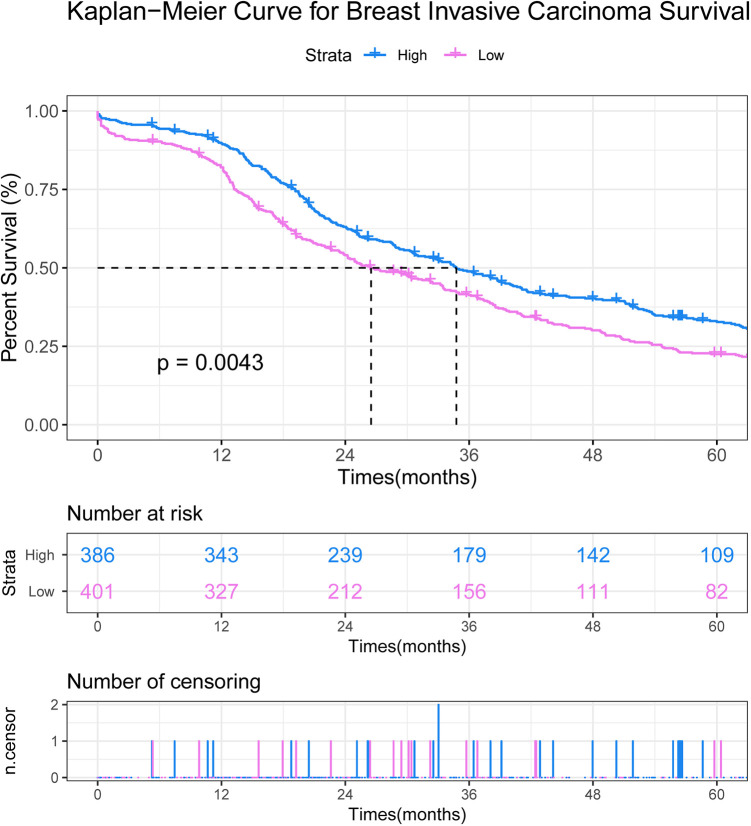
We assessed the prognostic value of 2 DEmRNAs (IL-6 and MMP11), 2 DElncRNA (ADAMTS9-AS1 and CDKN2B-AS1) and 2 DEmiRNAs (hsa-miR-145-5p and hsa-miR-182-5p) in BC. Among which, only IL-6 was associated with the survival of patients with BC (Figure 7).
Figure 7.
Prognostic value of IL-6 in BC. The x-axis shows times (months) and y-axis shows survival rate of patients with BC.
Discussion
BC is one of the most commonly diagnosed cancers in women, and, in most cases, it is diagnosed at later stage. Although great progress has been made in the treatment of BC, its mortality is still high. Therefore, the identification of potential biomarkers and the precise molecular mechanism of BC development have received increasing attention. It is urgently required to study ceRNA cross-talk across various cancer types.24
TCGA’s vast dataset provides us with a good opportunity to systematically evaluate ceRNA networks in cancer. Although more and more evidence prove the function of dysregulated mRNA, miRNA, and lncRNA in BC, there are few reports of systematically deciphering the mRNA-miRNA-lncRNAs network.25 Herein, we obtained early BC-specific lncRNAs, miRNAs, and mRNAs, and further built an ceRNA network based on TCGA dataset to study the underlying mechanisms of early BC. In addition, we retrieved related molecules from ceRNA networks, which might be new key potential prognostic and diagnostic targets for early BC. According to the TCGA dataset, we identified 194 DElncRNAs, 37 DEmiRNAs, and 1207 DEmRNAs between early BC and normal adjacent tissues. We also performed the functional annotation analysis to understand the function of DEmRNAs. KEGG pathway results of all DEmRNAs suggested that cell cycle, cytokine-cytokine receptor interaction, PPAR signaling pathway and pathways in cancer were 4 significantly enriched pathways.
Interleukin 6 (IL-6) plays a pivotal role in cell proliferation, differentiation and inflammatory pathways. IL-6 is one of the most widely studied immune factors on multiple cancers.26 Ahmad et al. have reported that IL-6 is associated with good prognosis in early stage invasive BC patients.27 Here, IL-6 was not only a diagnostic biomarkers, but also related to survival time. Based on the ceRNA networks, IL-6 was co-expressed with hsa-miR-182-5p. Zhang et al. have found that hsa-miR-182-5p is up-regulated in BC patients.28 Herein, our TCGA integration analysis showed that hsa-miR-182-5p was highly expressed in early BC. Based on the ceRNA networks, ADAMTS9-AS1 was co-expressed with hsa-miR-182-5p. Recent study has suggested that ADAMTS9-AS1 is associated with overall survival of BC patients.25 ROC results suggested that hsa-miR-182-5p and ADAMTS9-AS1 had good diagnostic value in BC. Our KEGG pathway results showed that IL-6 was significantly enriched in pathways of cytokine-cytokine receptor interaction and pathways in cancer. Hence, we speculated that IL-6-hsa-miR-182-5p-ADAMTS9-AS1 interactions may play a key role in the occurrence of BC by regulating pathway of cytokine-cytokine receptor interaction and pathways in cancer.
ADAMTS9-AS1 was also co-expressed with hsa-miR-21-5p. Pourteimoor et al. have indicated that hsa-miR-21-5p is associated with prognosis of BC patients.29 The ceRNA networks results suggested that the leukemia inhibitory factor receptor (LIFR) was co-expressed with hsa-miR-21-5p. In BC patients, LIFR expression is lower with bone metastases and is markedly and inversely correlated with patient outcome and hypoxia gene activity.30 In our study, LIFR was significantly enriched in pathways of cytokine-cytokine receptor interaction. Therefore, we speculated that LIFR-hsa-miR-21-5p-ADAMTS9-AS1 interactions may be involved the development of BC by regulating pathway of cytokine-cytokine receptor interaction.
Extracellular matrix degradation by matrix metalloproteinases is an important mechanism involved in tumor invasion and metastasis. Matrix metalloproteinases 1 (MMP1) has shown a strong correlation with influence the 5-years survival rate, suggesting it potential function in the breast carcinogenesis.31 Han et al. have found that MMP11 is a novel prognostic factors in BC.32 Linc01561 inhibition suppresses the proliferation and promotes the apoptosis in breast cancer cells via up-regulating expression of hsa-miR-145-5p and down-regulating expression of MMP11.33 Based on the ceRNA networks, hsa-miR-145-5p was co-expressed with CDKN2B-AS1. The expression of CDKN2B-AS1 is up-regulated in breast cells, suggesting that CDKN2B-AS1 may involve the development of BC.34 In this study, our TCGA integration analysis showed that CDKN2B-AS1 was highly expressed in early BC. Our KEGG pathway results showed that MMP1 was significantly enriched in PPAR signaling pathway and pathways in cancer. ROC results suggested that MMP11, hsa-miR-145-5p and CDKN2B-AS1 had good diagnostic value in BC. Therefore, we speculated that MMP1/MMP11-hsa-miR-145-5p-CDKN2B-AS1 interactions may play a pivotal role in the occurrence of BC by regulating PPAR signaling pathway and pathways in cancer.
Conclusions
We identified DEmiRNAs, DElncRNAs, and DEmRNAs by bioinformatics analysis based on data from TCGA. Then, we successfully constructed the ceRNA network to uncover the unknown DEmiRNAs, DElncRNAs, and DEmRNAs in BC. MMP1, MMP11, ADAMTS9-AS1, CDKN2B-AS1, hsa-miR-145-5p and hsa-miR-182-5p had good diagnostic value for BC. These observations help to a more comprehensive understanding of ceRNA network and provide novel insight into better deciphering of ceRNA network in BC and potential biomarkers for therapeutic. However, there are limitations to our study. The sample size for qRT-PCR confirmation was small and large numbers of early BC samples are needed for further research. In addition, biological functions of key DElncRNAs, DEmiRNAs and DEmRNAs in early BC were not studied. Thence, in vivo and in vitro experiments are necessary to uncover the biological functions of key DElncRNAs, DEmiRNA and DEmRNAs of early BC in subsequent studies.
Abbreviations
- breast cancer
(BC)
- competing endogenous RNA
(ceRNA)
- microRNAs
(miRNAs)
- long non-coding RNAs
(lncRNAs)
- The Cancer Genome Atlas
(TCGA)
- The differentially expressed lncRNAs
(DElncRNAs)
- The differentially expressed miRNAs
(DEmiRNAs)
- The differentially expressed mRNAs
(DEmRNAs)
- Gene Ontology
(GO)
- Kyoto Encyclopedia of Genes and Genomes
(KEGG)
- Gene Expression Omnibus
(GEO)
- Receiver operating characteristic
(ROC)
- leukemia inhibitory factor receptor
(LIFR)
- Matrix metalloproteinases
1(MMP1).
Footnotes
Authors’ Note: Zhong-Bing Luo and Gui-E Lai contributed equally to this work and should be considered as co-first authors. The dataset supporting the conclusions of this article is included within the article. ZL and FL contributed to the conception of the study. GL and TJ contributed the materials and performed the experiment. CC and TP performed the data analyses. ZL and FL contributed significantly in writing the manuscript. All authors read and approved the final manuscript. All patients provided written informed consent prior to enrollment in the study. The subjects gave written informed consent for the publication of any associated data and accompanying images. This study was approved by the ethical committee of the Gannan Medical College (approval no. 2019062).
Declaration of Conflicting Interests: The author(s) declared no potential conflicts of interest with respect to the research, authorship, and/or publication of this article.
Funding: The author(s) received no financial support for the research, authorship, and/or publication of this article.
ORCID iD: Zhong-Bing Luo  https://orcid.org/0000-0002-5453-6463
References
- 1. Siegel RL, Miller KD, Jemal A. Cancer statistics, 2016. CA Cancer J Clin. 2016;66(1):7–30. [DOI] [PubMed] [Google Scholar]
- 2. Cech TR, Steitz JA. The noncoding RNA revolution-trashing old rules to forge new ones. Cell. 2014;157(1):77–94. [DOI] [PubMed] [Google Scholar]
- 3. Hayes EL, Lewis-Wambi JS. Mechanisms of endocrine resistance in breast cancer: an overview of the proposed roles of noncoding RNA. Breast Cancer Res. 2015;17:40. [DOI] [PMC free article] [PubMed] [Google Scholar]
- 4. Huarte M. The emerging role of lncRNAs in cancer. Nat Med. 2015;21(11):1253–1261. [DOI] [PubMed] [Google Scholar]
- 5. Lauressergues D, Couzigou JM, Clemente HS, et al. Primary transcripts of microRNAs encode regulatory peptides. Nature. 2015;520(7545):90–93. [DOI] [PubMed] [Google Scholar]
- 6. Arun G, Diermeier S, Akerman M, et al. Differentiation of mammary tumors and reduction in metastasis upon Malat1 lncRNA loss. Genes Dev. 2016;30(1):34–51. [DOI] [PMC free article] [PubMed] [Google Scholar]
- 7. Ballantyne MD, McDonald RA, Baker AH lncRNA/microRNA interactions in the vasculature. Clin Pharmacol Ther. 2016;99(5):494–501. [DOI] [PMC free article] [PubMed] [Google Scholar]
- 8. Salmena L, Poliseno L, Tay Y, Kats L, Pandolfi PP. A ceRNA hypothesis: the Rosetta stone of a hidden RNA language? Cell. 2011;146(3):353–358. [DOI] [PMC free article] [PubMed] [Google Scholar]
- 9. Cheng DL, Xiang YY, Ji LJ, Lu XJ. Competing endogenous RNA interplay in cancer: mechanism, methodology, and perspectives. Tumour Biol. 2015;36(2):479–488. [DOI] [PubMed] [Google Scholar]
- 10. Sen R, Ghosal S, Das S, Balti S, Chakrabarti J. Competing endogenous RNA: the key to posttranscriptional regulation. Scientific World J. 2014;2014:896206. [DOI] [PMC free article] [PubMed] [Google Scholar]
- 11. Qi X, Zhang DH, Wu N, Xiao JH, Wang X, Ma W. ceRNA in cancer: possible functions and clinical implications. J Med Genet. 2015;52(10):710–718. [DOI] [PubMed] [Google Scholar]
- 12. Wang L, Feng Z, Wang X, Wang X, Zhang X. DEGseq: an R package for identifying differentially expressed genes from RNA-seq data. Bioinformatics (Oxford, England). 2010;26(1):136–138. [DOI] [PubMed] [Google Scholar]
- 13. Love MI, Huber W, Anders S. Moderated estimation of fold change and dispersion for RNA-seq data with DESeq2. Genome Biol. 2014;15(12):550. [DOI] [PMC free article] [PubMed] [Google Scholar]
- 14. Tabas-Madrid D, Nogales-Cadenas R, Pascual-Montano A. GeneCodis3: a non-redundant and modular enrichment analysis tool for functional genomics. Nucleic Acids Res. 2012;40(Web Server issue):W478–483. [DOI] [PMC free article] [PubMed] [Google Scholar]
- 15. Chen Y, Mao ZD, Shi YJ, et al. Comprehensive analysis of miRNA-mRNA-lncRNA networks in severe asthma. Epigenomics. 2019;11(2):115–131. [DOI] [PubMed] [Google Scholar]
- 16. Miranda KC, Huynh T, Tay Y, et al. A pattern-based method for the identification of microRNA binding sites and their corresponding heteroduplexes. Cell. 2006;126(6):1203–1217. [DOI] [PubMed] [Google Scholar]
- 17. John B, Enright AJ, Aravin A, Tuschl T, Sander C, Marks DS. Human microRNA targets. PLoS Biol. 2004;2(11):e363. [DOI] [PMC free article] [PubMed] [Google Scholar]
- 18. Wong N, Wang X miRDB: an online resource for microRNA target prediction and functional annotations. Nucleic Acids Res. 2015;43(Database issue):D146–152. [DOI] [PMC free article] [PubMed] [Google Scholar]
- 19. Sticht C, De La Torre C, Parveen A, Gretz N . miRWalk: an online resource for prediction of microRNA binding sites. PLoS One. 2018;13(10):e0206239. [DOI] [PMC free article] [PubMed] [Google Scholar]
- 20. Krek A, Grün D, Poy MN, et al. Combinatorial microRNA target predictions. Nat Genet. 2005;37(5):495–500. [DOI] [PubMed] [Google Scholar]
- 21. Lewis BP, Burge CB, Bartel DP. Conserved seed pairing, often flanked by adenosines, indicates that thousands of human genes are microRNA targets. Cell. 2005;120(1):15–20. [DOI] [PubMed] [Google Scholar]
- 22. Shannon P, Markiel A, Ozier O, et al. Cytoscape: A Software Environment for Integrated Models of Biomolecular Interaction Networks. Routledge; 2003. [DOI] [PMC free article] [PubMed] [Google Scholar]
- 23. Su G, Morris JH, Demchak B, Bader GD. Biological network exploration with Cytoscape 3. Curr Protoc Bioinformatics. 2014;47:8.13.11–24. [DOI] [PMC free article] [PubMed] [Google Scholar]
- 24. Denzler R, Agarwal V, Stefano J, Bartel DP, Stoffel M. Assessing the ceRNA hypothesis with quantitative measurements of miRNA and target abundance. Mol Cell. 2014;54(5):766–776. [DOI] [PMC free article] [PubMed] [Google Scholar]
- 25. Fan CN, Ma L, Liu N. Systematic analysis of lncRNA-miRNA-mRNA competing endogenous RNA network identifies four-lncRNA signature as a prognostic biomarker for breast cancer. J Transl Med. 2018;16(1):264. [DOI] [PMC free article] [PubMed] [Google Scholar]
- 26. Cordoba EE, Lacunza E, Abba MC, Fernandez E, Guerci AM. Single nucleotide polymorphisms in ATM, TNF-alpha and IL6 genes and risk of radiotoxicity in breast cancer patients. Mutat Res. 2018;836(Pt B):84–89. [DOI] [PubMed] [Google Scholar]
- 27. Ahmad N, Ammar A, Storr SJ, et al. IL-6 and IL-10 are associated with good prognosis in early stage invasive breast cancer patients. Cancer Immunol Immunother. 2018;67(4):537–549. [DOI] [PMC free article] [PubMed] [Google Scholar]
- 28. Zhang K, Wang YW, Wang YY, et al. Identification of microRNA biomarkers in the blood of breast cancer patients based on microRNA profiling. Gene. 2017;619:10–20. [DOI] [PubMed] [Google Scholar]
- 29. Pourteimoor V, Paryan M, Mohammadi-Yeganeh S. MicroRNA as a systemic intervention in the specific breast cancer subtypes with C-MYC impacts; introducing subtype-based appraisal tool. J Cell Physiol. 2018;233(8):5655–5669. [DOI] [PubMed] [Google Scholar]
- 30. Johnson RW, Finger EC, Olcina MM, et al. Induction of LIFR confers a dormancy phenotype in breast cancer cells disseminated to the bone marrow. Nat Cell Biol. 2016;18(10):1078–1089. [DOI] [PMC free article] [PubMed] [Google Scholar]
- 31. Padala C, Tupurani MA, Puranam K, et al. Synergistic effect of collagenase-1 (MMP1), stromelysin-1 (MMP3) and gelatinase-B (MMP9) gene polymorphisms in breast cancer. PLoS One. 2017;12(9):e0184448. [DOI] [PMC free article] [PubMed] [Google Scholar]
- 32. Han J, Choi YL, Kim H, et al. MMP11 and CD2 as novel prognostic factors in hormone receptor-negative, HER2-positive breast cancer. Breast Cancer Res Treat. 2017;164(1):41–56. [DOI] [PMC free article] [PubMed] [Google Scholar]
- 33. Jiang R, Zhao C, Gao B, Xu J, Song W, Shi P. Mixomics analysis of breast cancer: long non-coding RNA linc01561 acts as ceRNA involved in the progression of breast cancer. Int J Biochem Cell Biol. 2018;102:1–9. [DOI] [PubMed] [Google Scholar]
- 34. Tripathi R, Soni A, Varadwaj PK. Integrated analysis of dysregulated lncRNA expression in breast cancer cell identified by RNA-seq study. Noncoding RNA Res. 2016;1(1):35–42. [DOI] [PMC free article] [PubMed] [Google Scholar]


