Abstract
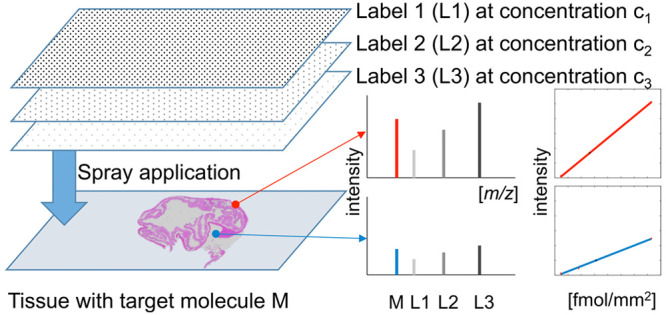
In quantitative mass spectrometry imaging (MSI), the gold standard adds a single structural homologue of the target compound at a known concentration to the sample. This internal standard enables to map the detected intensity of the target molecule against an external calibration curve. This approach, however, ignores local noise levels and disproportional ion suppression effects, which might depend on the concentration of the target compound. To overcome these issues, we propose a novel approach that applies several isotopically labeled versions, each at a different concentration, to the sample. This allows creating individual internal calibration curves for every MSI pixel. As proof of principle, we have quantified an endogenous peptide of histone H4 by matrix-assisted laser desorption/ionization-Q-MSI (MALDI-Q-MSI), using a mixture of three isotopically labeled versions. The usage of a fourth label allowed us to compare the gold standard to our multilabel approach. We observed substantial heterogeneity in ion suppression across the tissue, which disclosed itself as varying slopes in the per-pixel regression analyses. These slopes were histology-dependent and differed from each other by up to a factor of 4. The results were validated by liquid chromatography–mass spectrometry (LC-MS), exhibiting a high agreement between LC-MS and MALDI-Q-MSI (Pearson correlation r = 0.87). A comparison between the multilabel and single-label approaches revealed a higher accuracy for the multilabel method when the local target compound concentration differed too much from the concentration of the single label. In conclusion, we show that the multilabel approach provides superior quantitation compared to a single-label approach, in case the target compound is inhomogeneously distributed at a wide concentration range in the tissue.
Introduction
Mass spectrometry imaging (MSI) is an analytical technique that enables the label-free analysis of the spatial distribution of molecules within biological tissue sections.1 MSI is widely used in biomedical research as a discovery tool since it can directly access hundreds to thousands of endogenous molecules on tissue.2,3 In contrast, MSI is commonly used in pharmaceutical research and industry to determine the place of accumulation and metabolization of drugs in tissue.4 In that context, the ability to absolutely and precisely quantify molecular abundances at a single-pixel level is of utmost interest.
Quantitative MSI (Q-MSI) has been one of the main continuous efforts and an active area of research in the MSI community over the last decade.5,6 Although different ionization methods are employed in MSI, matrix-assisted laser desorption/ionization-MSI (MALDI-MSI) remains the most widely used technique.7,8 Thereby, MALDI-Q-MSI has to deal with fundamental aspects related to the MALDI process involving analyte extraction from the tissue/cells, crystallization, desorption, and ionization.9,10 All of these steps are influenced by the local chemical and biological environment, which ultimately causes a variation in the detected ion intensity of the target molecule, referred to as matrix effect.
Several strategies were developed to address the issues of regional matrix effects, of which the on-control-tissue procedure remains the most common.11−15 This technique uses a structural analogue or a stable isotope of the compound of interest, which is applied homogeneously across the tissue before the MSI experiment. Furthermore, spotting a serial dilution of this internal standard on a blank tissue adjacent to the target section creates an external calibration curve. After the experiment, the signal of this internal standard is used to normalize the signal intensity of the target compound in the tissue and the calibration curve. After normalization, the quantitation of the compound is achieved by mapping the normalized intensities of the target molecule to the normalized external calibration curve.16−18 However, this approach ignores local noise levels and disproportional changes of ion suppression effects depending on the concentration of the target compound. In addition, the mapping to an external calibration curve can lead to errors in local quantitative information since the spots of the external calibration series have very likely undergone a different ionization suppression and matrix-assisted desorption extraction process than most of the pixels in the target tissue, especially when the tissues are histologically heterogeneous.
For this reason, we propose a novel quantification method that creates an internal calibration curve for every pixel in the target tissue and therefore accounts for local ionization biases. This is achieved by spraying a minimum of three isotopically labeled versions of the target compound, each at a different concentration, onto the tissue. With high-mass resolution MSI instrumentation, this enables the creation of an internal calibration curve on every measured position on the very same tissue section.
We will demonstrate, using an endogenous peptide of histone H4 as the target compound, that this will provide a more accurate way of quantitation by taking into account the regional ion suppression as well as tissue heterogeneity.
Experimental Section
Chemicals and Reagents
All solvents, if not stated otherwise, were purchased from Biosolve (France). The four isotopically labeled versions of the histone H4 peptide (H-DNIQGITKPAIR-OH, m/z = 1325.7535) were synthesized by Pepscan Presto (The Netherlands) as follows: label L1: H-DNIQGITKPAIR*-OH (Δm +10 Da), m/z = 1335.7618; label L2: H-DNIQGITKPAI*R-OH (Δm +7 Da), m/z = 1332.7707; label L3: H-DNI*QGI*TKPAI*R-OH (Δm +21 Da), m/z = 1346.8050; and label L4: H-DNIQGI*TKPAI*R*-OH (Δm +24 Da), m/z = 1349.7962. The mentioned theoretical m/z values are based on z = 1 through a single protonation.
Tissue Preparation and On-Tissue Enzymatic Digestion
Colonic tissue from a pork was harvested in accordance with the Codes of Practice and local regulations in the Central Animal Testing Facilities (CPV) and the University of Maastricht based on the working protocol of Prof. Dr. Nicole D. Bouvy approved by the Animal Welfare Body (AWB) (Instantie voor Dierenwelzijn IvD) under the project license number PV 2017-021 AVD1070020174166. The tissue was snap-frozen in liquid nitrogen and stored at −80 °C. Sections (12 μm) were obtained from the sample on a cryostat and thaw-mounted onto conductive ITO slides. Prior to trypsin application, the tissue sections were dried in a desiccator for 10 min at room temperature.
The tissue sections were then washed three times in 100% ethanol (2 min each) followed by two rinses in water (5 min each). To denature the proteins before trypsin application, antigen retrieval was performed with citric acid 10 mM, pH 6.0 at 121 °C for 20 min using the Antigen Retriever 2100 (Aptum Biologics, U.K.). This was followed by two 1 min washes in deionized water. After drying the samples, on-tissue digestion was performed by applying 15 layers of 20 μg/mL porcine trypsin (Sigma-Aldrich, The Netherlands) dissolved in deionized water with a SunCollect sprayer (SunChrom, Germany) at a constant flow rate of 10 μL/min, track spacing of 1 mm, nozzle height of 25 mm, and a nozzle speed of 900 mm/min. Samples were then incubated at 37 °C overnight in a controlled digestion environment using the SunDigest incubation chamber (SunChrom, Germany).
Application of Labels and Quantitative Calculations
The four standards were stored at −80 °C in 5% acetonitrile at a concentration of 5 pmol/μL. When spotting, 0.5 μL was applied and the spot area was empirically determined to be on average 3.4 mm2 in size. On one tissue section, no labels were applied at all, which served as the control sample. On another section, a dilution series of label L1 at concentrations of 120, 62, 31, 15, 77, and 38 fmol/mm2 was deposited as spots for the estimation of the concentration range of the target peptide. A second dilution series of label L1 was also prepared at concentrations of 370, 180, 92, 46, 23, 15, and 10 fmol/mm2 and spotted onto a third sample for a comparison between the single-label and the multilabel quantitation methods. Labels L1, L2, and, L3 were mixed in the ratios 1:2, 1:8, and 1:32 and applied onto a fourth tissue sample using the SunCollect (Sunchrom, Germany). Label 4 was diluted by a factor of 8 and separately applied using the same parameters onto both latter samples. To express the concentration in fmol/mm2, we based our calculations on the spraying parameters. These included a fixed area of spraying set as 35 × 30 mm2, a spraying velocity of 900 mm/min, a flow rate of 10 μL/min, a total of 5 layers, and a line spacing of 2 mm. Therefore, 15 lines were sprayed per layer with a spraying time of 0.039 min per line. The time per layer was then 0.583 min and 0.031 min for the horizontal and vertical dimensions, respectively, resulting in a total spraying time of 0.614 min per layer. Since the flow rate was 10 μL/min, a volume of 6.14 μL was applied per layer resulting in a total deposited volume of 30.72 μL. The deposited absolute amounts of labels L1, L2, and L3 were therefore 76 806, 19 201, and 4800 fmol, respectively. Finally, the concentrations in fmol/mm2 were calculated by dividing these amounts by the spraying area. This resulted in concentrations of 73.2, 18.3, and 4.6 fmol/mm2 for labels L1, L2, and L3, respectively. Following the same calculations for a spraying area of 65 × 30 mm2 (both tissues), the concentration of label L4 was similar to the one of label L2, namely 17.9 fmol/mm2. Onto a fifth tissue section, labels L1, L2, and L3 were applied as described before for further liquid chromatography–mass spectrometry (LC-MS) quantitation measurements.
Matrix Application and MSI Experiments
2,5-Dihydroxybenzoic acid matrix (50 mg/mL) in 50% acetonitrile and 0.2% trifluoroacetic acid was sprayed in three layers using an HTX-TM sprayer (Chapel Hill, NC) onto the tissue sections at 30 °C with a constant flow rate of 0.1 mL/min, a speed of 1200 mm/min, and a track spacing of 1 mm. The tissue for the LC-MS measurements was sprayed at 50 °C.
MSI data were acquired on a Q-Exactive Orbitrap mass spectrometer (Thermo Fisher Scientific, Germany) equipped with a MALDI source (Spectroglyph LLC, WA). The experiments were performed in positive ion mode at 100 μm spatial resolution within a mass range of m/z 1000–1500. The spectral resolution was set to 240 000 FWHM at m/z 400. MSI data were then exported to the imzML format using Image Insight software (Spectroglyph LLC, WA).
MS/MS measurement of the histone H4 peptide was performed within a mass range of m/z 100–1500 with a collision energy of 35 eV and a 0.5 Da isolation window with an average of 25 scans.
Histological Staining
After MSI experiments, the matrix was removed with 70% ethanol and the sections were stained with hematoxylin and eosin (H&E) using a standard protocol. The tissues were scanned with an M8 microscope slide scanner (Precipoint, Germany).
Data Analysis
The Thermo Fisher raw data were aligned to the corresponding position files in Image Insight software (Spectroglyph, LLC, WA) and exported from there as imzML files. MSI data were then imported into MATLAB R2018b (MathWorks, Natick, MA) for data analysis. The Matlab code is provided in the online Supporting Information. Briefly, after importation as imzML, null spectra and 0.1% of pixels with the highest TIC values were removed. Then, signals belonging to histone H4, labels L1, L2, L3, and L4 were selected using the maximum intensity within a m/z window of ±15 ppm. Only pixels were considered for linear regression if all relevant signals of histone H4, label L1, label L2, and label L3 were detected. For the cross-validation of the concentration prediction performance, outliers were removed using the isoutlier function in Matlab based on the median absolute deviations (default configuration).
LC-MS Experiments
Sample preparation, LC-MS instrumentation, and data analysis are described in the Supporting Information Method 1.
Results and Discussion
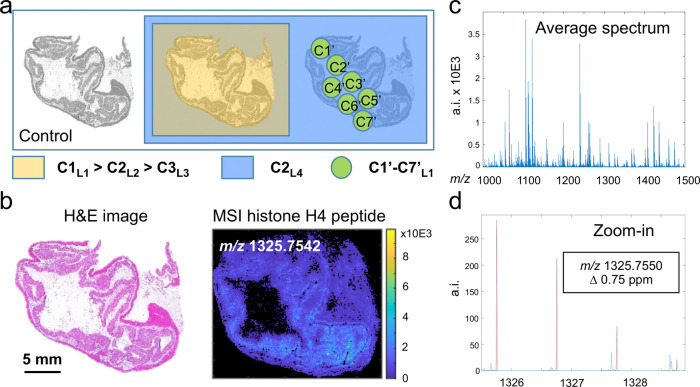
In this study, we propose a novel per-pixel quantitation method for MALDI quantitative mass spectrometry imaging (MALDI-Q-MSI) based on the use of several structural homologues of the target compound, which are applied in different concentrations on the target sample. Due to the ease of label synthesis and its ubiquity, we decided to quantify and therefore create three stable isotopic versions (L1, L2, and L3) of a particular endogenous peptide of the protein histone H4. For a comparison with the state-of-the-art single-label method, we also spotted a dilution series of label L1 onto an adjacent tissue section placed next to the target tissue on the same slide and sprayed a fourth label (L4) on both tissue sections for the purpose of normalization. This resulted in the experimental setup depicted in Figure 1a.
Figure 1.
Experimental setup and confirmation of the molecular identity of the target compound. Three sections of the study tissue were placed on a slide. One served as control, one was sprayed with three differently labeled versions (L1, L2, and L3) of the target compound, each at a different concentration (C1–C3), and a third tissue section was spotted with a seven-level (C1′–C7′) dilution series of L4. Finally, a fourth label (L4) was applied at the same concentration as L2 (C2) on both adjacent tissue sections for normalization purposes. The tissue studied is a pig colon tissue of which a hematoxylin and eosin (H&E) staining is shown in (b, left) and the MALDI-MSI image of the target histone H4 peptide is shown in (b, right). The identification of the target peptide was performed on tissue using high-mass accuracy delivered by a Q-exactive Orbitrap mass spectrometer with a mass error of 0.75 ppm (c), by a comparison of the observed and the expected isotopic patterns (d), and MS/MS experiments (Supporting Information Figure 1).
Confirmation of the Identity of the Target Peptide
In MSI, on-tissue trypsin digestion enables the detection of one of the peptides of histone H4 (DNIQGITKPAIR, M = 1324.7463) as already reported by Groseclose et al.19 In our tissue and MSI dataset of study (pig colon, Figure 1b), we corroborated the detection of the molecular ion [M + H]+ of histone H4 by high-mass accuracy at m/z 1325.7550 (Δ = 0.75 ppm, Figure 1c), by congruence of the theoretical and the observed isotopic patterns (Figure 1d), and by on-tissue MS/MS measurements (Supporting Information, Figure 1). Since this peptide is unique to histone H4, it can be seen as a representative for the entire histone H4 protein.
Confirmation of m/z Channel-Exclusivity of Histone H4 Labels
Our method consists of applying several internal standards to the tissue. This harbors the danger that the signals of these labeled standards overlap with the signals from endogenous molecules. To confirm the exclusivity of the respective m/z channels for the applied labeled peptides, two tissue sections on one glass slide were simultaneously digested. Afterward, one section was sprayed with the four isotope labels (L1 at 73.2 fmol/mm2, L2 and L4 at 18.3 fmol/mm2, and L3 at 4.6 fmol/mm2) before matrix application and MSI measurements. Skyline spectra (a.k.a. maximum-based spectra) were created for the labeled and the control tissues and compared, showing no endogenous peak interferences with the internal standards across all pixels of the samples (Figure 2a–e).
Figure 2.
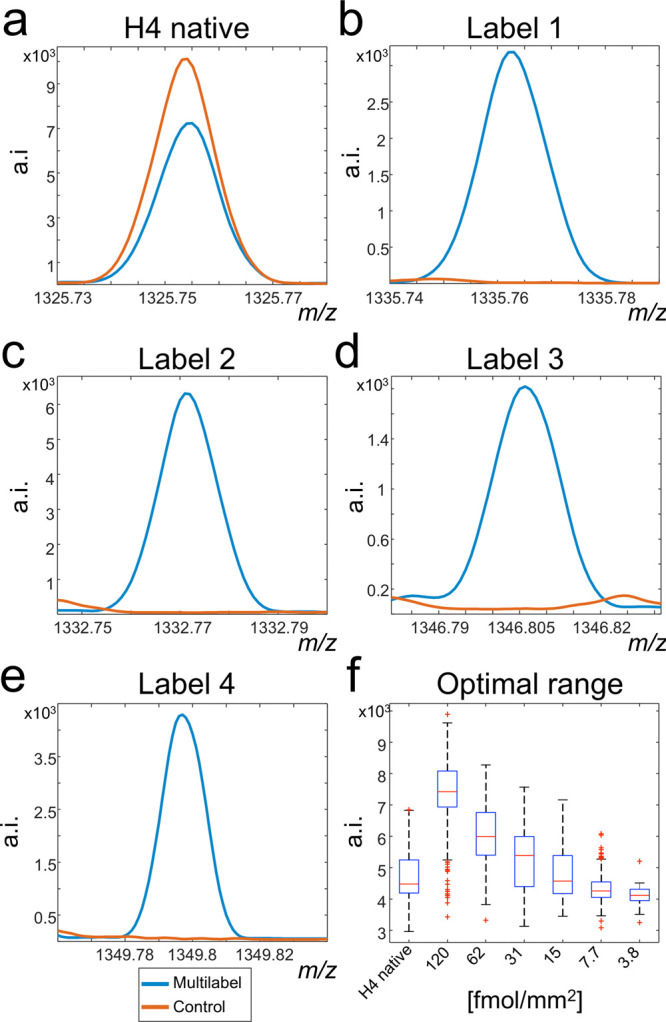
Signal exclusivity of isotopically labeled histone H4 peptides. Two tissue sections underwent tryptic digestion. One was afterward sprayed with four different versions of the target molecule, and the second acted as control. The presence of the target histone H4 peptide at m/z 1325.7535 was confirmed in both control and multilabel sprayed experiments (a). Comparison of the skyline spectra between control and multilabel tissues exhibited the evidence for the tissue-wide exclusivity of the respective [M + H]+ mass channels for the labels L1–L4 (b–e). In another experiment, a concentration range of label L1 was spotted onto another tryptic digested tissue to estimate the concentration range of the native histone H4 peptide (f). This enabled to determine the concentrations 62, 15, and 3.8 fmol/mm2 to best cover the mass range of the target histone H4 peptide.
Determination of Concentration Range of Histone H4
One crucial step in the proposed approach is to predetermine the abundance range of the native histone H4 peptide on tissue by MSI. This is to ensure that the intensities of the target peptide are always within the linearity of the calibration curve. Therefore, we deposited a dilution series (120, 62, 31, 15, 7.7, and 3.8 fmol/mm2) of label L1 (H-DNIQGITKPAIR*-OH, Δm +10 Da) on tissue. The concentrations were expressed as fmol/mm2 after gauging the average size of a spot from the detected signal in the MSI experiments (data not shown). The intensities for each of the individual dilutions together with the intensities of the native histone H4 peptide are shown in Figure 2f. This experiment enabled to choose those three concentrations (62, 15, and 3.8 fmol/mm2) that mostly tightly covered the complete concentration range of the target peptide in the tissue.
Multilabel Per-Pixel Quantitation
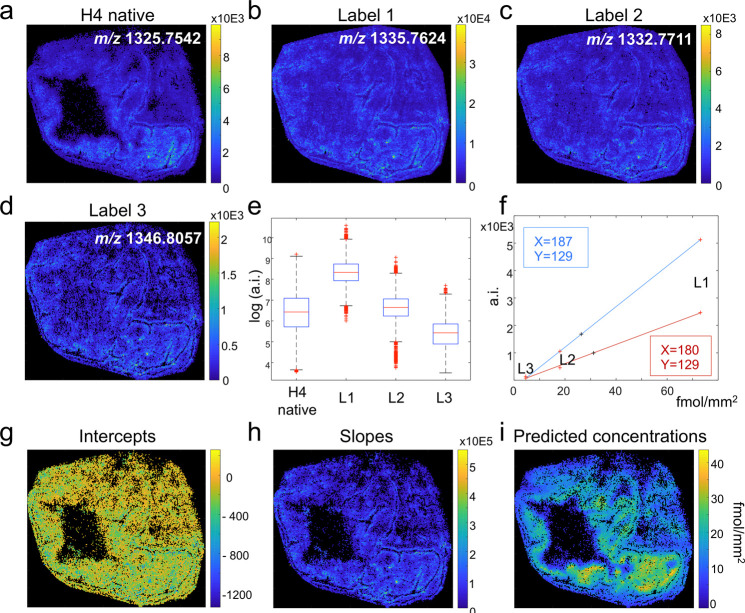
Using the previous experiments as orientation, labels L1, L2, and L3 were sprayed in three different concentrations, 73.2, 18.3, and 4.6 fmol/mm2 respectively, on another tissue section. Figure 3a–d show the ion spatial distributions of the tryptic peptide of the endogenous histone H4 (m/z 1325.7542) and the exogenous peptides belonging to labels L1 (m/z 1335.7624), L2 (m/z 1332.7711), and L3 (m/z 1346.8057).
Figure 3.
Multilabel approach to quantify the target endogenous peptide of histone H4 by mass spectrometry imaging (MSI). A pig colon tissue was tryptically digested and sprayed with the labels L1 (m/z 1335.7624), L2 (m/z 1332.7711), and L3 (m/z 1346.8057) at concentrations 73.2, 18.3, and 4.6 fmol/mm2. The molecular images of the native H4 peptide and the labels L1–L4 delivered by MALDI-MSI are shown in (a), (b), (c), and (d), respectively. The three labels sprayed in previously optimized concentrations (Figure 2f) enabled to cover the whole intensity range of the target histone H4 peptide (e). These labels enabled the creation of internal calibration curves for every individual pixel of which two examples are shown for two different pixels with their X and Y coordinates in red and blue (f). Visualizing each pixel’s individual intercept (g) and regression slope (h) revealed their correlation to the inherent morphological features of the tissue. Finally, the absolute concentrations of peptide histone H4 were calculated and mapped for every individual pixel (i).
The detection and identity of the isotope labels L1, L2, and L3 was validated using high-mass accuracy with mass deviations of 0.22, 0.30, and 0.52 ppm, respectively. Using a different concentration for each of the three labeled peptides allowed to fully cover the signal intensity range of the target peptide (Figure 3e).
Pixels in which all three labels could be detected thus enabled to create a local and per-pixel internal concentration curve using linear regression. Examples of such pixel-specific concentration curves are shown in Figure 3f, which allow to map the local target peptide intensity to its respective concentration. The regression analysis of our method provided individual regression intercepts (Figure 3g), slopes (Figure 3h), and R2 values for every pixel, which took values from 0.92 to 1.00 (Supporting Information, Figure 2). Fluctuations in the slopes of the regression models were observed to correlate with different histological features of the tissue, which reveal different degrees of regional ion suppression effects (Figure 3h). Similar to previous studies,10,20 this gives additional evidence for the existence of different local ionization biases, which distort the interpretation of signal intensities but are accounted for by our method. In contrast, the intercepts—usually representing the noise level—were homogeneous across the tissue (Figure 3g). The intercepts therefore also represent the theoretical minimum detectable concentrations, which were calculated to be between 0 and 5 fmol/mm2 (Supporting Information, Figure 3).
Finally, absolute concentrations were calculated by mapping the intensity of the detected H4 signal to the internal per-pixel calibration curve for all individual pixels (Figure 3i).
Comparison with the Single-Label Method
Several quantitative MALDI-Q-MSI methodologies have been developed to quantify molecules within tissue sections. The recent state-of-the-art quantitation approach consists of depositing a dilution series of a structural analogue or a stable isotope version of the target endogenous compound on a control tissue adjacent to the target sample enabling the establishment of a calibration curve. Then, the detected intensities of the target molecule and the calibrants are normalized to a second internal standard, which has been applied to both samples.12
From a theoretical point of view, this method suffers from two disadvantages: first, a calibration curve is deposited on a consecutive section resulting in uncomparable local desorption and ionization efficiencies. This could lead to a variation in the signal response influencing the quantitative calculations. Second, the normalization using the label on the target tissue works with a proportional slope and no intercept, which does not reflect the potentially nonlinear dynamics of ion suppression across the concentration range of the target compound.
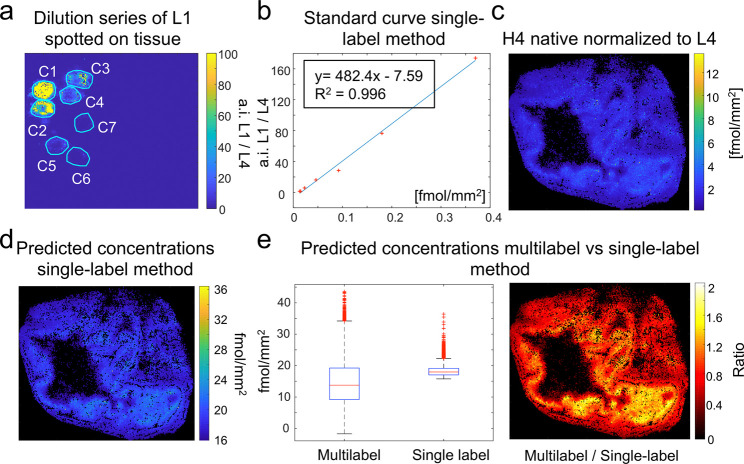
To compare our results to this approach, a dilution series of label L1 was spotted onto an adjacent tissue section, which had been sprayed with the three labels. Both sections were then covered by label L4 for normalization purposes. This enabled the creation of an external 7-point calibration curve, which had been normalized by the detected label L4 intensities (Figure 4a,b). A linear model was chosen over a nonlinear model (y = a*bx + c) based on the root-mean-square deviation (RMSE), which was only slightly lower for the nonlinear model (RMSElinear = 2.91 vs RMSEnon-linear = 2.78). Absolute concentrations were calculated by mapping the label L4-normalized intensities of the histone H4 signal to this external 7-point calibration curve of the adjacent tissue (Figure 4c,d).
Figure 4.
Comparison of single-label vs multilabel method. A concentration series of label L1 was spotted on a blank colon tissue section (a). Linear regression was used to obtain a calibration curve with an R2 of 0.996 (b). The signal of the target histone H4 peptide on the target tissue was normalized by the signal of label L4, which had been additionally sprayed onto the target tissue (c). (d) Absolute quantities of the histone H4 peptide were calculated by mapping the L4-normalized H4 peptide intensities to the external calibration curve from (b). The predicted concentrations by the single-label and multilabel methods across the tissue section were compared (e). Visualizing the ratios of the predicted concentrations per pixel enabled to localize the main differences between the two methods in the mucosa of the colon (f).
When comparing the two methods and their predicted concentrations, the medians of both methods were found in the same range (between 13 and 20 fmol/mm2). The main difference was observed in the variance of the predicted concentrations. The multilabel method covered a wider range of concentrations from 0 to 43 fmol/mm2 whereas the lowest value for the single method was 16 fmol/mm2 (Figure 4e, left). The cause for this lower limit is the negative intercept of the linear regression model, which leads to this value when the intensity is zero (Figure 4b). To locate the differences, we plotted the ratio of the predicted concentrations calculated by the multilabel vs the single-label method. Interestingly, the major difference in predicted quantities was found in the mucosa of the colon with predicted concentrations up to two times higher in the multilabel method (Figure 4e, right). To better understand the causes of these differences in predictions and the reliability of each of the results, we compared the two methods in more detail by validating them on known compounds with known concentrations.
Cross-Validation of Single-Label and Multilabel Methods
To validate both analytical approaches, we used a cross-validation approach where the single-label and multilabel methods were used to predict the absolute known concentrations of labels L1 (highest concentration), L2 (middle concentration), and L3 (lowest concentration). Cross-validation of the multilabel method was carried out in two ways: 1) in a leave-on-label-out fashion where all permutations of two labels were used for linear regression to predict the concentration of the left out label; 2) and a residual analysis of the three-label approach. For all three cross-validation approaches, ratios were calculated between the predicted and expected (theoretical) concentrations (Figure 5). The single-label method estimated the concentrations of labels L1, L2, and, L3 with mean ratios of 0.41 (±0.04 SD), 1.00 (±0.04 SD), and 3.61 (±0.07 SD), respectively. The use of two labels improved the overall prediction accuracy with mean ratios of 1.42 (±0.32 SD), 0.78 (±0.14 SD), and 2.03 (±0.59 SD) for labels L1, L2, and L3, respectively. However, the two-point strategy resulted in a higher variance especially for the prediction of labels with the highest and lowest concentrations (L1 and L3) due to their location outside the calculated regression curve. Finally, the multilabel method predicted the concentrations of labels L1, L2, and L3 most accurately with mean ratios of 1.01 (±0.004 SD), 0.87 (±0.08 SD), and 1.41 (±0.25 SD). Of particular note, the prediction accuracy of label L2 (middle concentration) was similar among all strategies, showing the importance of the optimization of the label concentrations.
Figure 5.
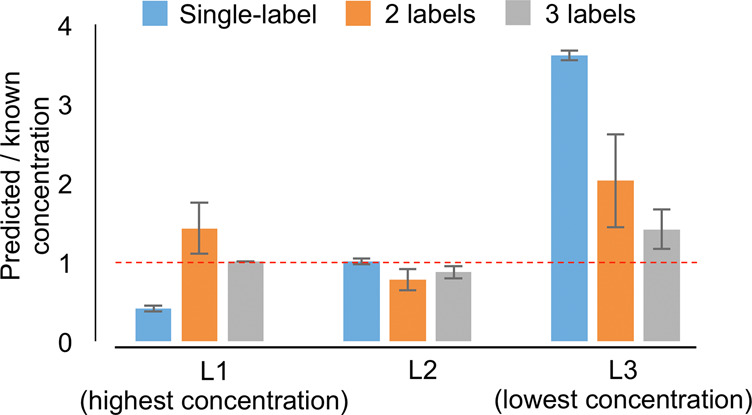
Cross-validation of single-label, two-label, and three-label methods. All three methods were used to estimate the known concentrations of labels L1 (highest concentration), L2 (middle concentration), and L3 (lowest concentration). Ratios between known and predicted concentrations were calculated after the removal of outliers using the median absolute deviations method (Supporting Information, Figure 4).
The cross-validation showed that the accuracy of the single-label method depends on the concentration of the target compound where higher concentrations are underestimated and lower concentrations are overestimated (Figure 5). In fact, this underestimation might have happened in the mucosa region (Figure 4e, right), which presumably contains the highest amount of histones due to the high cell density in this area. Like histones, the concentrations of molecules in biological tissues are expected to range several orders of magnitude across the tissue (Figure 3e), which makes the single-label approach suitable only for quantities that are close to the single label’s concentration. Then, the single-label method is not only more accurate but also shows a lower variance in accuracy (Figure 5).
The multilabel method, in contrast, offers the advantage by the use of several labels to address the variation in concentration of target compounds in the tissue, ultimately resulting in higher accuracies. This is not always an advantage. The distribution of regression residuals from the curve is reflected in the higher variance and slightly lower accuracy of the multilabel method when predicting the known concentrations (Figure 5). Compared to the single-label method, the multilabel method is, therefore, less suitable for cases where the target compound is expected to be homogeneously distributed across the tissue.
LC-MS-Based Validation of the Multilabel Method
Both presented approaches share the limitation that the applied standards and the endogenous compounds might undergo different mass transfer kinetics from the cells to the MALDI matrix.15 This is due to the different localizations of the endogenous compounds in the cellular environment (membrane, cytoplasm, nucleus) compared to the most superficially localized standards. To investigate this effect, we performed LC-MS, which should not suffer from this differential extraction.
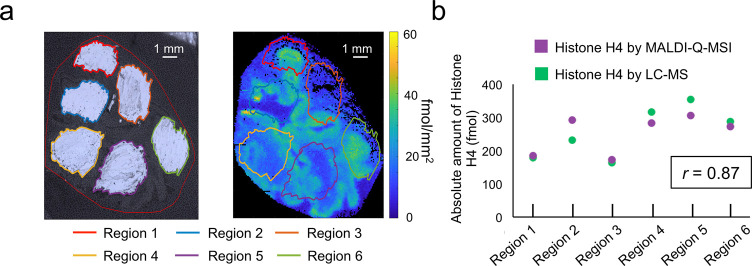
These experiments were performed on a tissue section after multilabel MALDI-Q-MSI. For this, tissue material was collected from six different areas with known amounts of L1, L2, and L3 and predicted absolute amounts of histone H4 based on multilabel MALDI-Q-MSI (Figure 6a). Every region was analyzed separately by LC-MS, and absolute amounts of the H4 peptide were determined using internal calibration curves based on the signals of L1, L2, and L3. Comparing the absolute amounts of histone H4 approximated by MALDI-Q-MSI and LC-MS revealed a high agreement (Pearson correlation r = 0.87) between both approaches (Figure 6b). This shows a high recovery of the target peptide by our MALDI-based multilabel approach.
Figure 6.
LC-MS quantitation after multilabel MALDI-Q-MSI. Six different areas were collected by scratching them off the tissue (a, left). The regions were coregistered to the MALDI-Q-MSI data to calculate the absolute amount of histone H4 related to the area of the individual regions (a, right). Absolute amounts of histone H4, based on the LC-MS, were predicted using the signals of labels L1, L2, and L3 for the establishment of internal calibration curves of the individual regions. A Pearson correlation coefficient r of 0.87 showed a high agreement between the predicted absolute amounts of histone H4 by MALDI-Q-MSI and LC-MS using (b).
Number of Data Points and the Regression Function
In both analytical methods (single-label vs multilabel) regression functions are used to predict concentrations of the target molecule. These functions are derived from a set of data points representing the intensities of known concentrations. The number and quality of data points will hence influence the calibration curve and therefore the calculations of the quantified compound. In optimum circumstances, the creation of this calibration curve requires a large number of data points. One of the main advantages of the single-label method is to have a calibration curve with (virtually) unlimited number of points on the second tissue—the number is naturally limited by the size of the slide. In the multilabel method, there are fewer data points available and this can potentially pose difficulties if the responses differ from a linear trend.21 To investigate this in our case, we have prepared and performed multilabel MALDI-Q-MSI on a consecutive section using a different high-mass resolution FT-ICR-based mass analyzer (Solarix, Bruker Daltonik). The predicted concentrations between both mass spectrometers (Orbitrap and Solarix) delivered similar results giving evidence for the applicability of the presented approach on different instrumentations (Supporting Information, Figure 5).
Next, we investigated other potential limitations arising from the concentration of the labels for constructing the calibration curve. In the case of a very low abundant target compound, one label would need to be lower in concentration than the target molecule. This is to ensure that its signal is always within the linear range of the regression. However, this harbors the danger that this very low concentrated label cannot be detected anymore by MSI. In our example, the lowest concentrated label (L3, 4.6 fmol/mm2) was detected in 81% of all pixels.
We also investigated if a structural homologue at high concentration could compete with the target compound during ionization, and thereby if the quantity of sprayed label material onto tissue could affect the detected intensity of the target compound (here: the endogenous peptide histone H4). To do so, three consecutive tissue sections were sprayed with the same label at three different concentrations (73.2, 18.3, 4.6 fmol/mm2). The results show that the quantity and the presence of the label did not affect the intensity of the histone H4 peptide and therefore does not constitute a limiting factor (Supporting Information Figure 6).
Another limitation in the number of labels is related to the possibility of their creation. In our study, we decided to quantify a peptide because the amino acid-based building-block nature of peptides allowed a cheap and easy synthesis of several distinct isotopically labeled versions of our target. Likewise, our approach can be translated to MALDI-Q-MSI studies of small compounds, taking into consideration that the synthesis of several labeled versions of small molecules could be technically challenging and consequently expensive.
Conclusions
We demonstrated in our proof-of-concept study that the novel use of multiple labels as internal standards provides an improved solution for local differences in ionization efficiency to quantify more accurately the target compound concentrations. This makes this new MALDI-Q-MSI method especially suitable for heterogeneous biological tissues with wide-ranged concentrations of the target compound.
Acknowledgments
This research was financially supported in part through the LINK program of the Province of Limburg (The Netherlands). F.D. received support from the Joint Imaging Valley program of the University of Liège and the Maastricht University. F.D. and B.B. received financial support from the European Union (ERA-NET TRANSCAN 2; Grant No. 643638). We thank Professor Bouvy from Maastricht University, the Netherlands, for providing the pig tissue.
Supporting Information Available
The Supporting Information is available free of charge at https://pubs.acs.org/doi/10.1021/acs.analchem.0c03186.
The authors declare no competing financial interest.
Supplementary Material
References
- McDonnell L. A.; Heeren R. M. Mass Spectrom. Rev. 2007, 26, 606–643. 10.1002/mas.20124. [DOI] [PubMed] [Google Scholar]
- Norris J. L.; Caprioli R. M. Chem. Rev. 2013, 113, 2309–2342. 10.1021/cr3004295. [DOI] [PMC free article] [PubMed] [Google Scholar]
- Vaysse P. M.; Heeren R. M. A.; Porta T.; Balluff B. Analyst 2017, 142, 2690–2712. 10.1039/C7AN00565B. [DOI] [PubMed] [Google Scholar]
- Prideaux B.; Stoeckli M. J. Proteomics 2012, 75, 4999–5013. 10.1016/j.jprot.2012.07.028. [DOI] [PubMed] [Google Scholar]
- Ellis S. R.; Bruinen A. L.; Heeren R. M. Anal. Bioanal. Chem. 2014, 406, 1275–1289. 10.1007/s00216-013-7478-9. [DOI] [PubMed] [Google Scholar]
- Schulz S.; Becker M.; Groseclose M. R.; Schadt S.; Hopf C. Curr. Opin. Biotechnol. 2019, 55, 51–59. 10.1016/j.copbio.2018.08.003. [DOI] [PubMed] [Google Scholar]
- Signor L.; Varesio E.; Staack R. F.; Starke V.; Richter W. F.; Hopfgartner G. J. Mass Spectrom. 2007, 42, 900–909. 10.1002/jms.1225. [DOI] [PubMed] [Google Scholar]
- Nilsson A.; Goodwin R. J.; Shariatgorji M.; Vallianatou T.; Webborn P. J.; Andren P. E. Anal. Chem. 2015, 87, 1437–1455. 10.1021/ac504734s. [DOI] [PubMed] [Google Scholar]
- Knochenmuss R.; Dubois F.; Dale M. J.; Zenobi R. Rapid Commun. Mass Spectrom. 1996, 10, 871–877. 10.1002/(sici)1097-0231(19960610)10:83.0.co;2-r. [DOI] [PubMed] [Google Scholar]
- Taylor A. J.; Dexter A.; Bunch J. Anal. Chem. 2018, 90, 5637–5645. 10.1021/acs.analchem.7b05005. [DOI] [PubMed] [Google Scholar]
- van Kampen J. J.; Burgers P. C.; de Groot R.; Luider T. M. Anal. Chem. 2006, 78, 5403–5411. 10.1021/ac060436i. [DOI] [PubMed] [Google Scholar]
- Swales J. G.; Dexter A.; Hamm G.; Nilsson A.; Strittmatter N.; Michopoulos F.; Hardy C.; Morentin-Gutierrez P.; Mellor M.; Andren P. E.; Clench M. R.; Bunch J.; Critchlow S. E.; Goodwin R. J. A. Anal. Chem. 2018, 90, 6051–6058. 10.1021/acs.analchem.7b05239. [DOI] [PubMed] [Google Scholar]
- Groseclose M. R.; Castellino S. Anal. Chem. 2013, 85, 10099–10106. 10.1021/ac400892z. [DOI] [PubMed] [Google Scholar]
- Porta T.; Lesur A.; Varesio E.; Hopfgartner G. Anal. Bioanal. Chem. 2015, 407, 2177–2187. 10.1007/s00216-014-8315-5. [DOI] [PubMed] [Google Scholar]
- Wu Q.; Rubakhin S. S.; Sweedler J. V. Anal. Chem. 2020, 92, 6613–6621. 10.1021/acs.analchem.0c00392. [DOI] [PMC free article] [PubMed] [Google Scholar]
- Barré F. P. Y.; Flinders B.; Garcia J. P.; Jansen I.; Huizing L. R.; Porta T.; Creemers L. B.; Heeren R. M.; Cillero-Pastor B. Anal. Chem. 2016, 88, 12051–12059. 10.1021/acs.analchem.6b02491. [DOI] [PubMed] [Google Scholar]
- Fehniger T. E.; Vegvari A.; Rezeli M.; Prikk K.; Ross P.; Dahlback M.; Edula G.; Sepper R.; Marko-Varga G. Anal. Chem. 2011, 83, 8329–8336. 10.1021/ac2014349. [DOI] [PubMed] [Google Scholar]
- Hamm G.; Bonnel D.; Legouffe R.; Pamelard F.; Delbos J. M.; Bouzom F.; Stauber J. J. Proteomics 2012, 75, 4952–4961. 10.1016/j.jprot.2012.07.035. [DOI] [PubMed] [Google Scholar]
- Groseclose M. R.; Massion P. P.; Chaurand P.; Caprioli R. M. AXRAAA 2008, 8, 3715–3724. [DOI] [PMC free article] [PubMed] [Google Scholar]
- Lanekoff I.; Stevens S. L.; Stenzel-Poore M. P.; Laskin J. Analyst 2014, 139, 3528–3532. 10.1039/c4an00504j. [DOI] [PMC free article] [PubMed] [Google Scholar]
- Abu Sammour D.; Marsching C.; Geisel A.; Erich K.; Schulz S.; Ramallo Guevara C.; Rabe J. H.; Marx A.; Findeisen P.; Hohenberger P.; Hopf C. Sci Rep 2019, 9, 10698 10.1038/s41598-019-47089-5. [DOI] [PMC free article] [PubMed] [Google Scholar]
Associated Data
This section collects any data citations, data availability statements, or supplementary materials included in this article.


