Abstract
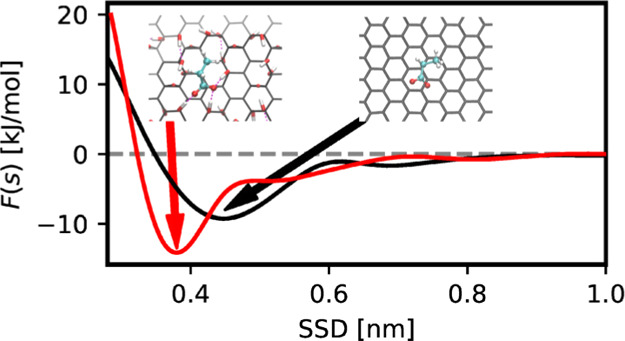
The use of carbon-based nanomaterials is tremendously increasing in various areas of technological, bioengineering, and biomedical applications. The functionality of carbon-based nanomaterials can be further broadened via chemical functionalization of carbon nanomaterial surfaces. On the other hand, concern is rising on possible adverse effects when nanomaterials are taken up by biological organisms. In order to contribute into understanding of interactions of carbon-based nanomaterials with biological matter, we have investigated adsorption of small biomolecules on nanomaterials using enhanced sampling molecular dynamics. The biomolecules included amino acid side chain analogues, fragments of lipids, and sugar monomers. The adsorption behavior on unstructured amorphous carbon, pristine graphene and its derivatives (such as few-layer graphene, graphene oxide, and reduced graphene oxide) as well as pristine carbon nanotubes, and those functionalized with OH–, COOH–, COO–, NH2–, and NH3 groups was investigated with respect to surface concentration. An adsorption profile, that is, the free energy as a function of distance from the nanomaterial surfaces, was determined for each molecule and surface using the Metadynamics approach. The results were analyzed in terms of chemical specificity, surface charge, and surface concentration. It was shown that although morphology of the nanomaterial has a limited effect on the adsorption properties, functionalization of the surface by various molecular groups can drastically change the adsorption behavior that can be used in the design of nanosurfaces with highly selective adsorption properties and safe for human health and environment.
Introduction
Nanostructured carbon holds a prominent place in material science because of its potential in a virtually endless line of engineering applications, for example, in nanoelectronics and energy technology.1 From noncrystalline carbon (tetrahedral amorphous carbon), fullerene, graphene sheet, and ribbon to nanotube, nanoengineered carbon has also been used for biomedical applications in cancer diagnostic and therapeutic,2 biosensing,3−5 and targeted drug delivery.6−8 For example, carbon nanotube (CNT) localization near amyloid beta peptide not only increases the specificity of drug delivery but also prevents peptide self-assembly in Alzheimer’s disease.9 Properties of carbon nanomaterials can be further modified by various functional groups at the surface which can substantially change the interaction of the material with the surrounding molecules which can be further exploited in various applications. Along with the technological use, the nanotoxic hazard associated with the uptake of carbon nanoparticles by biological organisms is a highly debated subject. For example, confinement of CNTs in lysosome through the intracellular vesicle uptake can damage the internal lipid membrane and induce lysosomal permeability.10 Toxic effects of graphene can be caused by interrupting the hydrophobic protein–protein interaction inside the cell which can lead to the failure in biological function of the cell and even cell mortality.11
In recent years, considerable efforts have been made to correlate nanomaterials’ toxicity to their chemical, structural, and morphological characterizations.12−14 Computational data-driven modeling such as quantitative structure–activity relationship (QSAR) has been used to predict toxic effects of nanomaterials on the basis of their physiochemical properties15−17 and theoretical molecular descriptors. The binding strength of biomolecules to nanomaterials expressed in terms of binding affinities and adsorption free energies is an essential descriptor in the prediction of biological and environmental effects of nanomaterials.18,19 Binding free energies of amino acids determine in a large extent composition of protein corona,19,20 which in turn determines the further fate of nanoparticles in the organism and their possible toxic effects. Because the toxicity mechanism of nanomaterials is highly dependent on the surface12 and nanoparticles’ surface is often modified by covalently linked molecules, studying the response of functionalized nanomaterials to biomolecules is essential for nanotoxicity assessment.
Experimental quantification of the interaction strength between biomolecules and nanomaterial surfaces in terms of binding free energies is difficult, and existing studies are rather scarce.21,22 Atomistic computer simulations suggest another route in characterization of bio-nanointeractions. Previously, binding of peptides to carbon nanomaterials, such as graphene and CNTs, has been studied via all-atom molecular dynamics simulations in a number of publications.21,23,24 The free energy of adsorption for a range of amino acids on graphene sheets has been reported.25 Comer et al.(26) studied adsorption of small organic molecules on pristine and OH-functionalized CNTs. The influence of oxidation defects on peptide adsorption onto the CNT surface has also been studied.27 Furthermore, ab initio computations have been carried out to investigate the stability of CNTs covalently functionalized by COOH, OH, NHn (for n = 1,2,3,and 4), and other groups at different sites and in various concentrations.28−30
In the present work, we have investigated adsorption of small biomolecules on a variety of carbon nanomaterials which include tetrahedral amorphous carbon (ta-C), graphene and its derivatives such as monolayer graphene, few-layer graphene, graphene oxide (GO), reduced graphene oxide (rGO) as well as CNT, and both pristine (nonfunctionalized) and functionalized with hydroxyl, carboxyl, and amino groups. The studied biomolecules represent the basic components of proteins and lipids, particularly they include amino acid side chain analogues and fragments of essential lipids and sugars. We have carried out Metadynamics molecular dynamics simulations computing the potential of mean force (PMF) between the biomolecules and nanomaterial surfaces and determined the adsorption free energies from that. Binding free energies of a given set of small biomolecules to a particular nanosurface can be useful in developing thermodynamic fingerprints for bio-nanomaterial interfacial interactions by providing a set of descriptors which characterize the nanomaterial in a biological media that can be an important component in statistical approaches (QSAR, neural networks, machine learning) to evaluate possible biological effects of the nanomaterial.31 Furthermore, the computed PMF can be used in coarse-grained models of the complexation of nanomaterials and biological macromolecules, including modeling of protein corona formation. Thus, Power et al.(32) showed that PMFs of amino acids at gold surfaces allow us to build a coarse-grained model to describe protein adsorption on these surfaces, and predict the composition of protein corona.
The simulations of this work were carried out under ambient (biological) conditions, with salinity and solvent conditions that mimic those found in the blood. The effect of functionalizing groups’ concentration on the biomolecular binding strength was investigated as well.
Materials and Methods
Material Models and Force Field
We have developed models of carbon nanomaterials with functionalizing molecular groups attached to their surfaces with covalent bonds. The general design of our models is based on the generalized AMBER force field (GAFF),33 with a few modifications described in the Supporting Information. GAFF has previously showed good performance in the description of various solution properties of small molecules.34,35 GAFF parameters exist for molecular fragments that correspond to different hybridizations of carbon atoms (sp, sp2, and sp3) and for the functionalizing group used in our simulations. Thus, pristine graphene and CNTs were modeled as an infinite material composed of benzene (C6H6) fragments with sp2-hybridized carbon atoms (three-folded coordinated carbon). Previously, benzene parameters for graphene were used in a number of simulation works,23,36 and their suitability was confirmed by ab initio computations.37 Amorphous carbon materials containing sp3-, sp2-, and sp-hybridized carbon atoms were modeled with GAFF parameters (version 2.11) for the respective types of carbon. We assigned force field types and the corresponding parameters by running antechamber38via acpype39 (for GO, rGO, and all adsorbent molecules) or by homemade scripts.
The groups considered in this work to functionalize CNTs are OH, COOH, COO–, NH2, and NH3+, while for graphene oxide, they are OH and epoxy (C–O–C). The protonation state of a functionalizing group is pH- and pKa-dependent. For example, CNT–COOH terminations are dominant when the environment is strongly acidic while at neutral pH, this group is dominantly presented as CNT–COO–. We considered both protonated and unprotonated forms of carboxyl- and amino-functionalizing groups taking in mind that under some biologically relevant conditions, pH may strongly differ from the neutral value. For example, in phagosomes, which is a key component of a cell clearance system and which can be affected by the uptake of nanoparticles, pH is becoming acidic upon phagosome maturing.40
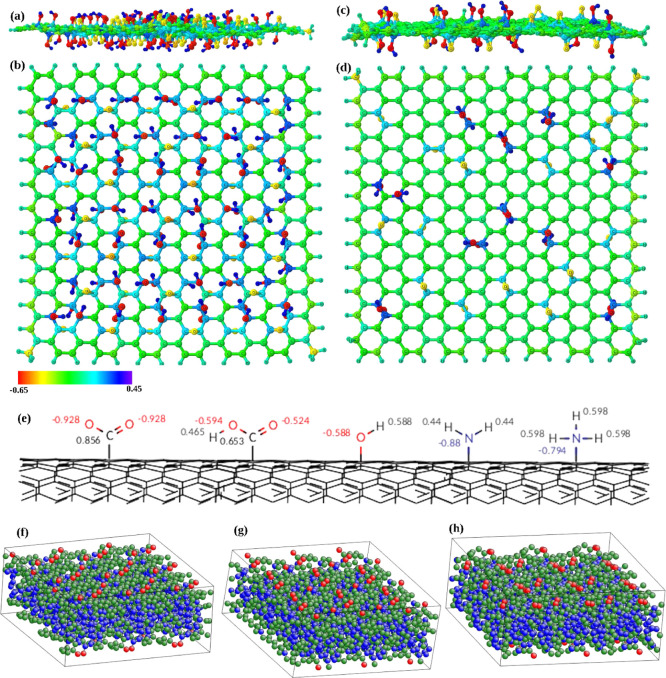
The partial atom charges were determined according to the following principles. Charges of all atoms of pristine CNTs, graphene, and amorphous carbon were set to zero. The net atomic charges of the functionalizing CNT groups were determined with the AM1 bond charge correction (AM1-BCC) method41 running antechamber38via acpype.39 In these computations, the functionalizing groups are represented by hydrogen-terminated fragments. For example, the hydroxyl (CNT–OH) group is neutral and represented by a water molecule (H2O). The carboxyl (CNT–COOH) group is represented by formic acid (HCOOH) when neutral and the formate ion (HCOO–) when negatively charged. Amine groups (CNT–NH2) are represented by ammonia (NH3) when neutral and ammonium (NH4+) when positively charged. Partial charges of the functionalizing groups on CNTs were then determined by rescaling the charge on the corresponding atom in the fragment to account for missing hydrogen. For GO and rGO models, the density-derived electrostatic and chemical (DDEC6)42 approach was used to calculate net atomic charges for all atoms. The computed atom charges are indicated in Figure 1a–d for GO and rGO by colors, and charges for functionalizing groups of CNTs are shown in Figure 1e. Topology files with force field parameters in Gromacs format for all simulated systems are available as a part of the Supporting Information.
Figure 1.
Graphical representation of graphene oxide [side (a) and top views (b)] and reduced graphene oxide [side (c) and top views (d)]. Partial atomic charges are shown by RGB coloring scheme varying between −0.65 to 0.45 amu. (e) Schematic representation of functionalizing CNT groups and partial atomic charges on the functionalizing groups. (f–h) Structural models for tetrahedral amorphous carbon taken from ref (43) and replicated 3 × 3 in the x–y plane. Atoms are colored according to their coordination number, red (two-folded), green (three-folded), and blue (four-folded) coordinated carbon, using ATOMEYE.44
A set of 29 biomolecules (as listed in Table 1 and Figure S1 in the Supporting Information) was selected to investigate their adsorption behavior on carbon nanomaterials. The set consists of 18 amino acid side chain analogues (amino acids with the backbone fragment replaced with hydrogen45) for all naturally occurring amino acids except glycine and proline, two full amino acids that include protein backbones (glycine and proline), four molecules representing lipid fragments, and one sugar monomer (d-glucose). For amino acid side chain analogues HIS, CYM, and GLU, having pKa within the range from 4 to 10, we have considered both charged and uncharged forms, which makes 3 additional molecules. For histidine, we considered two isomeric forms, HID and HIE. In total, five molecules are positively charged, four molecules are negatively charged, and 20 molecules are electrically neutral. This choice of molecules was made in order to cover most of the principal fragments of biomolecules present in biological environments, such as proteins and lipids. The set covers hydrophobic, polar, aromatic, cyclic, and charged moieties. A set of binding energies of these molecules to a material could represent an essential set of descriptors to be used in in silico characterization of the biological activity of nanomaterials.
Table 1. List of Biomolecules Whose Adsorption Behavior was Investigated in This Worka.
| code | description | charge (e) |
|---|---|---|
| ALA | SCAb of alanine | 0 |
| ARG | SCA of arginine | +1 |
| ASN | SCA of asparagine | 0 |
| ASP | SCA of aspartic acid | –1 |
| CYS | SCA of cysteine | 0 |
| GLN | SCA of glutamine | 0 |
| GLU | SCA of glutamic acid | –1 |
| HID | SCA of histidine (δ) | 0 |
| HIE | SCA of histidine (ϵ) | 0 |
| ILE | SCA of isoleucine | 0 |
| LEU | SCA of leucine | 0 |
| LYS | SCA of lysine | +1 |
| MET | SCA of methionine | 0 |
| PHE | SCA of phenylalanine | 0 |
| SER | SCA of serine | 0 |
| THR | SCA of threonine | 0 |
| TRP | SCA of tryptophan | 0 |
| TYR | SCA of tyrosine | 0 |
| VAL | SCA of valine | 0 |
| HIP | SCA of histidine ion | +1 |
| CYM | SCA of cysteine ion | –1 |
| GAN | SCA glutamic acid (neutral) | 0 |
| GLY | glycine (amino acid) | 0 |
| PRO | proline (amino acid) | 0 |
| CHL | choline group of lipid | +1 |
| PHO | phosphate group of lipid | –1 |
| ETA | etanolamine group of lipid | +1 |
| EST | ester group of lipid | 0 |
| DGL | d-glucose | 0 |
Chemical structures are provided in Figure S1 of the Supporting Information.
Side chain analogues.
GAFF parameters for the biomolecules in the set were determined by running antechamber38via acpype.39 Partial atom charges were determined with the AM1-BCC method.41 Prepared topologies and coordinates that are ready for simulations with Gromacs46 are available as part of the Supporting Information.
Simulated Systems
A honeycomb model of pristine graphene containing 416 carbon atoms was constructed with initial dimensions of 3.4 × 3.2 nm. We have simulated a single layer in water, as well as two- and three-layer graphene. The latter models were also intended to describe surfaces of large-diameter multiwalled CNTs (MWCNTs). The distance between graphene planes was set to 0.34 nm47 with the initial orientation of A-B stacking and A-B-A stacking for bilayer and trilayer graphene, respectively.48 In the case of two- and three-layer graphene, we put two respective layers of graphene at 8 nm vacuum distance between them to resemble models for NRCWE-062 multiwalled CNTs with an outer diameter of 8 nm (more information on characterization of MW-CNT can be found on http://www.enanomapper.net/data), while the other compartment between the layers in the periodic cell was filled by water.
The pristine graphene surface was also used to construct GO and rGO models. GO and rGO consist of different percentages of oxygen-containing functional groups such as hydroxyl (OH), epoxy (C–O–C), carbonyl (CO), and carboxyl (COOH). Hydroxyl and epoxy groups are found on the graphene basal plane and other groups are mostly attached to the carbon atoms on the edges. Because the reduction of graphene oxide is mainly aiming at eliminating epoxy and hydroxyl groups on the plane, we have modeled a hydrogen-terminated graphene plane with randomly distributed epoxy- and hydroxyl-functionalizing groups onto the plane to resemble the model for GO and rGO. A more elaborated structural model of GO by considering defect formation and out-of-plane distortion49,50 can be investigated in the future work. The sites for hydroxyl and epoxy groups were chosen on the top of the carbon atom and between two carbons (bridge), respectively, as reported in the Lerf–Klinowski model.51 In our model, a required number of hydroxyl and epoxy groups were randomly distributed on the basal plane (with the same amount in both sides) to have a C/O ratio (the fraction of carbon atoms to oxygen containing groups) in agreement with the experiment (see Table 2 for chemical composition). The range of C/O for GO is reported as 1.3–2.7,52−55 while the reduction of GO increases the ratio to 2.8–10.3 in the rGO surface. We have simulated finite fragments of GO and rGO, with carbon atoms on the edges terminated by hydrogen atoms. The structures were optimized using the Hartree–Fock (HF) method and 3–21 G* basis set with polarization functions on heavy atoms. The optimized structures of GO and rGO surfaces used in the simulations are shown in Figure 1a–d.
Table 2. Chemical Characterization of all Simulated Systems Representing Different Carbon Nanomaterials.
| material | functionalization | chemical composition |
|---|---|---|
| tetrahedral amorphous carbon (ta-C) | C1944 | |
| graphene | C416 | |
| bilayer graphene | C1664 | |
| trilayer graphene | C2496 | |
| graphene oxide (GO) | –OH, –C–O–C– | C336 (OH)86 (O)39 H54 |
| reduced graphene oxide (rGO) | –OH, –C–O–C– | C336 (OH)20 (O)14 H57 |
| CNT | C660 | |
| CNT–OH–low | –OH | C660 (OH)19 |
| CNT–OH-high | –OH | C660 (OH)76 |
| CNT–COOH-low | –COOH | C660 (COOH)5 |
| CNT–COOH-high | –COOH | C660 (COOH)77 |
| CNT–COO–-low | –COO– | C660 (COO–)5 |
| CNT–COO–-high | –COO– | C660 (COO–)20 |
| CNT–NH2-low | –NH2 | C660 (NH2)10 |
| CNT–NH2-high | –NH2 | C660 (NH2)79 |
| CNT–NH3+-low | –NH3+ | C660 (NH3+)10 |
| CNT–NH3+-high | –NH3+ | C660 (NH3+)20 |
Atomistic models for tetrahedral amorphous carbon (ta-C) were taken from Deringer et al.(43) The authors of that work generated and characterized a representative library of optimized tetrahedral amorphous carbon slabs of different sizes by applying machine learning combined with DFT modeling.43,56 They showed that 216-atom ta-C slab models (with 1.13 nm length size) are the smallest system size that can represent the ta-C local structure correctly in which the slab interior is structurally similar to diamond (the prototype for sp3 carbon) and the slab surface is similar to graphene (the prototype for sp2 carbon). Because ta-C does not have an ordered unit cell, three randomly selected slab models composed of 216 atoms were chosen for this study (Figure 1f–h). We replicated the system 3 × 3 in the x–y plane to have a comparable system size with other studied surfaces. Larger-sized amorphous carbon models reported recently57 can be used for more realistic surface structures in the future work.
A single-walled CNT (SWCNT) with armchair symmetry expressed by the indices (11, 11) was generated using scikit-nanoa. This pristine CNT was used as a scaffold for functionalization with −OH, −COOH, −COO–, −NH2, and −NH3+ groups. Adsorption sites were chosen on top of carbon atoms of the CNT unit cell (Figure 1e), as ab initio calculations have shown this to be the preferred adsorption site for all functionalizing molecules considered in the present work.28 We programmed an automated procedure to functionalize the CNTs based on the open-source network x Python library.58 Except for the pristine CNT (which corresponds to zero concentration of the functionalizing groups), two concentrations were considered for each functionalized CNT surface: low and high. The low value corresponds to typical experimental conditions (a few wt %) while the high value is the maximum concentration allowed while keeping an intact CNT. This threshold has been previously determined with ab initio calculations.28 Our numerical results indicate maximum concentration slightly below 25% (in fraction of six-membered rings) for all functionalizing groups. We take this value as the high concentration (see Table 2 for chemical composition of each simulated system).
For all simulated systems, a suitable number of counterions were added (Cl– or Na+ depending on the charge) to neutralize the system. Once neutral, an additional number of the same ions were added to yield salt concentrations at 0.15 mol dm–3, which corresponds to physiological conditions. At start, all ions were added at random positions outside the nanomaterial. The adsorbing molecule was added 0.8 nm away from the surface. The systems were then solvated by adding an appropriate number of water molecules outside the nanomaterial surfaces and not overlapping with the inserted molecule and ions. The Packmol program59 was used to generate the starting configurations by putting all parts together as described above. A summary of the studied nanosystems and their chemical composition is given in Table 2.
Free Energy Computations
We have used classical molecular dynamics with enhanced sampling metadynamics algorithm60 to calculate adsorption profiles and adsorption free energy for small biomolecules on carbon nanomaterial surfaces. The surface separation distance (SSD) between the adsorbing molecule and material surface was used as a collective variable. In all flat nanomaterials (graphene, few-layer graphene, GO, and rGO), SSD is measured as the z-component of the distance between the center of mass of the surface atoms (outermost layer in the case of few-layer graphene) and center of mass of the adsorbate. For CNTs, we modified the definition of s to be adapted to its cylindrical geometry, as follows
| 1 |
where  is
the difference between the distance
from the center of mass of the adsorbing molecule to the CNT axis
and R0 is the CNT radius, for which (11,
11) armchair symmetry CNT is 0.75 nm. For amorphous carbon, because
of the existence of the surface roughness (typically ∼0.12
nm for ultrathin 2 nm-thick ta-C films61), we considered SSD as the minimum distance between all atoms of
the ta-C slab and the center of mass of the adsorbate, modified to
be a function with a continuous derivative using ZDISTANCES directive
in PLUMED plug-in v 2.5.62
The potential of mean force is the free energy of the molecule as a function of the SSD and can be written as a histogram over the ensemble
| 2 |
which, in principle, is computed by counting the number of times the molecule is found at different s values in unbiased MD simulations. This approach is hampered by sampling, particularly, for strong binding surfaces when the molecule stays at the surface most of the simulation. Enhanced sampling is thus needed to observe enough binding/unbinding events and obtain a converged adsorption profile. In metadynamics, a history-dependent bias composed of the Gaussian function is added to the potential which enforces the system to explore regions that were not visited previously.60 The potential of mean force can be constructed either from the accumulated bias potentials60 or by force integration.63
In this work, we have employed two versions of metadynamics: the adaptive Gaussian well-tempered metadynamics64 (AWT-MetaD) with the histogram estimator of the free energy, as it was used in the previous work of our group for simulations of adsorption of amino acids at the TiO2 surface,45 and constant Gaussian height metadynamics with force integration (MetaDF) to calculate the adsorption profile. It was shown previously63,65 that combining metadynamics and thermodynamic integration can accelerate the convergence of PMF calculation. In MetaDF, the force acting on SSD (i.e., derivative of the energy over the SSD without including the bias potentials) is used to calculate the potential of mean force
| 3 |
where s runs over the relevant SSD values and ⟨F(s)⟩ is evaluated from averaging of the force acting on SSD from configurations having SSD in a small range around s, not including contribution from the bias potential. In simulations of this work, AWT-MetaD was used for CNTs while MetaDF for graphene, graphene oxide, and amorphous carbon. The relevant metadynamics parameters in the case of AWT-MetaD were bias factor 15 and an initial height of Gaussians 2.5 kJ/mol, while in MetaDF, a constant Gaussian height of 0.001 kJ/mol was used. In MetaDF, a low value of the Gaussian height was selected in order to provide close-to-equlibrium condition of the metadynamics simulation, while allowing us to accumulate bias in reasonable time to provide good sampling over the collective variable. We have also carried out comparative studies of AWT-MetaD and MetaDF in the case of adsorption on the graphene oxide surface which demonstrated equivalence of the two methods and also better performance of MetaDF compared to AWT-MetaD.
Additionally, in order to reduce convergence time of the simulations, a fictitious wall potential was introduced to prevent the adsorbate to visit states in the bulk region far from the surface
| 4 |
where the wall was set at a = 1.5 nm with a force constant of κ = 40 kJ mol–1 Å–4. For finite-size GO and rGO surfaces, an additional cylindrical fictitious wall with a radius of 1 nm from the center of mass of GO and rGO and axis perpendicular to the surface was introduced to prevent the adsorbing molecule from visiting surface edges of GO and rGO. These restrained potential walls limit the region of the space accessible for the adsorbing molecule during the simulation while leaving essential parts of the material surface and bulk solvent region unaffected and thus not affecting the result of simulation. Such an approach, with limiting available space for the molecule of interest to only relevant region, is often used for free energy and PMF calculation with PLUMED,62 for example, in ligand, binding free energy calculations with funnel metadynamics.66
The binding free energy of a molecule is calculated from a converged free-energy profile as
| 5 |
where δ is the adsorption layer thickness. This parameter must be specified when calculating binding free energies from experimental data67 as well as by converting the area concentration of bound molecules to a volume concentration that can be compared to the volume concentration of the unbound molecules that are free to diffuse in the surrounding bulk. We used δ = 0.8 nm in our calculations. ΔFads depends weakly (logarithmically) on δ and its exact value is not of high importance for the binding free energy.
Note that the binding free energy defined in eq 5 is that of a single molecule binding to the surface. This situation corresponds to the dilute limit of the Langmuir isotherm, which is the standard model when extracting binding free energies with experimental techniques. Binding free energies are only defined with respect to standard states. Conversions between standard states are carried out by adding the term kBT ln(c/cst), where c and cst are the concentration of the substance in the simulation and in the other standard state, respectively.45
All metadynamics simulations in this work were carried out with the PLUMED plug-in v 2.5 62 to Gromacs v.2019.46 Relevant MD parameters were time step 2 fs, all bonds to hydrogen atoms are constrained, v-rescale thermostate68 with relaxation time 1 ps with separated temperature control for the nanoparticle and for the rest of the system, cutoff 1 nm, and particle-mesh Ewald summation69 of electrostatic and Lennard-Jones interactions.
After the start, each system was first pre-equilibrated in semianisotropic NPT ensemble at pressure 1 bar with separate pressure control in the XY plane and in the Z-direction. After that, Metadynamics simulations were run in NVT ensemble with the box sizes equal to the average box sizes of pre-equilibration simulations. In MetaDF simulations with a constant Gaussian height, the first 50 ns of simulations were excluded from average force computations. Further details on convergence of the simulations and evaluation of uncertainty of the computed data are provided in the corresponding section of the Supporting Information.
Results
Adsorption of Biomolecules on Pure Carbon Surfaces
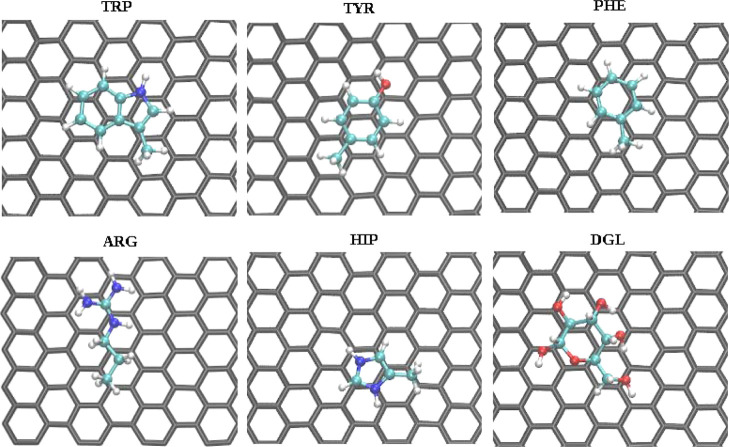
We begin our analysis from nonfunctionalized carbon surfaces. Potentials of mean force for biomolecules on graphene and pristine CNT are shown in Figure 2. Adsorbents with aromatic groups (TRP, TYR, PHE, and HIE) or cyclic structure (PRO and DGL) show stronger binding than other molecules, and they are getting closer to the surface without facing any positive energy barrier observed for some other, mostly nonpolar molecules at 0.6 nm SSD. Representative configurations of aromatic biomolecules adsorbed on the graphene surface show π–π stacking interaction with the graphene surface (Figure 3). Previously, the π–π stacking interactions have been reported to play an important role in the interaction between proteins and carbon nanomaterials.70 Also, arginine shows strong binding because of its flat sp2-hybridized moiety joining amino groups. A similar picture of biomolecular binding is observed for CNTs.
Figure 2.
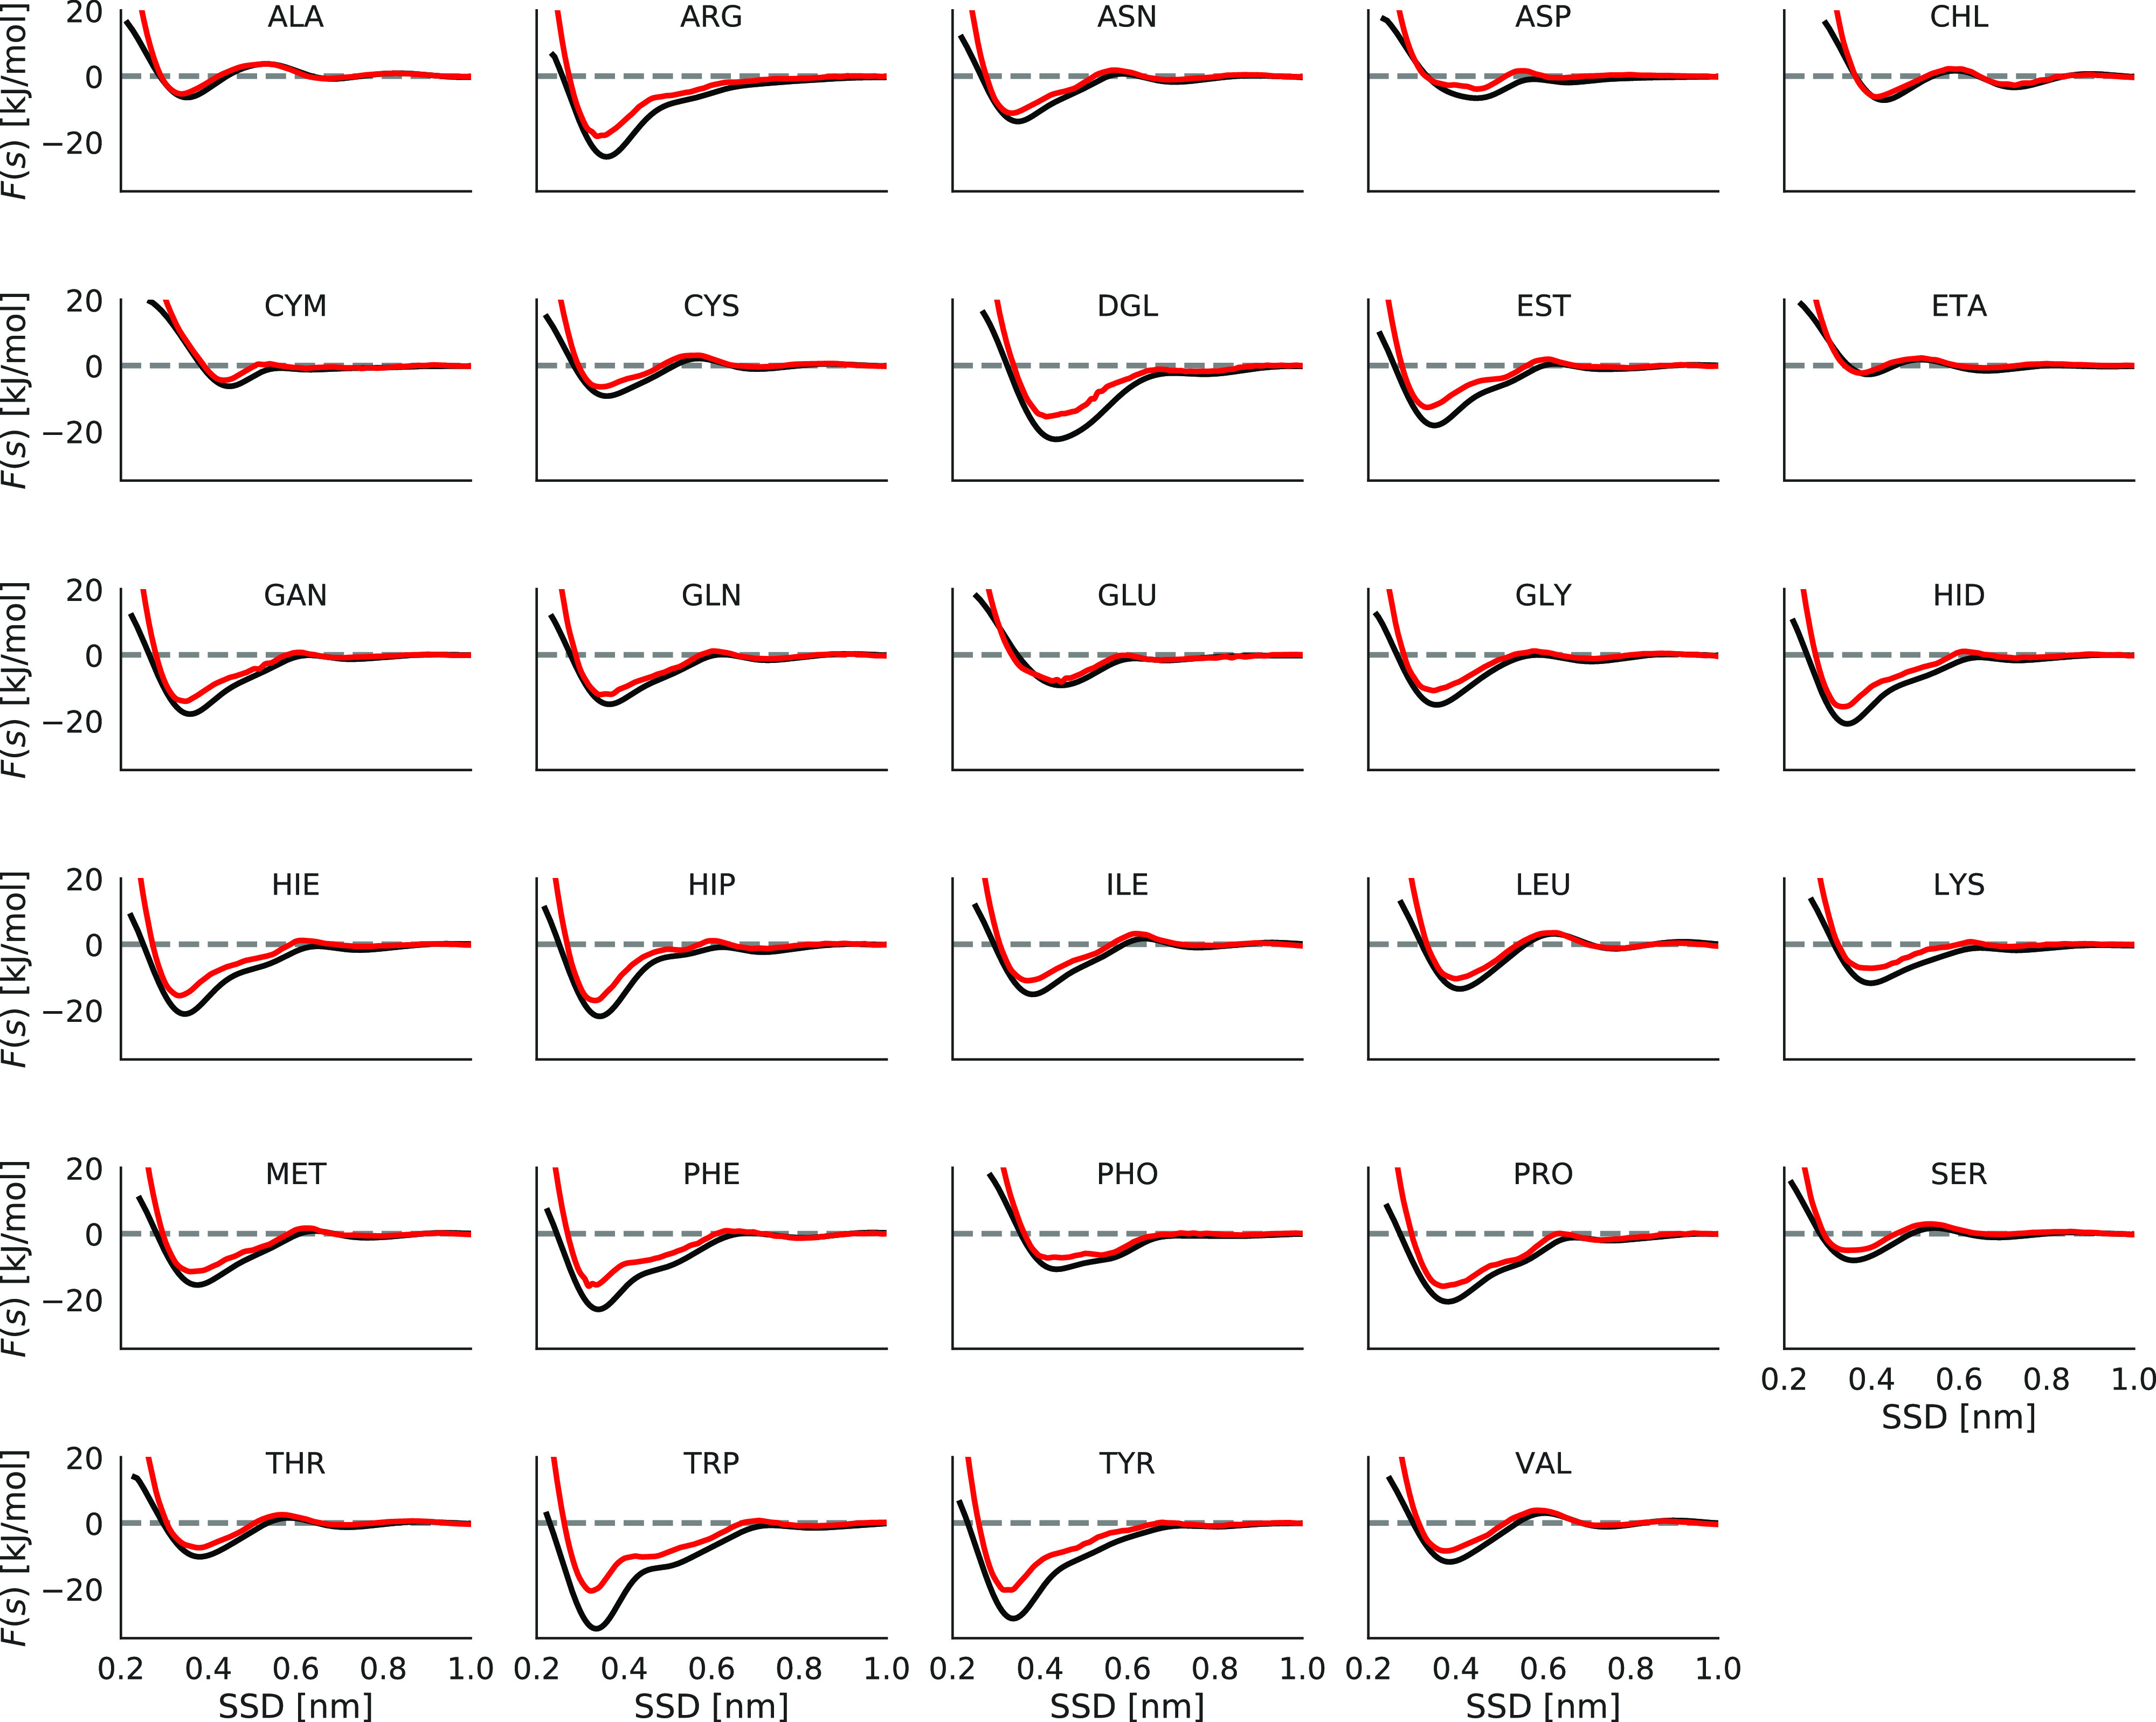
Adsorption profile (PMF) of different biomolecules on graphene (black) and pristine CNT (red).
Figure 3.
Molecular orientation of strongly absorbed biomolecules on the graphene surface. Pictures were taken from the top view at the distance between the center of mass of the adsorbing molecule and graphene corresponding to the free energy minimum, which is found at 0.34 nm for TRP, TYR, PHE, and HIP, 0.35 nm for ARG, and 0.44 nm for DGL.
The calculated binding free energies shows that TRP is the strongest binder to graphene (−24.3 ± 0.5 kJ mol–1), followed by TYR (−21.4 ± 0.3 kJ mol–1), ARG (−17.2 ± 0.4 kJ mol–1), DGL (−16.1 ± 0.3 kJ mol–1), PHE (−15.6 ± 0.1 kJ mol–1), HIP (−14.4 ± 0.3 kJ mol–1 and similar values for HIE and HID), and PRO (−14.0 ± 0.3 kJ mol–1). The weakest binding free energies are for ALA (−1.2 ± 0.1 kJ mol–1) and ASP (−2.3 ± 0.1 kJ mol–1) molecules. All binding free energies values can be found in Figure 4, and numerical values are provided as a part of the Supporting Information. Similar trends in interaction of amino acid side chains and peptides with graphitic interfaces have been reported.21,23,25,71
Figure 4.
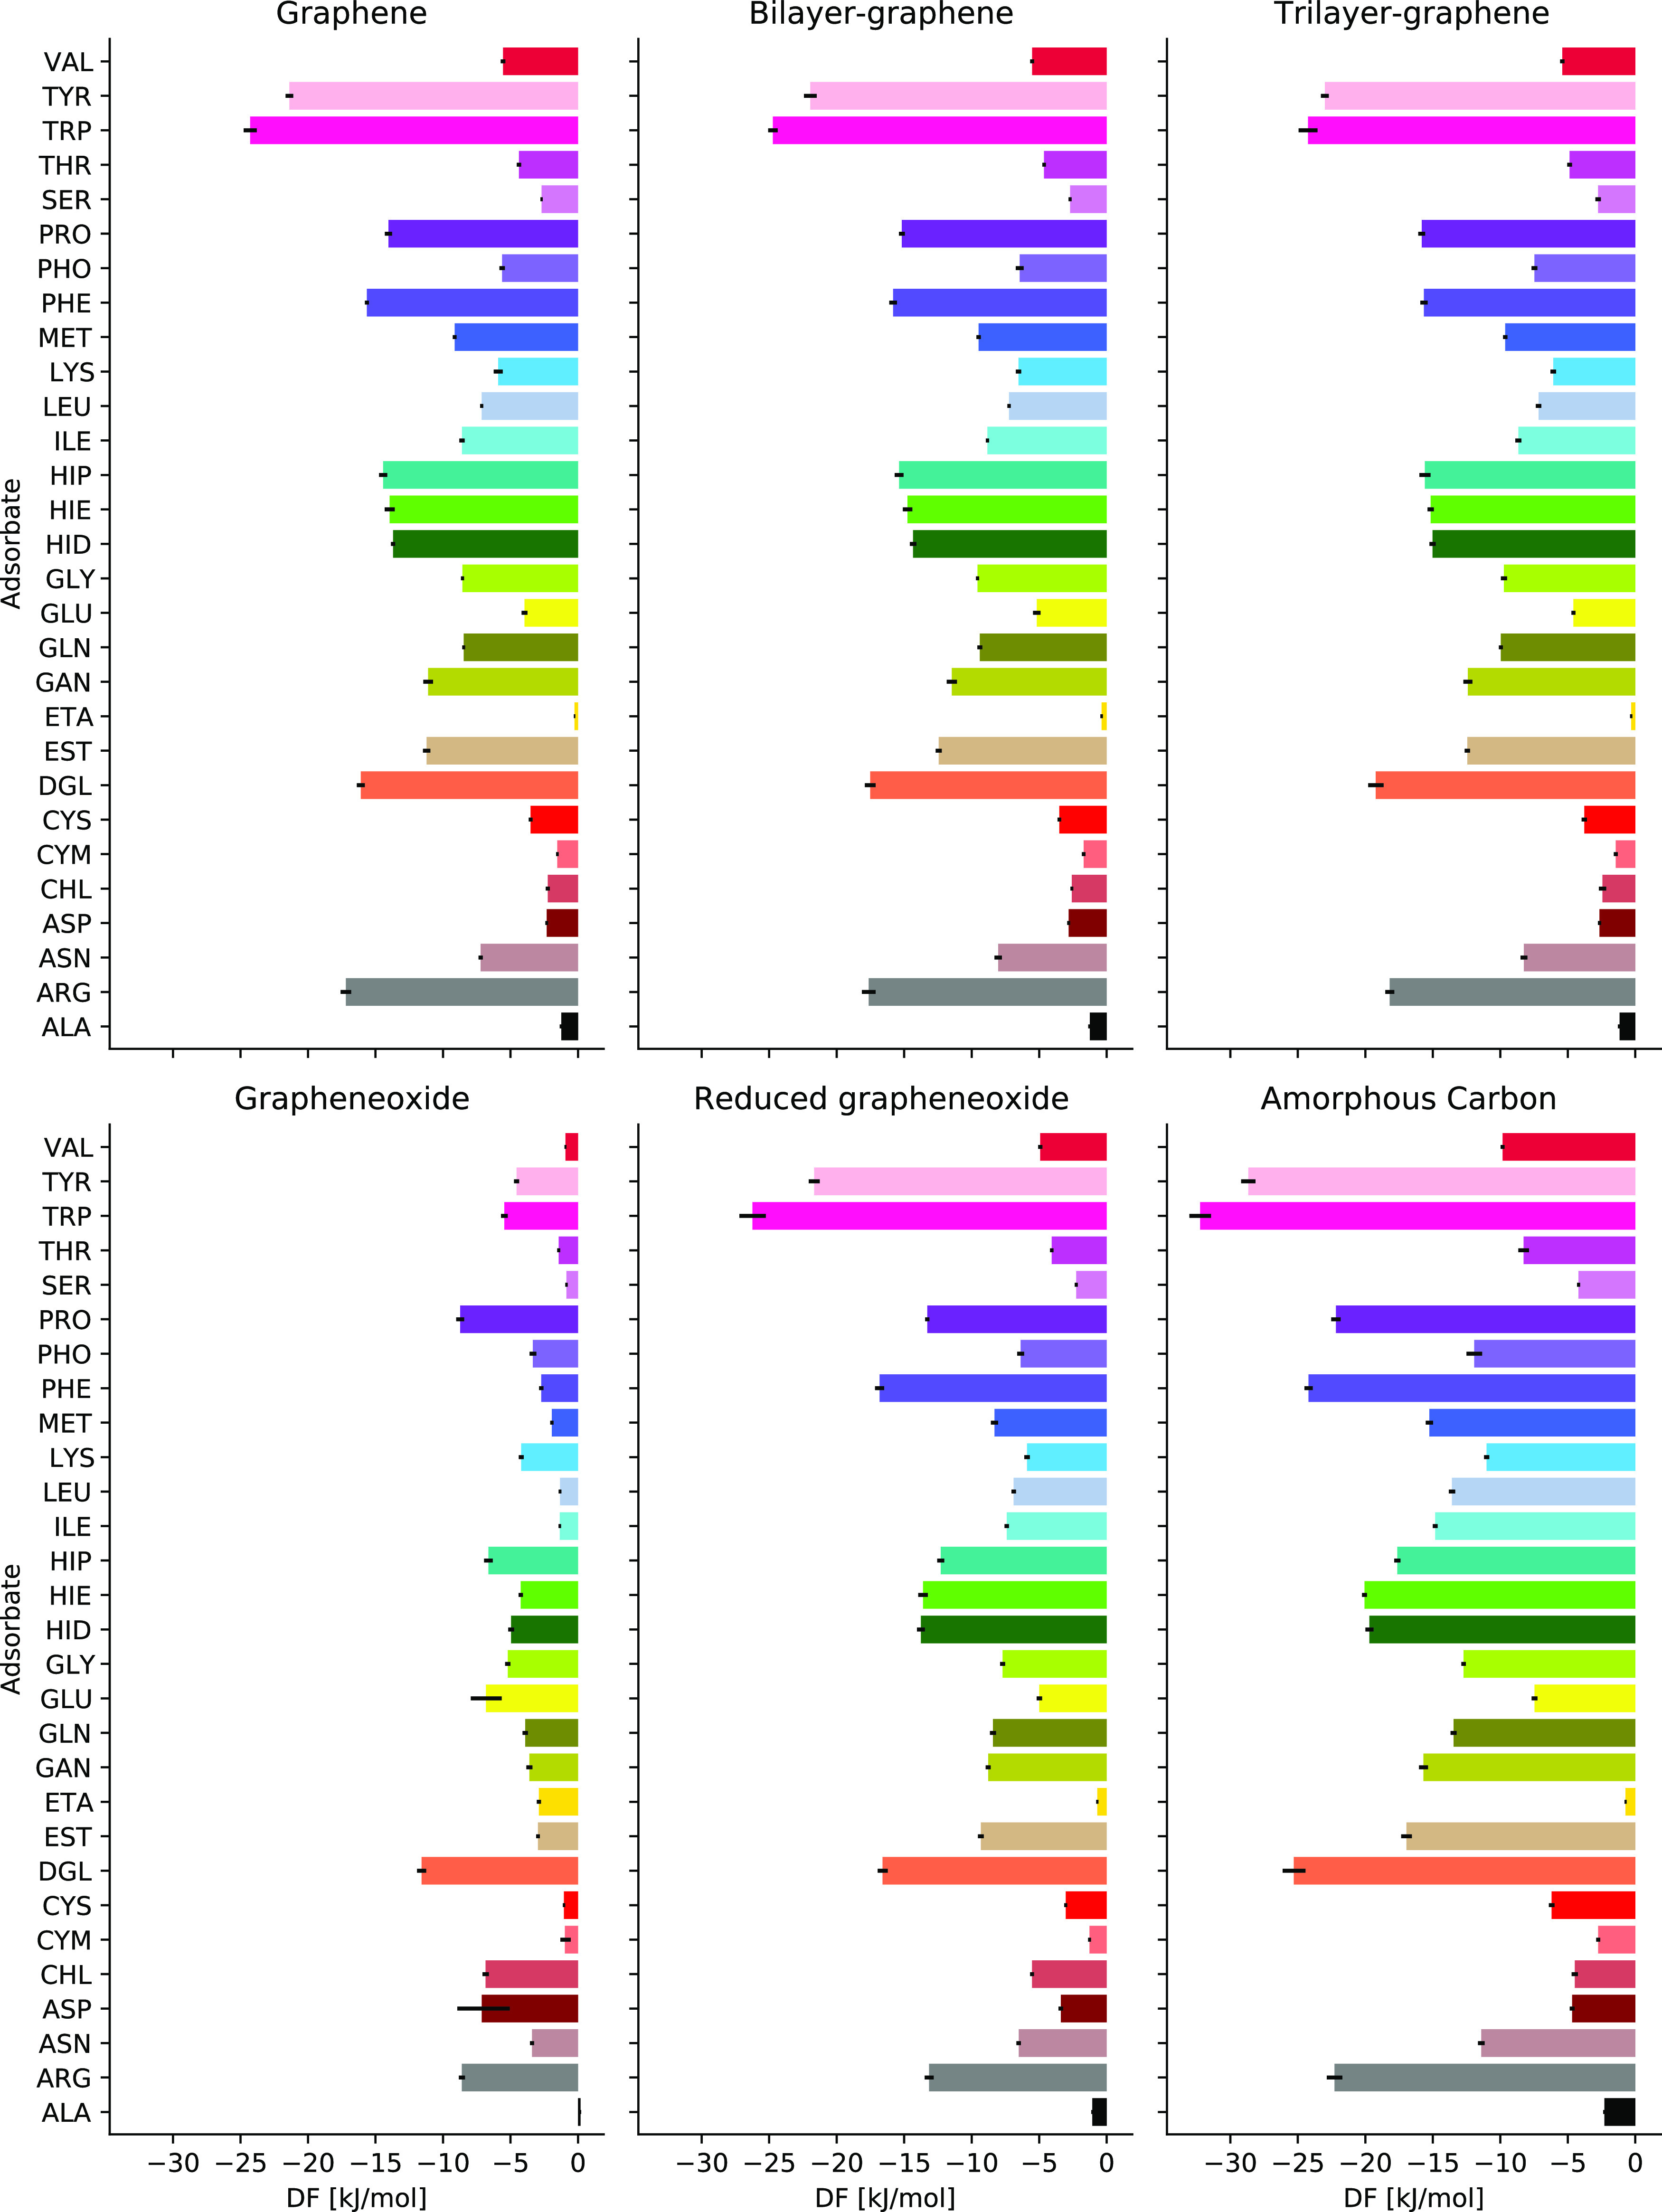
Binding free energies of different biomolecules on different carbon nanomaterials.
To analyze how the surface curvature could affect the adsorption of biomolecules on carbon nanomaterials, a comparison between the adsorption profile of biomolecules on graphene and pristine CNT has been made. As can be seen in Figure 2, the potentials of mean force along the SSD for biomolecules on graphene and pristine CNT are similar. Aromatic and cyclic fragments show deeper minima on graphene compared to the CNT. The binding free energy difference between graphene and CNT is TRP (−10.8 kJ mol–1), TYR (−8.0 kJ mol–1), PHE (−6.8 kJ mol–1), DGL (−6.1 kJ mol–1), ARG (−6.0 kJ mol–1), HID (−4.7 kJ mol–1 and similar values for HIE and HIP), and PRO (−4.0 kJ mol–1) while for other fragments, the difference is less than −2.0 kJ mol–1. The reason of this is that these biomolecules can lay flat on the graphene surface and form stronger π–π stacking interaction to the graphene surface compared to CNTs with a relatively high curvature. Surface curvature relation on bio-nanomaterial adsorption is further discussed in the Discussion part.
To understand the effect of layers in multiwalled CNTs on the interaction with biomaterials, we have investigated the interaction of biomolecules with bilayer and trilayer graphene models. As shown in Figure S2 of the Supporting Information, only a small increase (about −2 kJ mol–1) in the binding free energy was observed for aromatic and cyclic fragments on the three-layer graphene compared to single-layer.
Computations of PMF and binding free energies have been done also for three different samples of amorphous carbon. Comparison of PMF of biomolecules on amorphous carbon slabs with a graphene surface (Figure 5) shows similar adsorption profiles which differ mostly by a shift over SSD. Note that displacement of the PMFs to larger distances for ta-C slabs compared to graphene surface can be due to different ways of SSD measurement, while the shape of the profile is similar. Deringer et al.(43) showed that the surface of ta-C models has 70% similarity to the graphene surface. An almost similar adsorption profile has been observed for biomolecules on three different ta-C slabs, but shallower minima have been observed for PHE, TRP, and TYP biomolecules on one of the ta-C slabs compared to the other ones. This difference causes 5–12 kJ mol–1 changes in the binding free energy of PHE, TRP, and TYP biomolecules for one ta-C slab compared to the other ones (Figures 4 and S3).
Figure 5.
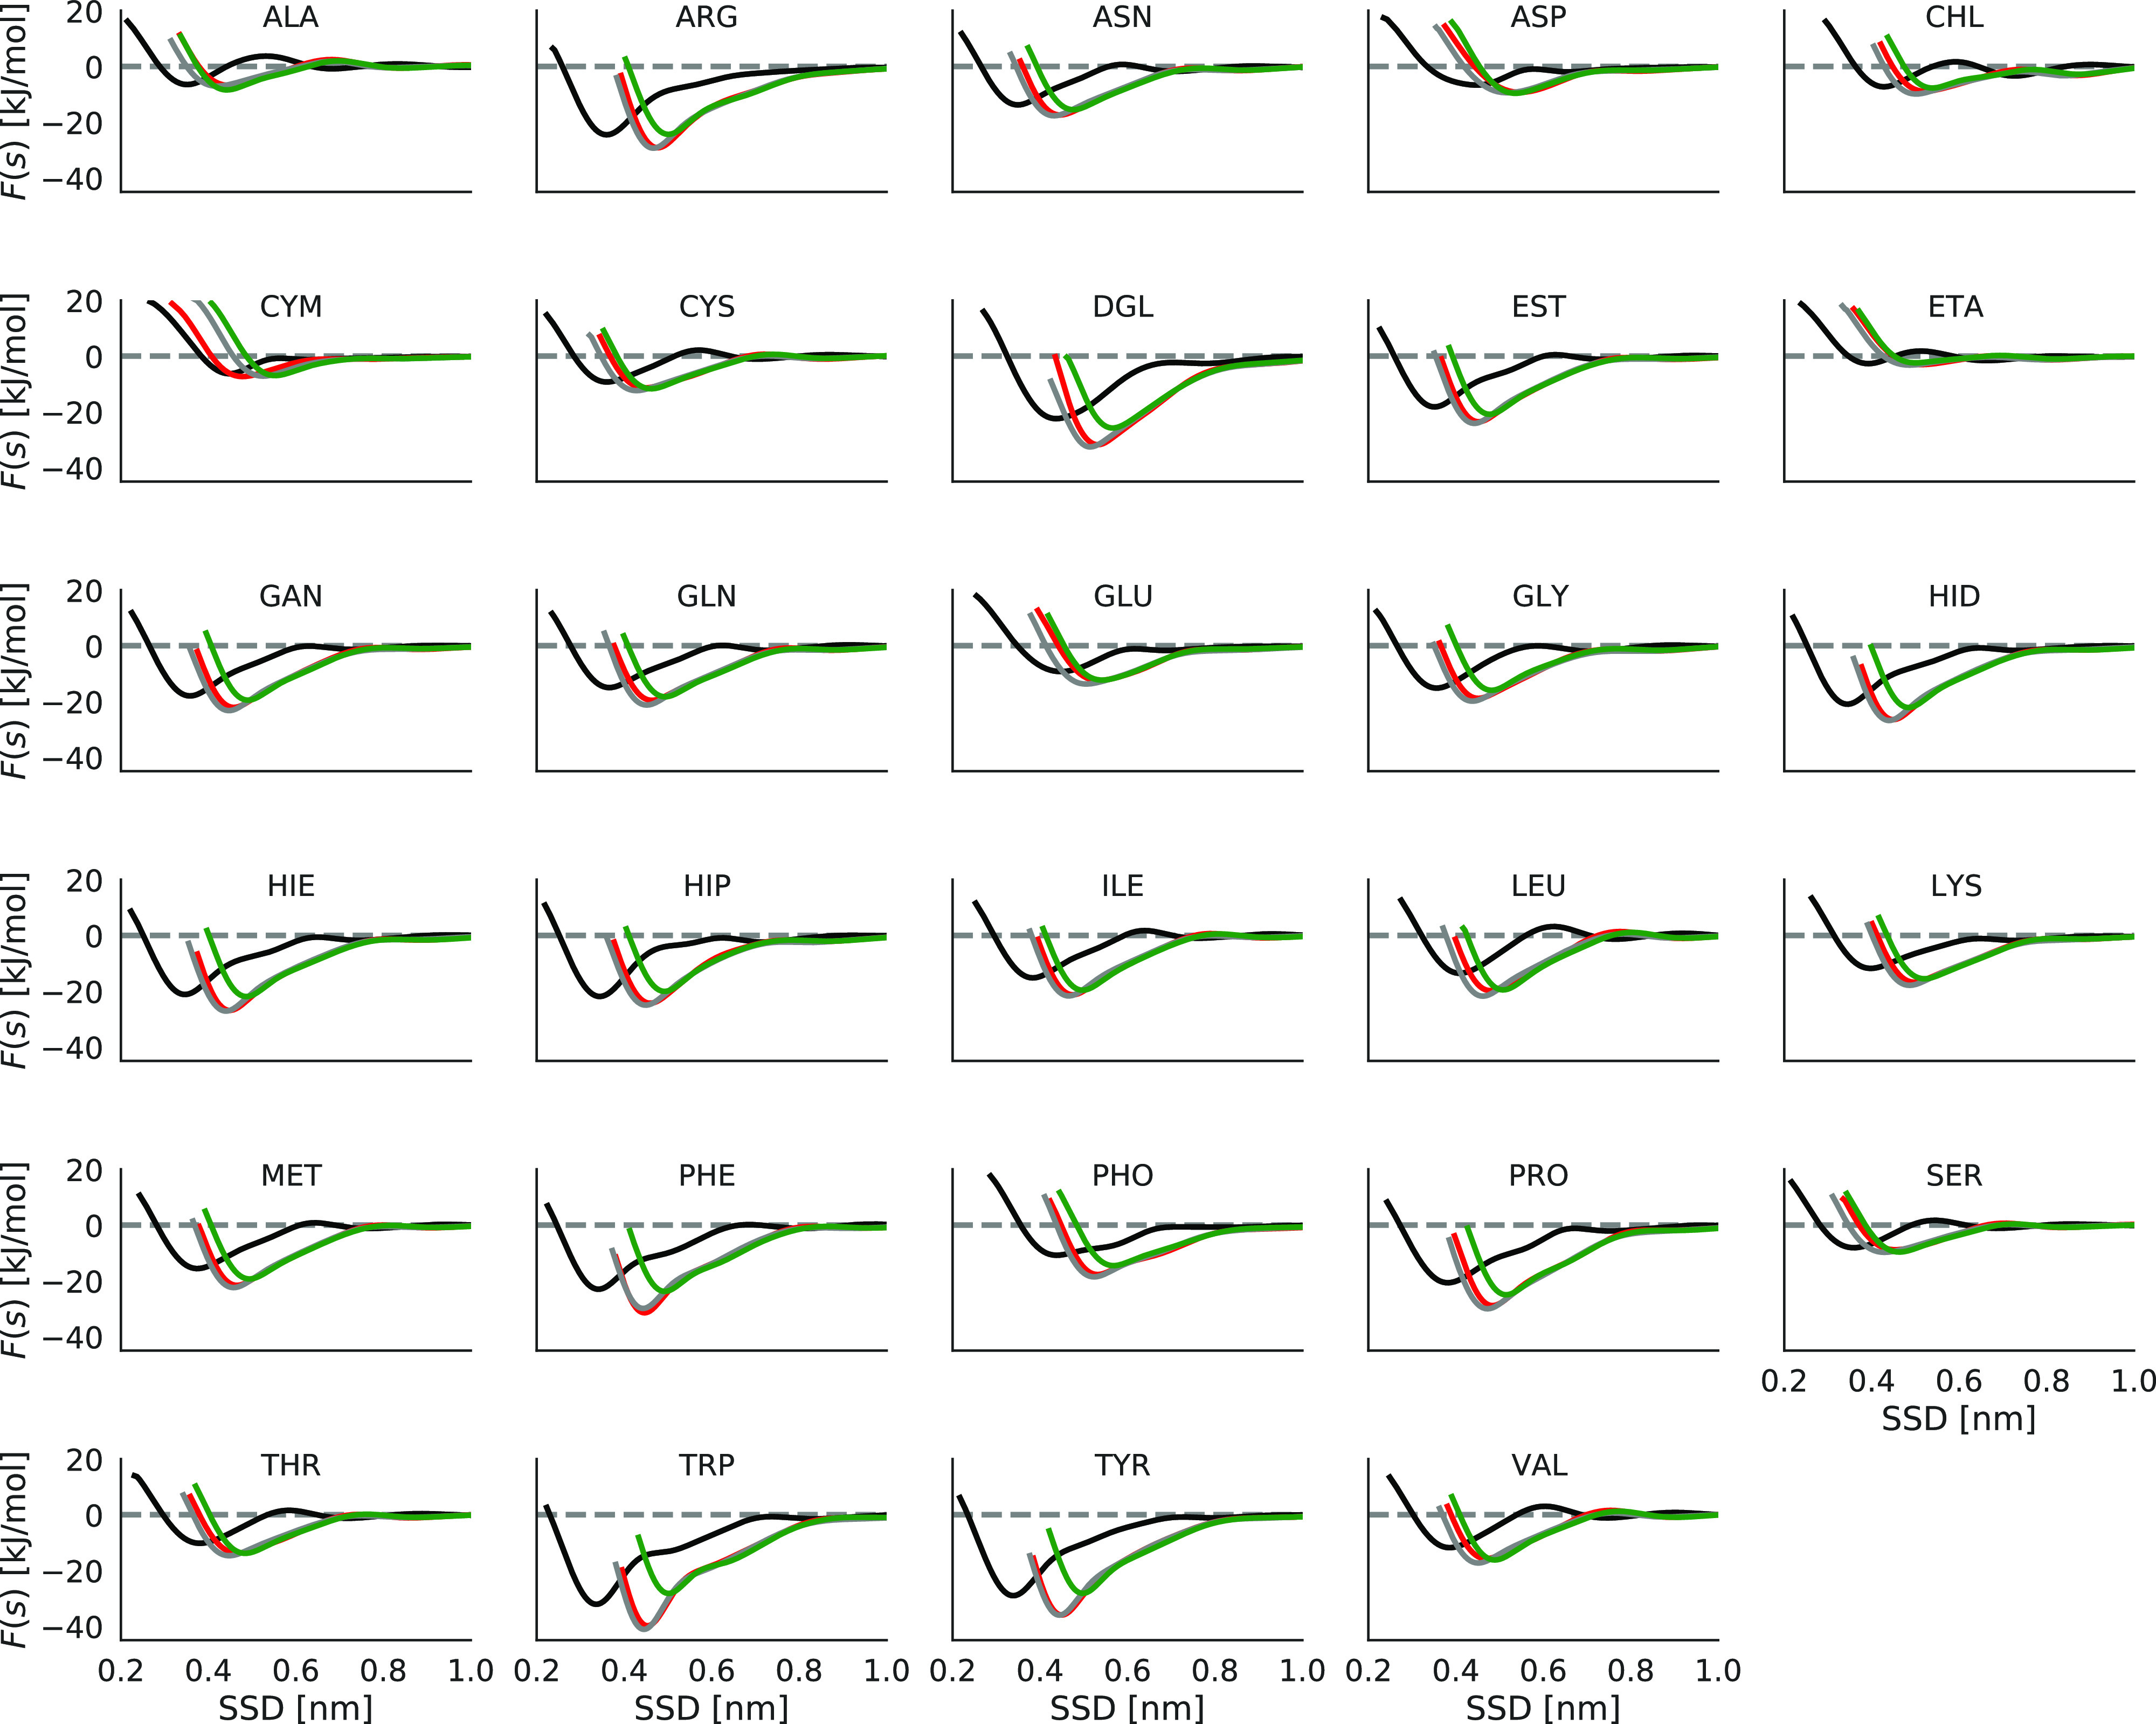
Adsorption profile of different biomolecules on graphene and different ta-C slabs. Surfaces are colored as follows. Black, graphene; red, green, and gray are three different ta-C slabs.
Adsorption of Biomolecules on Oxidized Graphene Surfaces
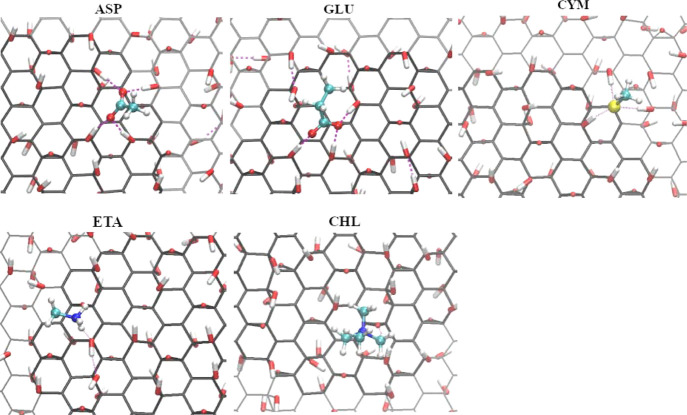
Because GO and rGO surfaces are functionalized by randomly distributed hydroxyl and epoxy groups, computations of the potential of mean force require longer simulation time to sample different binding regions and average interaction of the biomolecule over the surface. Therefore, we extended metadynamics simulation on GO and rGO to 600 ns and for some stronger binders to 1000 ns. As Figure 6 shows, there is a noticeable difference between the adsorption profile of biomolecules on GO and graphene surfaces while PMF of biomolecules on rGO is similar to that on the graphene surface. Our analysis shows that hydroxyl and epoxy groups form a hydrogen bond with water molecules which hinder biomolecules to be closer to the GO surface. For most of the biomolecules, the potential of mean force is shifted to the larger distances on GO compared to the graphene surface, and the free energy profile showed weaker binding than for pristine graphene. There are however several molecules, particularly GLU, ASP, CYM, CHL, and ETA which show stronger binding to GO than to pristine graphene and they can be found on closer distance to the surface compared to nonoxidized graphene. These molecules are able to form hydrogen bonds to epoxy and/or hydroxyl groups which are stronger than hydrogen bonds formed by water. Binding of these molecules at the GO surface with the formation of hydrogen bonds is shown in Figure 7.
Figure 6.
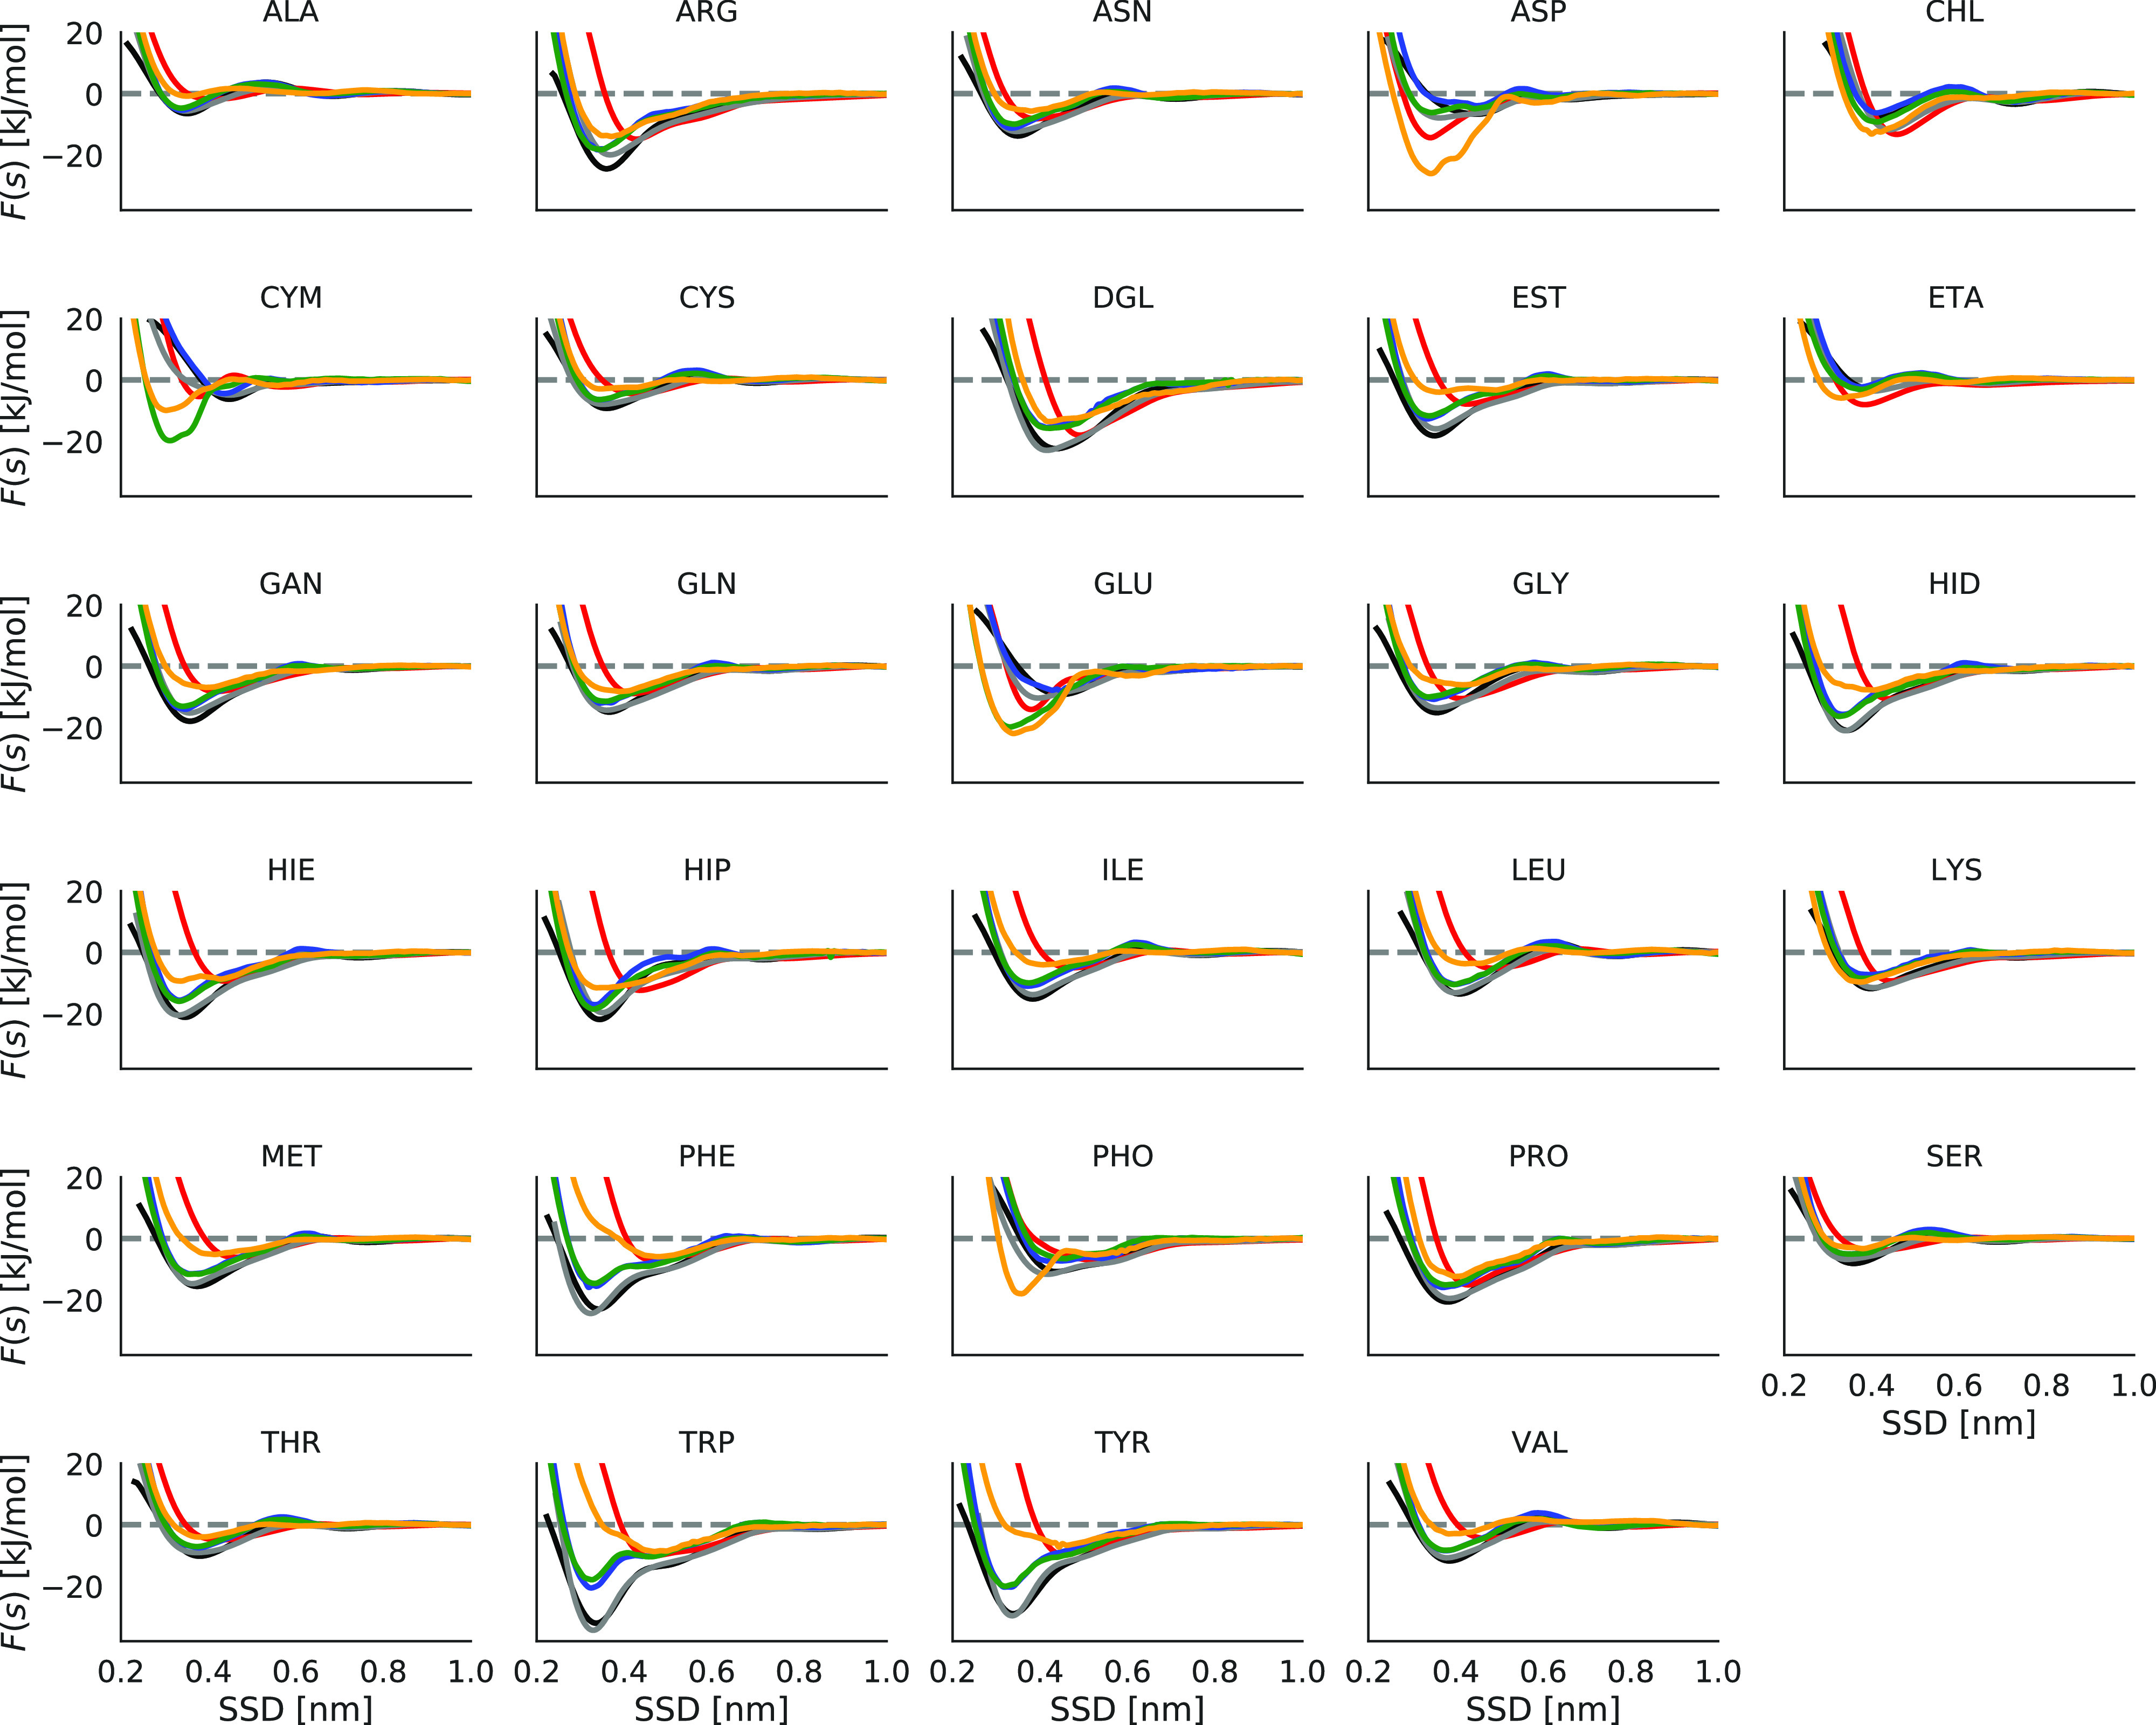
Adsorption profiles of different biomolecules on various carbon nanomaterial surfaces. Graphene is colored in black, graphene oxide in red, reduced graphene oxide in gray, pristine CNTs in blue, functionalized CNTs with low concentration (0.39 wt %) −OH in green, and functionalized CNTs with high concentration (14 wt %) −OH in orange.
Figure 7.
Molecular orientation of some charged biomolecules on the graphene oxide surface. Pictures were taken from the top view at 0.34 nm SSD for ASP, 0.35 nm SSD for GLU, 0.38 nm SSD for GLU, CYM, and ETA, and 0.46 nm SSD for CHL. Hydrogen bonds between charged biomolecules and surface are shown using the purple-dashed line.
Analyzing further how binding free energy is changed by functionalizing groups, we note that the presence of hydroxyl and epoxy groups on the GO surface leads to increase in the binding free energy of negatively charged ASP and GLU biomolecules but also of positively charged ETA and CHL lipid fragments. We can conclude that the presence of hydroxyl- and epoxy-functionalizing groups on the graphene surface makes it selective to groups with thr carboxylate group (GLU and ASP) or fragments with positively charged nitrogen (CHL and ETA).
Reduced graphene oxide has much lower density of epoxy and hydroxyl groups and larger areas of unmodified graphene. That is why most of the biomolecules bind to rGO in the same manner and with the same strength as to pristine graphene, as there is no hydrogen bound water in the patches of rGO without epoxy and hydroxyl groups. The molecules which showed stronger binding to GO also show somewhat stronger binding to rGO compared to graphene. The obvious reason for this is a smaller fraction of epoxy and hydroxyl groups to form hydrogen bonds with.
Adsorption of Biomolecules on Functionalized CNT Surfaces
Binding free energies of biomolecules to functionalized CNTs are collected in Figure 8. The corresponding PMF on hydroxyl-functionalized CNTs is shown in Figure 6 in comparison with other surfaces, and all other PMFs at functionalized CNTs are shown in Figure S4 of the Supporting Information. As can be seen, the adsorption of biomolecules is highly dependent on functionalizing groups, as well as on their concentration. By comparing the result of OH-functionalized CNTs with oxidized graphene surfaces (Figure 6), we can see that by increasing the OH concentration in both graphene and CNT surfaces, the PMF is shifted to the larger distances and cause weaker interaction with nanomaterial surfaces for most of the biomolecules (except for GLU and ASP), in a similar fashion as it was observed for GO in comparison with graphene. One can also see in many cases similarities in behavior of PMF at GO and high-density OH-functionalized CNTs.
Figure 8.
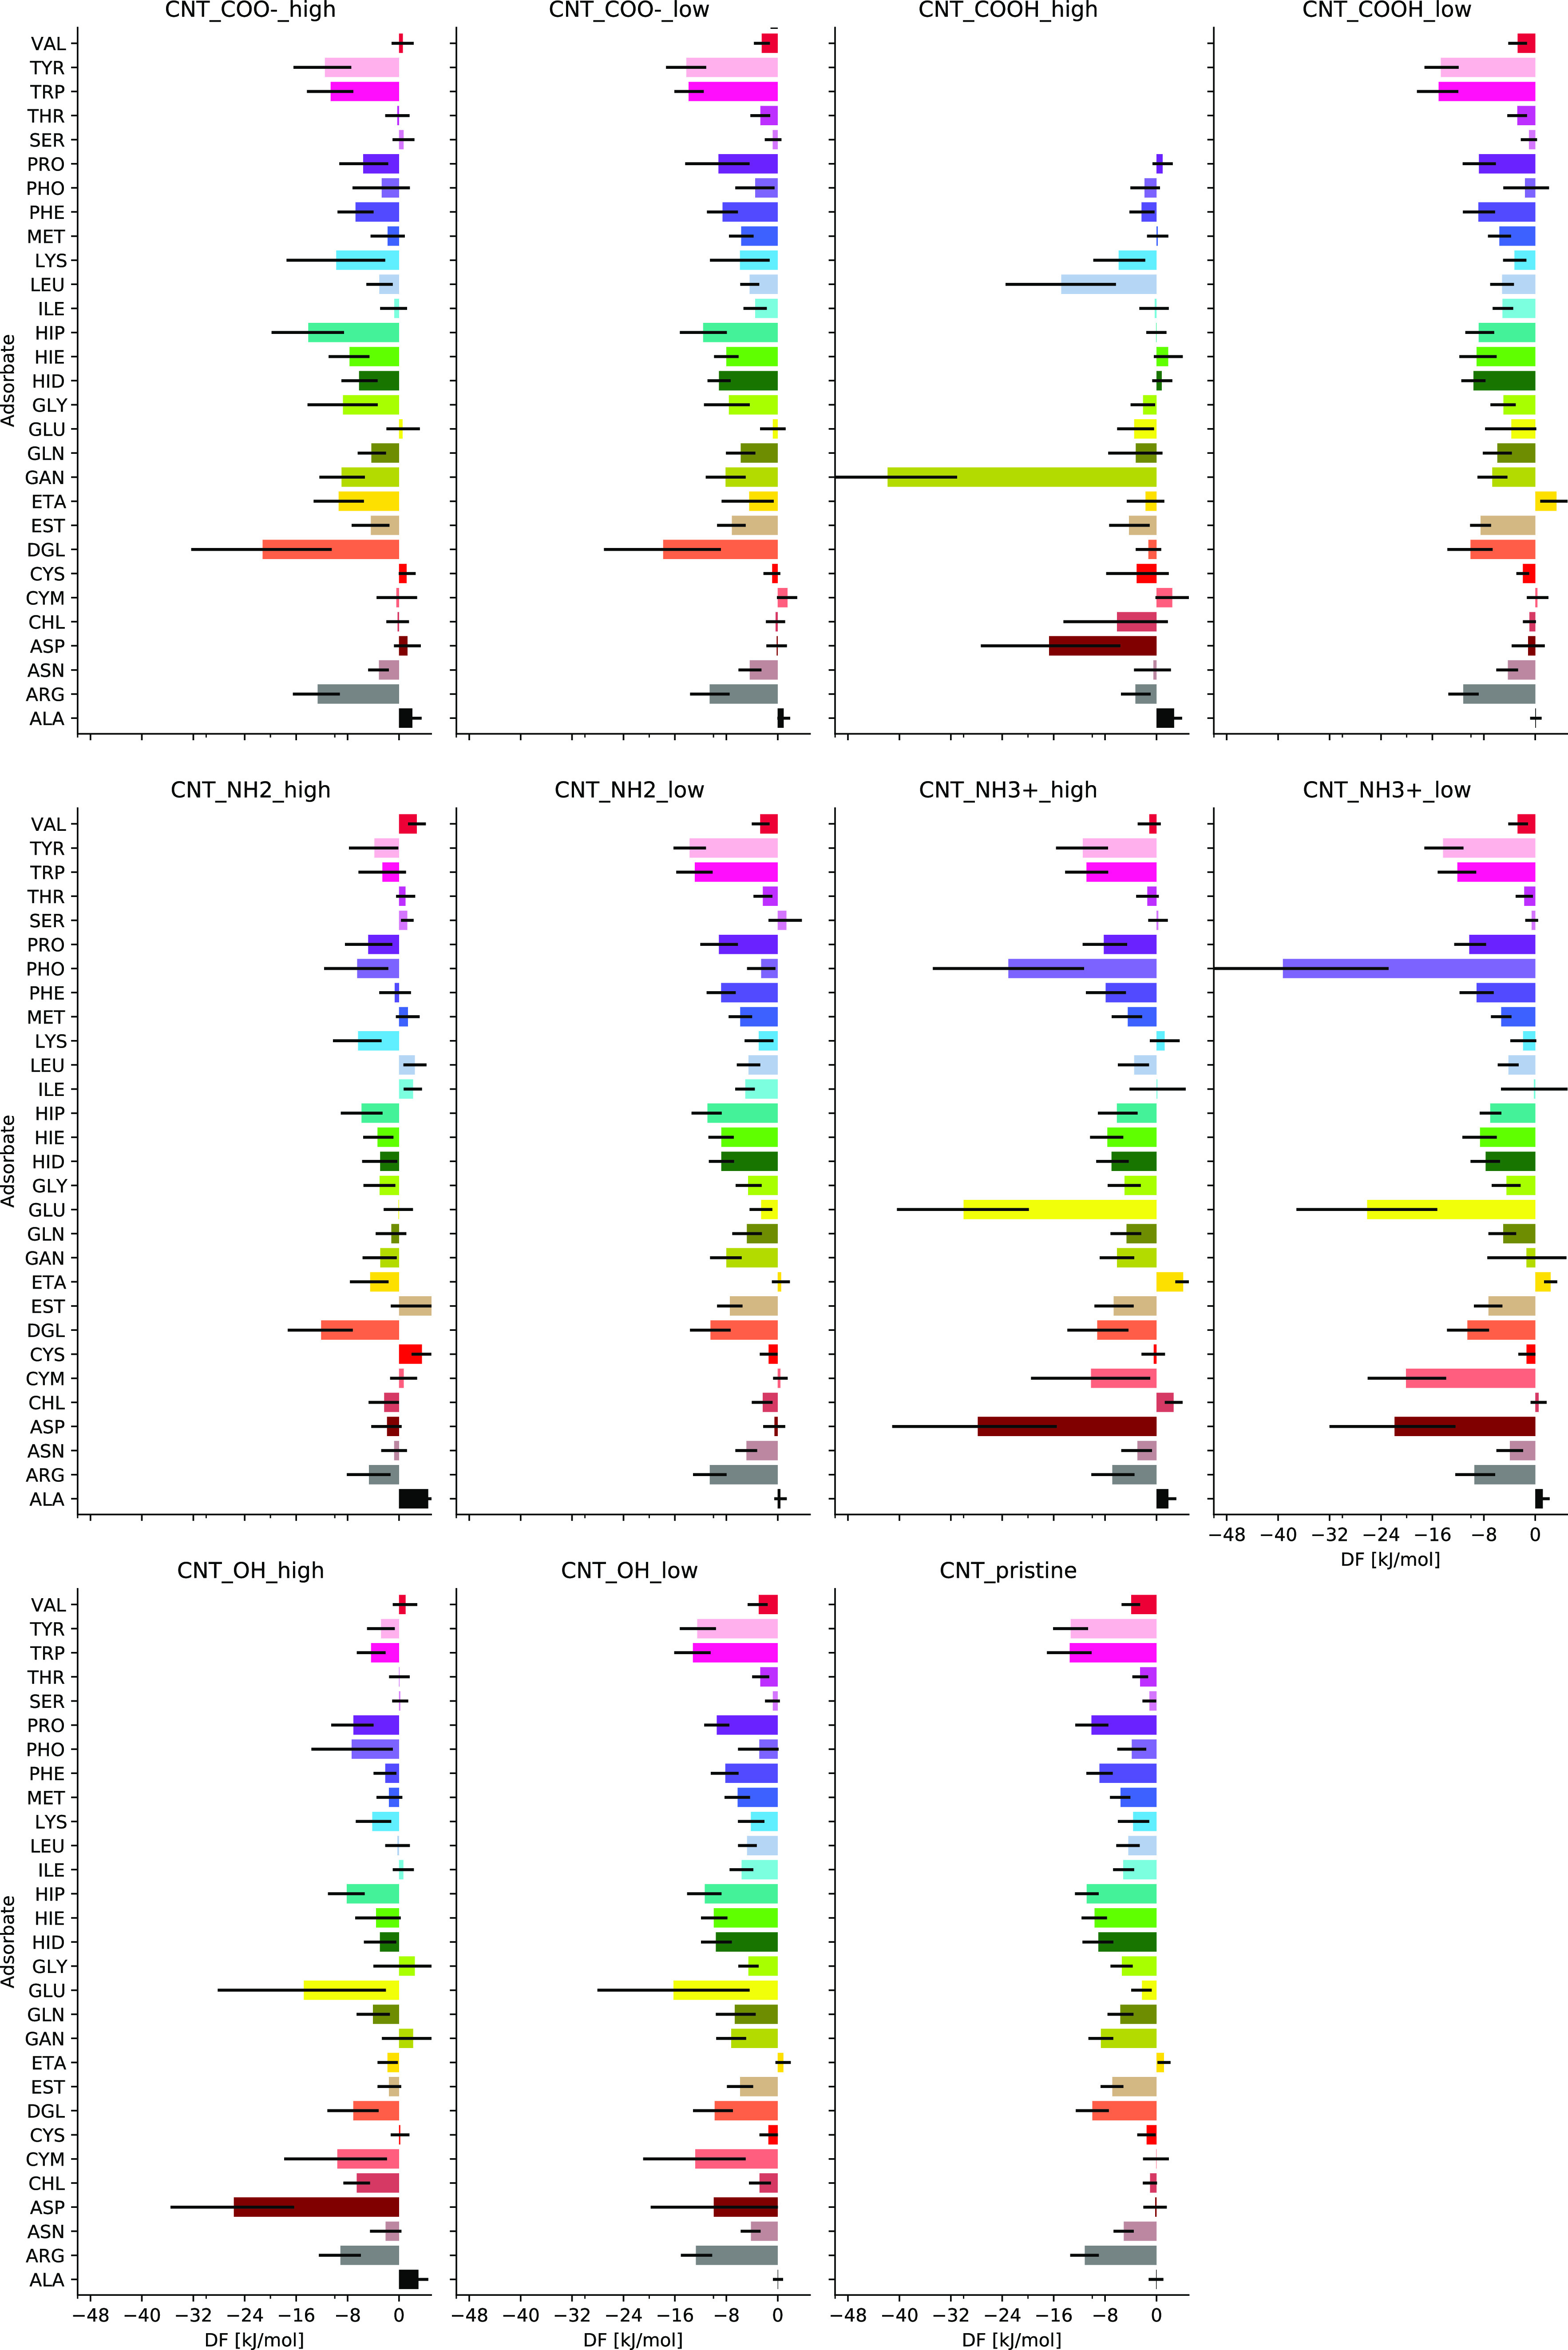
Binding free energies of different biomolecules on functionalized CNTs with different groups and concentrations.
Functionalizing CNTs with charged amino or carboxyl groups also affects binding to these surfaces. Charged molecules bind particularly strong and show a strong response to concentration. For example, PHO, GLU, and ASP with negative charges show stronger response to the concentration when the CNT is functionalized by −NH3+ compared to −NH2 or to pristine CNTs. Similarly, positively charged LYS, HIP (protonated histidine), and ARG bind stronger to the negatively charged −COO–-functionalized CNT. Thus, we can say that electrostatic interaction plays an important role in response of biomolecules to nanomaterial surfaces. Still, there are strong responses on CNT functionalization observed for neutral molecules or/and neutral functional groups. For example, d-glucose binds very strongly to both positive −NH3- and negative −COO–-functionalized CNTs, while GAN (neutral form of glutamine acid) binds strongly to COOH–-functionalized CNTs. These specific features of binding are determined by the possibility of forming hydrogen bonds between adsorbents and functional groups of CNTs. Concerning the effect of concentration of the functional group, in almost all cases, low-density functionalization shows response in the same direction as high-density functionalization but of lower magnitude. Values of adsorption free energies obtained at high and low density of functionalizing groups, as well as for pristine CNTs, can thus be used as a reference for interpolation for other values of density.
Discussion
Our results on the potentials of mean force for biomolecules at different carbon nanomaterials reveal that both the nanomaterial surface and chemical nature of biomolecules play key roles in the selective adsorption of biomolecules on the surface. To get more insight on how the chemical nature of molecules affect their binding abilities, we replotted the data on PMFs grouping amino acids into categories (polar, aromatic, hydrophobic, and charged) which is shown in Figure S5 of the Supporting Information. We can see that with increasing hydrophobicity in the nonpolar group, LEU and ILE bind at larger distances compared to ALA and they bind stronger to the graphene while weaker to the GO surface. With increasing polarity of biomolecules in the polar group, GLN and ASN bind stronger to the surface compared to the SER and THR. This selectivity is more noticeable on the graphene and ta-C compared to the GO surface. Biomolecules in the polar group are getting closer to the GO easier, without positive energy barrier, compared to graphene and ta-C surfaces. A larger aromatic amino acid, TRP, binds stronger compared to the other aromatic biomolecules on the graphene and ta-C while it does not show any distinguishable selectivity toward the GO surface. All aromatic amino acids have similar PMF profiles at the GO surface. Selective adsorption of ETA, ASP, and GLU on GO compared to the other members in the same basic or acidic groups has been observed. Water molecules can play profound roles in mediating biomolecular interactions. Figure 9 illustrates the role of water in the interaction of biomolecules with the carbon nanomaterials by showing binding configurations of amino acids in each category (polar, aromatic, etc.) to specific nanomaterials and hydrogen bonds formed between adsorbing molecules, surface, and water. Water molecules are repelled from the graphene surface because of impossibility to form hydrogen bonds to it, thus forming a dewetting layer above graphene that makes it easier for the aromatic (TRP) or nonpolar (ALA) molecules to get closer to the surface. For molecules with polar and charged groups, favorable hydrophilic and hydrogen-bond interactions between interfacial water molecules and biomolecule stabilize the latter at a larger distance to the graphene surface compared to the molecules representing nonpolar and aromatic categories.
Figure 9.
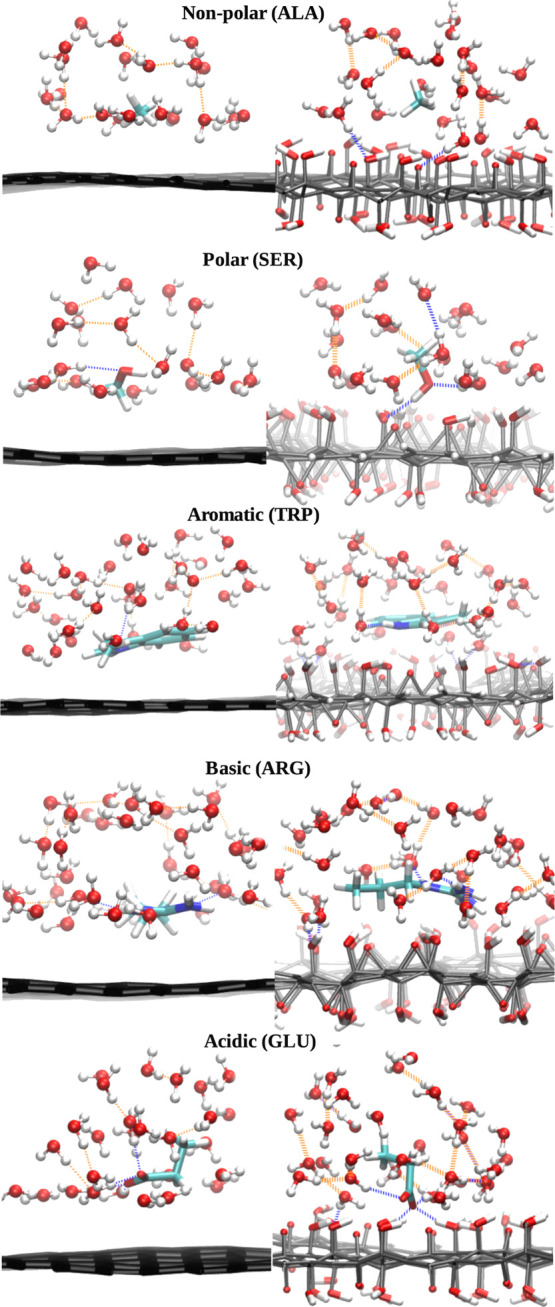
Representative configurations of absorbed biomolecules of each category (polar, aromatic, etc.) at the free-energy minimum on graphene (left) and graphene oxide (right). Distance between the center of mass of the adsorbing molecule and surface is 0.35 nm and 0.44 nm for ALA; 0.35 nm and 0.39 nm for SER; 0.34 nm and 0.42 nm for TRP; 0.35 nm and 0.42 nm for ARG; and 0.44 nm and 0.35 nm for GLU on graphene and graphene oxide, respectively. Hydrogen bonds between the absorbed biomolecules and carbon nanomaterial or water are shown in blue and the rest are in orange. Snapshots were taken by the funnel fast script developed for metadynamics simulation.66
When the surface is oxidized by hydroxyl groups, they form hydrogen bonds with water molecules which prevent biomolecules to get closer to the surface and dictate special orientation and conformation of biomolecules toward the surface (see, e.g., different orientations of SER and GLU on graphene and graphene oxide). The competing behavior of water with biomolecules for adsorption to the surface has been also reported by previous simulation works.72,73 For the acidic GLU biomolecule, water mediates the interaction of GLU to the graphene oxide surface by increasing the number of hydrogen bonds and stabilizes it at a closer distance to the surface compared to noncharged molecules. The effect of surface curvature on adsorption of biomolecules on nanomaterials is an often discussed question.74,75 Jana et al.(75) showed the strong dependence of polypeptide adsorption on the surface curvature of the carbon nanomaterial, with the inner (concave) surface of the CNT adsorbing the peptide most strongly, followed by the planar (graphene) surface, and the outer (convex) surface showing weaker binding. In our work, we have not studied a concave surface, but we addressed to the curvature effect by comparing biomolecule adsorption on graphene and CNT(11,11). Our results for PMF of aromatic molecules show deeper (up to 10 kJ/mol) minima on graphene compared to CNTs which is in line with the interaction trend discussed by Jana et al. Because we have studied the adsorption of individual amino acid fragments on carbon nanomaterials, the binding free energy difference between the graphene and CNT is much less than what Jana et al. have reported for the adsorption of peptides. The authors of ref (75) have also partitioned the interaction energy of the peptide with the nanosurface into contributions from different amino acids and showed that aliphatic and aromatic amino acid side chains react more distinctively to the surface curvature compared to other amino acid side chains. In addition, their QM calculations for benzene and toluene (aromatic representative) revealed 2–3 kcal/mol interaction energy difference on plane compared to convex carbon nanosurfaces. The corresponding value for ethane or methane (aliphatic representative) was reported about 1 kcal/mol and even less than 1 kcal/mol for other amino acid representatives. These conclusions in the energy difference for small molecules at planar and convex surfaces are well in agreement with our results.
Conclusions
In this work, we have used Metadynamics molecular dynamics simulations to study the adsorption behavior of a variety of biomolecules on carbon nanomaterial surfaces. We have computed potentials of mean force and binding free energies for 29 small molecules representing basic building blocks of biomolecules to each of 17 considered carbon-based nanosurfaces differing by morphology and functionalization. We have found that morphology of pure carbon materials affects adsorption behavior only slightly because potentials of mean force of the considered molecules in most of the cases were similar on graphene, multilayer graphene, pristine CNT, and amorphous carbon. Pure carbon nanomaterials were also found to be highly selective to molecules containing aromatic and cyclic moieties, which also show some dependence of binding on the curvature, while polar and charged molecules have generally low affinity to these surfaces. On the other hand, functionalization of surfaces by different groups affects the adsorption behavior of biomolecules very strongly. Particularly, charged biomolecules bind strongly via electrostatic interaction and show a strong response to density of the functionalizing groups on the surface. Possibility of the formation of a hydrogen bond to water and to adsorbing molecules as well as their competition is another factor affecting adsorption. For example, surfaces with a high fraction of polar groups, such as graphene oxide, show generally weaker binding of biomolecules than pristine carbon surfaces because of the water layer attached to these functional groups by hydrogen bonds. However, in some specific cases, polar or charges amino acids or lipid fragments show strong binding to such surfaces. Thus, the modification of carbon nanomaterial surfaces by different functionalizing groups can be used to tune highly selective binding of specific biomolecules to the nanomaterial. Data collected in this work can be used further as guidelines (and in the perspective as a data source for data-driven approaches) to, for example, design surfaces selective for adsorption of certain types of proteins, or to predict biocomplexation around nanoparticles taken up by living organisms in in silico schemes of toxicity assessment.
Acknowledgments
This work has been supported by the Horizon 2020 SmartNanoTox project and by the Swedish Research Council (Vetenkapsrådet, grant agreement 2017-03950). The computation was enabled by resources provided by the Swedish National Infrastructure for Computing (SNIC) at Parallel Data Centrum (PDC, Stockholm) and National Supercomputer Center (NSC, Linköping) partially funded by the Swedish Research Council through grant agreement no. 2018-05973.
Supporting Information Available
The Supporting Information is available free of charge at https://pubs.acs.org/doi/10.1021/acs.jpcb.0c08622.
The authors declare no competing financial interest.
Supplementary Material
References
- Li N.; Chen Z.; Ren W.; Li F.; Cheng H.-M. Flexible Graphene-Based Lithium Ion Batteries with Ultrafast Charge and Discharge Rates. Proc. Natl. Acad. Sci. U.S.A. 2012, 109, 17360–17365. 10.1073/pnas.1210072109. [DOI] [PMC free article] [PubMed] [Google Scholar]
- Feng L.; Wu L.; Qu X. New Horizons for Diagnostics and Therapeutic Applications of Graphene and Graphene Oxide. Adv. Mater. 2013, 25, 168–186. 10.1002/adma.201203229. [DOI] [PubMed] [Google Scholar]
- Huang J.; Zhang L.; Liang R.-P.; Qiu J.-D. “On-Off” Switchable Electrochemical Affinity Nanobiosensor Based on Graphene Oxide for Ultrasensitive Glucose Sensing. Biosens. Bioelectron. 2013, 41, 430–435. 10.1016/j.bios.2012.09.007. [DOI] [PubMed] [Google Scholar]
- Gao L.; Lian C.; Zhou Y.; Yan L.; Li Q.; Zhang C.; Chen L.; Chen K. Graphene Oxide–DNA Based Sensors. Biosens. Bioelectron. 2014, 60, 22–29. 10.1016/j.bios.2014.03.039. [DOI] [PubMed] [Google Scholar]
- Laurila T.; Sainio S.; Caro M. A. Hybrid Carbon Based Nanomaterials for Electrochemical Detection of Biomolecules. Prog. Mater. Sci. 2017, 88, 499–594. 10.1016/j.pmatsci.2017.04.012. [DOI] [Google Scholar]
- Yang K.; Feng L.; Shi X.; Liu Z. Nano-Graphene in Biomedicine: Theranostic Applications. Chem. Soc. Rev. 2013, 42, 530–547. 10.1039/c2cs35342c. [DOI] [PubMed] [Google Scholar]
- Zhang L.; Xia J.; Zhao Q.; Liu L.; Zhang Z. Functional Graphene Oxide as a Nanocarrier for Controlled Loading and Targeted Delivery of Mixed Anticancer Drugs. Small 2010, 6, 537–544. 10.1002/smll.200901680. [DOI] [PubMed] [Google Scholar]
- Guo X.; Mei N. Assessment of the Toxic Potential of Graphene Family Nanomaterials. J. Food Drug Anal. 2014, 22, 105–115. 10.1016/j.jfda.2014.01.009. [DOI] [PMC free article] [PubMed] [Google Scholar]
- Jana A. K.; Sengupta N. Adsorption Mechanism and Collapse Propensities of the Full-Length, Monomeric Aβ1-42 on the Surface of a Single-Walled Carbon Nanotube: A Molecular Dynamics Simulation Study. Biophys. J. 2012, 102, 1889–1896. 10.1016/j.bpj.2012.03.036. [DOI] [PMC free article] [PubMed] [Google Scholar]
- Zhu W.; von dem Bussche A.; Yi X.; Qiu Y.; Wang Z.; Weston P.; Hurt R. H.; Kane A. B.; Gao H. Nanomechanical Mechanism for Lipid Bilayer Damage Induced by Carbon Nanotubes Confined in Intracellular Vesicles. Proc. Natl. Acad. Sci. U.S.A. 2016, 113, 12374–12379. 10.1073/pnas.1605030113. [DOI] [PMC free article] [PubMed] [Google Scholar]
- Luan B.; Huynh T.; Zhao L.; Zhou R. Potential Toxicity of Graphene to Cell Functions via Disrupting Protein–Protein Interactions. ACS Nano 2015, 9, 663–669. 10.1021/nn506011j. [DOI] [PubMed] [Google Scholar]
- Seabra A. B.; Paula A. J.; de Lima R.; Alves O. L.; Durán N. Nanotoxicity of Graphene and Graphene Oxide. Chem. Res. Toxicol. 2014, 27, 159–168. 10.1021/tx400385x. [DOI] [PubMed] [Google Scholar]
- Yan L.; Zhao F.; Li S.; Hu Z.; Zhao Y. Low-Toxic and Safe Nanomaterials by Surface-Chemical Design, Carbon Nanotubes, Fullerenes, Metallofullerenes, and Graphenes. Nanoscale 2011, 3, 362–382. 10.1039/c0nr00647e. [DOI] [PubMed] [Google Scholar]
- Wu H.-C.; Chang X.; Liu L.; Zhao F.; Zhao Y. Chemistry of Carbon Nanotubes in Biomedical Applications. J. Mater. Chem. 2010, 20, 1036–1052. 10.1039/b911099m. [DOI] [Google Scholar]
- Saini B.; Srivastava S. Nanotoxicity Prediction using Computational Modelling-Review and Future Directions. IOP Conf. Ser.: Mater. Sci. Eng. 2018, 348, 012005. 10.1088/1757-899x/348/1/012005. [DOI] [Google Scholar]
- Burello E.; Worth A. P. QSAR Modeling of Nanomaterials. Wiley Interdiscip. Rev.: Nanomed. Nanobiotechnol. 2011, 3, 298–306. 10.1002/wnan.137. [DOI] [PubMed] [Google Scholar]
- Oksel C.; Ma C. Y.; Liu J. J.; Wilkins T.; Wang X. Z. (Q)SAR Modelling of Nanomaterial Toxicity: A Critical Review. Particuology 2015, 21, 1–19. 10.1016/j.partic.2014.12.001. [DOI] [Google Scholar]
- Chen R.; Zhang Y.; Sahneh F. D.; Scoglio C. M.; Wohlleben W.; Haase A.; Monteiro-Riviere N. A.; Riviere J. E. Nanoparticle Surface Characterization and Clustering through Concentration-Dependent Surface Adsorption Modeling. ACS Nano 2014, 8, 9446–9456. 10.1021/nn503573s. [DOI] [PubMed] [Google Scholar]
- Chen R.; Riviere J. E. Biological Surface Adsorption Index of Nanomaterials: Modelling Surface Interactions of Nanomaterials with Biomolecules. Adv. Exp. Med. Biol. 2017, 947, 207–253. 10.1007/978-3-319-47754-1_8. [DOI] [PubMed] [Google Scholar]
- Lynch I.; Salvati A.; Dawson K. A. What does the cell see?. Nat. Nanotechnol. 2009, 4, 546–547. 10.1038/nnano.2009.248. [DOI] [PubMed] [Google Scholar]
- Kim S. N.; Kuang Z.; Slocik J. M.; Jones S. E.; Cui Y.; Farmer B. L.; McAlpine M. C.; Naik R. R. Preferential Binding of Peptides to Graphene Edges and Planes. J. Am. Chem. Soc. 2011, 133, 14480–14483. 10.1021/ja2042832. [DOI] [PubMed] [Google Scholar]
- Zhang M.; Yin B.-C.; Wang X.-F.; Ye B.-C. Interaction of Peptides with Graphene Oxide and its Application for Real-Time Monitoring of Protease Activity. Chem. Commun. 2011, 47, 2399–2401. 10.1039/c0cc04887a. [DOI] [PubMed] [Google Scholar]
- Pandey R. B.; Kuang Z.; Farmer B. L.; Kim S. S.; Naik R. R. Stability of Peptide (P1 and P2) Binding to a Graphene Sheet via an All-Atom to All-Residue Coarse-Grained Approach. Soft Matter 2012, 8, 9101–9109. 10.1039/c2sm25870f. [DOI] [Google Scholar]
- De Miranda Tomásio S.; Walsh T. R. Atomistic Modelling of the Interaction Between Peptides and Carbon Nanotubes. Mol. Phys. 2007, 105, 221–229. 10.1080/00268970701197445. [DOI] [Google Scholar]
- Hughes Z. E.; Tomásio S. M.; Walsh T. R. Efficient Simulations of the Aqueous Bio-Interface of Graphitic Nanostructures with a Polarisable Model. Nanoscale 2014, 6, 5438–5448. 10.1039/c4nr00468j. [DOI] [PubMed] [Google Scholar]
- Comer J.; Chen R.; Poblete H.; Vergara-Jaque A.; Riviere J. E. Predicting Adsorption Affinities of Small Molecules on Carbon Nanotubes Using Molecular Dynamics Simulation. ACS Nano 2015, 9, 11761–11774. 10.1021/acsnano.5b03592. [DOI] [PubMed] [Google Scholar]
- Walsh T. R.; Tomasio S. M. Investigation of the Influence of Surface Defects on Peptide Adsorption onto Carbon Nanotubes. Mol. Biosyst. 2010, 6, 1707–1718. 10.1039/c003417g. [DOI] [PubMed] [Google Scholar]
- Milowska K. Z.; Majewski J. A. Functionalization of Carbon Nanotubes With -CHn, -NHn Fragments, -COOH and -OH Groups. J. Chem. Phys. 2013, 138, 194704. 10.1063/1.4804652. [DOI] [PubMed] [Google Scholar]
- Lara I. V.; Zanella I.; de Souza Filho A. G.; Binotto Fagan S. Influence of Concentration and Position of Carboxyl Groups on the Electronic Properties of Single-Walled Carbon Nanotubes. Phys. Chem. Chem. Phys. 2014, 16, 21602–21608. 10.1039/c4cp02225d. [DOI] [PubMed] [Google Scholar]
- Veloso M. V.; Souza Filho A. G.; Mendes Filho J.; Fagan S. B.; Mota R. Ab Initio Study of Covalently Functionalized Carbon Nanotubes. Chem. Phys. Lett. 2006, 430, 71–74. 10.1016/j.cplett.2006.08.082. [DOI] [Google Scholar]
- Afantitis A.; Melagraki G.; Tsoumanis A.; Valsami-Jones E.; Lynch I. A Nanoinformatics Decision Support Tool for the Virtual Screening of Gold Nanoparticle Cellular Association using Protein Corona Fingerprints. Nanotoxicology 2018, 12, 1148–1165. 10.1080/17435390.2018.1504998. [DOI] [PubMed] [Google Scholar]
- Power D.; Rouse I.; Poggio S.; Brandt E.; Lopez H.; Lyubartsev A.; Lobaskin V. A Multiscale Model of Protein Adsorption on a Nanoparticle Surface. Modell. Simul. Mater. Sci. Eng. 2019, 27, 084003. 10.1088/1361-651x/ab3b6e. [DOI] [Google Scholar]
- Wang J.; Wolf R. M.; Caldwell J. W.; Kollman P. A.; Case D. A. Development and Testing of a General Amber Force Field. J. Comput. Chem. 2004, 25, 1157–1174. 10.1002/jcc.20035. [DOI] [PubMed] [Google Scholar]
- Caleman C.; van Maaren P. J.; Hong M.; Hub J. S.; Costa L. T.; van der Spoel D. Force Field Benchmark of Organic Liquids: Density, Enthalpy of Vaporization, Heat Capacities, Surface Tension, Isothermal Compressibility, Volumetric Expansion Coefficient, and Dielectric Constant. J. Chem. Theory Comput. 2012, 8, 61–74. 10.1021/ct200731v. [DOI] [PMC free article] [PubMed] [Google Scholar]
- Zhu S. Validation of the Generalized Force Fields GAFF, CGenFF, OPLS-AA, and PRODRGFF by Testing Against Experimental Osmotic Coefficient Data for Small Drug-Like Molecules. J. Chem. Inf. Model. 2019, 59, 4239–4247. 10.1021/acs.jcim.9b00552. [DOI] [PubMed] [Google Scholar]
- Camden A. N.; Barr S. A.; Berry R. J. Simulations of peptide-graphene interactions in explicit water. J. Phys. Chem. B 2013, 117, 10691–10697. 10.1021/jp403505y. [DOI] [PubMed] [Google Scholar]
- Wu Y.; Aluru N. R. Graphitic carbon–water nonbonded interaction parameters. J. Phys. Chem. B 2013, 117, 8802–8813. 10.1021/jp402051t. [DOI] [PubMed] [Google Scholar]
- Wang J.; Wang W.; Kollman P. A.; Case D. A. Automatic Atom Type and Bond Type Perception in Molecular Mechanical Calculations. J. Mol. Graphics Modell. 2006, 25, 247–260. 10.1016/j.jmgm.2005.12.005. [DOI] [PubMed] [Google Scholar]
- Sousa da Silva A. W.; Vranken W. F. Acpype - Antechamber Python Parser Interface. BMC Res. Notes 2012, 5, 367. 10.1186/1756-0500-5-367. [DOI] [PMC free article] [PubMed] [Google Scholar]
- Kinchen J. M.; Ravichandran K. S. Phagosome Maturation: Going Through the Acid Test. Nat. Rev. Mol. Cell Biol. 2008, 9, 781–795. 10.1038/nrm2515. [DOI] [PMC free article] [PubMed] [Google Scholar]
- Jakalian A.; Jack D. B.; Bayly C. I. Fast, Efficient Generation of High-Quality Atomic Charges. AM1-BCC Model: II. Parameterization and Validation. J. Comput. Chem. 2002, 23, 1623–1641. 10.1002/jcc.10128. [DOI] [PubMed] [Google Scholar]
- Manz T. A.; Limas N. G. Introducing DDEC6 Atomic Population Analysis: Part 1. Charge Partitioning Theory and Methodology. RSC Adv. 2016, 6, 47771–47801. 10.1039/c6ra04656h. [DOI] [PMC free article] [PubMed] [Google Scholar]
- Deringer V. L.; Caro M. A.; Jana R.; Aarva A.; Elliott S. R.; Laurila T.; Csányi G.; Pastewka L. Computational Surface Chemistry of Tetrahedral Amorphous Carbon by Combining Machine Learning and Density Functional Theory. Chem. Mater. 2018, 30, 7438–7445. 10.1021/acs.chemmater.8b02410. [DOI] [Google Scholar]
- Li J. AtomEye: An Efficient Atomistic Configuration Viewer. Modell. Simul. Mater. Sci. Eng. 2003, 11, 173. 10.1088/0965-0393/11/2/305. [DOI] [Google Scholar]
- Brandt E. G.; Lyubartsev A. P. Molecular Dynamics Simulations of Adsorption of Amino Acid Side Chain Analogues and a Titanium Binding Peptide on the TiO2 (100) Surface. J. Phys. Chem. C 2015, 119, 18126–18139. 10.1021/acs.jpcc.5b02670. [DOI] [Google Scholar]
- Abraham M. J.; Murtola T.; Schulz R.; Páll S.; Smith J. C.; Hess B.; Lindahl E. GROMACS: High Performance Molecular Simulations Through Multi-Level Parallelism from Laptops to Supercomputers. SoftwareX 2015, 1-2, 19–25. 10.1016/j.softx.2015.06.001. [DOI] [Google Scholar]
- Stolten D.Hydrogen and Fuel Cells: Fundamentals, Technologies and Applications; John Wiley & Sons, 2010. [Google Scholar]
- Shan Y.; Li Y.; Huang D.; Tong Q.; Yao W.; Liu W.-T.; Wu S. Stacking Symmetry Governed Second Harmonic Generation in Graphene Trilayers. Sci. Adv. 2018, 4, eaat0074 10.1126/sciadv.aat0074. [DOI] [PMC free article] [PubMed] [Google Scholar]
- Motevalli B.; Parker A. J.; Sun B.; Barnard A. S. The Representative Structure of Graphene Oxide Nanoflakes from Machine Learning. Nano Futures 2019, 3, 045001. 10.1088/2399-1984/ab58ac. [DOI] [Google Scholar]
- Motevalli B.; Sun B.; Barnard A. S. Understanding and Predicting the Cause of Defects in Graphene Oxide Nanostructures Using Machine Learning. J. Phys. Chem. C 2020, 124, 7404–7413. 10.1021/acs.jpcc.9b10615. [DOI] [Google Scholar]
- Lerf A.; He H.; Forster M.; Klinowski J. Structure of Graphite Oxide Revisited. J. Phys. Chem. B 1998, 102, 4477–4482. 10.1021/jp9731821. [DOI] [Google Scholar]
- Compton O. C.; Nguyen S. T. Graphene Oxide, Highly Reduced Graphene Oxide, and Graphene: Versatile Building Blocks for Carbon-Based Materials. Small 2010, 6, 711–723. 10.1002/smll.200901934. [DOI] [PubMed] [Google Scholar]
- Stobinski L.; Lesiak B.; Malolepszy A.; Mazurkiewicz M.; Mierzwa B.; Zemek J.; Jiricek P.; Bieloshapka I. Graphene Oxide and Reduced Graphene Oxide Studied by the XRD, TEM and Electron Spectroscopy Methods. J. Electron Spectrosc. Relat. Phenom. 2014, 195, 145–154. 10.1016/j.elspec.2014.07.003. [DOI] [Google Scholar]
- Dreyer D. R.; Park S.; Bielawski C. W.; Ruoff R. S. The Chemistry of Graphene Oxide. Chem. Soc. Rev. 2010, 39, 228–240. 10.1039/b917103g. [DOI] [PubMed] [Google Scholar]
- Mkhoyan K. A.; Contryman A. W.; Silcox J.; Stewart D. A.; Eda G.; Mattevi C.; Miller S.; Chhowalla M. Atomic and Electronic Structure of Graphene-Oxide. Nano Lett. 2009, 9, 1058–1063. 10.1021/nl8034256. [DOI] [PubMed] [Google Scholar]
- Deringer V. L.; Csányi G. Machine Learning Based Interatomic Potential for Amorphous Carbon. Phys. Rev. B 2017, 95, 094203. 10.1103/physrevb.95.094203. [DOI] [Google Scholar]
- Caro M. A.; Csányi G.; Laurila T.; Deringer V. L. Machine Learning Driven Simulated Deposition of Carbon Films: From Low-Density to Diamondlike Amorphous Carbon. Phys. Rev. B 2020, 102, 174201. 10.1103/physrevb.102.174201. [DOI] [Google Scholar]
- Hagberg A.; Swart P.; S Chult D.. Exploring Network Structure, Dynamics, and Function Using NetworkX. Conference: SCIPY 08; August 21, 2008; Pasadena, 2008.
- Martínez L.; Andrade R.; Birgin E. G.; Martínez J. M. Packmol: A Package for Building Initial Configurations for Molecular Dynamics Simulations. J. Comput. Chem. 2009, 30, 2157–2164. 10.1002/jcc.21224. [DOI] [PubMed] [Google Scholar]
- Laio A.; Parrinello M. Escaping Free-Energy Minima. Proc. Natl. Acad. Sci. U.S.A. 2002, 99, 12562–12566. 10.1073/pnas.202427399. [DOI] [PMC free article] [PubMed] [Google Scholar]
- Casiraghi C.; Ferrari A. C.; Robertson J. The Smoothness of Tetrahedral Amorphous Carbon. Diam. Relat. Mater. 2005, 14, 913–920. 10.1016/j.diamond.2005.01.023. [DOI] [Google Scholar]
- Tribello G. A.; Bonomi M.; Branduardi D.; Camilloni C.; Bussi G. PLUMED 2: New Feathers for An Old Bird. Comput. Phys. Commun. 2014, 185, 604–613. 10.1016/j.cpc.2013.09.018. [DOI] [Google Scholar]
- Cuendet M. A.; Tuckerman M. E. Free Energy Reconstruction from Metadynamics or Adiabatic Free Energy Dynamics Simulations. J. Chem. Theory Comput. 2014, 10, 2975–2986. 10.1021/ct500012b. [DOI] [PubMed] [Google Scholar]
- Branduardi D.; Bussi G.; Parrinello M. Metadynamics with Adaptive Gaussians. J. Chem. Theory Comput. 2012, 8, 2247–2254. 10.1021/ct3002464. [DOI] [PubMed] [Google Scholar]
- Agosta L.; Brandt E. G.; Lyubartsev A. Improved Sampling in Ab Initio Free Energy Calculations of Biomolecules at Solid–Liquid Interfaces: Tight-Binding Assessment of Charged Amino Acids on TiO2 Anatase (101). Computation 2020, 8, 12. 10.3390/computation8010012. [DOI] [Google Scholar]
- Raniolo S.; Limongelli V. Ligand Binding Free-Energy Calculations with Funnel Metadynamics. Nat. Protoc. 2020, 15, 2837–2866. 10.1038/s41596-020-0342-4. [DOI] [PubMed] [Google Scholar]
- Wei Y.; Latour R. A. Determination of the Adsorption Free Energy for Peptide-Surface Interactions by SPR Spectroscopy. Langmuir 2008, 24, 6721–6729. 10.1021/la8005772. [DOI] [PMC free article] [PubMed] [Google Scholar]
- Bussi G.; Donadio D.; Parrinello M. Canonical Sampling through Velocity Rescaling. J. Chem. Phys. 2007, 126, 014101. 10.1063/1.2408420. [DOI] [PubMed] [Google Scholar]
- Essmann U.; Perera L.; Berkowitz M. L.; Darden T.; Lee H.; Pedersen L. G. A Smooth Particle Mesh Ewald Method. J. Chem. Phys. 1995, 103, 8577–8593. 10.1063/1.470117. [DOI] [Google Scholar]
- Zhou R.Modeling of Nanotoxicity; Springer, 2015. [Google Scholar]
- Katoch J.; Kim S. N.; Kuang Z.; Farmer B. L.; Naik R. R.; Tatulian S. A.; Ishigami M. Structure of a Peptide Adsorbed on Graphene and Graphite. Nano Lett. 2012, 12, 2342–2346. 10.1021/nl300286k. [DOI] [PubMed] [Google Scholar]
- Trudeau T. G.; Hore D. K. Hydrophobic Amino Acid Adsorption on Surfaces of Varying Wettability. Langmuir 2010, 26, 11095–11102. 10.1021/la100716z. [DOI] [PubMed] [Google Scholar]
- Zhao D.; Peng C.; Zhou J. Lipase Adsorption on Different Nanomaterials: A Multi-Scale Simulation Study. Phys. Chem. Chem. Phys. 2015, 17, 840–850. 10.1039/c4cp04696j. [DOI] [PubMed] [Google Scholar]
- Mesarič T.; Baweja L.; Drašler B.; Drobne D.; Makovec D.; Dušak P.; Dhawan A.; Sepčić K. Effects of surface curvature and surface characteristics of carbon-based nanomaterials on the adsorption and activity of acetylcholinesterase. Carbon 2013, 62, 222–232. 10.1016/j.carbon.2013.05.060. [DOI] [Google Scholar]
- Jana A. K.; Tiwari M. K.; Vanka K.; Sengupta N. Unraveling Origins of the Heterogeneous Curvature Dependence of Polypeptide Interactions with Carbon Nanostructures. Phys. Chem. Chem. Phys. 2016, 18, 5910–5924. 10.1039/c5cp04675k. [DOI] [PubMed] [Google Scholar]
Associated Data
This section collects any data citations, data availability statements, or supplementary materials included in this article.


