Abstract
With very large sample sizes, biobanks provide an exciting opportunity to identify genetic components of complex traits. To analyze rare variants, region-based multiple variant aggregate tests are commonly used to increase power for association tests. However, due to the substantial computation cost, existing region-based tests cannot analyze hundreds of thousands of samples while accounting for confounders, such as population stratification and sample relatedness. Here we propose a scalable generalized mixed model region-based association test, SAIGE-GENE, which is applicable to exome-wide and genome-wide region-based analysis for hundreds of thousands of samples and can account for unbalanced case-control ratios for binary traits. Through the extensive simulation studies and analysis of the HUNT study with 69,716 Norwegian samples and the UK Biobank data with 408,910 White British samples, we show that SAIGE-GENE can efficiently analyze large sample data (N > 400,000) with type I error rates well controlled.
Introduction
In recent years, large cohort studies and biobanks, such as Trans-Omics for Precision Medicine (TOPMed) study1 and UK Biobank2, have sequenced or genotyped hundreds of thousands of samples, which are invaluable resources to identify genetic components of complex traits, including rare variants (minor allele frequency (MAF) < 1%). It is well known that single variant tests are underpowered to identify trait-associated rare variants3. Gene- or region-based tests, such as Burden test, SKAT4 and SKAT-O5, can be more powerful by grouping rare variants into functional units, i.e. genes. To adjust for both population structure and sample relatedness, gene-based tests have been extended to mixed models6. For example, EmmaX7 based SKAT4 approaches (EmmaX-SKAT) have been implemented and used for many rare variant association studies including TOPMed1,8. The generalized linear mixed model gene-based test, SMMAT, has been recently developed6. However, these approaches require O(N3) computation time and O(N2) memory usages, where N is the sample size, which are not scalable to large datasets.
Here, we propose a novel method called SAIGE-GENE for region-based association analysis that is capable of handling very large samples (> 400,000 individuals), while inferring and accounting for sample relatedness. SAIGE-GENE is an extension of the previously developed single variant association method, SAIGE9, with a modification suitable to rare variants. Same as SAIGE, it utilizes state-of-the-art optimization strategies to reduce computation cost for fitting null mixed models. To ensure computation efficiency while improving test accuracy for rare variants, SAIGE-GENE approximates the variance of score statistics calculated with the full genetic relationship matrix (GRM) using the variance calculated with a sparse GRM and the ratios of these two variances estimated from a subset of genetic markers. Because the sparse GRM, which is constructed by thresholding small values in the full GRM, preserves close family structures, this approach provides a more accurate variance estimation for very rare variants (minor allele count (MAC) < 20) than the original approach in SAIGE9. By combining single variant score statistics, SAIGE-GENE can perform Burden, SKAT and SKAT-O type gene-based tests. We have also developed conditional analysis to perform association tests conditioning on a single variant or multiple variants to identify independent rare variant association signals. Furthermore, SAIGE-GENE can account for unbalanced case-control ratios of binary traits by adopting a robust adjustment based on saddlepoint approximation10–12 (SPA) and efficient resampling13 (ER). The robust adjustment was previously developed for independent samples14 and we have extended it for related samples in SAIGE-GENE.
We have demonstrated that SAIGE-GENE controls for type I error rates in related samples for both quantitative and binary traits through extensive simulations as well as real data analysis, including the Nord Trøndelag Health Study (HUNT) study for 69,716 Norwegian samples15,16 and the UK Biobank for 408,910 White British samples2. By evaluating the computation performance, we have shown its feasibility for large-scale genome-wide analysis. To perform exome-wide gene-based tests on 400,000 samples with on average 50 markers per gene, SAIGE-GENE requires 2,238 CPU hours and less than 36 Gb memory, while current methods will cost more than > 10 Tb in memory. We have further applied SAIGE-GENE to 53 quantitative traits and 10 binary traits in the UK Biobank and identified several significantly associated genes.
RESULTS
Overview of Methods
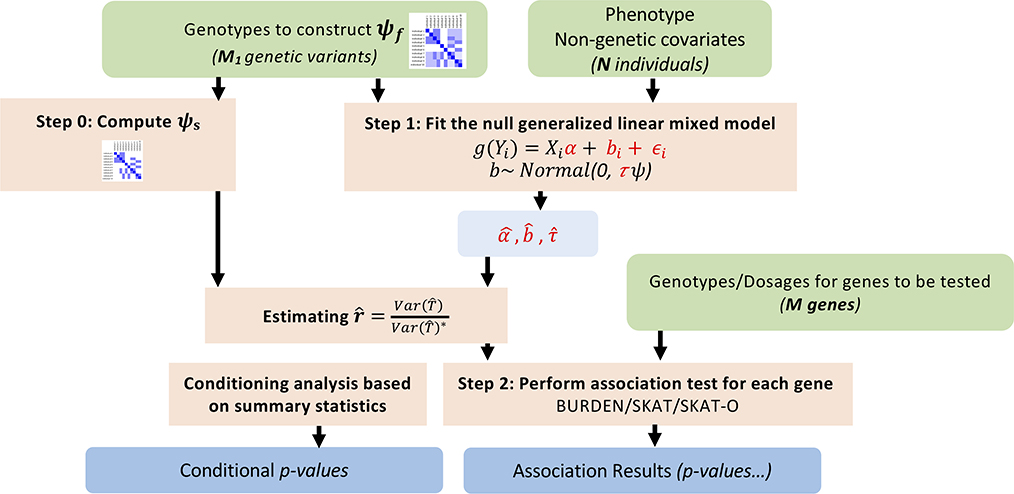
SAIGE-GENE consists of two main steps: 1. Fitting the null generalized linear mixed model (GLMM) to estimate variance components and other model parameters. 2. Testing for association between each genetic variant set, such as a gene or a region, and the phenotype. Three different association tests: Burden, SKAT, and SKAT-O have been implemented in SAIGE-GENE. The workflow is shown in the Extended Data Fig. 1.
SAIGE-GENE uses similar optimization strategies as utilized in the original SAIGE to fit the null GLMM in Step 1. In particular, the spectral decomposition has been replaced by the preconditioning conjugate gradient (PCG) to solve linear systems without calculating and inverting the N × N GRM. To reduce the memory usage, raw genotypes are stored in a binary vector and elements of GRM are calculated when needed rather than being stored.
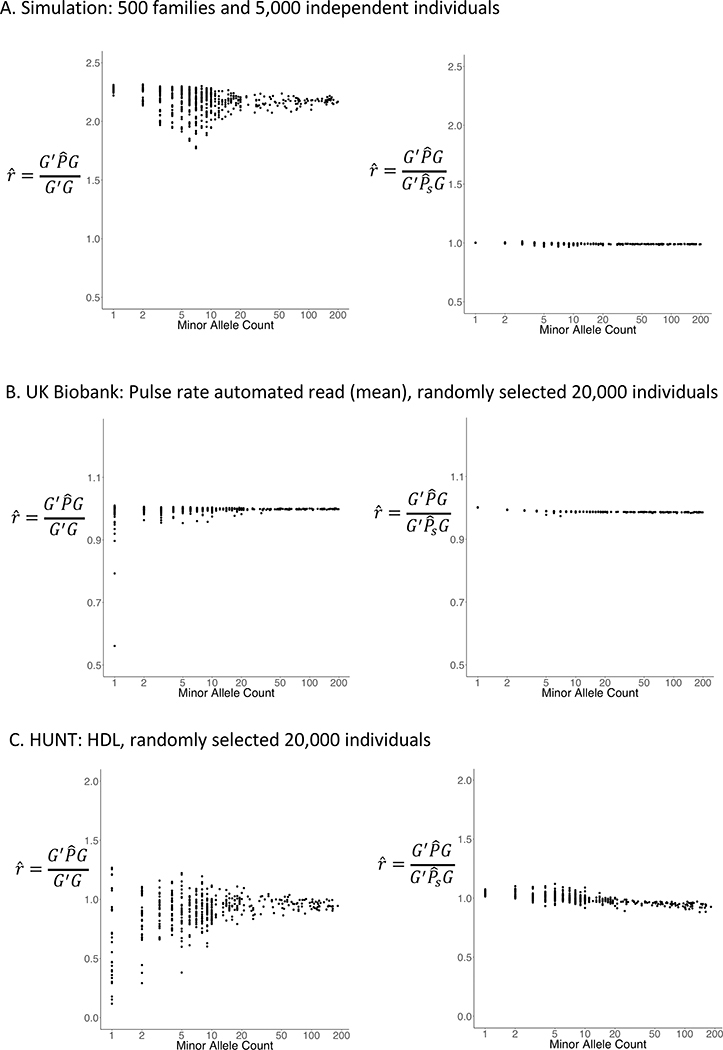
One of the most time-consuming part in association tests is to calculate variance of single variant score statistic, which requires O(N2) computation. To reduce computation cost, existing approaches, such as SAIGE9, BOLT-LMM17, and GRAMMA-Gamma18, approximate the variance of single variant score statistics with the full GRM using the variance estimate without a GRM and the ratio of these two variances. The ratio, which is assumed to be constant, is estimated using a subset of randomly selected genetic markers. However, for very rare variants with MAC below 20, the constant ratio assumption is not satisfied (Extended Data Fig. 2, left panel). This is because rare variants are more susceptible to close family structures. Thus, to better approximate the variance, SAIGE-GENE incorporates close family structures through a sparse GRM, in which GRM elements below a user-specified relatedness coefficient are zeroed out and close family structures are preserved. The ratio between the variance with the full GRM and with the sparse GRM is much less variable (Extended Data Fig. 2, right panel). To construct a sparse GRM, a small subset of randomly selected genetic markers, i.e. 2,000, are firstly used to quickly estimate which sample pairs pass the user-specified coefficient of relatedness cutoff, e.g. ≥0.125 for up to 3rd degree relatives. Then the coefficients of relatedness for those related pairs are further estimated using the full set of genetic markers, which equal to values in the full GRM. Given that estimated values for variance ratios vary by MAC for the extremely rare variants (Extended Data Fig. 2, left panel), such as singletons and doubletons, the variance ratios need to be estimated separately for different MAC categories. By default, MAC categories are set to be MAC equals to 1, 2, 3, 4, 5, 6 to 10, 11 to 20, and > 20.
In Step 2, gene-based tests are conducted using single variant score statistics and their covariance estimates, which are approximated as the product of the covariance with the sparse GRM and the pre-estimated ratio. SAIGE-GENE can carry out Burden, SKAT, and SKAT-O approaches. Since SKAT-O is a combined test of Burden and SKAT, and hence provides a robust power, SAIGE-GENE performs SKAT-O by default.
If a gene or a region is significantly associated with the phenotype of interest, it is necessary to test if the signal is from rare variants or just a shadow of common variants in the same locus. We have developed conditional analysis using linkage disequilibrium (LD) information between conditioning markers and the tested gene19. Details are described in the Online Methods section.
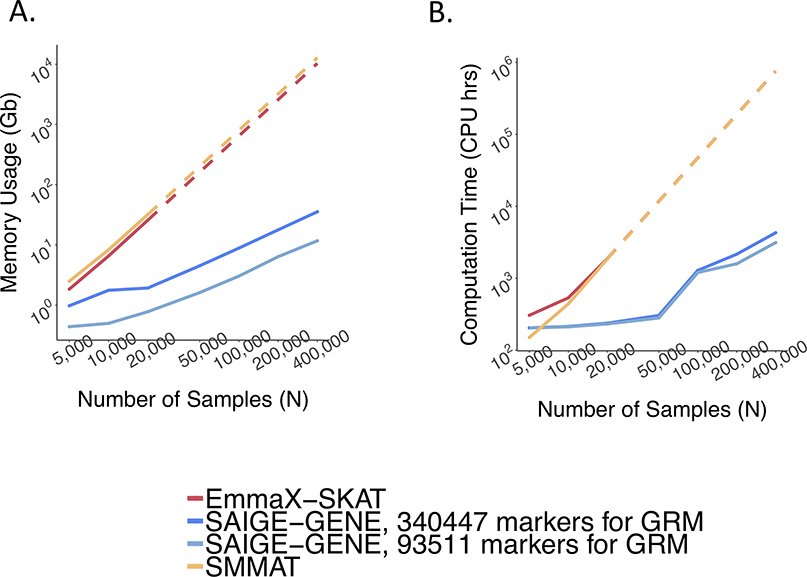
SAIGE-GENE uses the same generalized linear mixed model as in SMMAT, while SMMAT calculates the variances of the score statistics for all tested genes using the full GRM directly and hence can be thought of as the “exact” method. When the trait is quantitative, GLMM used by SAIGE-GENE and SMMAT is equivalent to the linear mixed model (LMM) of EmmaX-SKAT. We have further shown that SAIGE-GENE provides consistent association p-values to the two “exact” methods, EmmaX-SKAT and SMMAT (r2 of −log10 p-values > 0.99), using both simulation studies (Extended Data Fig. 3) and real data analysis for down-sampled UK Biobank and HUNT (Extended Data Fig. 4), but with much smaller computation and memory cost (Figure 1). We have also shown that SAIGE-GENE with different coefficient of relatedness cutoffs (0.125 and 0.2) produced nearly identical association p-values for automated read pulse rates in UK Biobank (Extended Data Fig. 5).
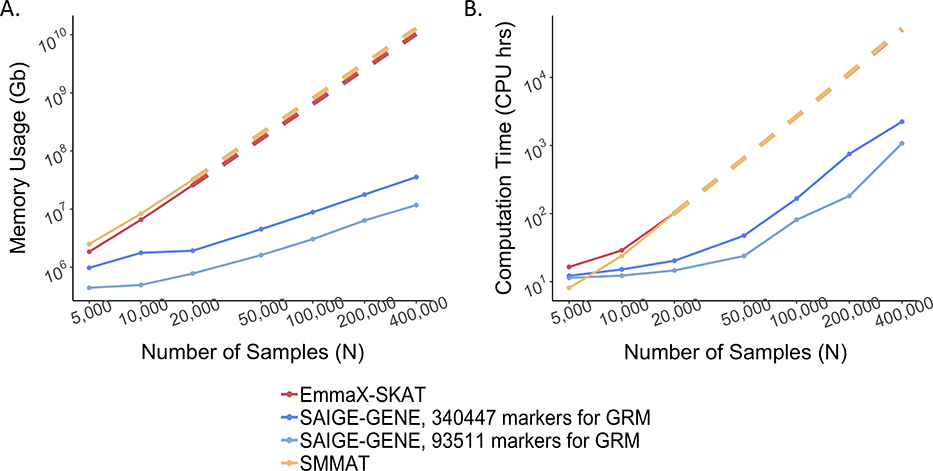
Figure 1.
Estimated and projected computation cost by sample sizes (N) for gene-based tests for 15,342 genes, each containing 50 rare variants.
Benchmarking was performed on randomly sub-sampled UK Biobank data with 408,144 White British participants for waist-to-hip ratio. The reported run times and memory are medians of five runs with samples randomly selected from the full sample set using different sampling seeds. The reported computation time and memory for EmmaX-SKAT and SMMAT is the projected computation time when N > 20,000. A. Log-log plots of the memory usage as a function of sample size (N) B. Log-log plots of the run time as a function of sample size (N). Numerical data are provided in Supplementary Table 1.
For binary phenotypes with unbalanced case-control ratios, single variant score statistics do not follow the normal distribution, leading to inflated type I error rates for region-based test13. To address this problem, we have recently developed an adjustment for independent samples14. The approach uses saddlepoint approximation10–12 (SPA) and efficient resampling13 (ER) to calibrate the variance of single variant score statistics. We have extended this approach to GLMM for SAIGE-GENE, which provides greatly improved type I error control than the unadjusted approach of assuming normality (Extended Data Fig. 6). Details can be found in Supplementary Note 1.3.3.
Computation and Memory Cost
To evaluate the computation performance of SAIGE-GENE, we randomly sampled subsets of the 408,144 UK Biobank participants with the White British ancestry and non-missing measurements for waist hip ratio2. We benchmarked SAIGE-GENE, EmmaX-SKAT, and SMMAT for exome-wide gene-based SKAT-O tests, in which 15,342 genes were tested with assuming that each has 50 rare variants.
Memory usage is plotted in Figure 1A. The memory cost of SAIGE-GENE is linear to the number of markers, M1, used for kinship estimation, but using too few markers may not be sufficient to account for subtle sample relatedness, leading to inflated type I error rates9,20. SAIGE-GENE uses 11.74 Gb with M1 = 93,511 and 35.59 Gb when M1 = 340,447 when the sample size N is 400,000, making it feasible for large sample data. In contrast, with N = 400,000 the memory usages in EmmaX-SKAT and SMMAT are projected to be nearly 10Tb.
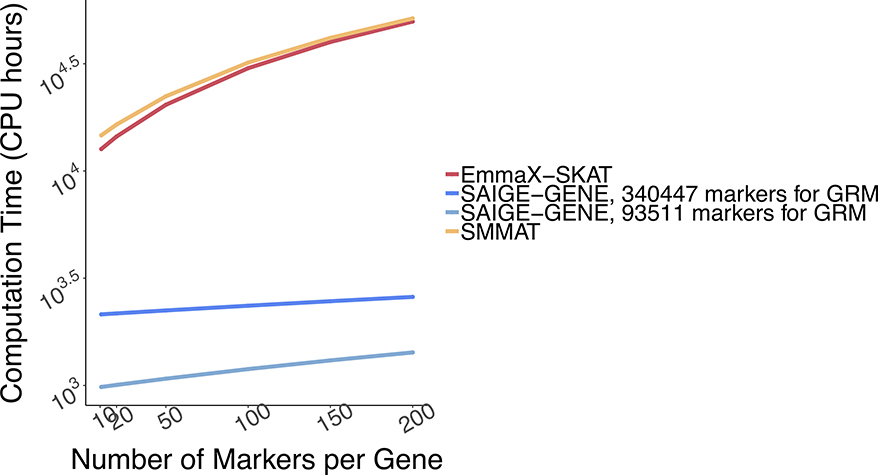
Total computation time for exome-wide gene-based tests is plotted in Figure 1B. Computation time for Step 1 and Step 2 are plotted separately in Extended Data Fig. 7 with numbers presented in Supplementary Table 1. The computation time for Step 1 in SAIGE-GENE is approximately O(M1N1.5) and in SMMAT and EmmaX-SKAT is O(N3). In Step 2, the association test for each gene costs O(qK) in SAIGE-GENE, where q is the number of markers in the gene and K is the number of non-zero elements in the sparse GRM. Compared to O(qN2) in Step 2 of SMMAT and EmmaX-SKAT, SAIGE-GENE decreases the computation time dramatically. For example, in the UK Biobank (N =408,910) with the relatedness coefficient ≥ 0.125 (corresponding to preserving 3rd degree or closer relatives in the GRM), K = 493,536, which is the same order of magnitude of N, and hence O(qK) is greatly smaller than O(qN2). As the computation time in Step 2 is approximately linear to q, the number of markers in each variant set, the total computation time for exome-wide gene-based tests was projected by different q and plotted in Extended Data Fig. 8. In addition, we plotted the projected computation time for genome-wide region-based tests in Extended Data Fig. 9, in which 286,000 chunks with 50 markers per chunk were assumed to be tested, corresponding to 14.3 million markers in HRC-imputed UK Biobank data with MAF ≤ 1% and imputation info score ≥ 0.8.
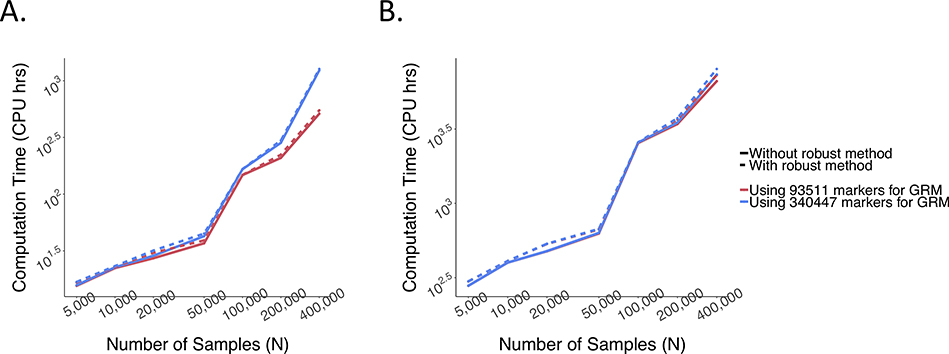
With M1 = 340,447 and N = 400,000, it takes SAIGE-GENE 2,238 CPU hours for the exome-wide analysis and 3,919 CPU hours for the genome-wide analysis for waist hip ratio. Compared to EmmaX-SKAT and SMMAT, SAIGE-GENE is 25 times faster for the exome-wide analysis and 161 times faster for the genome-wide analysis. More details are presented in Supplementary Table 1. Additional steps in the robust adjustment for binary traits only slightly increases the computation cost (1,269 vs 1,232 CPU hours for exome-wide analysis with M1 = 93,511) compared to the unadjusted approach (Supplementary Table 2 and Extended Data Fig. 10). Details are described in Supplementary Note 1.4
The computation time for constructing the sparse GRM is O( + M1K), where is the number of a small set of markers used for initial determination of related sample pairs, which by default is set to be 2,000. The construction of the sparse GRM is needed for each data set once and then it will be re-used for all phenotypes. For example, for the UK Biobank with N = 408,910, M1= 340,447, = 2000, K = 493,536 with the relationship coefficient ≥ 0.125, corresponding to up to 3rd degree relatives, it took 312 CPU hours to create the sparse GRM.
Gene-based association analysis of quantitative traits in HUNT and UK Biobank
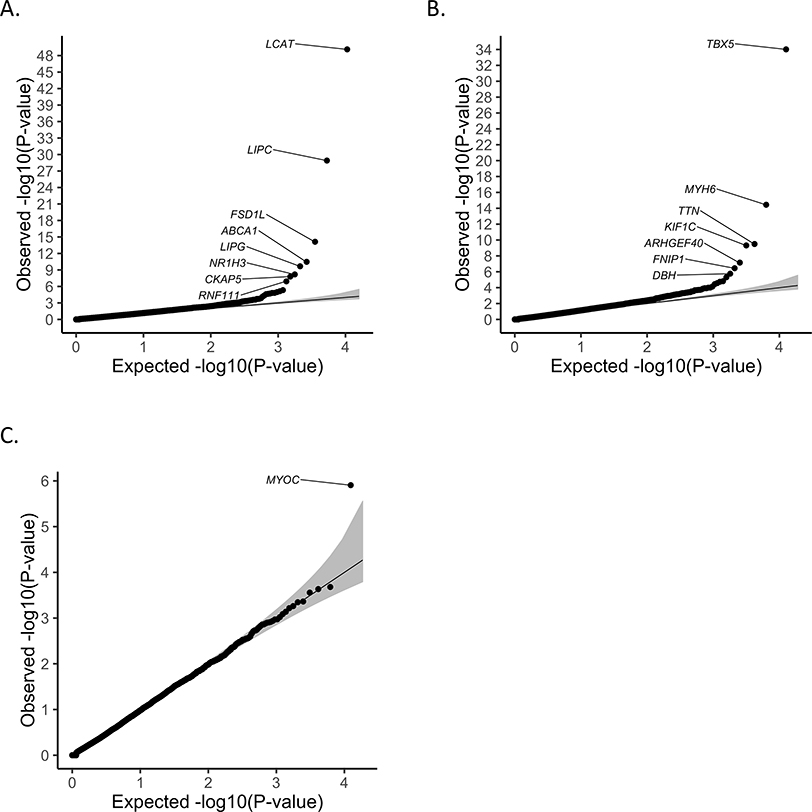
We applied SAIGE-GENE to analyze 13,416 genes, with at least two rare (MAF ≤ 1%) missense and stop-gain variants that were directly genotyped or imputed from HRC for high-density lipoprotein (HDL) in 69,716 Norwegian samples from the HUNT study9, which has substantial sample relatedness. The quantile-quantile (QQ) plot for the p-values of SKAT-O tests from SAIGE-GENE for HDL in HUNT is shown Figure 2A. As Table 1 shows, eight genes reached the exome-wide significant threshold (p-value ≤ 2.5×10⁻⁶) and all of them are located in the previously reported GWAS loci for HDL21,22. After conditioning on the most significant nearby variants from single-variant association tests (500 kilobases upstream and downstream), all genes, except for FSD1L, remained significant, suggesting that SAIGE-GENE has identified associations of rare coding variants that are independent from the nearby association signals, pointing to candidate causal genes at those loci.
Figure 2.
Quantile-quantile plots of exome-wide gene-based association results.
A. Results for high-density lipoprotein (HDL) in the HUNT study (N = 69,214). SKAT-O test in SAIGE-GENE was performed for 13,416 genes with stop-gain and missense variants with MAF ≤ 1%, of which 10,600 having at least two variants are plotted. B. Results for automated read pulse rate in the UK Biobank (N = 385,365). The SKAT-O test in SAIGE-GENE was performed for 15,338 genes with stop-gain and missense variants with MAF ≤ 1%, of which 12,636 having at least two variants are plotting. C. Results for glaucoma in the UK Biobank (N cases = 4,462; N controls = 397,761). SKAT-O approach in SAIGE-GENE was performed for 15,338 genes with stop-gain and missense variants with MAF ≤ 1%, of which 12,638 having at least two variants are plotting. N: sample size.
Table 1.
Genes that are significantly associated with automated read pulse rate (N = 385,365) and glaucoma (N cases = 4,462; N controls = 397,761) in the UK Biobank and high-density lipoprotein (HDL) in the HUNT study (N = 69,214) with SKAT-O p-values < 2.5×10⁻⁶ from SAIGE-GENE. Conditional analysis was performed when the top hit in the locus (+/− 500kb of the start and end positions of the gene) is not included in the gene-based test. The p-value of conditional analysis is NA when the top hit is a rare missense or stop gain variant included in the gene-based test. N: sample size.
| Gene | Number of Markers | SAIGE-GENE SKAT-O Test |
Top Hit in the Locus | ||||
|---|---|---|---|---|---|---|---|
| p-value | p-value Conditional | Variant (GRCh37/hg19) | p-value | MAF | |||
| Pulse Rate (UK Biobank) | TBX5 | 4 | 9.69E-35 | NA | 12:114837349_C/A | 7.73E-35 | 0.0049 |
| MYH6 | 14 | 3.61E-15 | 2.56E-13 | 14:23861811_A/G | 1.04E-168 | 0.3698 | |
| TTN | 368 | 3.18E-10 | 3.41E-06 | 2:179721046_G/A | 8.73E-100 | 0.0885 | |
| KIF1C | 12 | 4.78E-10 | NA | 17:4925475_C/T | 3.18E-10 | 0.0063 | |
| ARHGEF40 | 7 | 7.02E-08 | 2.57E-10 | 14:21542766_A/G | 3.30E-52 | 0.1688 | |
| FNIP1 | 8 | 3.58E-07 | 4.31E-02 | 5:131107733_C/T | 1.22E-08 | 0.0027 | |
| DBH | 12 | 1.74E-06 | 1.74E-06 | 9:136149399_G/A | 3.46E-06 | 0.1870 | |
| HDL (HUNT) | LCAT | 3 | 7.34E-50 | NA | 16:67974303_A/T | 1.78E-48 | 0.0008 |
| LIPC | 4 | 1.25E-29 | 6.63E-31 | 15:58723939_G/A | 7.50E-89 | 0.1889 | |
| FSD1L | 3 | 7.40E-15 | 1 | 9:107793713_T/C | 1.45E-20 | 0.0021 | |
| ABCA1 | 14 | 3.32E-11 | 1.28E-11 | 9:107620797_A/G | 3.64E-48 | 0.0055 | |
| LIPG | 3 | 2.15E-10 | 2.41E-10 | 18:47156926_C/A | 5.92E-40 | 0.2348 | |
| NR1H3 | 2 | 6.53E-09 | 1.69E-09 | 11:47246397_G/A | 3.66E-13 | 0.3220 | |
| CKAP5 | 7 | 1.62E-08 | 1.21E-09 | 11:47246397_G/A | 3.66E-13 | 0.3220 | |
| RNF111 | 11 | 1.18E-07 | 1.37E-09 | 15:58856899_C/G | 2.82E-24 | 0.0047 | |
| Glaucoma (UK Biobank) | MYOC | 6 | 1.23E-06 | NA | 1:171605478_G/A | 9.13E-16 | 0.0014 |
We also applied SAIGE-GENE to analyze 15,342 genes for 53 quantitative traits using 408,910 UK Biobank participants with White British ancestry2. Heritability estimates based on the full GRM are presented in Supplementary Table 3A. Supplementary Table 4A presents all genes with p-values reaching the exome-wide significant threshold (p-value ≤ 2.5×10⁻⁶). The same MAF cutoff ≤ 1%, for missense and stop-gain variants were applied. Figure 2B shows the QQ plot for automated read pulse rate as an exemplary phenotype. MYH6, ARHGEF40 and DBH remain significant after conditioning on the most significant nearby variants (Table 1). Gene TBX5, MYH6, TTN, and ARHGEF40 are known genes for heart rates by previous GWAS23–26. To our knowledge, KIF1C and DBH have not been reported by association studies for heart rates, but Dbh(−/−) mice have decreased heart rates compared to their littermate controls Dbh(+/−) mice27. For DBH, no single variant reaches the genome-wide significance (the most significant variant is 9:136149399 (GRCh37) with MAF = 18.7% and p-value =3.46×10⁻⁶). Fifteen genes that were exome-wide significant have no genome-side significant single variants (Supplementary Table 5). After conditioning on the most significant nearby variants, total 64 genes for 12 traits remained exome-wide significant (Supplementary Table 6A). SAIGE-GENE has identified several potentially novel gene-phenotype associations, such as DBH for automated read pulse rate (p-valueSKAT-O =1.74×10⁻⁶), and also replicated several previous findings, such as the association between ADAMTS3 and height28. Details have been described in Supplementary Note 2.1. These results have demonstrated the value of gene-based tests for identifying genetic factors for complex traits.
Gene-based association analysis of binary traits in UK Biobank
We applied SAIGE-GENE to ten binary phenotypes with various case-control ratios in the UK Biobank. The heritability estimates in a liability scale are presented in Supplementary Table 3B. Nine genes for six binary phenotypes reached the exome-wide significant threshold (p-value < 2.5×10⁻⁶) (Supplementary Table 4B), all of which have been identified by both SAIGE-GENE and single variant tests, including the gene MYOC, known for glaucoma29 (Figure 2C). Six genes for six binary phenotypes remained exome-wide significant after conditioning on top variants (Supplementary Table 6B).
Simulation Studies
We investigated the type I error rates and power of SAIGE-GENE by simulating genotypes and phenotypes for 10,000 samples in two settings. One had 500 families and 5,000 unrelated samples and the other had 1,000 families. Each family had 10 members based on the pedigree shown in Supplementary Figure 1.
Type I error rates
The type I error rates of SAIGE-GENE, EmmaX-SKAT, and SMMAT were evaluated from 107 simulated gene-phenotype combinations, each with 20 genetic variants with MAF ≤ 1% on average. A sparse GRM with a cutoff 0.2 for the coefficient of relatedness was used in SAIGE-GENE. Two different values of the variance component parameter corresponding to the heritability h2 = 0.2 and 0.4 were considered for quantitative traits (see ONLINE METHODS). The empirical type I error rates at the α = 0.05, 10−4 and 2.5×10⁻⁶ are shown in the Supplementary Table 7. Our simulation results suggest that SAIGE-GENE relatively well controls type I error rates, while the type I error rates are slightly inflated when heritability is relatively high (h2 = 0.4). Similar results have been observed on a larger sample size with 1,000 families and 10,000 unrelated samples (Supplementary Note 2.2 and Supplementary Table 8). Adjusting the test statistics using the genomic control (GC) inflation factor has addressed the inflation (Supplementary Note 1.3.4).
Further simulations were conducted to evaluate type I error rates of SAIGE-GENE, EmmaX-SKAT, and SMMAT for skewed distributed phenotypes, which are common in real data (Supplementary Figure 2A). All three methods had inflated type I error rates for phenotypes with skewed distributions (Supplementary Table 9). With inverse normal transformation on phenotypes (Supplementary Figure 2B), the inflation has been reduced but slight inflation was still observed (Supplementary Table 9). A potential reason is that inverse normal transformation disrupts sample relatedness in raw phenotypes, leading to poor fitting for the null GLMM. We then conducted a three-step phenotype transformation procedure as described in Supplementary Note 2.3, which maintains sample relatedness in raw phenotype, and observed well controlled type I error rates by all three methods (Supplementary Table 10). Further simulation studies using real genotype data from the UK Biobank have shown that SAIGE-GENE well controlled type I error rates in the presence of subtle population structure or non-negligible cryptic relatedness between families (Supplementary Table 11 and 12). Details have been described in Supplementary Note 2.4 and 2.5.
We also evaluated the type I error rates of SAIGE-GENE for binary traits with various case-control ratios. Similar with quantitative traits, a sparse GRM with a cutoff 0.2 was used. The variance component parameter τ = 1 was assumed, corresponding to liability-scale heritability 0.23. As expected, when case-control ratios were balanced or moderately unbalanced (e.g. 1:1 and 1:9), type I error rates were well controlled even without the robust adjustment, while when the ratios were extremely unbalanced (e.g. 1:19 and 1:99), inflation was observed (Supplementary Table 13A and Extended Data Fig. 6). With the robust adjustment, type I error rates were relatively well controlled for the unbalanced case-control ratios (Supplementary Table 13B and Extended Data Fig. 6). However, for phenotypes with case-control ratio=1:99, slight inflation was still observed, although the inflation has been dramatically alleviated compared to the unadjusted method. Then the genomic control adjustment can be used to further control the type I error rates (Supplementary Table 13B). We also evaluated empirical type I error rates of SAIGE-GENE for binary traits under case-control sampling with case-control ratios 1:1 and 1:9 based on a disease prevalence 1% in the population (Supplementary Note 2.6) and observed well-controlled type I error rates (Supplementary Table 14).
Power
We evaluated empirical power of SAIGE-GENE and EmmaX-SKAT for quantitative traits. Two different settings of proportions of causal variants were used: 10% and 40%. In each setting, among causal variants, 80% and 100% had negative effect sizes. The absolute effect sizes for causal variants were set to be |0.3log10(MAF)| and |log10(MAF)|, respectively, when the proportions of causal variants are 0.4 and 0.1. Supplementary Table 15 shows that the power of both methods is nearly identical for all simulation settings for Burden, SKAT and SKAT-O tests.
We also evaluated empirical power of SAIGE-GENE for binary traits using two different study designs: cohort study with various disease prevalence (0.01–0.5); and case-control sampling with different case-control ratios (1:1–1:19) based on a disease prevalence 1% in the population. In each setting, 40% variants were causal variants. Among them, 80% were risk-increasing variants and 20% were risk-decreasing. The absolute effect sizes of causal variants were set to be |0.55log10(MAF)| and |0.35log10(MAF)| for cohort study and case-control sampling, respectively. Supplementary Table 16 shows the empirical power of SKAT-O in both simulation studies. SAIGE-GENE had similar empirical power as unadjusted SAIGE-GENE in balanced case-control ratios and higher power in unbalanced scenarios. The power is small when case: control ratio is 1:99 due to the limited number of cases (100 cases), which can be alleviated with larger sample size.
DISCUSSION
In summary, we have presented a method, SAIGE-GENE, to perform gene- or region-based association tests in large cohorts or biobanks in the presence of sample relatedness. Similar to SAIGE9, which was previously developed for single-variant association tests, SAIGE-GENE uses GLMM to account for sample relatedness, scalable computational approaches for large sample sizes, and the robust adjustment14 to account for unbalanced case-control ratios of binary traits.
SAIGE-GENE uses several optimization strategies that are similar to those used in SAIGE to make fitting the null GLMM feasible for large sample sizes. For example, instead of storing the GRM in the memory, SAIGE-GENE stores genotypes in a binary vector and computes the elements of the GRM as needed. PCG is used to solve linear systems instead of inverting a matrix. However, some optimization approaches are specifically applied in the gene-based tests in regard of rare variants. As estimating the variances of score statistics for rare variants are more sensible to family structures, we use a sparse GRM to preserve close family structures rather than ignoring all sample relatedness. In addition, the variance ratios are estimated for different MAC categories, especially for those extremely rare variants with MAC lower than or equal to 20.
For binary phenotypes, SAIGE-GENE uses the robust adjustment, thereby also relatively well controls the type I error rates for both balanced and unbalanced case-control phenotypes. However, slight inflation is still observed in extremely unbalanced phenotypes (≤1:99). To address this, we suggest using the genomic control to further control type I error.
In numerical optimization, using good initial values can improve the model convergence. In the analysis of 24 quantitative traits in the UK Biobank with sample size (N) ≥ 100,000, we note that the models with the full GRM and the sparse GRM produced different variance component estimates, but they are relatively concordant (Pearson’s correlation R2 = 0.66, Supplementary Figure 3). This indicates that the parameter estimates from the sparse GRM can be used as initial values to facilitate the model fitting. We implemented this approach in SAIGE-GENE.
SAIGE-GENE has some limitations. First, similar to SAIGE and other mixed-model methods, the time for algorithm convergence may vary among phenotypes and study samples given different heritability levels and sample relatedness. Second, similar to SAIGE9 and SMMAT6, SAIGE-GENE uses penalized quasi-likelihood (PQL)30 for binary traits to estimate the variance component which is known to be biased. However, as shown in simulation studies in SAIGE9 and SMMAT6, PQL-based approaches work well to adjust for sample relatedness.
Overall, we have shown that SAIGE-GENE can account for sample relatedness while maintaining test power through simulation studies. By applying SAIGE-GENE to HUNT9 and UK Biobank2, we have demonstrated that SAIGE-GENE can identify potentially novel association signals. Currently, our method is the only available mixed effect model approach for gene- or region-based rare variant tests for large sample data, while accounting for unbalanced case-control ratios for binary traits. By providing a scalable solution to the current largest and future even larger datasets, our method will contribute to identifying trait-susceptibility rare variants and genetic architecture of complex traits.
METHODS
Generalized linear mixed model
In a study with sample size N, we denote the phenotype of the ith individual using yi for both quantitative and binary traits. Let the 1 × (p + 1) vector Xi represent p covariates including the intercept, the N × q matrix Gi represent the allele counts (0, 1 or 2) for q variants in the gene to test. The generalized linear mixed model can be written as
where μi is the mean of phenotype, bi is the random effect, which is assumed to be distributed as N(0, τ ψ), where ψ is an N × N genetic relationship matrix (GRM) and τ is the additive genetic variance parameter. The link function g is the identity function for quantitative traits with an error term ε~N(0,ϕI) and logistic function for binary traits. The parameter α is a (p + 1) × 1 coefficient vector of fixed effects and β is a q × 1 coefficient vector of the genetic effect.
Estimate variance component and other model parameters (Step 1)
Same as in the original SAIGE9 and GMMAT31, to fit the null GLMM in SAIGE-GENE, penalized quasi-likelihood (PQL) method30,32 and the computational efficient average information restricted maximum likelihood (AI-REML) algorithm31,33 are used to iteratively estimate () under the null hypothesis of β = 0. At iteration k, let () be estimated be the estimated mean of yi and be an N × N matrix of the variance of working vector , in which ψ is the N × N GRM. For quantitative traits, and For binary traits, and . To obtain the log quasi-likelihood and average information at each iteration, SAIGE and SAIGE-GENE use the preconditioned conjugate gradient approach (PCG)31,32 to obtain the product of inverse of and any other vector by iteratively solving a linear system with . This approach is more computationally efficient than using Cholesky decomposition to obtain . The numerical accuracy of PCG has been evaluated in the SAIGE paper9.
Gene-based association tests (Step 2)
Test statistics of the Burden, SKAT and SKAT-O tests for a gene can be constructed based on score statistics from the marginal model for individual variants in the gene. Suppose there are q variants in the region or gene to test. The score statistic for variant j (j=1,..,q) under H0: βj = 0 is where gj and Y are N × 1 genotype and phenotype vectors, respectively, and is the estimated mean of Y under the null hypothesis.
Let uj denote a threshold indicator or weight for variant j and U = diag(u1,…,uq) be a diagonal matrix with uj as the jth element. Similar to the original SKAT and SKAT-O papers4,5, to upweight rare variants, the default setting in SAIGE-GENE is uj = Beta(MAFj, 1, 25), which upweight rarer variants. The Burden test statistics can be written as . Suppose is the covariate adjusted genotype matrix, where G = (g1,…,gq) is the N × q genotype matrix of the q genetic variants, and with Under the null hypothesis of no genetic effects, QBurden followed , where is a q × 1 vector with all elements being unity and is a chi-squared distribution with 1 degree of freedom3. The SKAT test4 can be written as , which follows a mixture of chi-square distribution , where λSj are the eigenvalues of . The SKAT-O test5 uses a linear combination of the Burden and SKAT tests statistics . To conduct the test, the minimum p-value from grid of ρ is calculated and the p-value of the minimum p-value is estimated through numerical integration. Following the suggestion in Lee et al34, we use a grid of eight values of to find the minimum p-value.
Approximate
For each gene, given , the calculation of requires applying PCG for each variant in the gene, which can be computationally very expensive. Suppose represents a covariate adjusted single variant genotype vector. To reduce computation cost, an approximation approach has been used in SAIGE, BOLT-LMM17 and GRAMMAR-GAMMAR18, in which the ratio between and is estimated by a small subset of randomly selected genetic markers. The ratio has been shown to be approximately constant for all variants. Given the estimated ratio for all other variants can be obtained as . However, the variations of the estimated for extremely rare variants are large and including some closely related samples in the denominator helps reduce the variation of as shown in Supplementary Figure 2. Let ψS denote a sparse GRM that preserves close family structure and ψf denote a full GRM. We estimate the ratio , where and .
In ψs, elements below a user-specified relatedness coefficient cutoff, i.e. > 3rd degree relatedness, are zeroed out with only close family structures being preserved. To construct ψs, a subset of randomly selected genetic markers, i.e. 2,000, is firstly used to quickly estimate which related samples pass the user-specified cutoff. Then the relatedness coefficients for those samples are further estimated using the full set of genetic markers, which equal to corresponding values in the ψf. In the model fitting using ψs, and need to be calculated. For this we use a sparse-LU based solve method35 implemented in R. The constructed ψs is also used for approximating the variance of score statistics with ψf. For a biobank or a data set, ψs only needs to be constructed once and can be re-used for any phenotypes in the same date set.
SAIGE-GENE estimates variance ratios for different MAC categories. By default, MAC categories are set to be MAC equals to 1, 2, 3, 4, 5, 6 to 10, 11 to 20, and is greater than 20. Once the MAC categorical variance ratios are estimated, for each genetic marker in tested genes or regions, can be obtained according to its MAC. Let be a q × q diagonal matrix whose jth diagonal element is the ratio for the jth marker in the gene (i.e. ). For the tested gene with q markers, can be approximated as (See Supplementary Note for more details).
Robust adjustment for to account for unbalanced case-control ratios
To account for unbalanced case-control ratios of binary traits in region- or gene-based tests, we recently developed a robust adjustment for independent samples14. The approach first obtains well-calibrated p-values of single variant score statistics using SPA10–12 and ER13. SPA is a method to calculate p-values by inverting the cumulant generating function (CGF). Since CGF completely specifies the distribution, SPA can be far more accurate than using the normal distribution. However, since SPA is still an asymptotic based approach, it does not work well when variants are very rare (ex. MAC ≤10). For those variants, we use ER, which resamples the case-control status of only individuals carrying a minor allele and is extremely fast for very rare variants. To account for the fact that individuals can have different non-genetic risk of diseases (due to covariates), the resampling was done with the estimated disease risk μi. Next, variances of single variant score statistics are obtained by inverting those p-values, which are then used to calibrate the variances of region- or gene-based test statistics. We have extended the approach for related samples in SAIGE-GENE. For variants with MAC > 10, single-variant p-values are obtained by SAIGE, which basically applies SPA to GLMM. For variants with MAC ≤10, we use ER with GLMM estimated , which includes the random effect to maintain the correlation structure among samples. After calculating p-values of Tj for j=1,…,q, the variance of Tj is calibrated by inverting the corresponding p-value. Then the calibrated variance is applied to to compute robust p-value for the region- or gene-based test. The details can be found in Supplementary Note.
Conditional analysis
In SAIGE-GENE, we have implemented the conditional analysis to perform gene-based tests conditioning on a given markers using the summary statistics from the unconditional gene-based tests and the linkage disequilibrium r2 between testing and conditioning markers19. Let G be the genotypes for a gene to be tested for association, which contains q markers, and G2 be the genotypes for the conditioning markers, which contains q2 markers. Let β denote a q × 1 coefficient vector of the genetic effect for the gene to be tested and β2 be a q2 × 1 coefficient vector of the genetic effect for the conditioning markers. The genotype matrix with the non-genetic covariates projected out and . In the unconditioned association tests, the test statistics and . In conditional analysis, under the null hypothesis, E(T) = and E(T2) = . T and T2 jointly follow the multivariate normal with mean (E(T), E(T2)) and variance .
Thus under the null hypothesis of no association of T, i.e. H0: β = 0, the T|T2 follows the conditional normal distribution with and , and p-values can be calculated from the conditional distribution.
Data simulation
We carried out a series of simulations to evaluate and compare the performance of SAIGE-GENE, EmmaX-SKAT5,7 and SMMAT6. We used the sequence data from 10,000 European ancestry chromosomes over 1Mb regions that was generated using the calibrated coalescent model in the SKAT R package5. We randomly selected 10,000 regions with 3Kb from the sequence data, followed by the gene-dropping simulation36 using these sequences as founder haplotypes that were propagated through the pedigree of 10 family members shown in Supplementary Figure 11. Only variants with MAF ≤ 1% were used for simulation studies. Quantitative phenotypes were generated from the following linear mixed model , where Gi is the genotype value, β is the genetic effect sizes, bi is the random effect simulated from , and εi is the error term simulated from . Two covariates, X1 and X2, were simulated from Bernoulli(0.5) and N(0,1), respectively. Binary phenotypes were generated from the logistic mixed model , where β is the genetic log odds ratio, bi is the random effect simulated from N(0, τ ψ) with τ = 1. The intercept α0 was determined by the disease prevalence (i.e. case-control ratios). Given τ = 1, the liability scale heritability is 0.2337.
To evaluate the type I error rates at exome-wide α=2.5×10⁻⁶, we first simulated 10,000 regions, and then simulated 1000 sets of quantitative phenotypes for each simulated region with different random seeds under the null hypothesis with β = 0. Gene-based association tests were performed using SAIGE-GENE, EmmaX-SKAT, and SMMAT therefore in total 107 tests for each of Burden, SKAT, and SKAT-O tests were carried out. Two different settings for τ were evaluated: 0.2 and 0.4 and two different sample relatedness settings were used: one has 500 families and 5,000 independent samples and other one has 1,000 families, each with 10 family members. We also simulated 1,000 sets of binary phenotypes for case-control ratios 1:99, 1:19, 1:9, 1:4, and 1:1 for 500 families and 5,000 independent samples. Burden, SKAT, and SKAT-O tests were performed on the 10,000 genome regions using SAIGE-GENE, in total 107 tests for each method for each case-control ratio.
For the power simulation, phenotypes were generated under the alternative hypothesis β ≠ 0. Two different settings for proportions of causal variants are used: 10% and 40%, corresponding to |β| = |log10(MAF)| and |β| = |0.3log10(MAF)|, respectively. In each setting, 80% and 100% had negative effect sizes. We simulated 1,000 datasets in each simulation, and power was evaluated at test-specific empirical α, which yields nominal α=2.5×10⁻⁶. The empirical α was estimated from the type I error simulations. Similarly, 1,000 sets of binary traits were generated for 10,000 samples (500 families and 5,000 independent samples) under the alternative hypothesis β ≠ 0 using two different settings: cohort study with various disease prevalence (0.01, 0.05, 0.1, and 0.5); and case-control sampling with three different case-control ratios (1:19, 1:9, and 1:1) based on a disease prevalence 1% in the population (Supplementary Note 2.5). 40% variants are simulated as causal variants, among which 80% are risk-increasing variants and 20% are risk-decreasing. The absolute effect sizes of causal variants are set to be |0.55log10(MAF)| and |0.35log10(MAF)| for cohort study and case-control sampling, respectively.
HUNT and UK Biobank data analysis
We applied SAIGE-GENE to the high-density lipoprotein (HDL) levels in 69,500 Norwegian samples from a population-based HUNT study15,16. About 70,000 HUNT participants were genotyped using Illumina HumanCoreExome v1.0 and 1.1 and imputed using Minimac338 with a merged reference panel of Haplotype Reference Consortium (HRC)39 and whole genome sequencing data (WGS) for 2,201 HUNT samples. Variants with imputation r2 < 0.8 were excluded from further analysis. Participation in the HUNT Study is based on informed consent, and the study has been approved by the Data Inspectorate and the Regional Ethics Committee for Medical Research in Norway. Total 13,416 genes with at least two rare (MAF ≤ 1%) missense and/or stop-gain variants with imputation r2 ≥ 0.8 were tested. Variants were annotated using Seattle Seq Annotations (http://snp.gs.washington.edu/SeattleSeqAnnotation138/). We used 249,749 pruned genotyped markers to estimate relatedness coefficients in the full GRM for Step 1 and used the relative coefficient cutoff ≥ 0.125 for the sparse GRM.
We have also analyzed 53 quantitative traits and 10 binary traits using SAIGE-GENE in the UK Biobank for 408,910 participants with White British ancestry2. UK Biobank protocols were approved by the National Research Ethics Service Committee and participants signed written informed consent. Markers that were imputed by the HRC39 panel with imputation info score ≥ 0.8 were used in the analysis. Total 15,342 genes with at least two rare (MAF ≤ 1%) missense and stop-gain variants that were directly genotyped or successfully imputed from HRC (imputation score ≥ 0.8) were tested. We used 340,447 pruned markers, which were pruned from the directly genotyped markers using the following parameters, were used to construct GRM: window size of 500 base pairs (bp), step-size of 50 bp, and pairwise r2 < 0.2. We used the relative coefficient cutoff ≥ 0.125 for the sparse GRM.
DATA AVAILABILITY STATEMENT
SAIGE-GENE is implemented as an open-source R package available at https://github.com/weizhouUMICH/SAIGE/master.
The summary statistics and QQ plots for 53 quantitative phenotypes and 10 binary phenotypes in UK Biobank by SAIGE-GENE are currently available for public download at https://www.leelabsg.org/resources.
Genome build
All genomic coordinates are given in NCBI Build 37/UCSC hg19.
Statistical analysis
We performed gene-based Burden, SKAT and SKAT-O tests using SAIGE-GENE on 15,342 genes for 53 quantitative traits and 10 binary traits in 408,910 UK Biobank participants with White British ancestry, who passed the quality control in the UK Biobank2. In the linear mixed model for quantitative traits, the first four genetic principal components (PCs), gender and age when attended assessment center were included as the non-genetic covariates. In the logistic mixed model for binary traits, the first four genetic principal components, gender and birth year were included as the non-genetic covariates. We also performed the same gene-based tests 13,416 genes for HDL levels in 69,500 Norwegian samples from the HUNT study15,16. In the linear mixed model for HDL, age, sex, genotyping batch, and first four PCs were included as non-genetic covariates. The numbers of samples used for analysis are included in the legend of each figure.
Life Sciences Reporting Summary
Further information on study design is available in the Nature Research Reporting Summary linked to this article.
Extended Data
Extended Data Fig. 1. Workflow of SAIGE-GENE.
SAIGE-GENE consists of two steps: (1) Fitting the null generalized linear mixed model (GLMM) to estimate variance components and other model parameters; (2) Testing for association between each genetic variant set, such as a gene or a region, and the phenotype.
Extended Data Fig. 2. Plots of the variance ratio of the score statistics by MAC for rare variants with and without the full GRM for sample relatedness (left) and with the full GRM and a sparse GRM for closely related samples (right).
a, Genotypes were simulated for 500 families and 5,000 independent individuals based on the pedigree structure shown in Supplementary Fig. 1 and the null model was fitted for the simulated quantitative trait with h2 = 0.2. The sparse GRM was constructed using a coefficient of relatedness cutoff 0.2. b, 20,000 samples with White British ancestry were randomly selected from the UK Biobank and the null model was fitted for the automated read pulse rate. The sparse GRM was constructed using a coefficient of relatedness cutoff 0.125. c, 20,000 samples were randomly selected form the HUNT study and the null model was fitted for HDL. The sparse GRM was constructed using a coefficient of relatedness cutoff 0.125.
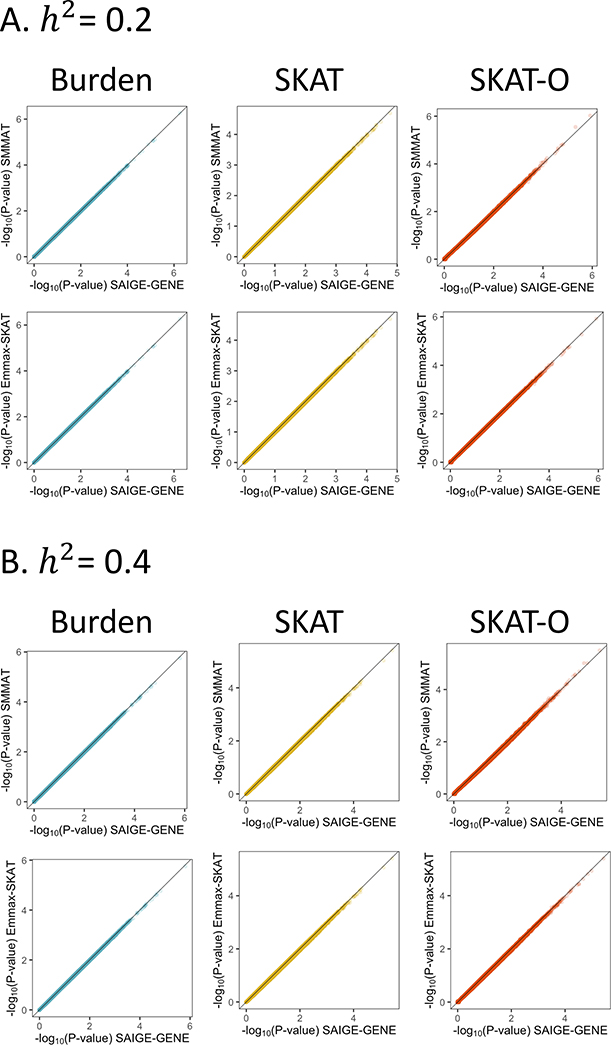
Extended Data Fig. 3. Scatter plots of association P-values from SAIGE-GENE versus SMMAT and EmmaX-SKAT for the Burden, SKAT, and SKAT-O tests based on simulation data on the −log10 scale.
1,000,000 genes were tested with 1,000 families, each having 10 members, as shown in the Supplementary Fig. 1. The Pearson’s correlation coefficients r2 > 0.99 for −log10(P-values) between SAIGE and SMMAT and between SAIGE and EmmaX-SKAT. a, h2 = 0.2. b, h2 = 0.4.
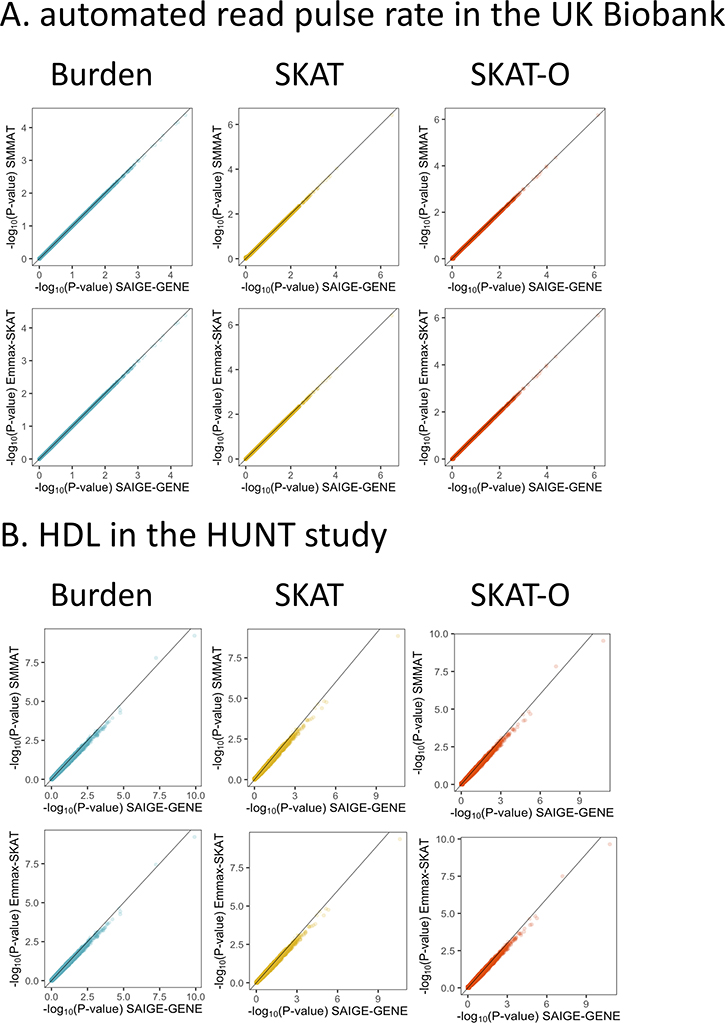
Extended Data Fig. 4. Scatter plots of association P-values from SAIGE-GENE versus SMMAT and EmmaX-SKAT for the Burden, SKAT, and SKAT-O tests based on real data analysis on the −log10 scale.
a,b, 12,000 genes were tested for automated read pulse rate on 20,000 randomly selected white British samples in the HRC-imputed UK Biobank (a) and for HDL on 20,000 randomly selected samples in HUNT (b). Missense and stop-gain variants with MAF ≤ 1% were included. The Pearson’s correlation coefficients r2 > 0.99 for −log10(P-values) between SAIGE and SMMAT and between SAIGE and EmmaX-SKAT.
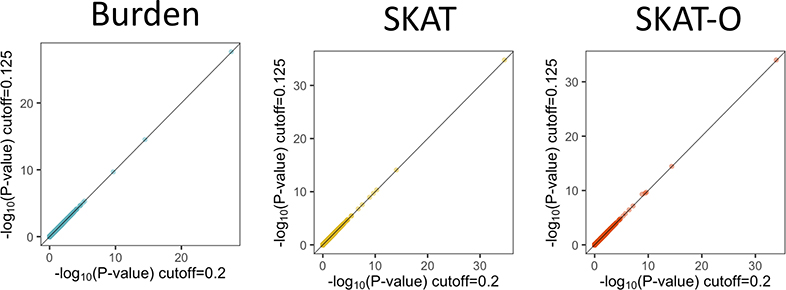
Extended Data Fig. 5. Scatter plots of association P-values on the −log10 scale from SAIGE-GENE with two sample relatedness cutoffs for the sparse GRM, 0.125 and 0.2. 15,338 genes were tested for automated read pulse rate in white British samples in the HRC-imputed UK Biobank (N = 385,365).
N, sample size. Missense and stop-gain variants with MAF ≤ 1% were included. a, Burden. b, SKAT. c, SKAT-O.
Extended Data Fig. 6. Quantile-quantile plots of association P-values for 10 million variant sets from the simulation study for phenotypes with various case-control ratios (N = 100,000).
a, Case:Control = 1:9. b, Case:Control = 1:19. c, Case:Control = 1:99. N, sample size.
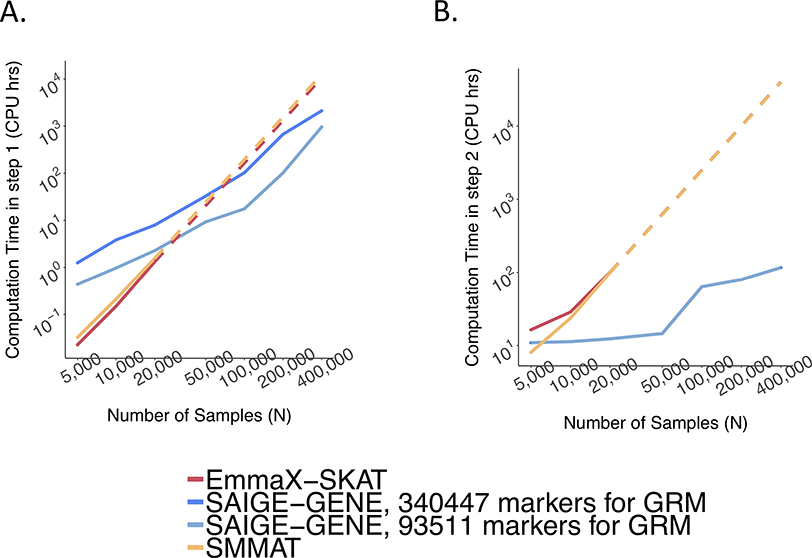
Extended Data Fig. 7. Empirical computation time.
a,b, Step 1 for fitting a null mixed model (a) and Step 2 for association tests (b), respectively, by sample sizes (N) for gene-based tests for 15,342 genes, each containing 50 rare variants. Benchmarking was performed on randomly sub-sampled UK Biobank data with 408,144 White British participants for waist-to-hip ratio. The reported run time was median of five runs with samples randomly selected from the full sample set using different sampling seeds. The reported computation time for EmmaX-SKAT and SMMAT was projected when N > 20,000. As the number of tested markers varies by sample sizes, the computation time was projected for 50 markers per gene for plotting. Numerical data are provided in Supplementary Table 1.
Extended Data Fig. 8. Log-log plot of the estimated run time as a function of number of markers per gene.
Benchmarking was performed on randomly sub-sampled 400,000 UK Biobank data with 408,144 white British participants for waist-to-hip ratio on 15,342 genes. The plotted run time was median of five runs with samples randomly selected from the full sample set using different sampling seeds. The computation time for other different number of markers per gene was projected based on the benchmarked time.
Extended Data Fig. 9. Log-log plots of the estimated run time and memory usage as a function of sample size (N) for genome-wide tests for 286,000 chunks.
a, Run time. b, Memory usage. Each chunk contains 50 variants on average, given that there are 14.3 million markers in the HRC-imputed UK Biobank with MAF ≤ 1% and imputation info score ≥ 0.8. Numerical data are provided in Supplementary Table 1. Benchmarking was performed on randomly sub-sampled UK Biobank data with 408,144 white British participants for waist-to-hip ratio. The plotted run time and memory were medians of five runs with samples randomly selected from the full sample set using different sampling seeds.
Extended Data Fig. 10. Log-log plots of the estimated run time for as a function of sample size (N) for SAIGE-GENE with and without using the robust adjustment.
a, Exome-wide gene-based tests for 15,871 genes. b, Genome-wide tests for 286,000 chunks. Each gene or chunk contains 50 variants on average. Benchmarking was performed on randomly sub-sampled UK Biobank data with 402,163 white British participants tested for glaucoma (PheCode: 365, 4,462 cases and 397,701 controls). The case-control ratio remained the same in subsampled data sets. The reported run time was median of five runs with samples randomly selected from the full sample set using different sampling seeds. As the number of tested markers varies by sample sizes, the computation time was projected for 50 markers per gene for plotting. Numerical data are provided in Supplementary Table 2.
Supplementary Material
ACKNOWLEDGMENTS
This research has been conducted using the UK Biobank Resource under application number 45227. The Nord-Trøndelag Health Study (the HUNT Study) is a collaboration between the HUNT Research Centre (Faculty of Medicine, Norwegian University of Science and Technology (NTNU)), Nord-Trøndelag County Council, the Central Norway Health Authority, and the Norwegian Institute of Public Health. The K.G. Jebesen Center for Genetic Epidemiology is financed by Stiftelsen Kristian Gerhard Jebsen, the Faculty of Medicine and Health Sciences Norwegian University of Science and Technology (NTNU), and the Central Norway Regional Health Authority. SL and WB were supported by NIH R01 HG008773. WZ was supported by an NIH T32 fellowship (Grant number: 1T32HG010464-01).
Footnotes
COMPETING FINANCIAL INTERESTS STATEMENT
G.R.A. is an employee of Regeneron Pharmaceuticals. He owns stock and stock options for Regeneron Pharmaceuticals. B.N. is a member of Deep Genomics Scientific Advisory Board, has received travel expenses from Illumina, and also serves as a consultant for Avanir and Trigeminal solutions.
REFERENCES
- 1.Taliun D et al. Sequencing of 53,831 diverse genomes from the NHLBI TOPMed Program. bioRxiv (2019). [DOI] [PMC free article] [PubMed] [Google Scholar]
- 2.Bycroft C et al. The UK Biobank resource with deep phenotyping and genomic data. Nature 562, 203–209, doi: 10.1038/s41586-018-0579-z (2018). [DOI] [PMC free article] [PubMed] [Google Scholar]
- 3.Lee S, Abecasis GR, Boehnke M & Lin X Rare-variant association analysis: study designs and statistical tests. Am J Hum Genet 95, 5–23, doi: 10.1016/j.ajhg.2014.06.009 (2014). [DOI] [PMC free article] [PubMed] [Google Scholar]
- 4.Wu MC et al. Rare-variant association testing for sequencing data with the sequence kernel association test. Am J Hum Genet 89, 82–93, doi: 10.1016/j.ajhg.2011.05.029 (2011). [DOI] [PMC free article] [PubMed] [Google Scholar]
- 5.Lee S, Wu MC & Lin X Optimal tests for rare variant effects in sequencing association studies. Biostatistics 13, 762–775, doi: 10.1093/biostatistics/kxs014 (2012). [DOI] [PMC free article] [PubMed] [Google Scholar]
- 6.Chen H et al. Efficient Variant Set Mixed Model Association Tests for Continuous and Binary Traits in Large-Scale Whole-Genome Sequencing Studies. Am J Hum Genet 104, 260–274, doi: 10.1016/j.ajhg.2018.12.012 (2019). [DOI] [PMC free article] [PubMed] [Google Scholar]
- 7.Kang HM et al. Variance component model to account for sample structure in genome-wide association studies. Nat Genet 42, 348–354, doi: 10.1038/ng.548 (2010). [DOI] [PMC free article] [PubMed] [Google Scholar]
- 8.Natarajan P et al. Deep-coverage whole genome sequences and blood lipids among 16,324 individuals. Nat Commun 9, 3391, doi: 10.1038/s41467-018-05747-8 (2018). [DOI] [PMC free article] [PubMed] [Google Scholar]
- 9.Zhou W et al. Efficiently controlling for case-control imbalance and sample relatedness in large-scale genetic association studies. Nat Genet 50, 1335–1341, doi: 10.1038/s41588-018-0184-y (2018). [DOI] [PMC free article] [PubMed] [Google Scholar]
- 10.Dey R, Schmidt EM, Abecasis GR & Lee S A Fast and Accurate Algorithm to Test for Binary Phenotypes and Its Application to PheWAS. Am J Hum Genet 101, 37–49, doi: 10.1016/j.ajhg.2017.05.014 (2017). [DOI] [PMC free article] [PubMed] [Google Scholar]
- 11.Kuonen D Saddlepoint approximations for distributions of quadratic forms in normal variables. Biometrika 4, 7 (1999). [Google Scholar]
- 12.Daniels HE Saddlepoint Approximations in Statistics. Ann. Math. Statist. 25, 631–650, doi: 10.1214/aoms/1177728652 (1954). [DOI] [Google Scholar]
- 13.Lee S, Fuchsberger C, Kim S & Scott L An efficient resampling method for calibrating single and gene-based rare variant association analysis in case-control studies. Biostatistics 17, 1–15, doi: 10.1093/biostatistics/kxv033 (2016). [DOI] [PMC free article] [PubMed] [Google Scholar]
- 14.Zhao Z et al. UK Biobank Whole-Exome Sequence Binary Phenome Analysis with Robust Region-Based Rare-Variant Test. Am J Hum Genet 106, 3–12, doi: 10.1016/j.ajhg.2019.11.012 (2020). [DOI] [PMC free article] [PubMed] [Google Scholar]
- 15.Krokstad S et al. Cohort Profile: the HUNT Study, Norway. Int J Epidemiol 42, 968–977, doi: 10.1093/ije/dys095 (2013). [DOI] [PubMed] [Google Scholar]
- 16.Langhammer A, Krokstad S, Romundstad P, Heggland J & Holmen J The HUNT study: participation is associated with survival and depends on socioeconomic status, diseases and symptoms. BMC medical research methodology 12, 143–143, doi: 10.1186/1471-2288-12-143 (2012). [DOI] [PMC free article] [PubMed] [Google Scholar]
- 17.Loh PR et al. Efficient Bayesian mixed-model analysis increases association power in large cohorts. Nat Genet 47, 284–290, doi: 10.1038/ng.3190 (2015). [DOI] [PMC free article] [PubMed] [Google Scholar]
- 18.Svishcheva GR, Axenovich TI, Belonogova NM, van Duijn CM & Aulchenko YS Rapid variance components-based method for whole-genome association analysis. Nat Genet 44, 1166–1170, doi: 10.1038/ng.2410 (2012). [DOI] [PubMed] [Google Scholar]
- 19.Liu DJ et al. Meta-analysis of gene-level tests for rare variant association. Nat Genet 46, 200–204, doi: 10.1038/ng.2852 (2014). [DOI] [PMC free article] [PubMed] [Google Scholar]
- 20.Yang J, Zaitlen NA, Goddard ME, Visscher PM & Price AL Advantages and pitfalls in the application of mixed-model association methods. Nat Genet 46, 100–106, doi: 10.1038/ng.2876 (2014). [DOI] [PMC free article] [PubMed] [Google Scholar]
- 21.Willer CJ et al. Discovery and refinement of loci associated with lipid levels. Nat Genet 45, 1274–1283, doi: 10.1038/ng.2797 (2013). [DOI] [PMC free article] [PubMed] [Google Scholar]
- 22.Willer CJ et al. Newly identified loci that influence lipid concentrations and risk of coronary artery disease. Nat Genet 40, 161–169, doi: 10.1038/ng.76 (2008). [DOI] [PMC free article] [PubMed] [Google Scholar]
- 23.Holm H et al. Several common variants modulate heart rate, PR interval and QRS duration. Nat Genet 42, 117–122, doi: 10.1038/ng.511 (2010). [DOI] [PubMed] [Google Scholar]
- 24.Eijgelsheim M et al. Genome-wide association analysis identifies multiple loci related to resting heart rate. Hum Mol Genet 19, 3885–3894, doi: 10.1093/hmg/ddq303 (2010). [DOI] [PMC free article] [PubMed] [Google Scholar]
- 25.Eppinga RN et al. Identification of genomic loci associated with resting heart rate and shared genetic predictors with all-cause mortality. Nat Genet 48, 1557–1563, doi: 10.1038/ng.3708 (2016). [DOI] [PubMed] [Google Scholar]
- 26.Arking DE et al. Genetic association study of QT interval highlights role for calcium signaling pathways in myocardial repolarization. Nat Genet 46, 826–836, doi: 10.1038/ng.3014 (2014). [DOI] [PMC free article] [PubMed] [Google Scholar]
- 27.Swoap SJ, Weinshenker D, Palmiter RD & Garber G Dbh(−/−) mice are hypotensive, have altered circadian rhythms, and have abnormal responses to dieting and stress. Am J Physiol Regul Integr Comp Physiol 286, R108–113, doi: 10.1152/ajpregu.00405.2003 (2004). [DOI] [PubMed] [Google Scholar]
- 28.Marouli E et al. Rare and low-frequency coding variants alter human adult height. Nature 542, 186–190, doi: 10.1038/nature21039 (2017). [DOI] [PMC free article] [PubMed] [Google Scholar]
- 29.Turalba AV & Chen TC Clinical and genetic characteristics of primary juvenile-onset open-angle glaucoma (JOAG). Semin Ophthalmol 23, 19–25, doi: 10.1080/08820530701745199 (2008). [DOI] [PubMed] [Google Scholar]
- 30.Breslow NE & Clayton DG Approximate Inference in Generalized Linear Mixed Models. Journal of the American Statistical Association 88, 9–25, doi: 10.2307/2290687 (1993). [DOI] [Google Scholar]
METHODS-ONLY REFERENCES
- 31.Chen H et al. Control for Population Structure and Relatedness for Binary Traits in Genetic Association Studies via Logistic Mixed Models. Am J Hum Genet 98, 653–666, doi: 10.1016/j.ajhg.2016.02.012 (2016). [DOI] [PMC free article] [PubMed] [Google Scholar]
- 32.Lee SH & van der Werf JH An efficient variance component approach implementing an average information REML suitable for combined LD and linkage mapping with a general complex pedigree. Genet Sel Evol 38, 25–43, doi: 10.1051/gse:2005025 (2006). [DOI] [PMC free article] [PubMed] [Google Scholar]
- 33.Gilmour AR, Thompson R & Cullis BR Average Information REML: An Efficient Algorithm for Variance Parameter Estimation in Linear Mixed Models. Biometrics 51, 1440–1450, doi: 10.2307/2533274 (1995). [DOI] [Google Scholar]
- 34.Lee S, Teslovich TM, Boehnke M & Lin X General framework for meta-analysis of rare variants in sequencing association studies. Am J Hum Genet 93, 42–53, doi: 10.1016/j.ajhg.2013.05.010 (2013). [DOI] [PMC free article] [PubMed] [Google Scholar]
- 35.Davis TA Direct Methods for Sparse Linear Systems (Fundamentals of Algorithms 2). (Society for Industrial and Applied Mathematics, 2006). [Google Scholar]
- 36.Abecasis GR, Cherny SS, Cookson WO & Cardon LR Merlin--rapid analysis of dense genetic maps using sparse gene flow trees. Nat Genet 30, 97–101, doi: 10.1038/ng786 (2002). [DOI] [PubMed] [Google Scholar]
- 37.de Villemereuil P, Schielzeth H, Nakagawa S & Morrissey M General Methods for Evolutionary Quantitative Genetic Inference from Generalized Mixed Models. Genetics 204, 1281–1294, doi: 10.1534/genetics.115.186536 (2016). [DOI] [PMC free article] [PubMed] [Google Scholar]
- 38.Das S et al. Next-generation genotype imputation service and methods. Nat Genet 48, 1284–1287, doi: 10.1038/ng.3656 (2016). [DOI] [PMC free article] [PubMed] [Google Scholar]
- 39.McCarthy S et al. A reference panel of 64,976 haplotypes for genotype imputation. Nat Genet 48, 1279–1283, doi: 10.1038/ng.3643 (2016). [DOI] [PMC free article] [PubMed] [Google Scholar]
Associated Data
This section collects any data citations, data availability statements, or supplementary materials included in this article.
Supplementary Materials
Data Availability Statement
SAIGE-GENE is implemented as an open-source R package available at https://github.com/weizhouUMICH/SAIGE/master.
The summary statistics and QQ plots for 53 quantitative phenotypes and 10 binary phenotypes in UK Biobank by SAIGE-GENE are currently available for public download at https://www.leelabsg.org/resources.
Genome build
All genomic coordinates are given in NCBI Build 37/UCSC hg19.
Statistical analysis
We performed gene-based Burden, SKAT and SKAT-O tests using SAIGE-GENE on 15,342 genes for 53 quantitative traits and 10 binary traits in 408,910 UK Biobank participants with White British ancestry, who passed the quality control in the UK Biobank2. In the linear mixed model for quantitative traits, the first four genetic principal components (PCs), gender and age when attended assessment center were included as the non-genetic covariates. In the logistic mixed model for binary traits, the first four genetic principal components, gender and birth year were included as the non-genetic covariates. We also performed the same gene-based tests 13,416 genes for HDL levels in 69,500 Norwegian samples from the HUNT study15,16. In the linear mixed model for HDL, age, sex, genotyping batch, and first four PCs were included as non-genetic covariates. The numbers of samples used for analysis are included in the legend of each figure.
Life Sciences Reporting Summary
Further information on study design is available in the Nature Research Reporting Summary linked to this article.


