

Abstract
Severe acute respiratory syndrome coronavirus 2 (SARS-CoV-2) is the cause of the ongoing coronavirus disease 2019 (COVID-19) pandemic. Understanding of the RNA virus and its interactions with host proteins could improve therapeutic interventions for COVID-19. By using icSHAPE, we determined the structural landscape of SARS-CoV-2 RNA in infected human cells and from refolded RNAs, as well as the regulatory untranslated regions of SARS-CoV-2 and six other coronaviruses. We validated several structural elements predicted in silico and discovered structural features that affect the translation and abundance of subgenomic viral RNAs in cells. The structural data informed a deep-learning tool to predict 42 host proteins that bind to SARS-CoV-2 RNA. Strikingly, antisense oligonucleotides targeting the structural elements and FDA-approved drugs inhibiting the SARS-CoV-2 RNA binding proteins dramatically reduced SARS-CoV-2 infection in cells derived from human liver and lung tumors. Our findings thus shed light on coronavirus and reveal multiple candidate therapeutics for COVID-19 treatment.
Keywords: SARS-CoV-2, RNA secondary structure, host factor, RBP binding prediction, drug reproposing
Graphical abstract
Sun et al. determined the SARS-CoV-2 RNA genome structure in infected cells and from refolded RNAs, which enabled prediction of 42 host proteins that bind to viral RNA, using a deep-learning tool and identification of FDA-approved drugs for repurposing to reduce SARS-CoV-2 infection in cells.
Introduction
Coronavirus disease 2019 (COVID-19), caused by a coronavirus named severe acute respiratory syndrome coronavirus 2 (SARS-CoV-2), has spread globally and devastated public health and economies, with more than 96 million people infected and 2 million deceased to date (Dong et al., 2020; Perlman, 2020; Wu et al., 2020). Although huge global efforts have been devoted to understanding and fighting SARS-CoV-2, including extensive molecular virology studies examining the overall viral particle and viral protein structures (Gao et al., 2020; Klein et al., 2020; Lan et al., 2020; Walls et al., 2020; Yan et al., 2020), transcriptome architectures (Kim et al., 2020), and host cell-viral interactomes (Gordon et al., 2020), as well as mechanistic studies of the virus infection process and antiviral immune responses (Hoffmann et al., 2020; Ni et al., 2020; Walls et al., 2020), novel insights into viral mechanisms are expected to yield new, effective antiviral treatments.
SARS-CoV-2 is an RNA virus of the Coronaviridae family, which also includes the SARS-CoV virus that caused the SARS outbreak in 2003 (Peiris et al., 2003) and the Middle East respiratory syndrome coronavirus (MERS-CoV) that caused the MERS outbreak in 2012 (Zaki et al., 2012). The genome of SARS-CoV-2 is an approximately 30-kb, single-stranded, positive-sense RNA that includes a 5′ cap structure and a 3′ poly(A) tail. After cell entry, the viral genome is translated into proteins and also serves as the template for replication and transcription. During translation, SARS-CoV-2 produces nonstructural proteins (nsps) from two open reading frames (ORF1a and ORF1b) and a number of structural proteins from subgenomic viral RNAs. Generation of minus-strand RNA by the nsp12 protein (an RNA-dependent RNA polymerase, RdRP) enables synthesis of the plus-strand genomic RNA and of subgenomic RNAs. The RNA comprising the SARS-CoV-2 genome is packaged by structural proteins encoded by subgenomic RNAs.
It is notable that most molecular virology studies of SARS-CoV-2 (and indeed studies of most other viruses) have focused on viral proteins. For example, structural determination of the receptor-binding domain of the spike protein of SARS-CoV-2 bound to the cell receptor ACE2 provided atomic details on the initial step of infection (Lan et al., 2020; Walls et al., 2020; Yan et al., 2020). The identification of SARS-CoV-2 protein-human protein interactions revealed how SARS-CoV-2 reshapes cellular pathways and uncovered druggable host factors targeted by FDA-approved drugs and small compounds (Gordon et al., 2020). Tracking and analysis of changes in the key proteins of SARS-CoV-2 discovered an important mutation that is associated with increased transmission (Korber et al., 2020). These studies have been valuable for revealing mechanistic insights to deepen understanding of molecular virology and epidemiology and to aid development of antiviral therapeutics.
Nevertheless, SARS-CoV-2 is an RNA virus and the RNA genome itself is a central regulatory hub that controls and enables its function. RNA molecules fold into complex, higher-order structures that are integral to their cellular functions (Brion and Westhof, 1997; Piao et al., 2017; Ren et al., 2017; Yang et al., 2018). Many RNA structural elements have also been identified in viruses. For instance, flaviviruses display intramolecular RNA-RNA interactions between the 5′ and the 3′ untranslated regions (UTRs) that promote genome circularization and help to coordinate replication (de Borba et al., 2015; Nicholson and White, 2014); the structure of the internal ribosome entry site in 5′UTR of hepatitis C virus (HCV) is crucial for translation (Fraser and Doudna, 2007; Kieft, 2008), and the multi-pseudoknot structures in the 3′UTR of ZIKV and other flaviviruses have been shown to stall the RNA exonuclease Xrn1, thereby giving rise to subgenomic flavivirus RNAs that help the virus evade cellular antiviral processes (Akiyama et al., 2016; Filomatori et al., 2017). However, despite functional characterization of several RNA structural elements of SARS (Robertson et al., 2005), and theoretical predictions recently available along with the sequences of SARS-CoV-2 (Andrews et al., 2020; Rangan et al., 2020), it is clear that a more comprehensive analysis of the structure of the SARS-CoV-2 RNA genome as it exists in infected cells is essential to comprehensively understand viral infection and treatment strategies.
Of particular interest, a recent study found that a SARS-CoV-2 variant with a glycine at the residue 614 of the spike protein could confer a fitness advantage; this variant has become the dominant pandemic form of the virus (Korber et al., 2020). This amino acid substation was postulated to increase transmission rates by facilitating cell entry or reducing the immune response. Interestingly, this variant is almost invariably accompanied by a C241T mutation in the SARS-CoV-2 5′UTR. It has been suggested that non-coding and synonymous mutations could affect the infectivity of Zika virus through perturbations to RNA structure (Li et al., 2018). Structure differences between distinct SARS-CoV-2 strains could also contribute to their different infectivity and transmission rates.
More importantly, previous studies of other RNA viruses have identified numerous host RNA binding proteins (RBPs) that regulate the viral infection cycle (Li and Nagy, 2011; Ooi et al., 2019; Ramanathan et al., 2018), but this information is lacking for SARS-CoV-2. Our group recently demonstrated that RNA structure data can be assessed with cutting-edge deep-learning techniques to accurately predict in vivo RBP-RNA bindings, with a neural network model that integrates in vivo RBP binding and RNA features in matched cells (Sun et al., 2021). Given the centrality of such interactions to understanding how viruses engage with their host cells, a large-scale survey and/or prediction to determine which host RBPs interact with SARS-CoV-2 genomic RNAs during infection would provide an extremely rich resource for molecular insights.
Here, we investigated the in vivo and in vitro RNA secondary structures of SARS-CoV-2, as well as the structures of the UTRs of six related coronaviruses by using a high-throughput technology known as in vivo click selective 2-hydroxyl acylation and profiling experiment (icSHAPE) (Spitale et al., 2015). Based on the in vivo structural data, we used our deep-learning tool to accurately predict 42 functionally related host proteins that bind to the UTRs of the SARS-CoV-2 RNA genome (Sun et al., 2021). We subsequently validated the physical and functional interactions of several proteins predicted to bind viral RNA. By using an innovative SARS-CoV-2 cell infection system and infection assays with the bona fide SARS-CoV-2 virus, we validated that several of the conserved RNA structural elements do contribute to viral infection. Also, we found that some of these host proteins are vulnerable drug targets; their chemical inhibition with repurposed FDA-approved drugs led to a significant decrease in SARS-CoV-2 infection of cells.
Results
icSHAPE-based determination of the SARS-CoV-2 RNA genome structural landscape
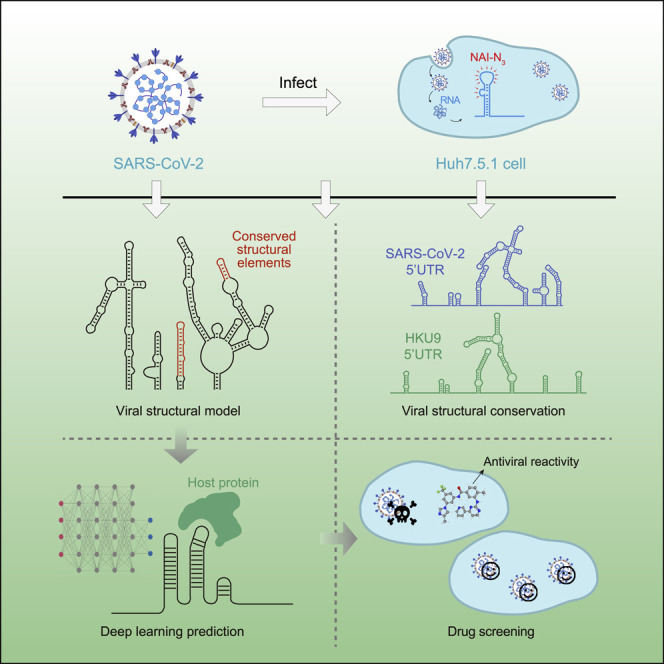
To delineate the genome-wide structure of SARS-CoV-2, we performed icSHAPE technology (Figure 1 ; STAR methods) (Spitale et al., 2015). The icSHAPE assay uses an RNA structure probing reagent NAI-N3 that selectively modifies the 2′-OH of single-stranded nucleotides. The modification blocks reverse transcriptase (RT), thus enabling the detection of single-stranded nucleotides by reverse transcription followed by deep sequencing and bioinformatics analysis.
Figure 1.

icSHAPE-based analysis of the RNA genome structure of SARS-CoV-2 and six other coronaviruses
(A) Schematic illustrating use of icSHAPE for in vivo studies of the SARS-CoV-2 RNA genome structure. We infected Huh7.5.1 cells with SARS-CoV-2, treated these cells with the RNA structure probing reagent NAI-N3, and then performed icSHAPE experiments to characterize the in vivo SARS-CoV-2 RNA genome structure in host cells.
(B) Schematic for in vitro structural analysis of the SARS-CoV-2 RNA genome purified from infected cells. SARS-CoV-2 RNA was purified from infected Huh7.5.1 cells, followed by in vitro refolding, NAI-N3 modification, and icSHAPE experiments.
(C) Schematic for the structural characterization of in vitro transcribed viral RNA UTRs within SARS-CoV-2 RNA and six additional coronaviruses (e.g., SARS-CoV, MERS-CoV, etc.).
(D) The icSHAPE RNA structural data informed multiple downstream analyses (including construction of an in vivo SARS-CoV-2 RNA genome structural model), identification of viral structural elements and conserved structures in different subfamilies of coronavirus, prediction of viral RNA-host protein interactions, and drug screens for potential COVID-19 therapeutics.
Briefly, we infected the human liver cancer cell line Huh7.5.1 with SARS-CoV-2 and treated infected cells with NAI-N3. NAI-N3 is cell permeable and allows the determination of in vivo structures of the viral RNA genome (and the host cell transcriptome) (Figure 1A). Finally, we obtained an icSHAPE reactivity score between 0 and 1 for each nucleotide, with a higher score indicating that a nucleotide is more likely single stranded. Based on mapping of the single-stranded nucleotides, icSHAPE analysis thus enables elucidation of the structural landscape of all RNAs in vivo. In addition, we treated purified and refolded total RNA from infected cells with NAI-N3 to obtain the in vitro structure of the SARS-CoV-2 RNA genome (Figure 1B). We also used icSHAPE to determine the structure of in vitro transcribed and refolded untranslated regions from seven different coronaviruses, including the reference SARS-CoV-2 and a mutant (Figure 1C). The icSHAPE structure data informed our downstream analyses (Figure 1D).
For the in vivo icSHAPE structural map of the SARS-CoV-2 RNA genome, we obtained an average of about 150 million reads for each library replicate (Table S1). Underscoring the very high quality of our sequencing data, we found that the inter-replicate Pearson correlation coefficient values are higher than 0.98 for comparison of RNA expression (RPKM) levels of the host transcriptome (Figure S1 A); the correlation of the RT-stop caused by NAI-N3 modifications on the viral RNA genome exceeded 0.99 (Figure S1B). Finally, we obtained icSHAPE scores for more than 99.88% of the nucleotides for in vivo SARS-CoV-2 RNA genome structure by using icSHAPE-pipe (Li et al., 2020) (Figures 2A and 2B; Table S2).
Figure S1.

Quality control of icSHAPE data, related to STAR methods and Figure 2
(A) Correlation of RNA expression (RPKM) of the host transcriptome between replicates of icSHAPE libraries for DMSO treatment, NAI-N3 modification in vivo, and NAI-N3 modification in vitro. N is the number of transcripts.
(B) Correlation of RNA reverse transcription stop (RT stop) sites on SARS-CoV-2 between replicates of icSHAPE libraries in untreated (DMSO) samples and upon NAI-N3 modification, both in vivo and in vitro.
(C) Receiver operating characteristic (ROC) curve of icSHAPE reactivity scores fitting the theoretical structural model of rRNA and SRP. For rRNA, only bases with solvent accessibility greater than 3 are considered.
Figure 2.

Structural overview of the SARS-CoV-2 RNA genome
(A) Scale marker for the 30-kb SARS-CoV-2 RNA genome (top) and a genic model showing the known organization of the genome into the 5′ UTR, the two known ORFs (ORF1a and ORF1b), nine major subgenomic RNAs, and the 3′ UTR (bottom).
(B) Top track: Normalized icSHAPE reactivity scores across the whole SARS-CoV-2 genome based on in vivo data, shown relative to the global median value, with higher values corresponding to more flexible nucleotides. Blue represents a nucleotide more likely to be base paired, whereas red represents a nucleotide more likely to be single-stranded. The normalized scores have been smoothed using a 30-nt window size. Middle track: Normalized genome-wide icSHAPE reactivity scores for the SARS-CoV-2 genome based on the in vitro refolding data. Bottom tracks: in vivo and in vitro icSHAPE reactivity score differences (in vivo – in vitro) of the 5′UTR, an example ORF1ab region, and the 3′UTR. Significant regions are highlighted with red boxes.
(C) RNA structure models of the SARS-CoV-2 5′-UTR (left) and 3′-UTR (right) (both with flanking regions), constructed with the RNAstructure program using the icSHAPE reactivity scores as constraints. Nucleotides are colored by icSHAPE reactivity scores, with red and yellow colors indicating reactive nucleotides. Blue bars show the probability of base pairing. Nucleotides with a color background were predicted as co-variant base pairs. The red dashed boxes label the structural regions with differences in comparison with Rangan’s structural models (Rangan et al., 2020).
See also Figures S1 and S2; Tables S1 and S2.
To assess the accuracy of our in vivo structure, we calculated an area under the receiver operating characteristic curve (AUC) to quantitatively evaluate the predictive performance of icSHAPE scores for the structure models by using a previously established method (Burkhardt et al., 2017; Zubradt et al., 2017) (STAR methods). We first compared the structural data we obtained for 18S rRNA, 28S rRNA, and the signal recognition particle (SRP) RNA in Huh7.5.1 cells with well-known reference structures (Andronescu et al., 2008; Bernier et al., 2014). We observed high AUCs for these structures (AUC = 0.813 for 18SrRNA, AUC = 0.804 for 28S rRNA, and AUC = 0.730 for SRP RNA; Figure S1C), indicating that the icSHAPE scores are consistent with the reference structures.
We also compared our structural data with another extensively studied coronavirus, mouse hepatitis virus (MHV), which has a SHAPE reactivity score-directed RNA structural model for its 5′UTR region (Yang et al., 2015). The two structural models were very similar, with the exception that MHV has apparently lost the SL3 elements. Further, we compared the icSHAPE scores of viral RNAs with the very recently published theoretical models of the secondary RNA structures of the SARS-CoV-2 5′UTR and 3′UTR (Rangan et al., 2020). We observed a high AUC (AUC = 0.854) for the 5′UTR but a relatively low AUC for the 3′UTR (AUC = 0.692). The low AUC could be explained by the dynamic structure of the 3′UTR in cells, for example, the alternative conformations between the extended bifurcated stem-loop (BSL) conformer and the P1Pk pseudoknot in Rangan’s model (Rangan et al., 2020).
Next we built the 5′UTR and 3′UTR structure models with RNA structure modeling software tools (here we used RNAstructure) (Reuter and Mathews, 2010), with icSHAPE scores as constraints (Figure 2C; STAR methods); such methods have been extensively used and validated by other groups and ours in RNA structural studies including viral RNA structures (Li et al., 2018; Pirakitikulr et al., 2016; Watts et al., 2009) (STAR methods). Attesting to the quality of the map generated from our in vivo data, the SARS-CoV-2 models strongly agreed with those theoretical models (Figures S2 A and S2B), including Stem-loop 1 (SL1), Stem-loop 2 (SL2), Stem-loop 3 (SL3), Stem-loop 4 (SL4), and Stem-loop 5 (SL5) within the 5′UTR. To quantitatively compare the similarity between our model with Rangan's model, we calculated both sensitivity values and positive predictive value (PPV) using Rangan's model as the reference (Deigan et al., 2009) (STAR methods). We observed very high sensitivities and PPV scores (sensitivity 0.945/0.913 and PPV 1.0/0.824 for the 5′UTR and 3′UTR, respectively), suggesting very high agreement between the two models.
Figure S2.

The SARS-CoV-2 RNA structure differs in vivo and in vitro, related to Figure 2
(A-B) 5’UTR (A) and 3’UTR (B) models constructed in this study with in vivo structural data as constraints (Left) and Rangan’s models (Rangan et al., 2020) (Right). The difference is labeled by red dashed boxes.
(C) Pearson correlation coefficients of icSHAPE reactivity scores of the SARS-CoV-2 RNA genome among in vivo or in vitro replicate samples.
(D) Distributions of icSHAPE reactivity scores in vivo or in vitro.
(E) Heatmap of sequence divergence and phylogenetic tree of coronaviridae genomes. The color scale represents sequence similarity between strains.
We also observed small differences between our model and the theoretical model presented in Rangan et al. (shown in red dashed-line boxes; Figures 2C, S2A, and S2B). For instance, our in vivo structural data suggested that the region downstream of SL4 within the 5′UTR is single stranded, whereas it forms a short SL in the Rangan model. Another example is that we detected a loop structure rather than a pseudoknot in the 3′UTR of the SARS-CoV-2 genome. This alternative structural interpretation is supported by the high icSHAPE score constraint; either this pseudoknot is not stable or does not exist. These findings highlight that in vivo structural information is critical for building of physiologically relevant structural models.
We also used icSHAPE to conduct in vitro structural analysis of the SARS-CoV-2 RNA genome (Figure 2B, middle track). SARS-CoV-2 RNA was purified from infected Huh7.5.1 cells, refolded in vitro, then modified with NAI-N3, with the remaining steps and data analysis the same as in vivo icSHAPE. We searched for structurally variable regions between the in vivo and in vitro data by considering replicate variations and by using both a binomial test and a permutation test (STAR methods). Similar to previous studies (Spitale et al., 2015; Sun et al., 2019), our comparative analysis of the in vivo and in vitro structure probing data revealed many common stable structures but also indicated substantial differences (Figure 2B, compare top and middle tracks; the zoom-in views of the in vivo and in vitro structural differences of the UTRs are in the bottom track), with a 0.58 Pearson correlation coefficient between the in vitro and in vivo structural profiles (Figure S2C). In total, 371 structurally variable regions were defined at the whole-genome level (Table S3). These structurally variable regions could contain many functional regions. For example, structurally variable regions within the Xist lncRNA structure are known hub regions for protein binding (Ariumi et al., 2011). The SARS-CoV-2 RNA genome appeared to be more single stranded in vivo than in vitro (Figure S2D), consistent with previous studies of other viral RNA genome structure (Simon et al., 2019). Overall, these agreements and differences between the in vivo and theoretical and in vitro data suggest that, although in general there are many stable structural elements throughout the RNA, the cellular environment and/or co-transcriptional folding can affect the overall structure of the SARS-CoV-2 RNA genome.
In vivo structural model of the whole SARS-CoV-2 RNA genome
Next, we extended the approach of RNA structure modeling with in vivo icSHAPE scores as constraints to build in vivo structural models for the whole SARS-CoV-2 RNA genome (STAR methods). We tested different intercept and slope parameters for modeling of the SARS-CoV-2 5′UTR and 3′UTR structures and then used the parameters that generated the most consistent structure with the Rangan’s and Rfam’s models for genome-wide modeling (Kalvari et al., 2018a; Rangan et al., 2020). Because RNA structural modeling is most successful for small RNA fragments (Li et al., 2018), we used a sliding window (window = 5,000 nt, step = 1,000 nt) strategy to more accurately model RNA structures of a limited length; for overlapping regions, we selected structure models with higher pairing probabilities.
We assessed co-evolutionary evidence to validate our final models. We used the Infernal package (Nawrocki and Eddy, 2013b) to search for an alignment homologous sequence and defined a covariation score to call co-variant pairs from the deduplicated coronavirus genomes (Figure S2E; STAR methods) (Li et al., 2018; Pirakitikulr et al., 2016). In total, we found 170 co-variant pairs, including six within the 5′UTR and 12 within the 3′UTR (Figures 3 and S3 ). The flanking regions of the UTR also contain many co-variant pairs (two downstream of the 5′UTR and eight upstream of the 3′UTR flanking), suggesting these are potential regulatory regions. Interestingly, we observed another five co-variations within a duplex formed between the 3′UTR and “ORF10”. ORF10 is a cryptic ORF upstream of the 3′UTR that was predicted computationally but lacks empirical evidence for the protein or the subgenomic RNA (Kim et al., 2020). Our structural data raised the possibility that this region is a part of a structure within the 3′UTR (Figure 3).
Figure 3.

Schematic of the SARS-CoV-2 RNA structure (1–394 nt and 21,473–29,876 nt)
Nucleotides are colored with icSHAPE reactivity scores; blue bars show the probability of base pairing. Nucleotides with a color background were predicted as co-variant base pairs. The boxplot insets at the bottom show the distributions of icSHAPE reactivity scores. Note that a full-length structure model of the SARS-CoV-2 RNA genome is shown in Figure S3. The start and stop sites of each ORF are labeled with green and yellow colors.
Figure S3.

Structural model (ORF1ab) of the SARS-CoV-2 RNA genome, related to STAR methods and Figure 3
Nucleotides are colored with icSHAPE reactivity scores; blue bars show the probability of base pairing. Nucleotides with a color background were predicted as co-variant base pairs. Sequence information is included in Table S2
Overall, these results support that our SARS-CoV-2 structural analysis using icSHAPE constraints yielded a reliable RNA structural model. This model enabled our identification of candidate functional structural elements, and it represents a rich resource to support both basic hypothesis-driven investigations about host-virus biology and the development of potential antiviral applications (e.g., antisense oligonucleotide [ASO]- or small interfering RNA [siRNA]-based therapies).
Structural conservation and divergence across the non-coding regions of the Coronavirinae family
The conservation of an RNA structure across evolution suggests functional importance. To uncover conserved structures within the non-coding regions in Coronavirinae, we performed icSHAPE analysis of in vitro transcribed and refolded 5′UTRs and 3′UTRs from seven different coronavirus genera and lineages, including SARS-CoV-2 (Figure 4 A; Table S2; STAR methods).
Figure 4.

Comparative analysis reveals structural characteristics and conservations among 5′-UTRs of seven coronaviruses
(A) Phylogenetic diagram showing the evolution of the coronaviridae alpha and beta subfamilies. The seven coronaviruses investigated with icSHAPE analysis and colored in red are from the alpha coronavirus subfamily (HCoV-NL63) and different lineages of the beta coronavirus subfamily, including lineage A (HCoV-HKU1), lineage B (SARS-CoV, SARS-CoV-2), lineage C (MERS-CoV, BtCoV-HKU5), and lineage D (BtCoV-HKU9).
(B) icSHAPE reactivity scores for the 5′-UTRs (with flanking regions) for the selected coronaviruses. Viruses with sequence similarity higher than 70% are clustered into the same group. Red stars and dashed lines show the C to T mutation at 241 nt in SARS-CoV-2.
(C) Structural models of the 5′-UTRs of SARS-CoV-2, MERS-CoV, and BtCoV-HKU9. Nucleotides are colored with icSHAPE reactivity scores. Blue bars show the probability of base pairing. Nucleotides with a color background were predicted as co-variant base pairs.
See also Figures S4 and S5; Tables S2 and S4.
In particular, our comparative structural analyses included a SARS-CoV-2 mutant containing a C241T mutation in the 5′UTR, which is accompanied by the glycine mutation at the residue 614 found in the dominant pandemic form (Korber et al., 2020). We observed increased flexibility around this position (Figure 4B). Remarkably, this structure change will on the one hand result in the loss of a highly stable UUCG tetraloop (Ennifar et al., 2000; Thapar et al., 2014) and on the other hand create a single-stranded U-rich sequence (Schnell et al., 2012).
Across all of the untranslated regions we examined, the icSHAPE profile data revealed conserved structures largely consistent with the phylogeny (Figure 4B), both in 5′UTR (Figure S4 ) and 3′UTR (Figure S5 ). For example, the 5′UTRs for all of the lineage B group members (SARS-CoV and SARS-CoV-2) each contained seven SLs in the same order (Figures 4C, top, and S4A). Remarkably, seven almost-identical SLs, again in the same order, were present in the lineage C group (MERS-CoV and BtCoV-HKU5), despite a sequence similarity of only 46.5%∼47.3% with lineage B (Figures 4C, middle, and S4A and S4B). The more distant lineage D betacoronavirus (BtCoV-HKU9) also contains the same set of seven SLs, although slightly less similar in size, with only 39.3%∼40.7% sequence similarity to lineage B and C (Figures 4C, bottom, and S4B). Notably, although some Rfam theoretical models (Kalvari et al., 2018a) based on co-variation show similar structural architecture (Figure S4C; SARS-CoV-2), others miss conserved structural elements (Figure S4D; MERS-CoV and BtCoV-HKU9).
Figure S4.

Comparative analysis reveals structural characteristics and conservations among 5’-UTRs of seven coronaviruses, related to Figure 4
(A) Structural models of the 5’-UTRs of SARS-CoV-2-T (with a C to T mutation at 241nt), SARS-CoV, and BtCoV-HKU5. Nucleotides are colored with icSHAPE reactivity scores, blue bars show the probability of base pairing, and nucleotides with color backgrounds were predicted as co-variant base pairs.
(B) Top: sequence similarity matrix of 5’UTR among the seven coronaviruses. Bottom: structural similarity matrix of 5’UTR among the seven coronaviruses. Structural similarity scores were calculated using RNAforester in the ViennaRNA package.
(C) Computational structural model of the 5’-UTRs of SARS-CoV-2 from the Rfam database. Nucleotides are colored with icSHAPE reactivity scores.
(D) Computational structural model of the 5’-UTRs of MERS-CoV (top) and BtCoV-HKU9 (bottom) from the Rfam database. Nucleotides are colored with icSHAPE reactivity scores.
(E) Predicted structural models of the 5’-UTRs of HCoV-NL63 and HCoV-HKU1. Nucleotides are colored with icSHAPE reactivity scores, blue bars show the probability of base pairing, and nucleotides with color backgrounds were predicted as co-variant base pairs.
Figure S5.

Comparative analysis reveals structural characteristics and conservations among 3’-UTRs of seven coronaviruses and correlation between RNA structure and RNA regulation, related to Figure 4
(A) icSHAPE reactivity scores for the 3’-UTRs (with flanking regions) for the selected coronaviruses. Viruses with sequence similarity higher than 70% are clustered into the same group.
(B) Top: sequence similarity matrix of 3’UTR among the seven coronaviruses. Bottom: structural similarity matrix of 3’UTR among the seven coronaviruses. Structural similarity scores were calculated based on RNAforester in the ViennaRNA package.
(C) Structural models of the 3’-UTRs of SARS-CoV-2, SARS-CoV-2-T (with a C to T mutation at 241nt), and SARS-CoV. Nucleotides are colored with icSHAPE reactivity scores, blue bars show the probability of base pairing, and nucleotides with color backgrounds were predicted as co-variant base pairs.
(D) Scatter plot showing the correlations between the detected abundance of a given subgenomic RNA versus its icSHAPE reactivity score, for the specific regions of the 5’-UTRs of eight canonical subgenomic RNAs.
(E) Schematic illustrating the method to calculate RNA icSHAPE reactivity scores within the common regions of the 5’UTR by dissecting the mapping reads.
(F) Scatter plot showing the correlations between the detected abundance of a given subgenomic RNA versus its icSHAPE reactivity score, for the common regions of the 5’-UTRs of eight canonical subgenomic RNAs.
The Spearman correlation efficient and the two-tailed P value were calculated using the Python package function scipy.stats.spearmanr in D and F.
The lineage A betacoronavirus (HCoV-HKU1) and alphacoronavirus (HCoV-NL63) had similar levels of sequence similarity to betacoronaviruses of lineages B, C, and D (37.5%∼46.3% in the 5′UTR and 35.0%∼45.2% in the 3′UTR) (Figures S4B and S5B). However, these two viruses formed distinct secondary structures in their 5′UTRs, and only SL1 was conserved among all seven viruses (Figure S4E). This structural divergence suggests that the non-coding regions of these viruses could have evolved distinct functions and regulations.
In vivo RNA structure predicts translation efficiency and species abundance of subgenomic RNA
SARS-CoV-2 generates nine major subgenomic viral RNAs that encode structural proteins, including the spike protein, the envelope protein, the membrane protein, and the nucleocapsid protein, as well as other accessory proteins (Figure 5 A) (Kim et al., 2020). For context, subgenomic viral RNAs are generated from minus-strand viral RNA intermediates, which are synthesized by “discontinuous transcription” from the positive-strand genome. Discontinuous transcription begins at the 3′ end of the viral RNA genome, halts upon reaching a transcription-regulatory sequence in the “body” (TRS-B), and resumes upon switching template to the TRS in the leader (TRS-L), resulting in fusion of the leader to each ORF for each subgenomic viral RNA (Figure 5A).
Figure 5.

RNA structure functionally impacts both the generation and translation of SARS-CoV-2 subgenomic RNAs
(A) Schematic illustrating the architecture of SARS-CoV-2 subgenomic RNAs. TRS-L, the leader region of the transcriptional regulation sequence; TRS-B, the body region of the transcriptional regulation sequence.
(B) KDE plots showing correlations between the detected abundance of a given subgenomic RNA versus its icSHAPE reactivity score, for the specific (left) and common (right) regions of the 5′-UTR of each subgenomic RNA. The Spearman correlation coefficient and two-tailed p values were calculated with the Python package function scipy.stats.spearmanr. Scatter plots show canonical subgenomic RNAs.
(C) The icSHAPE profiles and structural models of the TRS-L region of the subgenomic RNAs of nucleocapsid (N) and polypeptide 1b (pp1b) predict the relative abundance of the subgenomic RNAs. RNA structural models were here predicted by using the icSHAPE reactivity score as constraint, as above.
(D) Scatter plot of icSHAPE reactivity scores of the 5′UTR and translation efficiency of eight canonical subgenomic RNAs.
See also Figure S6.
A recent study quantified the abundance of the SARS-CoV-2 subgenomic viral RNA populations based on long-read sequencing (Kim et al., 2020). We examined these data in the context of our icSHAPE scores and found that the abundance of a particular subgenomic viral RNA was positively correlated with the extent of single-stranded regions within its 5′ TRS-B region (Figure 5B, left; r = 0.239, p = 0.035, Spearman correlation; Figure S5D). Notably, we analyzed the structure relationship with both the canonical and noncanonical subgenomic viral RNA. To further pursue this structure-abundance correlation using the structure of the TRS-L region, we re-examined our icSHAPE data to identify and exclusively count those reads that (1) cross a fusion site and (2) specifically map to a confirmed subgenomic viral RNA (Figure S5E; STAR methods). We found that the TRS-L sequence adopted different secondary structures in different subgenomic viral RNAs depending on the flanking sequence and that the extent of single-stranded RNA in the TRS-L correlated with abundance (Figure 5B, right; r = 0.646, p = 1.645e-6, Spearman correlation; Figure S5F). For example, the TRS-L is more single-stranded in the subgenomic “N” RNA than in the subgenomic “pp1ab” RNA, and the subgenomic N RNA is more abundant than the subgenomic “pp1ab” RNA (Figure 5C). These data suggest that the abundance of a specific subgenomic viral RNA species could be influenced by its RNA 5′ structure.
In addition, we examined our icSHAPE scores of the SARS-CoV-2 RNA in the context of recently reported translation efficiency (TE) data for the subgenomic viral RNAs (Finkel et al., 2021). We observed a high Spearman correlation coefficient between TE and the frequency of single-stranded regions in vivo (r = 0.762, p = 0.028, Spearman correlation; Figure 5D). These data suggest that the subgenomic viral RNA structures could functionally impact translation.
PrismNet accurately predicts host proteins that bind to the SARS-CoV-2 RNA genome based on in vivo RNA structure using deep learning
Host cell RBPs regulate virus translation, replication, and degradation (Li and Nagy, 2011; Ooi et al., 2019). Deciphering interactions between RBPs and viral RNA is fundamental for understanding the infection process and for identifying potential therapeutic targets. However, insight into RBP-viral RNA interactions is limited, with only few reported for coronavirus (Sola et al., 2011). We recently developed a deep-learning tool called PrismNet (Protein-RNA Interaction by Structure-informed Modeling using deep neural Network) to accurately predict RBP-RNA interactions based on in vivo RNA structure data (Sun et al., 2021). Briefly, PrismNet constructs and trains a deep neural network to model the interactions between an RBP and its RNA targets by integrating big data from in vivo RBP binding assays and RNA structural probing (e.g., icSHAPE) obtained from matched cellular conditions.
We applied PrismNet to predict RBP binding on the SARS-CoV-2 RNA genome and identified 31 and 34 host RBPs that respectively bind to its 5′UTR and 3′UTR, totaling 42 proteins after filtering to ensure that these proteins are expressed in Huh7.5.1 cells. (Figure 6 ; Table S4). Several of the predicted proteins have been previously reported to interact with other coronaviruses. For example, hnRNPA1 binds to the MHV RNA and impacts RNA synthesis (Shi et al., 2000), and PTBP1 binds the transmissible gastroenteritis virus (TGEV) RNA and is involved in viral gene expression (Sola et al., 2011).
Figure 6.

Applying deep learning to the in vivo SARS-CoV-2 RNA structure accurately predicts host proteins that bind to SARS-CoV-2
(A) Schematic for the binding targets within the SARS-CoV-2 RNA. Four RNA structures, including Target-SL1 (in the SL1 region), Target-SL2/3 (in a combined SL2 and SL3), Target-SL4 (in SL4), and Target-ORF10 (at the start of the ORF10 region), were synthesized for validation experiments (see below).
(B) Left: Saliency maps from PrismNet showing the predicted binding site of the RBPs hnRNPA1, TIA1, IGF2BP1, and U2AF2, with predicted binding probabilities shown at the top. Grey bars indicate the range of synthesized RNA fragments. Green rectangles show predicted strong binding sites, and orange rectangles show relatively weaker binding sites. Right: western blot for RNA pull-down assays using the synthesized RNA fragments (Target-SL1, Target-SL2/3, Target-SL4, and Target-ORF10).
(C) Top: PrismNet-predicted RBPs in SARS-CoV-2 UTR regions are shown. Blue color shows the overlapped proteins validated by our pull-down MS, green color shows the overlapped proteins validated by RAP-MS (Schmidt et al., 2020), and red color shows the overlapped proteins validated by ribonucleoprotein capture (Lee et al., 2020). p values are calculated with one-sided Fisher's exact test. Bottom: Venn diagrams of PrismNet predicted RBPs in RNA pull-down MS, RAP-MS, and ribonucleoprotein capture. Only RBPs with CLIP-seq data are retained in the RNA pull-down MS, RAP-MS, and ribonucleoprotein capture circles.
(D) Left: Saliency maps from PrismNet showing the predicted binding site of the RBPs hnRNPK and ILF3, with predicted binding probabilities shown at the top. Grey bars indicate the range of synthesized RNA fragments. Right: western blot for RNA pull-down assays using the synthesized RNA fragments (folded and unfolded). Snap-cooling was used to unfold RNA structures. The control was a non-specific sequence “ccaacucuaugucgacugccaacucuaugucgacug”.
(E) Top: Secondary structure model of Target-ORF10. The mutations for disrupting the Target-ORF10 structure (mut1, mut2) or rescuing this RNA structure (rescue1 and rescue2) are shown. The free energies were estimated with the efn2 program from the RNAstructure package. Bottom: western blot for the RNA pull-down assay using the synthesized RNA fragments with mutations to disrupt or rescue the Target-ORF10 RNA structure.
(F) The yield of the bona fide SARS-CoV-2 with siRNA transfection relative to negative control (a non-targeting scramble siRNA) in Huh7.5.1 cells after infection for 48h. Data represent the mean ± SEM; n = 3 biological replicates.
(G) The yield of the bona fide SARS-CoV-2 virus with an ASO targeting predicted RBP binding sites Target-SL2/3 and Target-SL4, compared to controls in Huh7.5.1 cells for 24 h, including a “Scramble” control treated with a non-targeting ASO, a “Not treated” control with no ASO treatment, and a “NC” control treated with an ASO targeting ORF1ab (without a predicted RBP binding site). Data represent the mean ± SEM; n = 3 biological replicates.
n.s., not significant. ∗∗∗p < 0.005, ∗∗p < 0.01, and ∗p < 0.05 using one-way ANOVA and post hoc Student’s t test.
See also Table S5.
We therefore focused on 11 predicted RBPs (hnRNPA1, TIA1, IGF2BP1, U2AF2, NONO, PTBP1, CAPRIN1, hnRNPK, ILF3, hnRNPU, and SND1) to validate our prediction data by pull-down western (STAR methods). We synthesized targets within SARS-CoV-2 RNA that were predicted to contain binding sites for these 11 RBPs (Figure 6A; Table S5). We confirmed nine of the 11 protein-RNA interactions, which correlated well with the predicted binding scores based on the saliency maps from PrismNet (Figures 6B–6D and S6 A).
Figure S6.

RNA structure functionally impacts both the generation and translation of SARS-CoV-2 subgenomic RNAs, related to Figure 5
(A) Left: Saliency maps from PrismNet showing the predicted binding sites of the RNA binding proteins NONO, PTBP1, and CAPRIN1, with predicted binding probabilities shown at the top. Grey bars indicate the range of synthesized RNA fragments. Green rectangles show predicted strong binding sites, and orange rectangles show relatively weaker binding sites. Right: western blot for RNA pull-down assays using the synthesized RNA fragments (Target-SL1, Target-SL2/3, and Target-SL4).
(B) Scatter plot showing the correlation between two biological replicates of peptide spectral matches (PSMs) of proteins pulled-down by the UTRs of SARS-CoV-2 RNA in A549 cells.
(C) qPCR validation of siRNA knockdown efficiency in Huh7.5.1 cells. Data represent the mean ± SEM; n = 3 biological replicates.
(D) Western blotting validation of siRNA knockdown efficiency in Huh7.5.1 cells.
(E) Cell viability of Huh7.5.1 cells with siRNA transfection. WT: sample without siRNA transfection. siNC: sample transfected with a non-targeting scramble siRNA. Data represent the mean ± SEM; n = 3 biological replicates.
(F) Schematic of ASO design.
(G) Cell viability of Huh7.5.1 cells with ASO-SL2/3 and ASO-SL4 transfection. Data represent the mean ± SEM; n = 3 biological replicates.
We then conducted pull-down mass spectrometry (MS) to validate the predicted interactions between host RBPs and the UTRs of SARS-CoV-2 RNA in human A549 lung cells (STAR methods). Our MS data were of high quality (R = 0.97 between replicates; Figure S6B); these pull-down experiments can identify proteins that bind to SARS-CoV-2 RNA directly (RBPs) or indirectly via protein-protein interactions. Among the RBPs that we identified, 16 have available PrismNet models built from results of cross-linking and immunoprecipitation followed by deep sequencing (CLIP-seq) experiments (Sun et al., 2021). Strikingly, PrismNet predicted that 11 of these 16 RBPs bind to SARS-CoV-2 (Figure 6C). These 11 RBPs include proteins that are known to regulate virus life cycles. For example, IGF2BP1 facilitates the translation of HCV (Weinlich et al., 2009) and duck hepatitis A virus (DHAV) (Chen et al., 2019) from the internal ribosome entry sites (IRES). In addition, our predicted list shows significant overlap with the proteins detected as SARS-CoV-2 interactors by RNA antisense purification (Schmidt et al., 2020) (p = 3.0e-5, one-sided Fisher's exact test) as well as interactors by ribonucleoprotein capture (Lee et al., 2020) (p = 1.5e-11, one-sided Fisher's exact test).
To verify that RNA structure influences the predicted interactions, we first used an established snap-cooling strategy (Li et al., 2008b; Liu et al., 2015) to alter RNA structures without changing the RNA sequence, focusing on the binding between hnRNPK and the Target-SL1 sequence and between ILF3 and Target-ORF10 (both are SL structures; Figure 6A). Specifically, we heated the RNA target molecules at 90°C for 2 min to destabilize the SL RNA structure and then snap cooled them on ice to maintain the single-stranded conformation (STAR methods). We found that the binding affinity of both proteins were lower for the snap-cooled RNA targets than for the folded RNAs (Figure 6D). In addition, we perturbed the target RNA structure via mutagenesis, focusing on the predicted binding between ILF3 and Target-ORF10. We designed mutations to disrupt (mut1, mut2) and complementary mutations to restore (rescue1, rescue2) the predicted SL structure of Target-ORF10. We found that mut1 and mut2 had substantially reduced binding to ILF3, whereas rescue1 and rescue2 restored the binding (Figure 6E). These results confirm a significant influence of RNA structure on RBP binding recognition.
We investigated the role of the predicted SARS-CoV-2 RNA-host RBP interactions by knocking down five of the RBPs (ILF3, TIA1, SDN1, IGF2BP1, and DDX42) in Huh7.5.1 cells and examining the impact on viral infection (Table S5). Knockdown was efficient (except for siTLF3-2) and did not affect cell viability (Figures S6C–S6E). We observed that efficient depletions of TIA1, SND1, IGF2BP1, and DDX42 significantly reduced the yield of SARS-CoV-2 RNA in infected cells (Figure 6F). These findings suggest that SARS-CoV-2 infection depends on the identified host RBPs.
We also used ASOs to perturb the predicted interactions between RBPs and RNA targets. Specifically, we focused on Target-SL2/3, which binds to TIA1, IGF2BP1, and PTBP1, as well as Target-SL4, which binds to IGF2BP1 and CAPRIN1 (Figure S6F). We synthesized ASOs with a 2′-O-methoxyethyl (2′-MOE) and a phosphorothioate backbone modification to enhance nuclease resistance and reduce cell toxicity without compromising its strong binding to RNA targets (Van Nostrand et al., 2016; Bennett et al., 2017; Egli et al., 2005; Table S5). We observed ∼50% decreases in SARS-CoV-2 RNA yield in Huh7.5.1 cells transfected with ASO-SL2/3 and ASO-SL4 in comparison with negative controls including scramble ASOs (Figure 6G). Notably, neither of the ASOs results in any significant cell toxicity (Figure S6G). Together, the data suggest that these sites on SARS-CoV-2 are functionally impactful. Overall, our analyses emphasize the high accuracy of the PrismNet predictions and illustrate how several of the identified host RBPs bind to SARA-CoV-2 RNA and apparently impact the efficiency of viral infectivity.
Identification of ASO and compounds with antiviral activity targeting conserved RNA structure elements and predicted RBPs
Drugs targeting the host proteins that bind SARS-CoV-2 RNA have the potential to affect the viral life cycle and to inform the development of COVID-19 therapies. In addition, ASO-mediated disruption of essential viral RNA structural elements by ASO could also attenuate viral infection (Roberts et al., 2020; Spurgers et al., 2008). Pursuing this, we designed ASOs targeting well-defined SARS-CoV-2 conserved structural elements and also searched for inhibitors of the RBPs that are predicted to bind SARS-CoV-2, using databases including ChEMBL, DrugBank, and DrugCentral.
To assess the potential antiviral effects of ASOs and drugs on SARS-CoV-2 infection, we developed a cell culture method to screen for drugs that could inhibit SARS-CoV-2 infection (Figure 7 A). Briefly, we generated a SARS-CoV-2-GFPΔN genome in which the sequence encoding the N protein is replaced with GFP; this replacement disrupts the packing capacity of the virus. We then transfected an in vitro-transcribed SARS-CoV-2-GFPΔN RNA molecule into green monkey epithelial Vero cells that recombinantly stably express the SARS-CoV-2 N protein. To improve the virus packing efficiency at the first translation step, we also transfected N protein mRNA at the same time. Upon successfully packaging of the SARS-CoV-2-GFPΔN virus in Vero cells, we infected cells of the human epithelial Caco-2 cells that were modified to stably express the SARS-CoV-2 N protein (Ju et al., 2020). We treated the Caco-2 cells with the candidate ASO or drugs at the same time as viral infection. We assessed antiviral activity by using fluorescence-activated cell sorting (FACS) or microscopy to detect the fraction of GFP-positive cells.
Figure 7.

Validation of ASO and compounds with antiviral activity targeting conserved RNA structural elements and predicted RBPs using a SARS-CoV-2 N trans-complementation system and the bona fide virus
(A) Schematic for a SARS-CoV-2 N trans-complementation system that uses a pseudo SARS-CoV-2 virus in which the sequence encoding viral protein N is replaced with GFP (SARS-CoV-2-GFPΔN). SARS-CoV-2-GFPΔN only amplifies in Caco-2 cells that are actively expressing (complementing) the required viral N protein. We infected Caco-2 cells with MOI of 0.05. Drugs/compounds were added at the same time, at a concentration of 10 μM. SARS-CoV-2-GFPΔN accumulation was detected by FACS after 3 days.
(B) Three conserved structural elements within the ORF1ab and N coding regions. Blue lines indicate the binding sites of ASOs. Nucleotides are colored by icSHAPE reactivity scores, with red and yellow colors indicating reactive nucleotides. Nucleotides with a color background were predicted as co-variant base pairs.
(C and D) The infection ratios of SARS-CoV-2-GFPΔN in Caco-2 cells (C) and the viral yield for bona fide SARS-CoV-2 in Huh7.5.1 cells (D) both decreased upon treatment with an ASO targeting conserved structures compared to controls, including a “Negative control” control treated with an ASO targeting the ORF1ab protein coding region (16,114––16,168 nt) which has a long stem but no conserved covariation, a “Scramble” control treated with a non-targeting ASO, and a “Not treated” control with no ASO treatment. Data represent the mean ± SEM; n = 3 biological replicates. n.s., not significant. ∗∗∗p < 0.005, ∗∗p < 0.01, and ∗p < 0.05 using one-way ANOVA and post hoc Student’s t test.
(E) Secondary structure model of SE_ORF1ab_6449 with designed mutations. Purple circles represent designed mutations for mut-disrupt; the rescue includes both the mut-disrupt mutations and the mutations indicated with pink circles.
(F) qPCR quantitation of relative viral RNA level from pellets of Caco-2 cells infected for 48 h. The Caco-2 cells without infection were used as the negative control. Data represent the mean ± SEM; n = 3 biological replicates.
(G) qPCR quantification of viral titers for equal volume supernatant from Huh7.5.1 cells (top), A549 cell with ACE2 protein stable expression (middle), and Calu3 cells (bottom), infected with the bona fide SARS-CoV-2 virus (MOI = 0.05), 48 h post infection. Drug concentrations ranged from 0.04 μM to 30 μM. Dose-response curves for infectivity (black) and cell viability (red) are shown. Data are normalized to the average of DMSO-treated samples (0.1%) and represent mean ± SEM for n = 3 independent experiments.
(H) CETSA curves for DDX42, with or without Nilotinib (100 μM), measured in cell lysates at the indicated temperatures. The black curve is the Nilotinib treatment, and the red curve is the negative control. Data represent the mean ± SEM; n = 3 biological repeats.
(I) The yield of SARS-CoV-2 in Huh7.5.1 cells after viral infection for 48 h (MOI = 0.05), with different siRNA transfection and with/without Nilotinib treatment as indicated. si-NC, non-targeting scramble siRNA; siDDX42-1 and siDDX42-2, two siRNAs targeting DDX42. Data are normalized to the si-NC control and represent the mean ± SEM; n = 3 biological replicates.
n.s., not significant. ∗∗∗p < 0.005, ∗∗p < 0.01, and ∗p < 0.05 using one-way ANOVA and post hoc Student’s t test.
We defined 37 conserved RNA structural elements in the icSHAPE data-directed structural model (Figure 3; Table S6; STAR methods) (Li et al., 2018) and designed ASOs to target three of these structural elements within the ORF1ab and the N protein coding region (SE_ORF1ab_6449, SE_ORF1ab_9456, and SE_N_29502) (Figure 7B; Table S5). Note that none of the structural elements examined here have been reported previously. We also designed a scramble ASO and an ASO that targets a non-conserved structure (in ORF1ab protein 16,113––16,168 nt) as controls. Strikingly, cells treated with each of the three ASOs (0.3 μM) targeting the conserved structures exhibited a significant decrease in the viral infection ratio in comparison with negative controls (Figures 7C and S7 A). Similar results were obtained with bona fide SARS-CoV-2 (Isolate IPBCAMS-YL01/2020 obtained from a clinical sample at the Institute of Pathogen Biology, Chinese Academy of Medical Sciences & Peking Union Medical College, Beijing, China), using qPCR to assess the viral yield in the supernatant (Figure 7D). Notably, none of the ASOs displayed cytotoxicity in Caco-2 cells of the SARS-CoV-2 N trans-complementation system or in Huh7.5.1 cells infected with bona fide SARS-CoV-2 (Figures S7B and S7C).
Figure S7.

Validation of ASO and compounds with antiviral activity targeting conserved RNA structure elements and predicted RBPs by SARS-CoV-2 N trans-complementation system and the bona-fide virus, related to Figure 7
(A) Infection ratios of SARS-CoV-2-GFPΔN in Caco-2 cells. The ratio of SARS-CoV-2-GFPΔN accumulation in Caco-2 cells infected for 3 days with an MOI of 0.05 when treated with different ASOs at day 0, including a “Negative control” control treated with an ASO targeting the ORF1ab protein coding region (16114nt - 16168nt) which has a long stem but no conserved covariation, a “Scramble” control treated with a non-targeting ASO, a “Not treated” control with no ASO treatment, and a “Blank control” with no ASO treatment and no SARS-CoV-2-GFPΔN infection.
(B-C) Cell viability of in human Caco-2 (B) or Huh7.5.1 (C) cells with ASO_ORF1ab_6449, ASO_ORF1ab_9456 and ASO_N_29502 transfection. Data represent the mean ± SEM; n = 3 biological replicates.
(D-E) Histograms of the ratio of GFP positive Caco-2 cells infected with SARS-CoV-2-GFPΔN and treated with the indicated compounds (D), and histograms of cell viability of Caco-2 cells with compounds treatment (E). Compounds concentrations are 10 μM. Data are normalized to the average of DMSO-treated samples (0.1% in concentration) and represent mean ± SEM for n=3 independent experiments. n.s.: not significant. ∗∗∗<0.005, ∗∗<0.01 and ∗<0.05 using one-way ANOVA and post hoc Student’s t-test. Red boxes label compounds for further validations.
(F) qPCR quantification of viral titers for equal volume supernatant from Huh7.5.1 cells infected with the bona-fide SARS-CoV-2 virus (MOI = 0.05), 48 h post-infection. Compound concentrations ranged from 0.04 μM to 30 μM. Dose-response curves for infectivity (black) and cell viability (red) are shown. Data are normalized to the average of DMSO-treated samples (0.1%) and represent mean ± SEM for n=3 independent experiments.
(G) Both Sorafenib (left) and Nilotinib (right) are docked into the ATP binding site of DDX42 and form several interactions, including hydrogen bonding, halogen bonding, hydrophobic interaction, and pi-stacking.
To further validate the biological significance of the conserved RNA structure, we focused on the structural element SE_ORF1ab_6449 and generated mutated SARS-CoV-2-GFPΔN mutants with mutations within SE_ORF1ab_6449. The mutations in the strain mut-disrupt disrupt the predicted base pairs, whereas combining mut-disrupt mutations and complementary mutations in the strain rescue restores the disrupted structure (Figure 7E). All of the mutations are synonymous and therefore should not affect protein function. Strikingly, Caco-2 cells transfected with mut-disrupt RNA had dramatically decreased viral RNA levels that were partially rescued with the rescue virus RNA (Figure 7F). Importantly, the reduction of RNA in mut-disrupt is unlikely only due to codon effects on protein translation, because the effect is partially rescued by complementary mutations in rescue. Thus, conserved RNA structures in the SARS-CoV-2 genome do exert biological impacts on the infection process and could therefore represent vulnerable therapy targets.
Next, we screened ChEMBL, DrugBank, and DrugCentral for drugs that target host RBP factors predicted to bind SARS-CoV-2 RNA. Initially, we assayed the compounds (10 μM) with the SARS-CoV-2 N trans-complementation system in Caco-2 cells and monitored SARS-CoV-2 yield and cell viability, by using 0.1% DMSO as the negative control and Remdesivir as the positive control. This screening identified multiple compounds with varying levels of inhibitory effects on SARS-CoV-2 infection (Figures S7D and S7E; Table S7). We chose compounds that exerted low cell toxicity yet high inhibition of SARS-CoV-2 for dose-response and cytotoxicity experiments using the bona fide SARS-CoV-2 virus in Huh7.5.1 cells (Figure S7F). Nilotinib, Sorafenib, and Deguelin inhibited SARS-CoV-2 with little if any cell toxicity (Figure 7G). To test the robustness of anti-viral impacts of these drugs in different host cells, we repeated the experiments in Calu-3 cells and in human lung A549 cells that stably express recombinant human ACE2 (A549-ACE2). Nilotinib and Sorafenib showed the strongest inhibition of SARS-CoV-2 in A549-ACE2 cells, and all three drugs inhibited SARS-CoV-2 infection in Calu-3 cells (Figure 7G).
We focused on Nilotinib to determine whether it inhibits SARS-CoV-2 infection through the target protein DDX42. Although Nilotinib is commonly known to target some kinase pathways, it has also been reported to affect other proteins including DDX42 (Rix et al., 2013). To investigate the mechanism of action underlying the antiviral effects we observed, we conducted cellular thermal shift assay (CETSA), a commonly used approach to monitor drug binding in cells and tissues based on Tm shifting ( Martinez Molina et al., 2013)(Chen et al., 2016). The different melting curves indicate that Nilotinib does indeed bind to, and perturb, the target protein DDX42 (Figure 7H). We further used AutoDock Vina to dock the drugs onto DDX42 (Payne et al., 2015; Trott and Olson, 2010) and found that Sorafenib and Nilotinib can both bind to the ATP binding site of DDX42; this could block DDX42’s catalytic function (STAR methods; Figure S7G).
We also compared the SARS-CoV-2 yield in Nilotinib-treated Huh7.5.1 cells with or without DDX42 knock down. We already showed that SARS-CoV-2 infection of Huh7.5.1 cells is dependent on DDX42 (Figure 6F) and that Nilotinib treatment of Huh7.5.1 cells decreased SARS-CoV-2 infection (Figure 7G). Importantly, Nilotinib treatment in DDX42 knockdown cells did not confer any additive effects on the inhibition of SARS-CoV-2 infection. All these data support that Nilotinib’s anti-SARS-CoV-2 effects are mediated through its inhibition of the DDX42 protein (Figure 7I). Fundamentally, our results demonstrate how in vivo RNA structural data can be used to mine conserved, physiologically relevant structural elements and to predict functional host factors that can be targeted for drug development.
Discussion
In this study we experimentally determined the structural landscape of the SARS-CoV-2 genome in human cells, as well as the structure for in vitro refolded RNAs of two SARS-CoV-2 and six other coronaviruses. Our host cell data confirm the presence of stable, conserved structural elements from theoretical analysis, while also revealing many previously unknown structural features. We provide evidence that RNA structure affects the abundance and translation of subgenomic viral RNAs in cells. Based on our in vivo structure data and our deep-learning neural network, we then accurately predicted 42 functionally related host cell proteins that bind to the SARS-CoV-2 RNA genome and showed that some of these host proteins are vulnerable drug targets for reducing SARS-CoV-2 infection.
In addition to encoding viral proteins, the SARS-CoV-2 RNA genome itself functions as a molecular hub to interact with many cellular factors, presenting multiple levels of complexity for the regulation of viral infection and disease. As discovered previously for many other viruses, including HIV (Watts et al., 2009), HCV (Pirakitikulr et al., 2016), dengue (Dethoff et al., 2018), and ZIKV (Li et al., 2018), much of the regulation and function of RNA viral genomes is mediated by higher-order RNA structures. For coronaviruses, studies have also identified different RNA structure elements that functionally impact viral life cycles. The 5′UTR of most coronaviruses harbors a number of stem loops, with many showing heightened sequence conservation across betacoronaviruses, and various stems demonstrating functional roles in viral infection. For example, studies suggested that SL1 in the 5′UTR is necessary for coronavirus replication (Li et al., 2008a). The third stem loop contains a TRS core sequence (CS region, CUAAAC), which has been speculated to be critical for the discontinuous transcription characteristic of coronaviruses (van den Born et al., 2005). In viral genome 3′UTRs, mutually exclusive RNA structures have been shown to control various stages of the RNA synthesis pathway (Goebel et al., 2004). Recent virus structural modeling efforts using SARS-CoV-2 genome sequences have confirmed the existence of many of these stem loops and driven predictions of yet more of these in SARS-CoV-2 (Andrews et al., 2020; Rangan et al., 2020).
Our work emphasized that most stem loops exist in both refolded RNA molecules in vitro and in viruses within host cells, suggesting that co-transcriptional folding and refolding lead to similar, stable structures. But more importantly, our in vivo data also point to potential structural difference when compared with the in vitro and theoretical studies. For example, we observed that the proposed loop region in SL3 is not reactive, supporting the possibility of long-range functional interactions with downstream TRS-B regions, which is understood as integral for successful discontinuous transcription (Enjuanes et al., 2006). We also noticed that the small stem loop downstream of SL4 proposed by Rangan et al. is absent from our in vivo structural data. Instead, our results indicate this region adopts a long, single-stranded conformation in vivo; interestingly, the sequence context of this region is adenylate-uridylate-rich (AU-rich), suggesting it could be a hotspot for the binding of RBPs that prefer AU-rich single-stranded structure elements.
Overall, our study identified many single-stranded regions in the SARS-CoV-2 genome that are potential targets for interventions through siRNA, ASO, etc. Importantly, our work also revealed and validated structural elements with strong co-evolution support throughout the genome (including in coding regions), suggesting stable, functionally conserved RNA structures. Computational methods like ROSETTA and FARFAR are efficient for modeling tertiary structure when accurate secondary structural models are available (Das and Baker, 2007; Leman et al., 2020). Thus, our data will inform reliable tertiary structure models of the SARS-CoV-2 genome, which could reveal druggable pockets vulnerable to small molecules. Indeed, functional RNA structural elements can be targeted by small compounds to disrupt viral infectivity (Ren and Patel, 2014). Thus, the RNA structures we have uncovered in SARS-CoV-2 could facilitate target discovery and the development of antiviral therapeutics.
Our in vivo RNA structure also provides the groundwork to accurately predict host RBPs that bind to the SARS-CoV-2 genome, as we have demonstrated recently in different cellular contexts. We used a deep-learning method, PrismNet, trained on more than thousands of binding sites together with in vivo RNA structures obtained from matched cell lines for each RBP. Multiple lines of evidence including our in vitro RNA pull-down, in vivo RNA-protein MS data from other recent studies (Schmidt et.al. 2020, Lee et.al. 2020), and our in vivo knockdown assays and ASO perturbations indicate that many of PrismNet-predicted proteins are apparently true host factors and that these proteins can functionally impact viral infection. Nevertheless, these analyses cannot fully establish the in vivo regulation and functional impacts of the predicted interactions of host RBPs and SARS-CoV-2 viral RNAs, because many confounding factors could affect RBP binding in vivo. Further validations are warranted for any focused in-depth studies based on PrismNet-predicted host factors.
In addition to recruiting the translation machinery, SARS-CoV-2 could interact with many host proteins including RNA metabolism proteins and enzymes such as helicases. For example, based on our predictions, the helicase DDX42 is likely hijacked by the virus to help evade cell innate immune response (Beachboard and Horner, 2016). Interestingly, our findings suggest that stress granule proteins including TIA1, IGF2BP1, and PTBP1 interact with the SARS-CoV-2 RNA genome. Previous studies reported that TIA1 interacts with the minus-strand 3′ terminal SL of the West Nile virus RNA, which inhibits stress granule formation and facilitates flavivirus genome RNA synthesis (Emara and Brinton, 2007). Intriguingly, inhibition of stress granules is known to promote replication of MERS-CoV (Nakagawa et al., 2018). Overall, these SARS-CoV-2 RNA-host protein interactions will substantially extend our insight into SARS-CoV-2 biology and shed light on the molecular mechanism of viral infection.
Finally, the present study illustrates how the identification of conserved RNA structures and host RBPs that bind to viral RNA genomes can be exploited to develop antiviral drugs. By using an innovative Caco-2 cell SARS-CoV-2 infection platform to test antiviral drugs, we found inhibitor drugs targeting predicted host factor proteins successfully reduced SARS-CoV-2 infection. Treatments with ASOs targeting conserved RNA structure and predicted RBP binding sites, or siRNA knockdown of predicted host factors, also showed moderate inhibitory effects against SARS-CoV-2 infection, suggesting effective approaches for interventions. Overall, our strategy holds great promise for repurposing existing drugs and developing innovative strategies to fight against the still-ongoing SARS-CoV-2 pandemic and to combat viral disease more generally.
Limitations of the study
Although this study provides a rich resource of SARSCoV-2 RNA structures and uses this information to predict host proteins that are vulnerable for drug repurposing, there are nevertheless a number of limitations, stemming both from the technology we used for structure measurement and regarding the validations of the drug candidates. First, the SARS-CoV-2 RNA structural information obtained by icSHAPE must be understood as an ensemble representing different life stages of the virus (e.g., replication/transcription, packaging). Thus, dissecting and enriching viral RNA at discrete stages could help in elucidating exactly how distinct and/or dynamic RNA structure contributes to specific viral processes.
Second, icSHAPE technology only reports RNA structural information for individual nucleotides. It is therefore unable to directly reveal higher-order structural information (including tertiary RNA structure). Additional technologies such as PARIS (Lu et al., 2016), SPLASH (Aw et al., 2016), COMRADES (Ziv et al., 2018), and RIC-seq (Cai et al., 2020) could help capture long-range RNA-RNA interactions. Integrative analysis which combines our results with data from these technologies (and even tertiary structural information) could help identify more complex RNA structure elements and domains that functionally influence SARSCoV-2 infection. Such efforts could even help predict RNA structure as suitable direct targets for developing innovative drug treatments (Warner et al., 2018; Zhang et al., 2020). Third, PrismNet’s prediction of host factors only nominates RBPs that can in principle bind to SARS-CoV-2 RNA; cellular context information such as protein abundance and localization data are not considered. More physiologically relevant predictions of host factors could be obtained by incorporating these parameters into PrismNet predictions. Finally, although we have demonstrated that some repurposed FDA-approved drugs can effectively inhibit viral infection in different cells with both the SARS-CoV-2 N trans-complementation system and the bona fide SARS-CoV-2, their mechanisms of action should be studied further, and their efficacy and side-effects must be assessed by in vivo validations using animal models prior to any possible clinical application.
STAR★Methods
Key resources table
| REAGENT or RESOURCE | SOURCE | IDENTIFIER |
|---|---|---|
| Antibodies | ||
| Anti-human TIA1 | Proteintech | Cat#:12133-2-AP; RRID: AB_2201427 |
| Anti-human PTBP1 | Proteintech | Cat#:12581-1-AP; RRID: AB_2256807 |
| Anti-human IGF2BP1 | Proteintech | Cat#:22803-1-AP; RRID: AB_2879173 |
| Anti-human hnRNPA1 | Proteintech | Cat#:11176-1-AP; RRID: AB_2117177 |
| Anti-human U2AF2 | Proteintech | Cat#:15624-1-AP; RRID: AB_2211330 |
| Anti-human NONO | Proteintech | Cat#:11058-1-AP; RRID: AB_2152167 |
| Anti-human DDX42 | Abcam | Cat#: ab89075; RRID: AB_2041042 |
| Anti-human CAPRIN1 | Proteintech | Cat#:15112-1-AP; RRID: AB_2070016 |
| Anti-human hnRNPK | Proteintech | Cat#:11426-1-AP; RRID: AB_2264314 |
| Anti-human ILF3 | Proteintech | Cat#:19887-1-AP; RRID: AB_10666431 |
| Anti-human GAPDH | Proteintech | Cat#:10494-1-AP; RRID: AB_2263076 |
| Bacterial and Virus Strains | ||
| SARS-CoV-2 | Peking Union Medical College | IPBCAMS-YL01/2020 |
| SARS-CoV-2-GFPΔN | This study | N/A |
| Chemicals, Peptides, and Recombinant Proteins | ||
| PBS | Life | Cat# 10010049 |
| DMSO | Sigma Aldrich | Cat#D2650-5×10ML |
| penicillin-streptomycin | GENOM | Cat#GNM15140 |
| NAI-N3 | This study | N/A |
| Trizol LS | Life | Cat#10296-028 |
| Chloroform | Ricca Chemical | Cat#RSOC0020-500C |
| 5 M NaCl | Ambion | Cat#AM9759 |
| Click-IT biotin DIBO alkyne | Life | Cat#C-10412 |
| Ultrapure TEMED | Invitrogen | Cat#15524-010 |
| EDTA | Ambion | Cat#AM9260G |
| 10% SDS | Life | Cat#15553-027 |
| Phusion high-fidelity (HF) | New England | Cat#M0531L |
| DMEM | GIBCO | Cat#11965-084 |
| BSA | Sigma-Aldrich | Cat#B2064 |
| Dynabeads MyOne C1 | Life | Cat#65002 |
| Tween 20 | Sigma | Cat#P1379-500ML |
| UltraPure 1 M Tris-HCI buffer, pH 7.5 | Invitrogen | Cat#15567-027 |
| Experimental Models: Cell Lines | ||
| Human Huh7.5.1 | Gift | From Wei Yang lab (Peking Union Medical College) |
| Green monkey Vero E6 | ATCC | Cat#CCL-81 |
| Human Caco2 | ATCC | Cat#HTB-37 |
| Calu-3 | ATCC | Cat#HTB-55 |
| A549-ACE2 | This study | N/A |
| A549 | ATCC | Cat#CCL-185 |
| Human HEK293T | Cell Bank, Shanghai | Cat#GNHu17 |
| Software and Algorithms | ||
| icSHAPE-pipe | Li et al., 2020 | http://zhanglab.net/resources/icSHAPE-pipe |
| IGV | (Robinson et al., 2011) | https://software.broadinstitute.org/software/igv/ |
| VARNA v3-93 | (Darty et al., 2009) | http://varna.lri.fr/ |
| Bowtie2 | (Langmead and Salzberg, 2012) | http://bowtie-bio.sourceforge.net/bowtie2/index.shtml |
| STAR | Dobin et al., 2013 | https://github.com/alexdobin/STAR |
| samtools | (Li et al., 2009) | http://samtools.sourceforge.net/ |
| Trimmomatic | Bolger et al., 2014 | http://www.usadellab.org/cms/?page=trimmomatic |
| Infernal 1.1.3 | (Nawrocki and Eddy, 2013b) | http://eddylab.org/infernal/ |
| RNAstructure | (Reuter and Mathews, 2010) | https://rna.urmc.rochester.edu/RNAstructure.html |
| ViennaRNA | (Lorenz et al., 2011) | https://www.tbi.univie.ac.at/RNA/ |
| bioRender | N/A | https://biorender.com/ |
| Deposited Data | ||
| icSHAPE data | This study | GSE153984 |
| Deposited Code | ||
| Analysis scripts | This study | https://github.com/lipan6461188/SARS-CoV-2 |
Resource availability
Lead contact
Further information and requests for resources and reagents should be directed to and will be fulfilled by the Lead Contact, Qiangfeng Cliff Zhang (qczhang@tsinghua.edu.cn).
Materials availability
This study did not generate new unique reagents.
Data and code availability
The icSHAPE sequencing data of all cell lines reported in this project is available at Gene Expression Omnibus under accession code GSE153984. The scripts for SARS-CoV-2 structure model construction and all downstream analyses used in this project are available at github (https://github.com/lipan6461188/SARS-CoV-2).
Experimental model and subject details
Cell culture
Huh7.5.1 cells, a well differentiated human hepato cellular carcinoma cell line, were provided by Wei Yang lab (Institute of Pathogen Biology, Chinese Academy of Medical Sciences & Peking Union Medical College), and were maintained at 37°C, 5% CO2 in Dulbecco’s modified Eagle’s medium (DMEM) supplemented with 10% fetal bovine serum (FBS) and penicillin-streptomycin. African green monkey kidney epithelial Vero E6 (ATCC, CCL-81) were maintained at 37°C, 5% CO2 in DMEM with 10% FBS and penicillin-streptomycin. Human colorectal adenocarcinoma Caco2 cells (ATCC, HTB-37) maintained at 37°C, 5% CO2 in DMEM with 10% FBS and penicillin-streptomycin. Human lung cancer Calu-3 cells (ATCC, HTB-55) maintained at 37°C, 5% CO2 in DMEM with 10% FBS and penicillin-streptomycin. Human lung carcinoma cell line A549 cells (ATCC, CCL-185) maintained at 37°C, 5% CO2 in DMEM with 10% FBS and penicillin-streptomycin. Human HEK293T cells (Cell bank, Shanghai, GNHu17) maintained at 37°C, 5% CO2 in DMEM with 10% FBS and penicillin-streptomycin.
SARS-CoV-2 virus
SARS-CoV-2, Isolate IPBCAMS-YL01/2020 was obtained from a clinical sample at the Institute of Pathogen Biology, Chinese Academy of Medical Sciences & Peking Union Medical College, and was passaged three times in Vero cells (ATCC, CCL-81) for further infection. Infectious titers of SARS-CoV-2 were determined using plaque assays in Vero cells.
SARS-CoV-2 infection
For SARS-CoV-2 infection, Huh7.5.1 cells were cultured in T-175 flasks, at a density of 5×10⁶, cells for 16 h. The cells were briefly washed with DMEM, and incubated with SARS-CoV-2/IPBCAMS-YL01/2020 for 1 h at a multiplicity of infection (MOI) of 0.05, then supplemented with DMEM maintenance medium containing 1% BSA and penicillin-streptomycin. Cells were then cultured at 37°C with 5% CO2 for an additional 30 h. Cultured cells were washed twice with PBS before collection using a cell scraper. All experiments involving live SARS-CoV-2 in these studies were performed in a biosafety level 3 facility.
Method details
NAI-N3 modification in vivo and RNA extraction
For in vivo RNA structure probing, NAI-N3 was added to the cell pellet at a final concentration of 100mM and then incubated at 37°C for 5 min with gentle mixing. To prepare negative control samples, an equal amount of DMSO (25μl) was added to the cell pellet. After probing, samples were transferred immediately to ice in order to stop the reaction. Samples were then centrifuged for 5 min at 500 ×g (4°C), the supernatant was discarded, and cell pellets resuspended in 6 mL TRIzol and supplemented with chloroform (0.2 vols.). The sample was vigorously vortexed for 15 sec, then incubated for 5 min at room temperature, after which it was centrifuged for 15 min at 12,000 ×g (4°C). The upper aqueous phase was transferred to a clean 15 mL tube, then supplemented with 2 volumes of 100% ethanol, mixed, then purified with a Hipure RNA pure Micro Kit according to the manufacturer’s instructions.
Isolation of Poly(A) RNA
We isolated poly(A) RNA with the Dynabeads™ mRNA DIRECT™ kit according to manufacturer instructions with the following modification. The poly-dT beads were washed with buffer B twice after the first round of poly(A) purification. We performed a second poly(A) enrichment using beads from the first-round enriched poly(A) RNA. Typical yields were 1% poly(A) RNA from DMSO treated samples and 0.5% poly(A) RNA from the NAI-N3 treated samples.
NAI-N3 modification in vitro
100ng of poly(A) RNA from DMSO-treated control samples were resuspended in 5.7 μl of water, and samples were heated to denature RNA structure at 90°C for 2 min. Samples were then transferred onto ice immediately for more than 2 min. 3.3 μl of 3.3× SHAPE refolding buffer (333 mM HEPES (pH 7.5), 20 mM MgCl2 and 333 mM NaCl) was added to the RNA and incubated at 37°C for 5 min. 1μl of 1M NAI-N3 was added to the refolded samples and incubated at 37°C for 10 min. In vitro modified RNA was extracted as outlined in the above steps.
In vitro transcription of viral UTR regions
Vectors including the 5’UTR, 3’UTR and their extension regions in Coronavirus SARS-CoV-2 (lineage B, Betacoronavirus), SARS-CoV-2-T (C to T mutation in 241nt, (lineage B, Betacoronavirus), SARS-CoV (lineage B, Betacoronavirus), MERS-CoV (lineage C, Betacoronavirus), BtCoV-HKU5 (lineage C, Betacoronavirus), HCoV-NL63 (Alphacoronavirus), HCoV-HKU1 (lineage A, Betacoronavirus), and BtCoV-HKU9-1 (lineage D, Betacoronavirus) were synthesized by the company AuGCT (Table S2). We amplified these regions using primers including the P7 promoter sequence (Table S5). We synthesized RNA in vitro from PCR products using a HiScribe™ T7 Quick kit following manufacturer instructions. After overnight incubation, DNA was removed using DNase I. Then, the in vitro transcribed RNA was purified using a Hipure RNA pure Micro Kit.
icSHAPE library construction
icSHAPE libraries were constructed using in vivo modified, in vitro modified or DMSO-treated control RNA as previously described, but with the following modification (Sun et al., 2021). We designed a new library linker, reverse transcription (RT) primer, P5 and P7 amplification primer to adapt the system for the Illumina HiSeq X system.
To simplify library construction of the UTRs of the eight coronaviruses (including the SARS-CoV-2-T), we merged the in vitro transcribed RNAs of different viruses into one group according to sequence divergence. i.e. RNA of SARS-CoV-2, HCoV-NL63 and HCoV-HKU1 were merged into one group (SARS2-C-NL63-HKU1). RNA of the SARS-CoV and BtCoV-HKU5 was merged into another group (SARS-HKU5). RNA of MERS-CoV and BtCoV-HKU9 was also merged into the third group (MERS-HKU9). RNA of SARS-CoV-2 with T mutation (SARS-CoV-2-T) formed an independent group.
Libraries of viral infection were sequenced on the HiSeq X system to approximately 150 million reads per library, while viral libraries for UTR regions were sequenced at about 10-30 million reads per library. Only the R1 reads (∗_1.fastq), which include the reverse transcription stop (RT stop) site, were used for further analysis in this study.
RNA pull-down of RNA fragments
RNA pull-down was performed as previously described, with the following modifications (Sun et al., 2021). 1.5 μl (100 mM) of RNA fragment was added to 8.5 μl water and incubated at 90 °C for 2 min, 30 °C for 5 min, and at 4°C until their incubation with cell lysates. Human 293T cells (1 × 10⁷) were lysed in lysis buffer (150 mM NaCl, 1 mM EDTA, 1% Triton X-100, 0.5 mM DTT, 50 mM pH 7.5 Tris-HCl, 0.1% sodium deoxycholate) with 10 μl phosphatase inhibitor cocktail (Promega), 10 μl PMSF (Sigma), 2.5 μl SUPERase In inhibitor (Life Technologies) for 10 min. Cell lysates were incubated with RNA probes at 4°C for 3 hours, then incubated with pre-washed MyOneC1 streptavidin beads for 1 hour. The beads were washed with pre-cooled washing buffer (50 mM Tris-HCl, pH 7.5, 150 mM NaCl, 5mM EDTA) three times at 4 °C. Proteins were eluted (50μL) with elution buffer (washing buffer by adding 5×SDS-PAGE loading buffer) at 95 °C for 10 min. The eluted protein samples (5μL) were quantified by immunoblotting with the specified antibody. Control samples were prepared identically to the lysate samples, with the exception that random RNA oligonucleotides were added (Figure 6B).
To characterize the biological impact of RNA structure, we refolded the RNA by heating it at 90 °C for 2 min and then incubating it it at 30 °C for 5 min to enable refolding (Liu et al., 2015); we obtained single-stranded RNA by heating it at 90 °C for 2 min and then snap-cooling on ice to keep RNA in single-stranded structure form (Huang et al., 2018). The other steps are similar with the previous method except the time of cell lysate incubating with RNA probe was shortened to one hour (to minimize the RNA structure refolding) (Figure 6C). For the mutation and rescue RNA probe of ILF3 targets, all the steps followed the description provided in Figure 6B (Figure 6D).
Immunoblotting and qPCR
Immunoblotting was used to examine RNA pull-down results, using antibodies for IGF2BP1, TIA1, PTBP1, hnRNPK, hnRNPA1, NONO, U2AF2, CAPRIN1, ILF3, and GAPDH (Abcam). Elution samples from RNA pull-downs were boiled at 95 °C for 10 min, followed by immunoblotting as previously described (Sun et al., 2019).
qPCR was used to quantify SARS-CoV-2 infection and amplification before collection of the infected cells.
RNA pull-down mass spectrometry of SARS-CoV-2 UTR regions
Biotin labeled RNA of the SARS-CoV-2 UTR and the control GFP RNA were synthesized using the HiScribe™ T7 Quick kit. We followed the manufacturer instructions with the following modification: we added biotin-16-UTP into the 10mM NTP mix for biotin labeling. Human lung cells A549 (1 × 10⁷) were lysed using the lysis buffer. Cell lysis were incubated with RNA probe for 3 hours and then added with C1 beads for another one hour. After washing, the pull-down proteins were eluted in 30μL of 1×LDS SAMPLE buffer (Thermo Fisher, cat#NP0007) and heated at 90 °C for 10 min. The SARS-CoV-2 UTR and the GFP RNA samples were resolved by SDS-PAGE using NuPAGE 4–12% Bis-Tris Gels. The SDS-PAGE gel was visualized by silver staining (Pierce Silver Stain for Mass Spectrometry, Cat# 24600). Each lane of protein bands was cut into three pieces (top: >150 kDa; middle: 50-150kDa; bottom: <50kD) for mass spectrometry analysis (Figures 6G, S6F-G).
SARS-CoV-2 N trans-complementation system and drug test
The SARS-CoV-2-GFPΔN genome was assembled using in vitro ligation of five fragments A, B, C, D, and E, but replacing the viral N gene with GFP based on the SARS-CoV-2 genome (Wuhan-Hu-1, NC_045512). The SARS-CoV-2-GFPΔN genomic RNA genome was in vitro transcribed using an T7 Transcription Kit (ThermoFisher Scientific). Synthesized viral RNA and N mRNA were electroporated into Vero E6 cells expressing viral N using lentiviral transduction to produce the P0 virus. After three days, P0 virus was collected to infect Caco-2 cells expressing viral N (Caco2-N) by lentiviral transduction, and thereby amplify the recombinant SARS-CoV-2-GFPΔN virus. To assess the antiviral efficacies of the compounds, 1×10⁴ Caco2-N cells were seeded into 96-well plates. After 24h, cells were infected with SARS-CoV-2-GFPΔN virus at a MOI of 0.05, and drugs were added simultaneously. Two days post-infection, FACS was performed to analyze the GFP positive rate. We used the anti-SARS-CoV-2 drug Remdesivir as a positive control, and the solvent DMSO (0.1%) as a negative control (Figures 7, S7).
Viral infection and compounds treatment by the bona-fide SARS-CoV-2
Huh7.5.1, Calu-3, and A549 cells stably expressing recombinant human ACE2 (A549-ACE2) were maintained at 37°C with 5% CO2 in Dulbecco’s modified Eagle’s medium (DMEM, Gibco, cat.C11965500BT) supplemented with 10% fetal bovine serum (FBS, HyClone, cat.SH30396.03) and penicillin-streptomycin (GENOM, cat.GNM15140). Cells were seeded in 96 wells plate one day before infection. Briefly, opti-MEM medium containing each compound (0.041, 0.123, 0.370, 1.111, 3.333, 10, 30 μM, respectively) and 0.1% DMSO was added to confluent cells, then immediately incubated with SARS-CoV-2 at a multiplicity of infection (MOI) of 0.05 for 1h. Then, cells were washed one-time opti-MEM and supplemented with opti-MEM maintenance medium, which was supplemented with 1% BSA (Sigma-Aldrich, cat#B2064) and the drugs at the concentrations indicated in the figures. 60 μL supernatants were harvested at 48 hours post-infection and viral RNA in the cell supernatants were extracted by using Direct-zol RNA MiniPrep kits (Zymo research) according to the manufacturer’s instructions. The virus load was evaluated by Real-time qPCR targeting the N gene of SARS-CoV-2 as described elsewhere (Liu et al., 2020). The inhibition ratio was obtained by dividing the number of copies of the virus in the control group (DMSO 0.1%). Dose-response curves for selected compounds were generated using GraphPad Prism software. The IC50 for each compound was calculated using 4-paramenter logistic non-linear regression.
RNA interference
siRNAs targeting ILF3, TIA1, SDN1, IGF2BP1, and DDX42 (Table S5) were transfected into Huh7.5.1 cells using Lipofectamine RNAiMAX (Life technologies, Carlsbad, CA). Cells were grown to sub confluency at 37°C with 5% CO2 for 48 h with siRNA transfection. For SARS-CoV-2 infection, the cells were thoroughly washed and infected with SARS-CoV-2 at an MOI of 0.05 for 1 h and then supplemented with maintenance medium. 60 μL Supernatants were harvested at 24 hours post-infection and virus yield was evaluated by qPCR analysis of SARS-CoV-2 N gene expression (Figures 6F, S6D-E).
ASO assay
Huh7.5.1 cells were plated in a 24-well plate at a density of 1.2×10⁵cells per well for 16 h, then transfected with 1.5μL 100μM ASOs (Table S5) using Lipofectamine RNAiMAX (Life technologies, Carlsbad, CA) on a final concentration of 0.3 μM and incubated at 37°C for 6 h. The cells were then thoroughly washed with opti-MEM and infected with SARS-CoV-2 at an MOI of 0.05 for 1 h and then supplemented with maintenance medium. After incubation of the cells at 37 °C for 24 hours, SARS-CoV-2 viral RNA levels in supernatants were measured by qPCR.
Cell viability
Confluent cells grown in 96-well plates were incubated with various drug concentrations (0.041, 0.123, 0.370, 1.111, 3.333, 10, 30 μM, respectively) and 0.1% DMSO for 48 hours. Cell viability was measured by a CCK8 kit (Yeasen, Beijing, China) and calculated using the GraphPad Prism software (Figures 7, S7).
For RNA interference and ASO transfection, the same concentration of siRNAs or ASOs in the siRNA knockdown and ASO assays were transfected into Huh7.5.1 cells. Cell viability were measured by a CCK8 kit (Yeasen, Beijing, China). Data were processed by the GraphPad Prism software (Figures S6 and S7)
Compound treatment after knocking down the drug-targeted proteins
Huh7.5.1 cells were seeded in a 24-well plate at a density of 1.2×10⁵ cells per well and cultured for 16 h, siRNAs against DDX42 and control siRNA were transfected into cells using Lipofectamine RNAiMAX (Life technologies, Carlsbad, CA). After 48 hours of transfection, opti-MEM medium containing 10 μM Nilotinib was added to cells, then immediately incubated with SARS-CoV-2 at an MOI of 0.05 for 1h. Then cells were washed one-time opti-MEM, and the culture medium was replaced with opti-MEM maintenance medium containing 10 μM Nilotinib. At 48 hours post-infection, supernatants were collected and viral RNA was extracted with an RNA MiniPrep kit. We subsequently measured the RNA levels by qPCR (Figure 7).
Mutation strains construction of SARS-CoV-2 N trans-complementation system
The mutation strains were constructed using in vitro ligation of five fragments A, B, C, D and E with the following modifications. We introduced mutations into fragment B, which came from the region of ORF1ab, (mut-disrupt: G9463A, U9466C, U9511C; rescue: G9463A, U9466C, U9511C & A9517G, C9520U, A9472G) by PCR. Then, fragments A, B, C, D and E were assembled by in vitro ligation. Viral RNAs are electroporated into Caco2-N cells, and qPCR was performed to quantify virus RNA after 48 hours post electroporation (Figure 7).
nsp1 forward primer: CGAAAGGTAAGATGGAGAGCC,
reverse primer: TGTTGACGTGCCTCTGATAAG;
subgenomic E forward primer: CGATCTCTTGTAGATCTGTTCTC,
reverse primer: ATATTGCAGCAGTACGCACACA;
GFP forward primer: CGATCTCTTGTAGATCTGTTCTC,
reverse primer: TCAGGGTCAGCTTGCCGTAG
Cellular thermal shift assays
We performed the cellular thermal shift assays following a previous description (Martinez Molina et al., 2013). Briefly, 1.0×10⁷ cultured A549 cells were harvested and washed by PBS twice. Cells were resuspended by adding 600μL PBS to each 1.5mL tube. Then the cells were lysed via freeze thawing (three times) using liquid nitrogen. After 20000g centrifugation for 20 min at 4°C, the supernatant was divided into two aliquots (300μL each) and incubated with Nilotinib (100uM) or negative control (DMSO) for 30min at room temperature. Then, the respective lysates were divided into smaller (50μL) aliquots and heated individually at different temperatures (25, 45, 50, 55, and 60°C) for 3 minutes. After 20000g centrifugation for 20 min at 4°C, DDX42 in the lysates was quantified via western blotting.
Quantification and statistical analysis
Data quality control and icSHAPE score calculation
The icSHAPE sequencing data was processed using icSHAPE-pipe (Li et al., 2020). The processing steps were as follows: 1) Duplicated reads in raw fastq files were collapsed; 2) 3’ Adaptor sequence in the reads and the first 10nt from 5’ were removed using trimmomatic (Bolger et al., 2014); 3) Clean reads were mapped to human rRNA with bowtie2 (Langmead and Salzberg, 2012); 4) Un-mapped reads were mapped to the human genome using STAR (Dobin et al., 2013); 5) Remaining unmapped reads were mapped to the SARS-CoV-2 sequence (Genbank ID: NC_045512.2) with bowtie2; 6) Sam files were convert into .tab files using icSHAPE-pipe sam2tab; 7) The icSHAPE score was calculated using icSHAPE-pipe calcSHAPE with parameter -D DMSO_rep1.tab,DMSO_rep2.tab -N NAI_rep1.tab,NAI_rep2.tab -size virus_len.txt -wsize 50 -out virus_shape.gTab. 8) The .gTab file was converted to .shape format using icSHAPE-pipe genSHAPEToTransSHAPE -i virus_shape.gTab -s virus.fa.len -c 100 -o virus_shape.shape. We set -c 100 to retain bases with a read depth greater than 100 (Table S2).
To assess data quality, Pearson correlation coefficients were calculated based on the RPKM of host transcriptome between replicates. We also compared consistency of the reverse transcription (RT) stop counts of SARS-CoV-2 across all samples (Figure S1).
Calculate the accuracy of structure prediction
Sensitivity and Positive Predictive Value (PPV) (Deigan et al., 2009) are used to quantitatively compare the similarity between our model with the theoretical models of the secondary RNA structures of the SARS-CoV-2 5’UTR and 3’UTR (Rangan et al., 2020). The sensitivity means the percentage of the base pairs from the theoretically structural model that are also included in our model. Further, the positive predictive value (PPV) means the percentage of the base pairs from our model which are also included in the theoretically structural model (Figure S2).
Calculate the receiver operating characteristic (ROC) curve of icSHAPE reactivity scores fitting the theoretical structural model of rRNA and SRP
We obtained the secondary structure models of human 18S rRNA and 28S rRNA from the CRW database and RiboVision (Bernier et al., 2014) separately, and the secondary structure model of signal recognition particle (SRP) from the RNAstrand database (Andronescu et al., 2008). For 18S rRNA and 28S rRNA with 3D models, we used the PDB structure (id: 6ek0) to calculate the solvent accessibility for 2'-OH of each nucleotide in a 3D model (retaining those bases with solvent accessibility > 3) to evaluate the AUC.
Identification of RNA structurally variation regions in SARS-CoV-2 genome between in vivo and in vitro
To define a structurally variable regions between in vivo and in vitro conditions, we used a method combining a binomial test and a permutation test to call significantly different structural regions (Figure 2). The algorithm is summarized as four steps below.
Step 1: Estimate the random background noise. We calculated the L1 distance of icSHAPE reactivity scores for each nucleotide between replicates (for in vivo and in vitro separately). Then we aggregated all L1 distances from in vivo and in vitro conditions, which were used as the background distribution of the technical variations of icSHAPE scores. We defined the top 5% of the L1 distance as the threshold of random noise: .
Step 2: Search for significantly different regions with sliding windows. The virus genome was split into sliding windows (window size: 10 nt, window step: 1 nt). The L1 distance of icSHAPE reactivity scores from two conditions are calculated and the windows with the number of differential nucleotides (L1 distance > ) is greater or equal than 3 are defined as differential windows.
Step 3: Keep the top differential windows. We only preserve the top 10% of average L1 distances of all differential windows.
Step 4: Merge overlapped windows.
Structural Model Construction
To construct RNA secondary structural models for a complete SARS-CoV-2 genome, we used the partition program and MaxExpect program in the RNAstructure software suite (Reuter and Mathews, 2010) to predict secondary structure with icSHAPE scores as the pseudo-energy constraint. We set the maximum pairing distant as 300 nt. To identify a combination of slope and intercept parameters, we used grid search to predict a structure of the UTR and flanking region which is consistent with the Rfam model (Kalvari et al., 2018a). We then used the parameter to predict the structure. We used a sliding window with a length of 5000 nt and a step size of 1000 nt to predict the structure of full-length viral RNA. Structure models with higher pairing probabilities produced by the partition program were selected for RNA structures of overlapping regions. We visualized RNA structure using VARNA (http://varna.lri.fr/) (Figures 3, S3).
Phylogenetics Analysis
Representative coronaviral genome sequences were retrieved from genome database of NCBI (https://www.ncbi.nlm.nih.gov/genome) and SARS-CoV-2 genome sequences were downloaded from GISAID database (www.gisaid.org, before June 1, 2020). Multiple sequence alignments of all collected viral sequences were constructed using MAFFT v.7.313 (Nakamura et al., 2018). To visualize phylogenetic relationships among major coronaviral clades, one hundred representative viral sequences were selected to generate evolutionary tree by RAxML v.8.2.12 (Kozlov et al., 2019) with GTR+G substitution model and 1,000 bootstrap replicates. The tree was further polished in FigTree v1.4.4 (http://tree.bio.ed.ac.uk/software/figtree) (Figure 4A).
Conserved structure elements
We used the Infernal 1.1.3 software suite (Nawrocki and Eddy, 2013a) to search homologous multiple sequence alignment. Then we defined a covariation score for each base pair to search conserved structures (Figures 3, 7, S3). In summary, this process is mainly divided into the following three steps:
1. Prepare the homologous sequences dataset
We retrieved the Coronaviridae sequences in ViPR database (https://www.viprbrc.org/). We only leave those sequences with complete genome and remove duplicate genome sequences. Finally, we obtained 10,852 sequences. To remove those redundant sequences, we used CD-HIT (Fu et al., 2012) to remove sequences with a similarity higher than 99%: Finally, 1,367 sequences are leaved for downstream analysis.
2. Search homologous sequences
The full-length SARS-CoV-2 genome is divided into fragments according to the secondary structure model we built, and each fragment is an independent secondary structure. The sequence and structure model of each fragment is used to construct a stockholm file. The stockholm file is used to construct a covariance model (.cm file) with cmbuild (from Infernal). The homologous aligned sequences are retrieved from sequences databases (1,367 sequences) with cmsearch. Then those duplicated sequences in the alignment file are removed. The remaining sequences are used to build a new covariance model with cmbuild. The new covariance model can be used to search homologous sequences as described above. This process is repeated at most three times or util no new sequences can be added. We developed this method mainly refer to Rfam's method of construction of seed alignment (Kalvari et al., 2018b).
3. Calculate the covariation score for each base pair
Covariance score in the resulting alignment was calculated referring to RNAalifold (Hofacker, 2007). To summarize, given a multi-sequence alignment file, the covariation score for column i and column j is defined as
N is the number of sequences in the alignment. α,βÎ{1,2,3…N} is the index of sequences. i and j are the index of any two alignment columns. is the Hamming distance of base i and base j between sequence α and β. indicates if the base i and base j in sequence α can form WC base pairing or wobble base pairing.
Covarying base pairs with a score ranging from 0.4-0.5 were defined as weak covariation, scores ranging from 0.5-0.7 were defined as medium covariation, and scores greater than 0.7 were defined as strong covariation (Figures 2, 3, 4 and S3, S4, S5).
Relationship between SARS-CoV-2 structure and subgenomic RNA generation, translation efficiency analysis
Pre-calculated translation efficiency and subgenomic RNA numbers were provided by previous papers (Kim et al., 2020). We constructed the top 100 highly expressed subgenomic sequences according to RNA number and splice sites. The pre-processed reads were mapped onto subgenomic RNA, with indels and gaps disallowed with STAR parameters: --scoreDelOpen -99 --scoreInsOpen -99 --scoreGap -99. Only reads mapping to cross sites between TRS-L and TRS-B were kept for further analysis (Figure 5, Figure S5). The icSHAPE score of every subgenomic RNA in the TRS-L region was calculated as described above “Data quality control and icSHAPE score calculation”.
The Spearman correlation efficient and the two-tailed P values were calculated using the Python package function scipy.stats.spearmanr.
Structural similarity calculation
The similarity of the secondary structures of 5’UTR and 3’UTR among different coronaviruses (Figures S4B and S5B) were assessed using RNAforester in ViennaRNA package (Lorenz et al., 2011) with the UTR sequences and secondary structures as input. The sequence similarity is excluded from calculation by setting parameters: -bm=0 -br=0 -bd=0. Structural similarity parameters are set by default. The relative scores, ranging from 0-1, are returned by using the parameter -r.
RBP and RBP binding site prediction based on PrismNet
RBP binding was predicted using PrismNet (Sun et al., 2021), a deep learning model based on RNA sequence and in vivo RNA structure data. PrismNet was trained on the CLIP data of 60 RBPs from POSTAR (Hu et al., 2017), 22 RBPs from starBase (Yang et al., 2011), as well as 59 RBPs from ENCODE (Van Nostrand et al., 2016), and the matched RNA structural data (icSHAPE scores) in HEK293, HKE293T, HeLa, K562, H9 and HepG2 cells as described in the manuscript. It finally totals 144 pre-trained PrismNet models of 99 human proteins.
For input, the sequences and the icSHAPE data of the SARS-CoV-2 UTRs and flanking regions were split into sliding windows (window size: 101nt, window step: 20nt). Input sequences were encoded with the one-hot encoding (A, C, G, U, 4-dimension), and the structural data were encoded as the fifth dimension (icSHAPE values ranging from 0 to 1, 1-dimension). Missing icSHAPE scores (Null) were dubbed “-1”.
For each RBP and a sliding window, if the output of binding probability is larger than 0.85 by the PrismNet model, we defined the sequence window as a predicted binding site of the RBP. Overlapped binding sites for the same protein were merged (Table S4).
RNA pull-down mass spectrometry analysis
Raw mass spectrometry data were searched against the human proteome (Uniprot database) with Proteome Discoverer Software. Subsequently, the MiST scoring algorithm was used to calculate the specific binding proteins in SARS-CoV-2 using the default parameters (Jäger et al., 2011). We used the threshold (MiST score > 0.7) to confidently obtain interacting host proteins. To further validate the data quality and identified proteins, we compared the total number of identified peptide spectra matched for the protein between replicates (r =0.97, Figure S6F) and analyzed the Gene Ontology (GO) term comparing with previous studies (Figure S6G).
Docking analysis of candidate drug to the RBP target
As no crystal structure is available for DDX42, we downloaded a 3D structural model for it from SWISS-MODEL (ID: Q86XP3) (Waterhouse et al., 2018), a homology model built from DDX17 crystal structure. We further refined and relaxed the homology model by molecular dynamics simulation with UCSF Chimera (Hinsen, 2000). We then used AutoDock Vina (Trott and Olson, 2010) to dock the drugs onto DDX42. The binding site with lowest free energy is displayed. We used the PLIP web server with default parameters (Salentin et al., 2015) for characterization and found several hydrogen bonding, halogen bonding, hydrophobic interaction and pi-stacking interactions, suggesting strong drug-target bindings.
Acknowledgments
We thank Profs. Jianbin Wang and Yonghui Zhang for the help with the project, Juanrong Zhang and Yao Li for the help of docking analysis, and the Life Science Editors for editing assistance. This work is supported by the National Natural Science Foundation of China (grants no. 91740204, 91940306, 31761163007, 32070153, and 81930063), the National Key R&D Program of China (2018YFA0107603 and 2019YFA0110002), Chinese Academy of Medical Sciences (CAMS) Innovation Fund for Medical Sciences (2016-I2M-1-014), Tsinghua University Spring Breeze Fund (2020Z99CFY029), Tsinghua University Initiative Scientific Research Program (2019Z06QCX10), and Tsinghua-Cambridge Joint Research Initiative Fund (2019Z02CAU). We thank the Tsinghua University Branch of China National Center for Protein Sciences (Beijing) for computational facility support. L.S. was supported by the Tsinghua-Peking Center for Life Sciences Postdoctoral Fellowship.
Author contributions
Q.C.Z. conceived the project. Q.C.Z., J.W., and Q.D. supervised the project. J.R. and L.R. prepared the SARS-CoV-2 virus. L.S. performed the icSHAPE experiments. X.J. developed the SARS-CoV-2 N trans-complementation system and screened the drugs. L.S., J.R., X.J., and M.G. performed the other validation experiments. K.X. and W.H. predicted RBP binding by PrismNet. P.L., W.H., and L.S. analyzed the results, assisted by X.Z., X. J., T.X., S.Z., E.M., Q.D., and Q.C.Z. Q.C.Z. and L.S. wrote the manuscript with inputs from all authors.
Declaration of interests
Q.D. and X.J. have filed a patent application on the use of the SARS-CoV-2 trans-complementation system and its use for anti-SARS-CoV-2 drug screening (2020109679884).
Published: February 9, 2021
Footnotes
Supplemental information can be found online at https://doi.org/10.1016/j.cell.2021.02.008.
Supplemental information
References
- Akiyama B.M., Laurence H.M., Massey A.R., Costantino D.A., Xie X., Yang Y., Shi P.Y., Nix J.C., Beckham J.D., Kieft J.S. Zika virus produces noncoding RNAs using a multi-pseudoknot structure that confounds a cellular exonuclease. Science. 2016;354:1148–1152. doi: 10.1126/science.aah3963. [DOI] [PMC free article] [PubMed] [Google Scholar]
- Andrews R.J., Peterson J.M., Haniff H.S., Chen J., Williams C., Grefe M., Disney M.D., Moss W.N. An in silico map of the SARS-CoV-2 RNA Structurome. bioRxiv. 2020 doi: 10.1101/2020.1104.1117.045161. 2020.04.17.045161. [DOI] [PMC free article] [PubMed] [Google Scholar]
- Andronescu M., Bereg V., Hoos H.H., Condon A. RNA STRAND: the RNA secondary structure and statistical analysis database. BMC Bioinformatics. 2008;9:340. doi: 10.1186/1471-2105-9-340. [DOI] [PMC free article] [PubMed] [Google Scholar]
- Ariumi Y., Kuroki M., Kushima Y., Osugi K., Hijikata M., Maki M., Ikeda M., Kato N. Hepatitis C virus hijacks P-body and stress granule components around lipid droplets. J. Virol. 2011;85:6882–6892. doi: 10.1128/JVI.02418-10. [DOI] [PMC free article] [PubMed] [Google Scholar]
- Aw J.G., Shen Y., Wilm A., Sun M., Lim X.N., Boon K.L., Tapsin S., Chan Y.S., Tan C.P., Sim A.Y., et al. In Vivo Mapping of Eukaryotic RNA Interactomes Reveals Principles of Higher-Order Organization and Regulation. Mol. Cell. 2016;62:603–617. doi: 10.1016/j.molcel.2016.04.028. [DOI] [PubMed] [Google Scholar]
- Beachboard D.C., Horner S.M. Innate immune evasion strategies of DNA and RNA viruses. Curr. Opin. Microbiol. 2016;32:113–119. doi: 10.1016/j.mib.2016.05.015. [DOI] [PMC free article] [PubMed] [Google Scholar]
- Bennett C.F., Baker B.F., Pham N., Swayze E., Geary R.S. Pharmacology of Antisense Drugs. Annu. Rev. Pharmacol Toxicol. 2017;57:81–105. doi: 10.1146/annurev-pharmtox-010716-104846. [DOI] [PubMed] [Google Scholar]
- Bernier C.R., Petrov A.S., Waterbury C.C., Jett J., Li F., Freil L.E., Xiong X., Wang L., Migliozzi B.L., Hershkovits E., et al. RiboVision suite for visualization and analysis of ribosomes. Faraday Discuss. 2014;169:195–207. doi: 10.1039/c3fd00126a. [DOI] [PubMed] [Google Scholar]
- Bolger A.M., Lohse M., Usadel B. Trimmomatic: a flexible trimmer for Illumina sequence data. Bioinformatics. 2014;30:2114–2120. doi: 10.1093/bioinformatics/btu170. [DOI] [PMC free article] [PubMed] [Google Scholar]
- Brion P., Westhof E. Hierarchy and dynamics of RNA folding. Annu. Rev. Biophys. Biomol. Struct. 1997;26:113–137. doi: 10.1146/annurev.biophys.26.1.113. [DOI] [PubMed] [Google Scholar]
- Burkhardt D.H., Rouskin S., Zhang Y., Li G.W., Weissman J.S., Gross C.A. Operon mRNAs are organized into ORF-centric structures that predict translation efficiency. eLife. 2017;6:6. doi: 10.7554/eLife.22037. [DOI] [PMC free article] [PubMed] [Google Scholar]
- Cai Z., Cao C., Ji L., Ye R., Wang D., Xia C., Wang S., Du Z., Hu N., Yu X., et al. RIC-seq for global in situ profiling of RNA-RNA spatial interactions. Nature. 2020;582:432–437. doi: 10.1038/s41586-020-2249-1. [DOI] [PubMed] [Google Scholar]
- Chen F., Di H., Wang Y., Cao Q., Xu B., Zhang X., Yang N., Liu G., Yang C.G., Xu Y., et al. Small-molecule targeting of a diapophytoene desaturase inhibits S. aureus virulence. Nat. Chem. Biol. 2016;12:174–179. doi: 10.1038/nchembio.2003. [DOI] [PubMed] [Google Scholar]
- Chen J., Zhang R., Lan J., Lin S., Li P., Gao J., Wang Y., Xie Z.J., Li F.C., Jiang S.J. IGF2BP1 Significantly Enhances Translation Efficiency of Duck Hepatitis A Virus Type 1 without Affecting Viral Replication. Biomolecules. 2019;9(10):549. doi: 10.3390/biom9100594. [DOI] [PMC free article] [PubMed] [Google Scholar]
- Darty K., Denise A., Ponty Y. VARNA: Interactive drawing and editing of the RNA secondary structure. Bioinformatics. 2009;25:1974–1975. doi: 10.1093/bioinformatics/btp250. [DOI] [PMC free article] [PubMed] [Google Scholar]
- Das R., Baker D. Automated de novo prediction of native-like RNA tertiary structures. Proc. Natl. Acad. Sci. USA. 2007;104:14664–14669. doi: 10.1073/pnas.0703836104. [DOI] [PMC free article] [PubMed] [Google Scholar]
- de Borba L., Villordo S.M., Iglesias N.G., Filomatori C.V., Gebhard L.G., Gamarnik A.V. Overlapping local and long-range RNA-RNA interactions modulate dengue virus genome cyclization and replication. J. Virol. 2015;89:3430–3437. doi: 10.1128/JVI.02677-14. [DOI] [PMC free article] [PubMed] [Google Scholar]
- Deigan K.E., Li T.W., Mathews D.H., Weeks K.M. Accurate SHAPE-directed RNA structure determination. Proc. Natl. Acad. Sci. USA. 2009;106:97–102. doi: 10.1073/pnas.0806929106. [DOI] [PMC free article] [PubMed] [Google Scholar]
- Dethoff E.A., Boerneke M.A., Gokhale N.S., Muhire B.M., Martin D.P., Sacco M.T., McFadden M.J., Weinstein J.B., Messer W.B., Horner S.M., Weeks K.M. Pervasive tertiary structure in the dengue virus RNA genome. Proc. Natl. Acad. Sci. USA. 2018;115:11513–11518. doi: 10.1073/pnas.1716689115. [DOI] [PMC free article] [PubMed] [Google Scholar]
- Dobin A., Davis C.A., Schlesinger F., Drenkow J., Zaleski C., Jha S., Batut P., Chaisson M., Gingeras T.R. STAR: ultrafast universal RNA-seq aligner. Bioinformatics. 2013;29:15–21. doi: 10.1093/bioinformatics/bts635. [DOI] [PMC free article] [PubMed] [Google Scholar]
- Dong E., Du H., Gardner L. An interactive web-based dashboard to track COVID-19 in real time. Lancet Infect. Dis. 2020;20:533–534. doi: 10.1016/S1473-3099(20)30120-1. [DOI] [PMC free article] [PubMed] [Google Scholar]
- Egli M., Minasov G., Tereshko V., Pallan P.S., Teplova M., Inamati G.B., Lesnik E.A., Owens S.R., Ross B.S., Prakash T.P., et al. Probing the influence of stereoelectronic effects on the biophysical properties of oligonucleotides: comprehensive analysis of the RNA affinity, nuclease resistance, and crystal structure of ten 2’-O-ribonucleic acid modifications. Biochemistry. 2005;44:9045–9057. doi: 10.1021/bi050574m. [DOI] [PubMed] [Google Scholar]
- Emara M.M., Brinton M.A. Interaction of TIA-1/TIAR with West Nile and dengue virus products in infected cells interferes with stress granule formation and processing body assembly. Proc. Natl. Acad. Sci. USA. 2007;104:9041–9046. doi: 10.1073/pnas.0703348104. [DOI] [PMC free article] [PubMed] [Google Scholar]
- Enjuanes L., Almazán F., Sola I., Zuñiga S. Biochemical aspects of coronavirus replication and virus-host interaction. Annu. Rev. Microbiol. 2006;60:211–230. doi: 10.1146/annurev.micro.60.080805.142157. [DOI] [PubMed] [Google Scholar]
- Ennifar E., Nikulin A., Tishchenko S., Serganov A., Nevskaya N., Garber M., Ehresmann B., Ehresmann C., Nikonov S., Dumas P. The crystal structure of UUCG tetraloop. J. Mol. Biol. 2000;304:35–42. doi: 10.1006/jmbi.2000.4204. [DOI] [PubMed] [Google Scholar]
- Filomatori C.V., Carballeda J.M., Villordo S.M., Aguirre S., Pallarés H.M., Maestre A.M., Sánchez-Vargas I., Blair C.D., Fabri C., Morales M.A., et al. Dengue virus genomic variation associated with mosquito adaptation defines the pattern of viral non-coding RNAs and fitness in human cells. PLoS Pathog. 2017;13:e1006265. doi: 10.1371/journal.ppat.1006265. [DOI] [PMC free article] [PubMed] [Google Scholar]
- Finkel Y., Mizrahi O., Nachshon A., Weingarten-Gabbay S., Morgenstern D., Yahalom-Ronen Y., Tamir H., Achdout H., Stein D., Israeli O., et al. The coding capacity of SARS-CoV-2. Nature. 2021;589:125–130. doi: 10.1038/s41586-020-2739-1. [DOI] [PubMed] [Google Scholar]
- Fraser C.S., Doudna J.A. Structural and mechanistic insights into hepatitis C viral translation initiation. Nat. Rev. Microbiol. 2007;5:29–38. doi: 10.1038/nrmicro1558. [DOI] [PubMed] [Google Scholar]
- Fu L., Niu B., Zhu Z., Wu S., Li W. CD-HIT: accelerated for clustering the next-generation sequencing data. Bioinformatics. 2012;28:3150–3152. doi: 10.1093/bioinformatics/bts565. [DOI] [PMC free article] [PubMed] [Google Scholar]
- Gao Y., Yan L., Huang Y., Liu F., Zhao Y., Cao L., Wang T., Sun Q., Ming Z., Zhang L., et al. Structure of the RNA-dependent RNA polymerase from COVID-19 virus. Science. 2020;368:779–782. doi: 10.1126/science.abb7498. [DOI] [PMC free article] [PubMed] [Google Scholar]
- Goebel S.J., Hsue B., Dombrowski T.F., Masters P.S. Characterization of the RNA components of a putative molecular switch in the 3′ untranslated region of the murine coronavirus genome. J. Virol. 2004;78:669–682. doi: 10.1128/JVI.78.2.669-682.2004. [DOI] [PMC free article] [PubMed] [Google Scholar]
- Gordon D.E., Jang G.M., Bouhaddou M., Xu J., Obernier K., White K.M., O’Meara M.J., Rezelj V.V., Guo J.Z., Swaney D.L., et al. A SARS-CoV-2 protein interaction map reveals targets for drug repurposing. Nature. 2020;583:459–468. doi: 10.1038/s41586-020-2286-9. [DOI] [PMC free article] [PubMed] [Google Scholar]
- Hinsen K. The Molecular Modeling Toolkit: A New Approach to Molecular Simulations. J. Comput. Chem. 2000;21:79–85. [Google Scholar]
- Hofacker I.L. RNA consensus structure prediction with RNAalifold. Methods Mol. Biol. 2007;395:527–544. doi: 10.1007/978-1-59745-514-5_33. [DOI] [PubMed] [Google Scholar]
- Hoffmann M., Kleine-Weber H., Schroeder S., Krüger N., Herrler T., Erichsen S., Schiergens T.S., Herrler G., Wu N.H., Nitsche A., et al. SARS-CoV-2 Cell Entry Depends on ACE2 and TMPRSS2 and Is Blocked by a Clinically Proven Protease Inhibitor. Cell. 2020;181:271–280.e8, e278. doi: 10.1016/j.cell.2020.02.052. [DOI] [PMC free article] [PubMed] [Google Scholar]
- Hu B., Yang Y.T., Huang Y., Zhu Y., Lu Z.J. POSTAR: a platform for exploring post-transcriptional regulation coordinated by RNA-binding proteins. Nucleic Acids Res. 2017;45(D1):D104–D114. doi: 10.1093/nar/gkw888. [DOI] [PMC free article] [PubMed] [Google Scholar]
- Huang H., Weng H., Sun W., Qin X., Shi H., Wu H., Zhao B.S., Mesquita A., Liu C., Yuan C.L., et al. Recognition of RNA N6-methyladenosine by IGF2BP proteins enhances mRNA stability and translation. Nat. Cell Biol. 2018;20:285–295. doi: 10.1038/s41556-018-0045-z. [DOI] [PMC free article] [PubMed] [Google Scholar]
- Jäger S., Cimermancic P., Gulbahce N., Johnson J.R., McGovern K.E., Clarke S.C., Shales M., Mercenne G., Pache L., Li K., et al. Global landscape of HIV-human protein complexes. Nature. 2011;481:365–370. doi: 10.1038/nature10719. [DOI] [PMC free article] [PubMed] [Google Scholar]
- Ju X., Zhu Y., Wang Y., Li J., Zhang J., Gong M., Ren W., Li S., Zhong J., Zhang Q.C., et al. A novel cell culture system modeling the SARS-CoV-2 life cycle. bioRxiv. 2020 doi: 10.1101/2020.1112.1113.422469. [DOI] [PMC free article] [PubMed] [Google Scholar]
- Kalvari I., Argasinska J., Quinones-Olvera N., Nawrocki E.P., Rivas E., Eddy S.R., Bateman A., Finn R.D., Petrov A.I. Rfam 13.0: shifting to a genome-centric resource for non-coding RNA families. Nucleic Acids Res. 2018;46(D1):D335–D342. doi: 10.1093/nar/gkx1038. [DOI] [PMC free article] [PubMed] [Google Scholar]
- Kalvari I., Nawrocki E.P., Argasinska J., Quinones-Olvera N., Finn R.D., Bateman A., Petrov A.I. Non-Coding RNA Analysis Using the Rfam Database. Curr. Protoc. Bioinformatics. 2018;62:e51. doi: 10.1002/cpbi.51. [DOI] [PMC free article] [PubMed] [Google Scholar]
- Kieft J.S. Viral IRES RNA structures and ribosome interactions. Trends Biochem. Sci. 2008;33:274–283. doi: 10.1016/j.tibs.2008.04.007. [DOI] [PMC free article] [PubMed] [Google Scholar]
- Kim D., Lee J.Y., Yang J.S., Kim J.W., Kim V.N., Chang H. The Architecture of SARS-CoV-2 Transcriptome. Cell. 2020;181:914–921.e10, e910. doi: 10.1016/j.cell.2020.04.011. [DOI] [PMC free article] [PubMed] [Google Scholar]
- Klein S., Cortese M., Winter S.L., Wachsmuth-Melm M., Neufeldt C.J., Cerikan B., Stanifer M.L., Boulant S., Bartenschlager R., Chlanda P. SARS-CoV-2 structure and replication characterized by in situ cryo-electron tomography. Nat. Commun. 2020;11:5885. doi: 10.1101/2020.1106.1123.167064. [DOI] [PMC free article] [PubMed] [Google Scholar]
- Korber B., Fischer W.M., Gnanakaran S., Yoon H., Theiler J., Abfalterer W., Hengartner N., Giorgi E.E., Bhattacharya T., Foley B., et al. Sheffield COVID-19 Genomics Group Tracking changes in SARS-CoV-2 Spike: evidence that D614G increases infectivity of the COVID-19 virus. Cell. 2020;182:812–827.e19, e819. doi: 10.1016/j.cell.2020.06.043. [DOI] [PMC free article] [PubMed] [Google Scholar]
- Kozlov A.M., Darriba D., Flouri T., Morel B., Stamatakis A. RAxML-NG: a fast, scalable and user-friendly tool for maximum likelihood phylogenetic inference. Bioinformatics. 2019;35:4453–4455. doi: 10.1093/bioinformatics/btz305. [DOI] [PMC free article] [PubMed] [Google Scholar]
- Lan J., Ge J., Yu J., Shan S., Zhou H., Fan S., Zhang Q., Shi X., Wang Q., Zhang L., Wang X. Structure of the SARS-CoV-2 spike receptor-binding domain bound to the ACE2 receptor. Nature. 2020;581:215–220. doi: 10.1038/s41586-020-2180-5. [DOI] [PubMed] [Google Scholar]
- Langmead B., Salzberg S.L. Fast gapped-read alignment with Bowtie 2. Nat. Methods. 2012;9:357–359. doi: 10.1038/nmeth.1923. [DOI] [PMC free article] [PubMed] [Google Scholar]
- Lee S., Lee Y.-S., Choi Y., Son A., Park Y., Lee K.-M., Kim J., Kim J.-S., Kim V.N. The SARS-CoV-2 RNA interactome. bioRxiv. 2020 doi: 10.1101/2020.11.02.364497. [DOI] [PMC free article] [PubMed] [Google Scholar]
- Leman J.K., Weitzner B.D., Lewis S.M., Adolf-Bryfogle J., Alam N., Alford R.F., Aprahamian M., Baker D., Barlow K.A., Barth P., et al. Macromolecular modeling and design in Rosetta: recent methods and frameworks. Nat. Methods. 2020;17:665–680. doi: 10.1038/s41592-020-0848-2. [DOI] [PMC free article] [PubMed] [Google Scholar]
- Li Z., Nagy P.D. Diverse roles of host RNA binding proteins in RNA virus replication. RNA Biol. 2011;8:305–315. doi: 10.4161/rna.8.2.15391. [DOI] [PMC free article] [PubMed] [Google Scholar]
- Li H., Handsaker B., Wysoker A., Fennell T., Ruan J., Homer N., Marth G., Abecasis G., Durbin R., Genome Project Data Processing The Sequence Alignment/Map format and SAMtools. Bioinformatics. 2009;25:2078–2079. doi: 10.1093/bioinformatics/btp352. [DOI] [PMC free article] [PubMed] [Google Scholar]
- Li L., Kang H., Liu P., Makkinje N., Williamson S.T., Leibowitz J.L., Giedroc D.P. Structural lability in stem-loop 1 drives a 5′ UTR-3′ UTR interaction in coronavirus replication. J. Mol. Biol. 2008;377:790–803. doi: 10.1016/j.jmb.2008.01.068. [DOI] [PMC free article] [PubMed] [Google Scholar]
- Li P.T., Vieregg J., Tinoco I., Jr. How RNA unfolds and refolds. Annu. Rev. Biochem. 2008;77:77–100. doi: 10.1146/annurev.biochem.77.061206.174353. [DOI] [PubMed] [Google Scholar]
- Li P., Wei Y., Mei M., Tang L., Sun L., Huang W., Zhou J., Zou C., Zhang S., Qin C.F., et al. Integrative Analysis of Zika Virus Genome RNA Structure Reveals Critical Determinants of Viral Infectivity. Cell Host Microbe. 2018;24:875–886.e5, e875. doi: 10.1016/j.chom.2018.10.011. [DOI] [PubMed] [Google Scholar]
- Li P., Shi R., Zhang Q.C. icSHAPE-pipe: A comprehensive toolkit for icSHAPE data analysis and evaluation. Methods. 2020;178:96–103. doi: 10.1016/j.ymeth.2019.09.020. [DOI] [PubMed] [Google Scholar]
- Liu N., Dai Q., Zheng G., He C., Parisien M., Pan T. N(6)-methyladenosine-dependent RNA structural switches regulate RNA-protein interactions. Nature. 2015;518:560–564. doi: 10.1038/nature14234. [DOI] [PMC free article] [PubMed] [Google Scholar]
- Liu Y., Wang Y., Wang X., Xiao Y., Chen L., Guo L., Li J., Ren L., Wang J. Development of two TaqMan real-time reverse transcription-PCR assays for the detection of severe acute respiratory syndrome coronavirus-2. Biosaf Health. 2020;2:232–237. doi: 10.1016/j.bsheal.2020.07.009. [DOI] [PMC free article] [PubMed] [Google Scholar]
- Lorenz R., Bernhart S.H., Höner Zu Siederdissen C., Tafer H., Flamm C., Stadler P.F., Hofacker I.L. ViennaRNA Package 2.0. Algorithms Mol. Biol. 2011;6:26. doi: 10.1186/1748-7188-6-26. [DOI] [PMC free article] [PubMed] [Google Scholar]
- Lu Z., Zhang Q.C., Lee B., Flynn R.A., Smith M.A., Robinson J.T., Davidovich C., Gooding A.R., Goodrich K.J., Mattick J.S., et al. RNA Duplex Map in Living Cells Reveals Higher-Order Transcriptome Structure. Cell. 2016;165:1267–1279. doi: 10.1016/j.cell.2016.04.028. [DOI] [PMC free article] [PubMed] [Google Scholar]
- Martinez Molina D., Jafari R., Ignatushchenko M., Seki T., Larsson E.A., Dan C., Sreekumar L., Cao Y., Nordlund P. Monitoring drug target engagement in cells and tissues using the cellular thermal shift assay. Science. 2013;341:84–87. doi: 10.1126/science.1233606. [DOI] [PubMed] [Google Scholar]
- Nakagawa K., Narayanan K., Wada M., Makino S. Inhibition of Stress Granule Formation by Middle East Respiratory Syndrome Coronavirus 4a Accessory Protein Facilitates Viral Translation, Leading to Efficient Virus Replication. J. Virol. 2018;92:e00902-18. doi: 10.1128/JVI.00902-18. [DOI] [PMC free article] [PubMed] [Google Scholar]
- Nakamura T., Yamada K.D., Tomii K., Katoh K. Parallelization of MAFFT for large-scale multiple sequence alignments. Bioinformatics. 2018;34:2490–2492. doi: 10.1093/bioinformatics/bty121. [DOI] [PMC free article] [PubMed] [Google Scholar]
- Nawrocki E.P., Eddy S.R. Computational identification of functional RNA homologs in metagenomic data. RNA Biol. 2013;10:1170–1179. doi: 10.4161/rna.25038. [DOI] [PMC free article] [PubMed] [Google Scholar]
- Nawrocki E.P., Eddy S.R. Infernal 1.1: 100-fold faster RNA homology searches. Bioinformatics. 2013;29:2933–2935. doi: 10.1093/bioinformatics/btt509. [DOI] [PMC free article] [PubMed] [Google Scholar]
- Ni L., Ye F., Cheng M.L., Feng Y., Deng Y.Q., Zhao H., Wei P., Ge J., Gou M., Li X., et al. Detection of SARS-CoV-2-Specific Humoral and Cellular Immunity in COVID-19 Convalescent Individuals. Immunity. 2020;52:971–977.e3, e973. doi: 10.1016/j.immuni.2020.04.023. [DOI] [PMC free article] [PubMed] [Google Scholar]
- Nicholson B.L., White K.A. Functional long-range RNA-RNA interactions in positive-strand RNA viruses. Nat. Rev. Microbiol. 2014;12:493–504. doi: 10.1038/nrmicro3288. [DOI] [PMC free article] [PubMed] [Google Scholar]
- Ooi Y.S., Majzoub K., Flynn R.A., Mata M.A., Diep J., Li J.K., van Buuren N., Rumachik N., Johnson A.G., Puschnik A.S., et al. An RNA-centric dissection of host complexes controlling flavivirus infection. Nat. Microbiol. 2019;4:2369–2382. doi: 10.1038/s41564-019-0518-2. [DOI] [PMC free article] [PubMed] [Google Scholar]
- Payne K.A., Quezada C.P., Fisher K., Dunstan M.S., Collins F.A., Sjuts H., Levy C., Hay S., Rigby S.E., Leys D. Reductive dehalogenase structure suggests a mechanism for B12-dependent dehalogenation. Nature. 2015;517:513–516. doi: 10.1038/nature13901. [DOI] [PMC free article] [PubMed] [Google Scholar]
- Peiris J.S., Lai S.T., Poon L.L., Guan Y., Yam L.Y., Lim W., Nicholls J., Yee W.K., Yan W.W., Cheung M.T., et al. SARS study group Coronavirus as a possible cause of severe acute respiratory syndrome. Lancet. 2003;361:1319–1325. doi: 10.1016/S0140-6736(03)13077-2. [DOI] [PMC free article] [PubMed] [Google Scholar]
- Perlman S. Another Decade, Another Coronavirus. N. Engl. J. Med. 2020;382:760–762. doi: 10.1056/NEJMe2001126. [DOI] [PMC free article] [PubMed] [Google Scholar]
- Piao M., Sun L., Zhang Q.C. RNA Regulations and Functions Decoded by Transcriptome-wide RNA Structure Probing. Genomics Proteomics Bioinformatics. 2017;15:267–278. doi: 10.1016/j.gpb.2017.05.002. [DOI] [PMC free article] [PubMed] [Google Scholar]
- Pirakitikulr N., Kohlway A., Lindenbach B.D., Pyle A.M. The Coding Region of the HCV Genome Contains a Network of Regulatory RNA Structures. Mol. Cell. 2016;62:111–120. doi: 10.1016/j.molcel.2016.01.024. [DOI] [PMC free article] [PubMed] [Google Scholar]
- Ramanathan M., Majzoub K., Rao D.S., Neela P.H., Zarnegar B.J., Mondal S., Roth J.G., Gai H., Kovalski J.R., Siprashvili Z., et al. RNA-protein interaction detection in living cells. Nat. Methods. 2018;15:207–212. doi: 10.1038/nmeth.4601. [DOI] [PMC free article] [PubMed] [Google Scholar]
- Rangan R., Zheludev I.N., Hagey R.J., Pham E.A., Wayment-Steele H.K., Glenn J.S., Das R. RNA genome conservation and secondary structure in SARS-CoV-2 and SARS-related viruses: a first look. RNA. 2020;26:937–959. doi: 10.1261/rna.076141.120. [DOI] [PMC free article] [PubMed] [Google Scholar]
- Ren A., Patel D.J. c-di-AMP binds the ydaO riboswitch in two pseudo-symmetry-related pockets. Nat. Chem. Biol. 2014;10:780–786. doi: 10.1038/nchembio.1606. [DOI] [PMC free article] [PubMed] [Google Scholar]
- Ren A., Micura R., Patel D.J. Structure-based mechanistic insights into catalysis by small self-cleaving ribozymes. Curr. Opin. Chem. Biol. 2017;41:71–83. doi: 10.1016/j.cbpa.2017.09.017. [DOI] [PMC free article] [PubMed] [Google Scholar]
- Reuter J.S., Mathews D.H. RNAstructure: software for RNA secondary structure prediction and analysis. BMC Bioinformatics. 2010;11:129. doi: 10.1186/1471-2105-11-129. [DOI] [PMC free article] [PubMed] [Google Scholar]
- Rix U., Colinge J., Blatt K., Gridling M., Remsing Rix L.L., Parapatics K., Cerny-Reiterer S., Burkard T.R., Jager U., Melo J.V., et al. A target-disease network model of second-generation BCR-ABL inhibitor action in Ph+ ALL. PloS One. 2013;8:e77155. doi: 10.1371/journal.pone.0077155. [DOI] [PMC free article] [PubMed] [Google Scholar]
- Roberts T.C., Langer R., Wood M.J.A. Advances in oligonucleotide drug delivery. Nat. Rev. Drug Discov. 2020;19:673–694. doi: 10.1038/s41573-020-0075-7. [DOI] [PMC free article] [PubMed] [Google Scholar]
- Robertson M.P., Igel H., Baertsch R., Haussler D., Ares M., Jr., Scott W.G. The structure of a rigorously conserved RNA element within the SARS virus genome. PLoS Biol. 2005;3:e5. doi: 10.1371/journal.pbio.0030005. [DOI] [PMC free article] [PubMed] [Google Scholar]
- Robinson J.T., Thorvaldsdottir H., Winckler W., Guttman M., Lander E.S., Getz G., Mesirov J.P. Integrative genomics viewer. Nat. Biotechnol. 2011;29:24–26. doi: 10.1038/nbt.1754. [DOI] [PMC free article] [PubMed] [Google Scholar]
- Salentin S., Schreiber S., Haupt V.J., Adasme M.F., Schroeder M. PLIP: fully automated protein-ligand interaction profiler. Nucleic Acids Res. 2015;43(W1):W443. doi: 10.1093/nar/gkv315. 7. [DOI] [PMC free article] [PubMed] [Google Scholar]
- Schmidt N., Lareau C.A., Keshishian H., Ganskih S., Schneider C., Hennig T., Melanson R., Werner S., Wei Y., Zimmer M., et al. The SARS-CoV-2 RNA-protein interactome in infected human cells. Nat. Microbiol. 2020 doi: 10.3390/biom9100594. [DOI] [PMC free article] [PubMed] [Google Scholar]
- Schnell G., Loo Y.M., Marcotrigiano J., Gale M., Jr. Uridine composition of the poly-U/UC tract of HCV RNA defines non-self recognition by RIG-I. PLoS Pathog. 2012;8:e1002839. doi: 10.1371/journal.ppat.1002839. [DOI] [PMC free article] [PubMed] [Google Scholar]
- Shi S.T., Huang P., Li H.P., Lai M.M. Heterogeneous nuclear ribonucleoprotein A1 regulates RNA synthesis of a cytoplasmic virus. EMBO J. 2000;19:4701–4711. doi: 10.1093/emboj/19.17.4701. [DOI] [PMC free article] [PubMed] [Google Scholar]
- Simon L.M., Morandi E., Luganini A., Gribaudo G., Martinez-Sobrido L., Turner D.H., Oliviero S., Incarnato D. In vivo analysis of influenza A mRNA secondary structures identifies critical regulatory motifs. Nucleic Acids Res. 2019;47:7003–7017. doi: 10.1093/nar/gkz318. [DOI] [PMC free article] [PubMed] [Google Scholar]
- Sola I., Galán C., Mateos-Gómez P.A., Palacio L., Zúñiga S., Cruz J.L., Almazán F., Enjuanes L. The polypyrimidine tract-binding protein affects coronavirus RNA accumulation levels and relocalizes viral RNAs to novel cytoplasmic domains different from replication-transcription sites. J. Virol. 2011;85:5136–5149. doi: 10.1128/JVI.00195-11. [DOI] [PMC free article] [PubMed] [Google Scholar]
- Spitale R.C., Flynn R.A., Zhang Q.C., Crisalli P., Lee B., Jung J.W., Kuchelmeister H.Y., Batista P.J., Torre E.A., Kool E.T., Chang H.Y. Structural imprints in vivo decode RNA regulatory mechanisms. Nature. 2015;519:486–490. doi: 10.1038/nature14263. [DOI] [PMC free article] [PubMed] [Google Scholar]
- Spurgers K.B., Sharkey C.M., Warfield K.L., Bavari S. Oligonucleotide antiviral therapeutics: antisense and RNA interference for highly pathogenic RNA viruses. Antiviral Res. 2008;78:26–36. doi: 10.1016/j.antiviral.2007.12.008. [DOI] [PMC free article] [PubMed] [Google Scholar]
- Sun L., Fazal F.M., Li P., Broughton J.P., Lee B., Tang L., Huang W., Kool E.T., Chang H.Y., Zhang Q.C. RNA structure maps across mammalian cellular compartments. Nat. Struct. Mol. Biol. 2019;26:322–330. doi: 10.1038/s41594-019-0200-7. [DOI] [PMC free article] [PubMed] [Google Scholar]
- Sun L., Xu K., Huang W., Yang Y.T., Li P., Tang L., Xiong T., Zhang Q.C. Predicting dynamic cellular protein-RNA interactions using deep learning and in vivo RNA structure. Cell Res. 2021 doi: 10.1038/s41422-021-00476-y. [DOI] [PMC free article] [PubMed] [Google Scholar]
- Thapar R., Denmon A.P., Nikonowicz E.P. Recognition modes of RNA tetraloops and tetraloop-like motifs by RNA-binding proteins. Wiley Interdiscip. Rev. RNA. 2014;5:49–67. doi: 10.1002/wrna.1196. [DOI] [PMC free article] [PubMed] [Google Scholar]
- Trott O., Olson A.J. AutoDock Vina: improving the speed and accuracy of docking with a new scoring function, efficient optimization, and multithreading. J. Comput. Chem. 2010;31:455–461. doi: 10.1002/jcc.21334. [DOI] [PMC free article] [PubMed] [Google Scholar]
- van den Born E., Posthuma C.C., Gultyaev A.P., Snijder E.J. Discontinuous subgenomic RNA synthesis in arteriviruses is guided by an RNA hairpin structure located in the genomic leader region. J. Virol. 2005;79:6312–6324. doi: 10.1128/JVI.79.10.6312-6324.2005. [DOI] [PMC free article] [PubMed] [Google Scholar]
- Van Nostrand E.L., Pratt G.A., Shishkin A.A., Gelboin-Burkhart C., Fang M.Y., Sundararaman B., Blue S.M., Nguyen T.B., Surka C., Elkins K., et al. Robust transcriptome-wide discovery of RNA-binding protein binding sites with enhanced CLIP (eCLIP) Nat. Methods. 2016;13:508–514. doi: 10.1038/nmeth.3810. [DOI] [PMC free article] [PubMed] [Google Scholar]
- Walls A.C., Park Y.J., Tortorici M.A., Wall A., McGuire A.T., Veesler D. Structure, Function, and Antigenicity of the SARS-CoV-2 Spike Glycoprotein. Cell. 2020;181:281–292.e6, e286. doi: 10.1016/j.cell.2020.02.058. [DOI] [PMC free article] [PubMed] [Google Scholar]
- Warner K.D., Hajdin C.E., Weeks K.M. Principles for targeting RNA with drug-like small molecules. Nat. Rev. Drug Discov. 2018;17:547–558. doi: 10.1038/nrd.2018.93. [DOI] [PMC free article] [PubMed] [Google Scholar]
- Waterhouse A., Bertoni M., Bienert S., Studer G., Tauriello G., Gumienny R., Heer F.T., de Beer T.A.P., Rempfer C., Bordoli L., et al. SWISS-MODEL: homology modelling of protein structures and complexes. Nucleic Acids Res. 2018;46(W1):W296–W303. doi: 10.1093/nar/gky427. [DOI] [PMC free article] [PubMed] [Google Scholar]
- Watts J.M., Dang K.K., Gorelick R.J., Leonard C.W., Bess J.W., Jr., Swanstrom R., Burch C.L., Weeks K.M. Architecture and secondary structure of an entire HIV-1 RNA genome. Nature. 2009;460:711–716. doi: 10.1038/nature08237. [DOI] [PMC free article] [PubMed] [Google Scholar]
- Weinlich S., Huttelmaier S., Schierhorn A., Behrens S.E., Ostareck-Lederer A., Ostareck D.H. IGF2BP1 enhances HCV IRES-mediated translation initiation via the 3’UTR. RNA. 2009;15:1528–1542. doi: 10.1261/rna.1578409. [DOI] [PMC free article] [PubMed] [Google Scholar]
- Wu F., Zhao S., Yu B., Chen Y.M., Wang W., Song Z.G., Hu Y., Tao Z.W., Tian J.H., Pei Y.Y., et al. A new coronavirus associated with human respiratory disease in China. Nature. 2020;579:265–269. doi: 10.1038/s41586-020-2008-3. [DOI] [PMC free article] [PubMed] [Google Scholar]
- Yan R., Zhang Y., Li Y., Xia L., Guo Y., Zhou Q. Structural basis for the recognition of SARS-CoV-2 by full-length human ACE2. Science. 2020;367:1444–1448. doi: 10.1126/science.abb2762. [DOI] [PMC free article] [PubMed] [Google Scholar]
- Yang J.H., Li J.H., Shao P., Zhou H., Chen Y.Q., Qu L.H. starBase: a database for exploring microRNA-mRNA interaction maps from Argonaute CLIP-Seq and Degradome-Seq data. Nucleic Acids Res. 2011;39:D202–D209. doi: 10.1093/nar/gkq1056. [DOI] [PMC free article] [PubMed] [Google Scholar]
- Yang D., Liu P., Wudeck E.V., Giedroc D.P., Leibowitz J.L. SHAPE analysis of the RNA secondary structure of the Mouse Hepatitis Virus 5′ untranslated region and N-terminal nsp1 coding sequences. Virology. 2015;475:15–27. doi: 10.1016/j.virol.2014.11.001. [DOI] [PMC free article] [PubMed] [Google Scholar]
- Yang X., Yang M., Deng H., Ding Y. New Era of Studying RNA Secondary Structure and Its Influence on Gene Regulation in Plants. Front. Plant Sci. 2018;9:671. doi: 10.3389/fpls.2018.00671. [DOI] [PMC free article] [PubMed] [Google Scholar]
- Zaki A.M., van Boheemen S., Bestebroer T.M., Osterhaus A.D., Fouchier R.A. Isolation of a novel coronavirus from a man with pneumonia in Saudi Arabia. N. Engl. J. Med. 2012;367:1814–1820. doi: 10.1056/NEJMoa1211721. [DOI] [PubMed] [Google Scholar]
- Zhang K., Zheludev I.N., Hagey R.J., Wu M.T., Haslecker R., Hou Y.J., Kretsch R., Pintilie G.D., Rangan R., Kladwang W., et al. Cryo-electron Microscopy and Exploratory Antisense Targeting of the 28-kDa Frameshift Stimulation Element from the SARS-CoV-2 RNA Genome. bioRxiv. 2020 doi: 10.1101/2020.1107.1118.209270. 2020.07.18.209270. [DOI] [PMC free article] [PubMed] [Google Scholar]
- Ziv O., Gabryelska M.M., Lun A.T.L., Gebert L.F.R., Sheu-Gruttadauria J., Meredith L.W., Liu Z.Y., Kwok C.K., Qin C.F., MacRae I.J., et al. COMRADES determines in vivo RNA structures and interactions. Nat. Methods. 2018;15:785–788. doi: 10.1038/s41592-018-0121-0. [DOI] [PMC free article] [PubMed] [Google Scholar]
- Zubradt M., Gupta P., Persad S., Lambowitz A.M., Weissman J.S., Rouskin S. DMS-MaPseq for genome-wide or targeted RNA structure probing in vivo. Nat. Methods. 2017;14:75–82. doi: 10.1038/nmeth.4057. [DOI] [PMC free article] [PubMed] [Google Scholar]
Associated Data
This section collects any data citations, data availability statements, or supplementary materials included in this article.
Supplementary Materials
Data Availability Statement
The icSHAPE sequencing data of all cell lines reported in this project is available at Gene Expression Omnibus under accession code GSE153984. The scripts for SARS-CoV-2 structure model construction and all downstream analyses used in this project are available at github (https://github.com/lipan6461188/SARS-CoV-2).