Abstract
The complete mitochondrial genome of stripped eel catfish, Plotosus lineatus, is sequenced in this study. The mitochondrial genome sequence is 16 480 bp in length, with the base composition of 24.7% A, 31.8% T, 27.8% G and 15.7% C. The G + C content is 43.5%. The mitochondria includes 13 protein-coding genes, 22 transfer RNA genes, two ribosomal RNA genes and one D-loop region. Except for NAD6 gene and eight tRNA genes, all other mitochondrial genes were encoded on the heavy strand. Plotosus lineatus was confirmed to be closely related to P. japonicus (GenBank: KR270437.1), based on our phylogenetic analysis on complete mitochondrial genome sequences of 13 species. Our complete mitogenome data are going to provide the basis for taxonomic and phylogenetic research of catfishes.
Keywords: Complete mitochondrial genome, Plotosus lineatus, Siluriformes
Stripped eel catfish, Plotosus lineatus, belonging to Plotosidae in Siluriformes, has been distributed in the Eastern Mediterranean, in the Indian Ocean, and in the Western Pacific Ocean. Sometimes, it enters freshwaters in East Africa and Madagascar. Hard spines of its dorsal and pectoral fins are jagged and poison, hence it will be very painful when spine injury occurs. Separation of lethal factors from secretions of this catfish species can be easily achieved on DEAE-cellulose. Plotosus Lineatus is a dangerous fish, and it feeds on small fish and shrimp (Golani 2002). Therefore, sequencing the complete mitochondrial genome will play an important role in promoting the study of P. Lineatus. In this study, the complete mitochondrial genome of P. lineatus (GenBank accession no. KU213641) is determined at the first time.
One adult fish was collected from Sanya, China (E109°31', N18°14') and stored in 95% ethanol. The specimen was stored at China National Genebank (Accession no. SY2014112528). The total genomic DNA was extracted from P. Lineatus fin using traditional phenol–chloroform extraction method (Taggart et al. 1992). A library of the whole genome with an insert size of 250 bp was prepared and sequenced at 2.5-Gb depth and 150-bp PE on an Illumina HiSeq4000 platform (Illumina Inc., San Diego, CA) at BGI, Shenzhen, China. Raw reads were filtered with a Perl script that removes reads containing adaptor contamination. De novo assemblies for P. Lineatus was generated using SOAPdenovo-Trans (-K 71) (Tang et al. 2015).
We confirmed that the complete mitochondrial genome is 16 480 bp in length, with the base composition of 24.7% A, 31.8% T, 27.8% G and 15.7% C. The G + C content is 43.5% and the A + T ratio is 56.5%. The annotation by DOGMA (http://dogma.ccbb.utexas.edu) (Wyman et al. 2004) proved that the genome contains 13 protein-coding genes, 22 transfer RNA genes and two ribosomal RNA genes. Most of the genes are encoded on the heavy strand (H-strand), except for NAD6 gene and eight tRNA genes encoded on the L-strand. The length of tRNAs ranges from 67 to 75 bp. Except for NAD1 starting with ATA, COX1 starting with GTG and NAD5 starting with CTT, the remaining 10 protein-coding genes start with ATG. The 12S ribosomal RNA and the 16S ribosomal RNA are annotated with corresponding sizes of 943 and 1 584 bp, respectively. The D-loop control region, with a full length of 890 bp, is located between tRNA-Pro and tRNA-Phe.
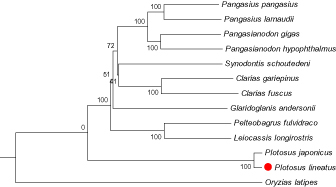
Phylogenetic trees were constructed by neighbour-joining and maximum-likelihood method using MEGA 6.0 software (Tamura et al. 2013) with 12 more complete mitochondrial genome sequences downloaded from the NCBI (http://www.ncbi.nlm.nih.gov/) (Table 1). Both the two methods generated the identical topological structure (Figure 1). We confirmed that P. lineatus is clustered with P. japonicus and rooted with the other Siluriformes species, and it has a distant relationship with other species.
Table 1.
List of fishes used for the phylogenetic analysis in this study with corresponding accession numbers.
| GI numbers | Accession numbers | Species |
|---|---|---|
| 910266039 | KR270437.1 | Plotosus japonicus |
| 302024719 | HM641815.1 | Pelteobagrus fulvidraco |
| 290758083 | GU596454.1 | Leiocassis longirostris |
| 383505891 | JQ026254.1 | Glaridoglanis andersonii |
| 901694575 | KT001082.1 | Clarias gariepinus |
| 532693267 | KF188424.1 | Clarias fuscus |
| 338797628 | AP012023.1 | Synodontis schoutedeni |
| 474452625 | KC572135.1 | Pangasius pangasius |
| 338797558 | AP012018.1 | Pangasius larnaudii |
| 53794108 | AY762971.1 | Pangasianodon gigas |
| 511369194 | KC846907.1 | Pangasianodon hypophthalmus |
| 25057156 | NC_004387.1 | Oryzias latipes |
Figure 1.

The phylogenetic tree (neighbour-joining topology) based on the comparison of whole mitochondrial genome sequences of 13 species. Numbers at each node represent the bootstrap value for neighbour-joining analysis. Check the accession number of each species in Table 1.
Disclosure statement
The authors report no conflict of interests. We are responsible for the content and writing of the paper. This work was supported by Three New Projects on Agriculture and Aquaculture in Jiangsu Province (No. Y2015-12), Special Project on the Integration of Industry, Education and Research of Guangdong Province (No. 2013B090800017), Shenzhen Special Program for Future Industrial Development (No. SGG20141020113728803), and Special Fund For State Oceanic Administration Scientific Research in the Public Interest (No. 201305018).
References
- Golani D. 2002. . The Indo-Pacific striped eel catfish, Plotosus lineatus (Thunberg, 1787), (Osteichtyes: Siluriformes) a new record from the Mediterranean. Sci Mar. 66:321–323. [Google Scholar]
- Taggart JB, Hynes RA, Prod Uhl PA, Ferguson A.. 1992. A simplified protocol for routine total DNA isolation from salmonid fishes. J Fish Biol. 40:963–965. [Google Scholar]
- Tamura K, Stecher G, Peterson D, Filipski A, Kumar S.. 2013. MEGA6: molecular evolutionary genetics analysis version 6.0. Mol Biol Evol. 30:2725–2729. [DOI] [PMC free article] [PubMed] [Google Scholar]
- Tang M, Hardman CJ, Ji Y, Meng G, Liu S, Tan M, Yang S, Moss ED, Wang J, Yang C.. 2015. High‐throughput monitoring of wild bee diversity and abundance via mitogenomics. Methods Ecol Evol. 6:1034–1043. [DOI] [PMC free article] [PubMed] [Google Scholar]
- Wyman SK, Jansen RK, Boore JL.. 2004. Automatic annotation of organellar genomes with DOGMA. Bioinformatics 20:3252–3255. [DOI] [PubMed] [Google Scholar]


