Abstract
Wearable biosensors can be used to monitor opioid use, a problem of dire societal consequence given the current opioid epidemic in the US. Such surveillance can prompt interventions that promote behavioral change. Prior work has focused on the use of wearable biosensor data to detect opioid use. In this work, we present a method that uses machine learning to identify opioid withdrawal using data collected with a wearable biosensor. Our method involves developing a set of machine-learning classifiers, and then evaluating those classifiers using unseen test data. An analysis of the best performing model (based on the Random Forest algorithm) produced a receiver operating characteristic (ROC) area under the curve (AUC) of 0.9997 using completely unseen test data. Further, the model is able to detect withdrawal with just one minute of biosensor data. These results show the viability of using machine learning for opioid withdrawal detection. To our knowledge, the proposed method for identifying opioid withdrawal in OUD patients is the first of its kind.
1. Introduction
The Center For Disease Control (CDC) has reported that of the 70,000 people who died from a drug overdose in the United States during 2017, 68% of those deaths involved opioids [1]. The treatment process for individuals with opioid use disorder (OUD) involves detoxification (aka detox), often with medication assisted treatment (MAT) using drugs such as methadone or buprenorphine [2]. During the detoxification period, OUD subjects can experience opioid withdrawal symptoms for up to 7 days after their last drug use. Symptoms of opioid withdrawal include nausea, vomiting, diarrhea, and severe diffuse body pain [3]. These symptoms are often so severe that they have been found to increase the risk of relapse and overdose death [3]. Some studies have even shown that up to 70% of OUD subjects relapse after completing opioid detoxification due to the withdrawal they experience. [4]. The process of opioid detoxification is complicated and difficult for both healthcare practitioners and patients.
Up until the past few decades, the evaluation of patient health and wellbeing was limited to when a patient visited their healthcare provider [5]. More recently, the improvements in commercially available wearable biosensors have given healthcare providers the capability to monitor various aspects of the physiological state of their patients health remotely [5]. These analytical devices can be worn at all times by patients, and can collect and transmit key indicators of patient physiology in real time. Wearable biosensors have already been shown to have potential for detecting and managing opioid use in real-time [6] [7] [8]. Undergoing the detoxification process, and experiencing opioid withdrawal can be difficult for OUD patients. Improving the clinician’s ability to monitor patients during withdrawal (e.g. while in a detoxification program) would help clinicians personalize treatment options for relapse prevention. Personalized treatment for opioid withdrawal has the potential to improve treatment success and ultimately save lives.
In this work, we present a method that uses machine learning to identify opioid withdrawal using data collected with a wearable biosensor. To develop and evaluate our approach for detecting opioid withdrawal using biosensors, we rely on using biosensor data collected from overdosing patients in a hospital emergency department (ED). We used an Empatica E4 wrist-mounted biosensor (Empatica, Milan, Italy) for our data collection. Data was collected from 16 subjects who presented to a single ED for medical care following an opioid overdose. The subjects were in various states of recovery subsequent to an administration of naloxone 1. Our subjects were real medical patients suffering from OUD, and all data was gathered in a way that prioritized patient care and wellness over research goals with approval from our Institutional Review Board (IRB).
In order to detect withdrawal, we use standard machine learning techniques to develop classifiers that capture the uniqueness of the physiological measurements collected by the Empatica E4 during withdrawal. The physiological measurements collected are blood volume pulse, electrodermal activity, skin temperature, and movement (accelerometry). During their stay in the ED, the subjects were evaluated by clinicians every 30 minutes to an hour. At each of these evaluations the subjects were assessed to be in one of three states – withdrawal, intoxicated, or neutral. We decided to use a 20 minute interval surrounding the time when the physician assessed the physiological state of the subjects for training and testing our models, as we had confidence in the ground-truth of the patient’s state during that time. The classifiers developed were general models essentially able to distinguish between the withdrawal state from all other states.
In total, our dataset had data collected from 16 different OUD subjects. Six of the 16 subjects had data in the withdrawal state. Two of these six subjects had neutral state data as well, the other four had data exclusively in the withdrawal state (based on the clinician’s assessment). The remaining 10 other OUD subjects used in this study had data assessed in either the neutral or the intoxicated states or both. This means our dataset has many more examples in the neutral and intoxicated state compared to the withdrawal state. This class imbalance had to be addressed during the development of our models.
An analysis demonstrates the viability of our method. Upon training our models, and compensating for the class imbalance, we were able to achieve almost perfect results using our test data. The best performing model (Random Forest) during testing had a receiver operating characteristic (ROC) area under the curve (AUC) of 0.9997. Our test data was completely unseen data (by our models during training) involving both withdrawal and non-withdrawal states. Further, the model is able to detect withdrawal with just one minute of biosensor data. To the best of our knowledge, this is the first work related to using machine learning to identify opioid withdrawal of any kind.
2. Related Work
As previously mentioned, we do not know of any work that has been done related to using wearable biosensors to detect opioid withdrawal. The majority of research involving identifying opioid withdrawal is related to the development of clinical tools whose purpose is to assess a patient for withdrawal symptoms. The common form these clinical tools come in are surveys or scales [3]. One commonly used assessment tool is the the Clinical Opiate Withdrawal Scale (COWS). This scale considers a number of different physiological symptoms to help medical staff identify to what extent a patient is experiencing opioid withdrawal [9]. These opioid withdrawal scales have limitations since signs and symptoms may go unrecorded when clinicians are not observing a patient, and they require patients to self report certain symptoms [3]. There has also been previous pharmacological research that relates the physiological symptoms of opioid withdrawal to stress [10].
There are many studies that have used machine learning to identify stress. Personalized stress models built with data collected from a wearable biosensor have been show to be successful in preliminary studies [11]. At the same time, using data collected from wearable biosensors has also been successfully used to build general models for detecting stress [12]. Limited work has been done related to stress detection in Substance Use Disorder (SUD) patients [13], but no such work has been done related to OUD patients. However, since it has been shown that opioid withdrawal symptoms can be conceptualized as being similar to those of stress [10], we will leverage some of the features of stress detection in this work.
Wearable biosensors have been used in opioid research for automatic detection of opioid intake [6] [14], and detecting recurrent opioid toxicity in patients after being administered naloxone [15]. Wearable sensor adherence was modeled recently using data from patients with opioid use disorder [8]. None of these previous studies looked to use wearable biosensors to identify opioid withdrawal.
3. Problem Statement
The goal of this paper is to explore the use of machine learning for identifying opioid withdrawal. The idea is to build a model that learns to differentiate physiological data (collected from wearable biosensors) assessed to be in the withdrawal state, from data assessed in either the neutral or intoxicated state (i.e., non-withdrawal state). Once developed, this model will be able to assess whether or not a never before seen snippet of data has come from an OUD patient in the withdrawal state. As shown in Figure 1, we aim to build a binary classifier that can distinguish between biosensor data emanating from a person in withdrawal versus a person not in withdrawal.
Figure 1.
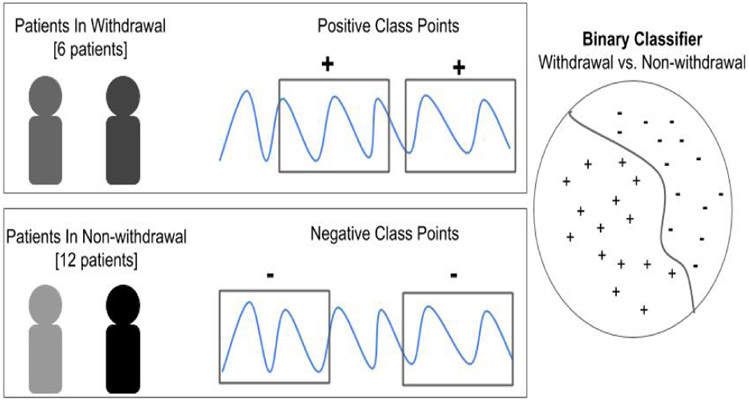
Overview of problem statement for developing a classifier to detect opioid withdrawal.
4. Dataset, Features, Training and Testing Process
In this section we describe our dataset, the features we extract from it and the general process of our classifier training and testing. In subsequent sections, we delve into the training and testing outcomes.
Data Collection:
The dataset used in this study was collected from individuals (subjects) admitted to the emergency department (ED) who received naloxone after experiencing a potential opioid overdose. Upon obtaining informed consent, research staff placed an Empatica E4 wearable biosensor on the subjects non-dominant wrist in order to collect their biometric data. The E4 collects four different types of data from the body (described below).
One of the standard tools used by clinicians to assess whether a patient has opioid withdrawal symptoms is the Clinical Opiate Withdrawal Scale (COWS) [9]. The COWS considers, among other biometrics, a subjects heart rate, perspiration, and acute movements. Given that the Empatica E4 collects some of the exact data types used in the COWS, we used these same biometrics in our analysis. Specifically, in our work we used blood volume pulse (BVP) (sampled at 64 Hz) data, electrodermal activity (EDA) (sampled at 4 Hz) data, skin temperature (sampled at 4 Hz) data, and triaxial accelerometer (sampled at 32 Hz) data. While the COWS doesn’t consider a patient’s skin temperature in its assessment for opioid withdrawal symptoms, there are several other opiate withdrawal scales that do [3].
Along with the data collected by the E4, the physiological state of a subject was assessed and recorded by a board-certified emergency physician and medical toxicologist in the ED. The physiological state of a subject was classified as one of three states based on clinician assessment: neutral, intoxicated, or withdrawal. The neutral state refers to a subject not being in opioid intoxication or opioid withdrawal. The intoxicated state refers to a state with signs and symptoms consistent with opioid intoxication. The withdrawal state refers to a state with signs and symptoms of opioid withdrawal.
The assessment of a subject’s physiological state took place every 30 minutes to an hour. Subjects assessed in the intoxicated or withdrawal states were generally laying on a hospital stretcher due to incapacity or discomfort, respectively. The neutral state assessments were often done while the subject was performing a variety of activities such as walking, talking, eating, etc. A subject may have been assessed in variety of different states during their enrollment in the study. It was not uncommon for subjects to transition from one state to another during the course of the study: for example to be neutral on one assessment, then to be in a withdrawal state on a second assessment 30 minutes later. The clinician assessment of the state of a subject provides us with the ground-truth needed to build our models. Overall, we used data from 16 subjects in this study. The demographics of the subject population can be found in Table 1.
Table 1.
Demographics of our dataset
| Gender | Count | Avg. Age (std) |
|---|---|---|
| Male | 13 | 34.85 ± 9.89 |
| Female | 3 | 38.33 ± 2.05 |
Data Cleaning:
Given that the E4 is a wrist-worn biosensor, we found the data it collected contained motion artifacts. Therefore, it was necessary to clean the physiological data. Specifically, we used filtering techniques to clean the EDA and BVP data. In order to mitigate noise in the EDA data, two low-pass Butterworth filters were applied to the data. The first low-pass Butterworth filter had a cutoff of 0.2 Hz, and the second low-pass Butterworth filter had a cutoff of 0.05 Hz. The use of this technique for the purpose of noise reduction in EDA data has been shown to be successful in previous research [11]. A band-pass filter was used to limit the impact of noise present in the BVP data. This band-pass filter had a high-pass cutoff of 0.6 Hz, and a low-pass cut off of 3.33 Hz. These lower and upper frequencies are used to limit the possible heart rates that could appear in this data to a range of 40-200 beats per minute (BPM). This heart rate range accounts for both the upper and low extremes of heart rates that could occur for an individual [16]. Figure 2 shows an example of how the two-low pass Butterworth filters applied to the EDA data helped mitigate motion artifacts.
Figure 2.
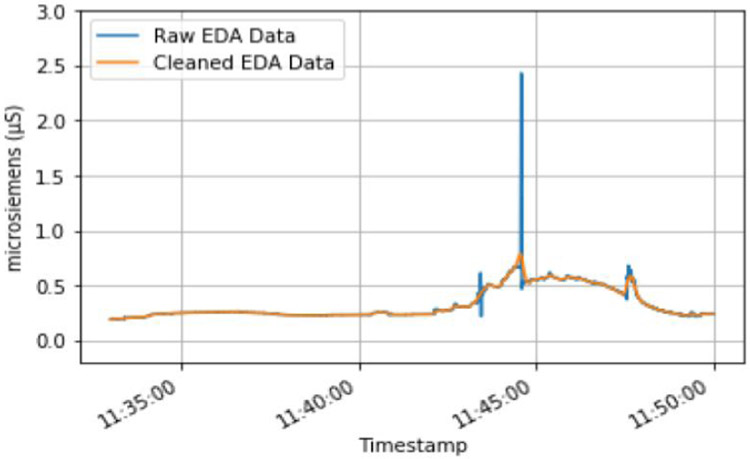
Example of two low-pass Butterworth filters being used to clean a subjects EDA data.
The accelerometer data did not undergo any data cleaning in order to maintain acute movements that may be related to opioid withdrawal symptoms. No data cleaning was performed on the skin temperature data, however an inspection of the skin temperature data revealed that some skin temperature readings were too low to be compatible with life and therefore were considered erroneous. The sections of data containing abnormally low skin temperature readings were not included in our analysis.
Dataset Windowing
After cleaning the data, each subjects data is then broken up into one minute non-overlapping windows. We decided to use one minute non-overlapping windows because this window-size has been used in previous research related to classifying stress using machine learning [11]. As previously mentioned, opioid withdrawal symptoms can be conceptualized as being similar to symptoms of stress [10].
The one minute segments that were assessed to be in the withdrawal state are placed into one dataset (the universal withdrawal set), and the one minute segments that were assessed to be in the intoxicated or neutral state were placed into a separate dataset (the universal non-withdrawal set) (see Figure 3). Once all patient data was placed into either the universal withdrawal or universal non-withdrawal dataset, the feature extraction process was performed.
Figure 3.
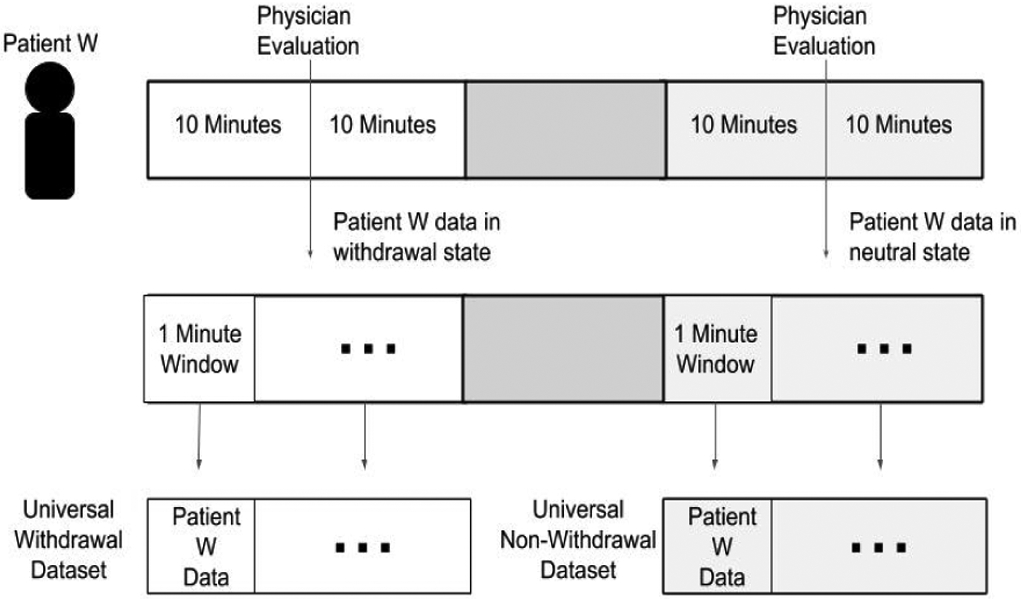
Example of how subject data is windowed and placed into either the universal withdrawal dataset or universal non-withdrawal dataset.
4.1. Feature Extraction
Once the data in the universal withdrawal and universal non-withdrawal dataset has been broken up into one minute window, we can then generate feature vectors from each window. The features extracted for this analysis are inspired by the work of stress classification [11] [12].
There are a total of 66 features extracted from each one minute window during feature extraction. These 66 features form a feature-vector that is then labeled as belonging to a positive or negative class. The positive class feature-vectors are derived from data collected in the withdrawal state and negative class feature-vectors are derived from data collected in the intoxicated or neutral states. The positive and negative class points are detailed further in Section 4.2.
The features extracted from the EDA, BVP, skin temperature, and triaxial accelerometer data are described in Table 2.
Table 2.
Features extracted from each datatype collected by the Empatica E4
| Datatype | Features Extracted |
|---|---|
| EDA | mean, mean derivative, standard deviation, number of peaks, mean prominence, mean width between peaks, dot product of the peak width and prominence, number of strong peaks, 20th percentile, quartile, 80th percentile |
| BVP | mean inter-beat interval (IBI), IBI standard deviation, root mean square, total power of IBI, low frequency power of IBI, high frequency power of IBI, normalized low frequency power of IBI, normalized high frequency power of IBI, low frequency power to high frequency power ratio of IBI, number of peaks, mean amplitude, standard deviation of amplitude, square average, percent of IBI greater than 50 milliseconds. |
| Triaxial Accelerometer (x, y, z) | total power, mean absolute difference of the norm, mean derivative, mean, median, skew, variance, standard deviation, maximum, minimum, interquartile range, zero crossing rate, kurtosis |
| Skin Temperature | mean, mean derivative |
In total, there are 11 features extracted from the EDA data, 14 features extracted from the BVP data, 13 different features extracted from each axes (x, y, z) of the triaxial accelerometer data (39 in total), and 2 features extracted from the skin temperature data.
4.1.1. Separability of Features
Prior to detailing how we used these features to train our models, we will provide an intuition for why these features may help a model to distinguish between the withdrawal and non-withdrawal states. We do this by plotting a pair of features for each class point in our analysis: one feature on the x-axis, and one feature on the y-axis.
In Figure 4, we show a pair of features that highlight the separability of the positive and negative class points. Here, we show the mean inter-beat interval feature plotted against the mean EDA feature for each class point. The mean EDA is a measurement of the average conductivity level of the skin [17]. The higher the conductivity level of the skin or EDA, the more a person is sweating [17]. The mean inter-beat interval is the average amount of time, in milliseconds, between heart beats [18]. Although there is quite a bit of overlap between withdrawal class and non-withdrawal class samples at low values of the mean EDA (between 0 and 0.25 microsiemens), the majority of non-withdrawal points have a lower EDA, and higher inter-beat interval. This is what one would expect to see. When a person is not in withdrawal they are less sweaty and their heart is not beating very fast. The opposite is however true, generally speaking, when one is in withdrawal.
Figure 4.
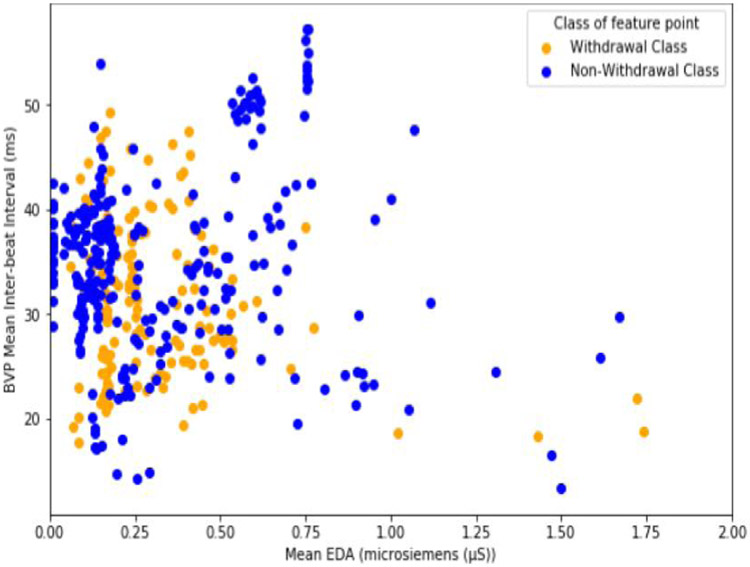
Comparison of the mean inter-beat interval and EDA mean values for each class point.
Specifically, about 40% of non-withdrawal class points have an EDA below 0.15 microsiemens, compared to only 13% of withdrawal class points. At the same time, over 70% of withdrawal class points have an inter-beat interval below 35 milliseconds, compared to only 50% of the non-withdrawal points. A low inter-beat interval (or faster heart rate), and a higher average EDA (sweatiness) are exactly what scales like the COWS expect to find in a patient experiencing opioid withdrawl [9].
4.2. Training and Detection
Once we have the dataset and know which features to extract, the next step is to build the opioid withdrawal detection model. Our detection model uses a machine learning-based classifier to address our principal question. Our classifier learns the uniqueness of the EDA, accelerometer, temperature, and BVP data (collected using the wearable biosensor) for the OUD subjects withdrawal state. Once the model is built, any newly received EDA, accelerometer, temperature, and BVP data snippet which matches the models understanding of the withdrawal state will be classified as such. Our detection approach has two phases: the training phase, and the detection phase.
Training Phase:
The goal of the training phase is to develop a machine-learning model (specifically, a binary classifier) for identifying opioid withdrawal, where our model needs to be able to recognize the withdrawal state from a variety of non-withdrawal states. In order to do this, we must first label the subject’s data into one of two different classes. (1) Positive Class: The positive class consists of all 66-point feature vectors from the six different subjects whose data were assessed to be in the withdrawal state. (2) Negative Class: The negative class consists of all 66-point feature vectors from the 12 different subjects whose data were assessed to be in the non-withdrawal state. In our study, the non-withdrawal class refers to subject data assessed in the neutral and intoxicated states. These two physiological states are lumped together into the non-withdrawal state because the primary goal of our analysis is to evaluate how well a machine-learning classifier can distinguish the withdrawal state from other physiological states found in our subjects population. Two subjects have data in both the withdrawal and neutral state, and therefore their appropriate portions of data appears in both positive and negative class points.
Testing Phase:
Once the machine learning model is trained, it is now able to classify whether a 66-point feature vector, derived from a never before seen one minute snippet of EDA, accelerometer, temperature, and BVP measurements, belongs to the withdrawal or non-withdrawal state. Since we are performing binary classification (withdrawal vs. non-withdrawal), our classifier typically returns a confidence value from 0 to 1, with 1 indicating that the model has full confidence that the unseen snippet belongs withdrawal state, and with 0 indicating full confidence that the point belongs to the non-withdrawal state. We are then able to decide whether to accept or reject that value depending on whether or not it meets a chosen threshold between 0 and 1. A diagram of our withdrawal detection approach is shown in Figure 5. Since we are using a one minute window, our model requires one minute of data to be collected by a wearable biosensor before it can classify whether that person is in the withdrawal or non-withdrawal state.
Figure 5.
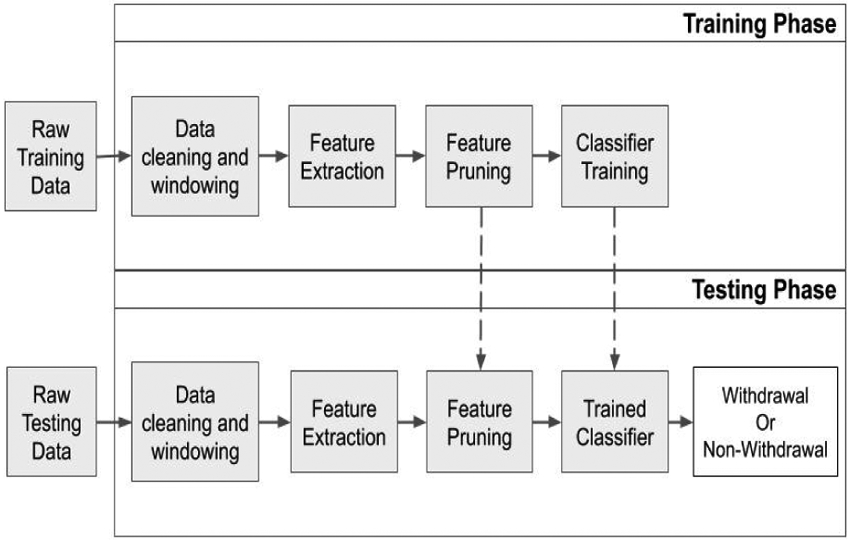
Overview of training and testing approach for developing a machine-learning model to identify opioid withdrawal.
5. Evaluation
Given that the subjects in our dataset were examined by clinicians intermittently (every 30 minutes to an hour), we do not have the ground-truth about the subject’s health state at all times. Consequently, we curate the biosensor data collected from the 16 subjects by only extracting subject data where we are reasonably confident of their health state (i.e., neutral, intoxicated or withdrawal). Only this curated data is used for training our detection models and evaluating their efficacy. In this section, we describe our dataset curation process, the datasets use in training and evaluating withdrawal detection, and our evaluation metrics.
5.1. Data Curation
In total, we used data from 16 different subjects in this study. Each subject had their physiological data collected anywhere from 30 minutes up to several hours. Of these 16 different subjects, only 6 had withdrawal symptoms assessed by clinicians. One of the 6 subjects that had data in the withdrawal state, one also had usable data assessed in the neutral state. The remaining 10 subjects had data assessed in the neutral state, intoxicated state, or both.
A total of 20 minutes were extracted from the wearable biosensor data surrounding the time when the clinicians assessed the subject’s state. The 20 minutes of data is comprised of the 10 minutes before and the 10 minutes after the evaluation happened. We used these 20 minutes of data because, being in the controlled environment of the hospital, it is unlikely a subject’s physiological state would change drastically during this time period.
To be able to train the classifier to detect withdrawal, we have to compensate for the idiosyncrasies in our curated dataset that originated from our data collection protocol. In order to train our classifier, we first generate the positive and negative class points (as described in Section 4.2) and then shuffle them. We then use the first 80% of the feature points for training. This allowed us to train our classifier and still have some (previously unseen by the model during training) data leftover (20%) to test its performance.
5.2. Metrics
Before we go into the details of training and testing the ML models, we give a short overview of the metrics we use to evaluate the efficacy of our models. As our model will classify each input example as either withdrawal (positive class) or non-withdrawal (negative class), the result from inference will fall into one of four categories. (1) True Positive (TP): A correct prediction of the positive class. (2) False Negative (FN): An incorrect prediction of the positive class. (3) True Negative (TN): A correct prediction of the negative class. (4) False Positive (FP): An incorrect prediction of the negative class. After performing inference on all input examples, we will use the number of examples in each of these four categories to calculate our models true positive rate (TPR), and false positive rate (FPR).
TPR is the ratio of how many positive class points were predicted correctly compared to the total number of positive class points [19]. FPR, on the other hand, is the ratio of how many negative class points were predicted incorrectly compared to the total number of negative class points [19]. The TPR and FPR for a model can be used to plot a receiver operating curve (ROC). The ROC curve demonstrates how well a model classifies positive points, compared to how poor it is at classifying negative points [19]. From the ROC curve, the area under the curve (AUC) can be calculated to allow us to compare one machine learning model to another. The ROC AUC is the metric that we use to measure how accurately our models can identify the withdrawal class samples. The ideal ROC curve should have an AUC value that is close to 1 (perfect classification of both positive and negative class points). The ROC AUC will be the metric we will attempt to maximize during the training and testing processes.
5.3. Model Training
Once the dataset has been cleaned, the features extracted, and the training and test sets created, we can begin developing models to identify opioid withdrawal. We trained four different machine-learning classifiers to identify opioid withdrawal. The classifiers use all 66 features extracted from the wearable biosensor data to learn what distinguishes the withdrawal state from the non-withdrawal (neutral or intoxicated) state. The four machine-learning (ML) algorithms developed in this training phase are: Random Forest, Decision Tree, Logistic Regression, Support Vector Machine.
In order to handle the class imbalance in the data, two separate approaches were taken. These two approaches are Synthetic Minority Oversampling Technique (SMOTE) and Exactly Balanced Bagging (EBBag). The SMOTE technique samples a point p from the minority class, and randomly creates a new point that is between p and its r closest neighbors [19]. This is done until the positive class and negative class have an equal amount of examples. This technique has been found to be very effective for handling class imbalances [19]. EBBag is an ensemble training method that involves training more than one instance of a classifier on randomly under-sampled sets (without replacement) of the majority class that match the number of samples in the minority class [20]. In our ensemble model, a given feature vector is classified as the positive class if the average confidence value of the two models is 50% or greater, and the negative class if otherwise.
Further, in order to improve our models we pruned the feature set. The purpose of doing this is to find a minimal feature set which maximizes a models ability to identify the withdrawal state. The feature pruning process is done by starting with an empty set of features for a particular model, and at each stage adding the feature to its feature set which maximizes its ability to accurately identify withdrawal class samples during cross-validation. If all of the 66 extracted features are in the models feature set, or there are no features left which improve the models ability to accurately identify the withdrawal class samples, then the process ends. A minimal feature set is identified for each model using both of the techniques for handling the class imbalance (SMOTE, EBBag). Tables 3 and 4 show the reduced/pruned features list using SMOTE and EBBag to balance the classes, respectively.
Table 3.
Feature pruning results using SMOTE
| Model | Pruned Feature Set |
|---|---|
| Random Forest | mean skin temperature, EDA mean, x-axis median, y-axis interquartile range, z-axis interquartile range |
| Decision Tree | mean skin temperature, EDA 20th percentile, EDA mean, z-axis median |
| Logistic Regression | mean skin temperature, EDA peaks, EDA mean, x-axis total power, y-axis interquartile range, y-axis zero crossing rate, y-axis minimum, y-axis skew |
| Support Vector Machine | mean skin temperature, EDA 20th percentile, y-axis median, z-axis mean |
Table 4.
Feature Pruning Results Using EBBag
| Model | Pruned Feature Set |
|---|---|
| Random Forest | mean skin temperature, mean EDA, BVP Root Mean Square, x-axis median, y-axis minimum, BVP mean IBI |
| Decision Tree | mean skin temperature, mean EDA, x-axis median, z-axis maximum, EDA 20th percentile |
| Logistic Regression | mean skin temperature, mean EDA, number of EDA peaks, y-axis median, x-axis mean average derivative, x-axis total power, number of BVP peaks, z-axis zero-crossing rate, y-axis variance |
| Support Vector Machine | mean skin temperature, EDA number of peaks, EDA 20th percentile, y-axis maximum, z-axis median, BVP root mean square |
The results of the training phase will help determine which model (and its associated pruned feature set) for each class imbalance technique had the highest ROC AUC during training. The best model for each class imbalance technique will then be evaluated in the testing phase.
Training using SMOTE:
Here, we use all 66 features to build our models using our four chosen ML algorithms using SMOTE to compensate for the class imbalance. Figure 6 shows the results when all features are used. We find that the Random Forest (RF) performs the best with a near perfect classification accuracy (AUC = 0.9887). The other algorithms do not perform as well. Next, we used the feature pruning algorithm to find the minimal feature set which maximizes classifier accuracy. Using these pruned feature sets, we find that the performance of the all of the algorithms except for the Decision Tree algorithms remain more or less the same. The Decision Tree algorithm saw improvements from an AUC of 0.8920 using all features, to an AUC of 0.9425 using the pruned feature set (see Figure 7).
Figure 6.
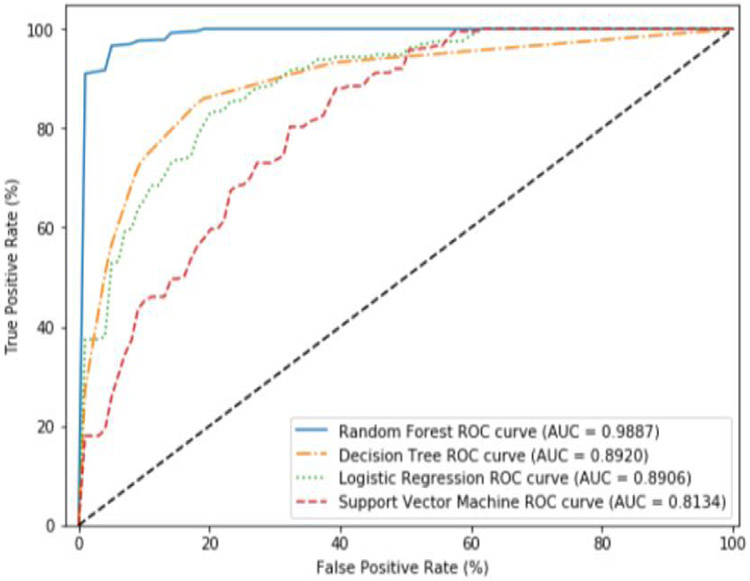
Average ROC curves and AUC obtained during cross validation for SMOTE using all features.
Figure 7.
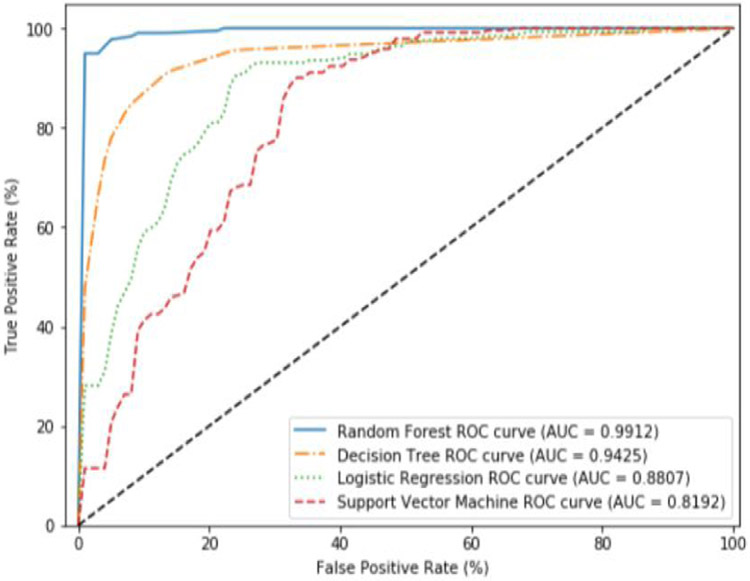
Average ROC curves and AUC obtained during cross validation for SMOTE using the pruned features.
Training using EBBag:
Here, we use all the 66 features to build our models using our four chosen ML algorithms with EBBag being used to compensate for the class imbalance. Figure 8 shows the results when all features are used. We find that the Random Forest (RF) performs the best (AUC = 0.9666). Though the Random Forest algorithm performed well using EBBag, compared to SMOTE, the AUC for all algorithms was worse than when using SMOTE. Next, we used the feature pruning algorithm to find the minimal feature set which maximizes classifier accuracy. Unlike SMOTE, using these pruned feature sets noticeably improves the performance of the four algorithms. After using the feature pruning algorithm, the Random Forest (RF) and Decision Tree (DT) algorithms performed similarly to the results obtained using SMOTE (see Figure 9).
Figure 8.
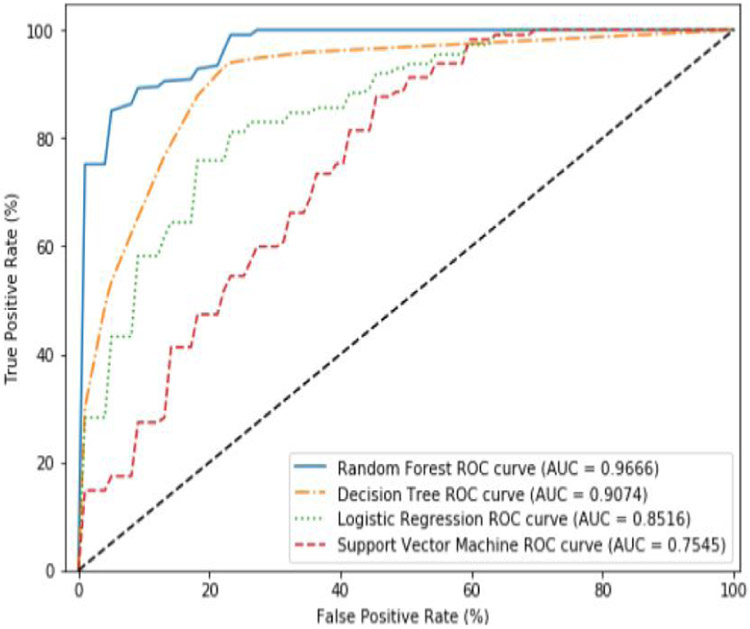
Average ROC curves and AUC obtained during cross validation for EBBag using all features.
Figure 9.
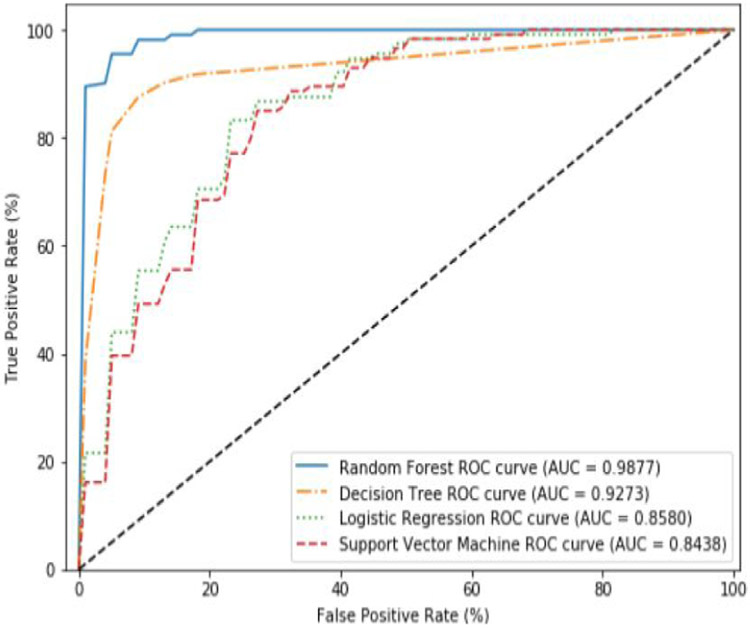
Average ROC curves and AUC obtained during cross validation for EBBag using the pruned features.
In both these example we found that RF was the best performing algorithms. Since the RF algorithm was the top performer using both class imbalance techniques, we chose to use these two models in the testing phase.
5.4. Model testing
Now that we have our RF-based withdrawal detection model, we can evaluate it using the test set that consists of 20% of unseen data from the entire dataset. The results from evaluating the RF-based withdrawal detection models using the test set demonstrates how well the models can generalize to unseen data.
The following testing results were obtained using both the EBBag and SMOTE class imbalance methods. Figure 10 shows the ROC curve and ROC AUC obtained with the RF-based withdrawal detection model during testing using the SMOTE and EBBag methods.
Figure 10.
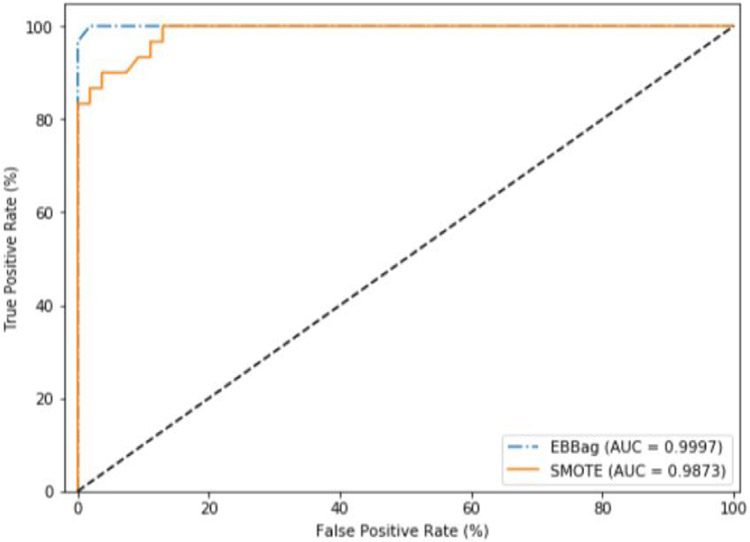
ROC curves and AUC obtained during testing phase (using 20% of unseen data from our dataset) with Random Forest using SMOTE and EBBag.
The RF-based withdrawal detection model using EBBag obtain an AUC of 0.9997, while the model using SMOTE obtain a slightly lower AUC of 0.9873. We believe the Random Forest model (for both class imbalance techniques) leverages the difference between the positive and negative class points for the features in its pruned feature set (as demonstrated in 4.1.1).
Although the results obtained in testing are very good, they need to be understood in context. Given that this is a new area of research and the general dearth of datasets for this work, we have had to work with a small dataset. We have thus demonstrated through our training and testing process that using ML classifiers for detecting opioid withdrawal (in near real-time; one minute) from wearable biosensor data is viable. Given that this the first work in this area, we believe this is an important contribution. That being said, we do not claim to have produced generalizable classifiers for this particular task.
6. Limitations
The results of this study show that there is promise in using wearable biosensors to identify opioid withdrawal. However, there are two major limitations in our work that need to be addressed in future work.
The first major limitation of this study is the small amount of opioid withdrawal state data that we had access to. This is in large part due to that fact that collecting this type of data is subject to if and when an OUD patient experiences opioid withdrawal symptoms. For the data that was able to be collected from OUD patients experiencing withdrawal in this study, there were issues with noise in the data that may have rendered portions of it to be unusable in this analysis.
The second limitation of this study is that we only collected data in a hospital setting that represents naloxone induced opioid withdrawal. The symptoms of a precipitated withdrawal onset by naloxone will be abrupt, shorter, and possibly more extreme than the spontaneous withdrawal that occurs when opioid use is reduced or stopped altogether [21]. Therefore, these results may not generalize well to detecting spontaneous opioid withdrawal.
7. Conclusions and Future Work
In this study, we proposed a method for developing a set of machine learning models to identify opioid withdrawal using data collected from a wearable biosensor. We found through our training and testing procedures that the Random Forest model produced the best results. The test accuracy using this model was nearly perfect (ROC AUC=0.9997). Further, the model is able to detect withdrawal with just one minute of biosensor data. However, these results have to be understood in context. We have only demonstrated the viability of our methodology and have not produced a generalizable classifier for this particular task.
In the future, we plan to improve upon this work in two different ways. (1) We plan to collect additional data from OUD patients experiencing naloxone induced withdrawal symptoms. The increase in data will help to address the issue of model generalizability. (2) Similarly, data will also be collected inside and outside of the hospital setting from OUD patients experiencing spontaneous withdrawal symptoms onset from discontinuing or limiting their opioid use. This data would allow us to understand how well a model built to detect naloxone induced withdrawal symptoms can generalize to spontaneous withdrawal symptoms. It would also enable us to study building a model to identify spontaneous withdrawal symptoms, or both precipitated and spontaneous withdrawal symptoms.
7.1. Acknowledgements
This work was supported by National Institutes of Health/National Institute on Drug Abuse, grant number K23DA045242 (Carreiro).
Footnotes
Naloxone is an antidote that is given to someone who is overdosing on opioids. It immediately reverses the effect of opioids by competitively binding to the opioid receptors in the body
Contributor Information
Ethan Kulman, University of Rhode Island.
Brittany Chapman, University of Massachusetts Medical School.
Krishna Venkatasubramanian, University of Rhode Island.
Stephanie Carreiro, University of Massachusetts Medical School.
References
- [1].“CDC’s efforts to prevent opioid overdoses and other opioid-related harms,” Nov 2019. [Google Scholar]
- [2].Bailey GL, Herman DS, and Stein MD, “Perceived relapse risk and desire for medication assisted treatment among persons seeking inpatient opiate detoxification,” Journal of substance abuse treatment, vol. 45, no. 3, pp. 302–305, 2013. [DOI] [PMC free article] [PubMed] [Google Scholar]
- [3].Nuamah JK, Sasangohar F, Erranguntla M, and Mehta RK, “The past, present and future of opioid withdrawal assessment: a scoping review of scales and technologies,” BMC medical informatics and decision making, vol. 19, no. 1, p. 113, 2019. [DOI] [PMC free article] [PubMed] [Google Scholar]
- [4].Chalana H, Kundal T, Gupta V, and Malhari AS, “Predictors of relapse after inpatient opioid detoxification during 1-year follow-up,” Journal of addiction, vol. 2016, 2016. [DOI] [PMC free article] [PubMed] [Google Scholar]
- [5].Guk K, Han G, Lim J, Jeong K, Kang T, Lim E-K, and Jung J, “Evolution of wearable devices with real-time disease monitoring for personalized healthcare,” Nanomaterials, vol. 9, no. 6, p. 813, 2019. [DOI] [PMC free article] [PubMed] [Google Scholar]
- [6].Mahmud MS, Fang H, Wang H, Carreiro S, and Boyer E, “Automatic detection of opioid intake using wearable biosensor,” in 2018 International Conference on Computing, Networking and Communications (ICNC), pp. 784–788, IEEE, 2018. [DOI] [PMC free article] [PubMed] [Google Scholar]
- [7].Carreiro S, Wittbold K, Indic P, Fang H, Zhang J, and Boyer EW, “Wearable biosensors to detect physiologic change during opioid use,” Journal of medical toxicology, vol. 12, no. 3, pp. 255–262, 2016. [DOI] [PMC free article] [PubMed] [Google Scholar]
- [8].Singh R, Lewis B, Chapman B, Carreiro S, and Venkatasubramanian K, “A machine learning-based approach for collaborative non-adherence detection during opioid abuse surveillance using a wearable biosensor,” in Biomedical engineering systems and technologies, international joint conference, BIOSTEC… revised selected papers. BIOSTEC (Conference), vol. 5, p. 310, NIH Public Access, 2019. [DOI] [PMC free article] [PubMed] [Google Scholar]
- [9].Wesson DR and Ling W, “The clinical opiate withdrawal scale (cows),” Journal of psychoactive drugs, vol. 35, no. 2, pp. 253–259, 2003. [DOI] [PubMed] [Google Scholar]
- [10].Chartoff EH and Carlezon WA Jr, “Drug withdrawal conceptualized as a stressor,” Behavioural pharmacology, vol. 25, p. 473, 2014. [DOI] [PMC free article] [PubMed] [Google Scholar]
- [11].Vila G, Godin C, Sakri O, Labyt E, Vidal A, Charbonnier S, Ollander S, and Campagne A, “Real-time monitoring of passenger’s psychological stress,” Future Internet, vol. 11, no. 5, p. 102, 2019. [Google Scholar]
- [12].Can YS, Chalabianloo N, Ekiz D, and Ersoy C, “Continuous stress detection using wearable sensors in real life: Algorithmic programming contest case study,” Sensors, vol. 19, no. 8, p. 1849, 2019. [DOI] [PMC free article] [PubMed] [Google Scholar]
- [13].Carreiro S, Chintha KK, Shrestha S, Chapman B, Smelson D, and Indic P, “Wearable sensor-based detection of stress and craving in patients during treatment for substance use disorder: A mixed methods pilot study,” Drug and Alcohol Dependence, p. 107929, 2020. [DOI] [PMC free article] [PubMed] [Google Scholar]
- [14].Carreiro S, Smelson D, Ranney M, Horvath KJ, Picard RW, Boudreaux ED, Hayes R, and Boyer EW, “Real-time mobile detection of drug use with wearable biosensors: a pilot study,” Journal of Medical Toxicology, vol. 11, no. 1, pp. 73–79, 2015. [DOI] [PMC free article] [PubMed] [Google Scholar]
- [15].Chintha KK, Indic P, Chapman B, Boyer EW, and Carreiro S, “Wearable biosensors to evaluate recurrent opioid toxicity after naloxone administration: a hilbert transform approach,” in Proceedings of the… Annual Hawaii International Conference on System Sciences. Annual Hawaii International Conference on System Sciences, vol. 2018, p. 3247, NIH Public Access, 2018. [PMC free article] [PubMed] [Google Scholar]
- [16].Tanaka H, Monahan KD, and Seals DR, “Age-predicted maximal heart rate revisited,” Journal of the american college of cardiology, vol. 37, no. 1, pp. 153–156, 2001. [DOI] [PubMed] [Google Scholar]
- [17].Posada-Quintero HF and Chon KH, “Innovations in electrodermal activity data collection and signal processing: A systematic review,” Sensors, vol. 20, no. 2, p. 479, 2020. [DOI] [PMC free article] [PubMed] [Google Scholar]
- [18].Shaffer F and Ginsberg J, “An overview of heart rate variability metrics and norms,” Frontiers in public health, vol. 5, p. 258, 2017. [DOI] [PMC free article] [PubMed] [Google Scholar]
- [19].Tharwat A, “Classification assessment methods,” Applied Computing and Informatics, 2018. [Google Scholar]
- [20].Błaszczyński J, Stefanowski J, and Idkowiak Ł, “Extending bagging for imbalanced data,” in Proceedings of the 8th International Conference on Computer Recognition Systems CORES 2013, pp. 269–278, Springer, 2013. [Google Scholar]
- [21].Kleber HD, “Pharmacologic treatments for opioid dependence: detoxification and maintenance options,” Dialogues in clinical neuroscience, vol. 9, no. 4, p. 455, 2007. [DOI] [PMC free article] [PubMed] [Google Scholar]


