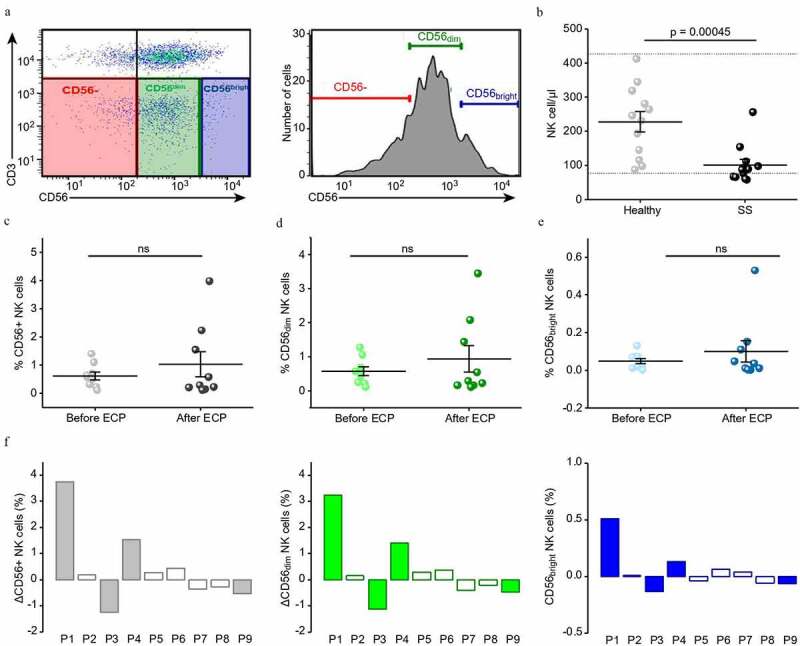
Figure 1.

NK cell numbers are reduced in SS compared to healthy and show a tendency of recovery after ECP treatment
(a) Representative FACS plot (left) and histogram (right) illustrating the gating strategy on CD3 (y-axis) and CD56 (x-axis) for CD3−/CD56+dim and CD3−/CD56+bright NK cells. (b) Dot plot showing the number of NK cells per µl whole blood for healthy individuals (Healthy, n = 12) and Sézary patients (SS, n = 12). (c-e) Dot plots depicting the percentage of NK cells in Sézary patients before and after ECP (both groups n = 9), ns = not significant. c) for total CD56+ NK cells (d) for CD56+dim NK cells (e) for CD56+bright NK cells. (f) Bar plots depicting the relative changes in NK cells for individual Sézary patients before and after ECP treatment, total CD56+ NK cells (gray), CD56+dim NK cells (green), CD56+bright NK cells (blue). Patients with clinical response to treatment are shown as filled bars, those without as empty bars.
