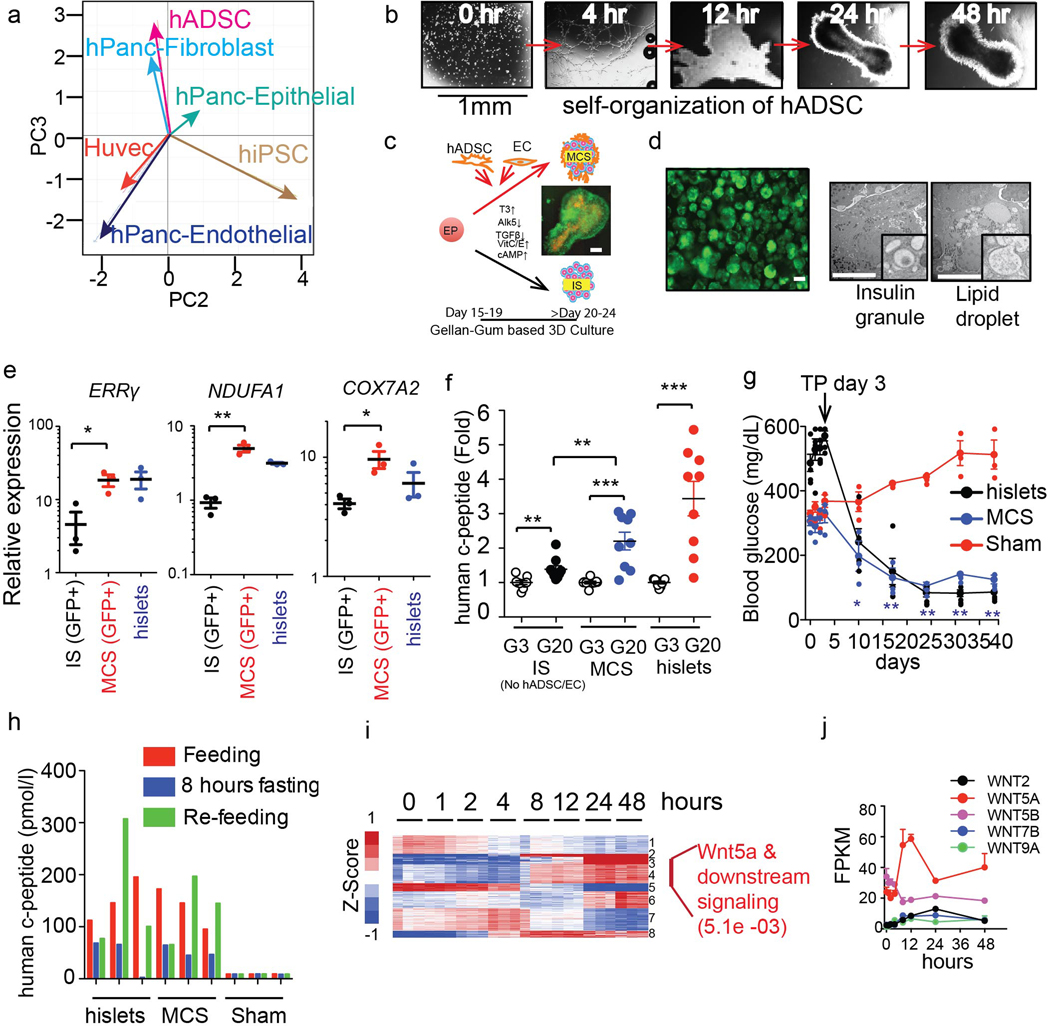
Extended Data Fig. 1. Cellular crosstalk drives functional maturation of hiPSC-derived β-like cells.
a, Principal Component analysis of transcriptomes from human iPSCs (hiPSCs), primary human pancreatic epithelial cells (hPanc Epithelial), human adipose-derived stem cells (hADSCs), human pancreatic fibroblasts (hPanc Fibroblast), human umbilical vein endothelial cells (HUVECs) and human pancreatic microvascular endothelial cells (hPanc Endothelial) (n=3) b, Time course of human adipose-derived stem cell (hADSC) culture in Matrigel (1:1 dilution in hADSC media, 2 million cells in 300μl) showing intrinsic self-organization. Scale bar 1mm. c, Schematic for multi cellular islet-like spheroids (MCS) and islet-like spheroid (IS) generation. hiPSC-derived endocrine progenitor (EP) were co-cultured with hADSC and endothelial cells (EC, HUVECs) in gellan gum-based 3D culture system (left). MCS generated in Matrigel showing the incorporation of ECs (Lentivirus-mCherry expression) and insulin expression (Lentivirus-GFP, right). Scale bar 100 μm. d, MCS cultured in 3D gellan gum system showing insulin expression (Lentivirus-GFP, upper panel). Electron microscopy images of MCS showing insulin granules (lower right) and lipid droplets in hADSC (lower right). e, Gene expression in sorted insulin-expressing cells (GFP+) from IS, MCS, or human islets (hislets) (n=3) f, Human c-peptide secretion in response to 3mM (G3) or 20 mM (G20) glucose from IS, MCS and hislets (n=9) g, Random fed blood glucose levels in STZ-induced diabetic NOD-SCID mice after sham treatment or transplantation of MCS (500) or human islets (n=3, 3 and 5 respectively). h, Serum human c-peptide levels during feeding, fasting, and refeeding cycles in mice 4 weeks after transplantation (n=3 per group). i, Heatmap of expression changes during hADSC culture in Matrigel (left). Most significantly affected gene ontology category in indicated gene clusters (right) (n=3) j, Temporal expression of WNTs during hADSC self organization shown in (b) (n=3) Error bars represent ± SEM. *p<0.05, **p<0.01, ***p<0.001, one-tailed, student’s paired t test. Data representative of 3 independent experiments (b, d, e, f, g) or experimental triplicates (a, h, i, j).

